1. Introduction
The severity of the current economic crisis, that many associate with the pandemic outbreak, is generally affecting all countries throughout the world. This fact justifies the call for the establishment of a new (world) economic order. Indeed, (an important) part of that severity can be attributed to the lack of knowledge (or, at the minimum, non-acknowledgement) of the relationships that are established between the main economic variables, both at the real and monetary levels. From this point of view, the success of a new economic order depends on the (a)knowledge(ment) of these relationships, namely those that involve, in particular, the level of confidence and the unemployment rate, given the characteristics of the current economic crisis; see
van Giesen and Pieters (
2019) for further information on these characteristics. In fact, it is to be expected that there will be a self-reinforcement mechanism of increases in unemployment rates and falls in the level of confidence, which needs to be broken.
Since the unemployment rate should be viewed as an explanatory factor of the level of consumer confidence, this fact can confirm, or reinforce, the causal relationship that, allegedly, exists between unemployment and economic growth (see
Mourougane and Roma (
2003);
Rodríguez-Caballero and Vera-Valdés (
2020); and/or
Sorić et al. (
2020)): unemployment affects the confidence level and this, in turn, eventually through expectations, affects spending and then economic growth. As the current crisis is already confirming, the causal relationship between the levels of unemployment and economic growth (which is, in fact, of a bidirectional nature) is particularly critical in certain countries, namely the one that will serve as a case study.
As has been known for a long time, the low level of economic growth presents itself as a problem whose need for resolution, in the aftermath of the current crisis, is going to be particularly evident in some countries, namely Portugal. In light of well-established policy recommendations, this problem will require solutions resulting from structural changes, including some at an institutional level, in which the supply side of the economy plays a crucial role; for more information, see
European Commission (
2004). For instance, regarding the European Union (EU), the Economic Policy Committee, even before the occurrence of the financial crisis of 2007–2008, recommended, as a priority structural reform, a strong promotion of economic growth strategies through stimulus to productivity and employment rates, in an environment of sustainable fiscal policies; for more information, see Economic Policy
Committee (
2004,
2005).
In that economic policy approach, the supply side is obviously crucial, but it must also be acknowledged that structural supply policies cannot ignore the influence, whether negative or positive, that the demand side has on their outcomes, especially through the role of expectations that some of its component variables involve. This is, of course, the case for confidence indicators (for example, for consumers or investors), which, by their very nature (
Delorme et al. 2001), are considered to be advanced indicators of the business cycle, because they prove to be partially explanatory of current expenses (
Kwan and Cotsomitis 2006); (
Kłopocka 2017); (
Karasoy Can and Yüncüler 2018), with subsequent multiplier effects. As a confirmation of this fact, consumer surveys suggest that the consumer confidence indicator has “become an indispensable tool for monitoring the evolution of the EU and the euro area economies, as well as monitoring developments in the applicant countries” (in
https://ec.europa.eu/info/business-economy-euro/indicators-statistics/economic-databases/business-and-consumer-surveys_en; accessed on 2 March 2021); see also
Bechtel et al. (
1993); and
European Commission (
2000,
2016).
In line with what has been said above, the confidence indicators of economic agents, in particular consumers, are relevant variables in the attempt to solve all the expected economic problems that the current pandemic outbreak is causing. Therefore, it is also pertinent to determine the variables that are important in explaining the evolution of those indicators. Thus, the objective of this article is to verify the extent to which the unemployment rate can be used to correctly classify the evolution of the level of confidence (of consumers, in Portugal). For this, classification and regression trees are used, which, as far as we know, have not yet been considered in the literature on the subject. Thus, this article intends to be of a methodological nature, which is the main added value it provides to the existing knowledge on the subject.
The rest of the article presents the following structure:
Section 2 offers a review of the literature; in
Section 3, the data and the methodology are presented; the results are given in
Section 4, discussion of which is conducted in
Section 5; the last section is occupied with a summary of the results, with the practical/policy implications of the findings, as well as with the limitations of the study, in terms of the implications at the methodology and/or data that can be considered in future analysis.
2. Literature Review
Since the pair of consumer confidence and unemployment rate is the essential element in this article, it is suitable to carry out a literature review on this duo of variables. Obviously, the literature on unemployment is vast, and it is also true that a large majority would not be needed for this particular study. In turn, the literature on consumer confidence is considerably less extensive, which is reviewed below, in particular focusing on the relationship with the unemployment rate. See
Mueller (
1966) for the seminal study on the impact of unemployment on consumer confidence.
Due to their prospective nature, confidence indicators were the focus of attention in the literature, with regard to their ability to forecast the evolution of economic activity (see
Matsusaka and Sbordone (
1995);
Taylor and McNabb (
2007); and/or
Demirel and Artan (
2017)). For example,
Mourougane and Roma (
2003) found that confidence indicators could be useful for forecasting real GDP growth rates in the short-run in 5 of the 6 EU countries under analysis, i.e., in Belgium, France, Germany, Italy and Holland, but not in Spain.
With regard in particular to consumer confidence indicators, their ability to predict, or contribute to a better forecast of, economic activity and, in particular, consumption and/or savings levels was tested by the literature, which, in general terms, concluded that this is the case. Several countries were considered in these matters: see
Vuchelen (
2004) for the case of Belgium; the case of Canada was analyzed by
Kwan and Cotsomitis (
2006);
Acuña et al. (
2020) considered the case of Chile; the case of Poland was analyzed in
Kłopocka (
2017); whereas
Karasoy Can and Yüncüler (
2018) considered the case of Turkey. Generally speaking, these studies have put the focus on consumer spending behavior given that consumption expenditures are the ones that are to be most important, at the macroeconomic level, for growth and, at the microeconomic level, depend the most on the unemployment status of consumers.
Of particular interest, due to its extent, timeliness and possibility of inferring conclusions for the current crisis, is the study by
Vanlaer et al. (
2020), which considered 18 EU countries over the period 2001–2014. It concluded that confidence in the financial situation of the household itself is more important than confidence in the economic situation in general in determining household savings decisions, with that impact having increased substantially after the 2007–2008 financial crisis. This result agrees with the main findings in
Malovaná et al. (
2021) about the decisions of households to take on credit, based upon their expectations. See also
Ganong and Noel (
2019) for an analysis of spending after the exhaustion of unemployment subsidies, which may occur during or after the occurrence of a severe economic crises, such as the current one.
Interestingly, the ability of consumer confidence indicators to predict the evolution of unemployment was also the target of recent literature. The influence of expectations associated with confidence indicators, that may not even be of a rational nature (
Acemoglu and Scott 1994) (
Harrison 2005), on the level of economic activity was examined—
Utaka (
2003) considers that these expectations had an impact, in the short term, in the Japanese economy, whereas
Pan (
2018) found the same result for Canada—it is plausible to accept that the evolution of unemployment can be anticipated through confidence indicators, as can be seen in
Claveria (
2019).
Regarding the explanatory factors of confidence, the effect of news transmitted by the media on confidence indicators, especially in times of unpleasant events—see
Garner (
2002) for the particular case of 9/11—and mostly associated with serious crises was confirmed by
Alsem et al. (
2008) and
Vliegenthart and Damstra (
2019). For the current article, the studies that prove the particular importance of news about unemployment on the formation of expectations, economic sentiments or confidence levels are of particular interest; see
Garz (
2018) for the case of the federal states of Germany and/or
Sorić et al. (
2019) for the case of the Eurozone.
In a particular strand of the literature on the subject, it has been shown that the level of consumer confidence is related to the unemployment rate much more than would be apparent; see
Ramalho et al. (
2011) for an example examining this. In fact, at first glance, that relationship does not seem to exist since, usually, the unemployment rate shows a clearly cyclical evolution, while the level of consumer confidence, in turn, is usually characterized by an idiosyncratic evolution, i.e., being very volatile.
Caleiro (
2006,
2007) employed a fuzzy logic approach, since, due to its characteristics, has proven to be an appropriate methodology in modeling that relationship. In this article, an alternative methodology, i.e., classification and regression trees, is used.
3. Materials and Methods
The data used in this article, whose source is Eurostat, and which are shown in
Figure 1 and
Figure 2, correspond to the monthly values for the period between January 2000 and December 2020, which makes 252 observations, for the rate of unemployment (seasonally adjusted) and the level of consumer confidence (also seasonally adjusted), in Portugal.
With regard to the data for the confidence indicator, it is important to explain that the choice to use Eurostat data was essentially because it seems coherent with the motivation presented above to use data that the EU itself produces on a subject that, for a long time, has been considered to be relevant at the EU level, i.e., the importance of economic agents’ confidence in the level of growth. This does not mean that there are no other consumer confidence indicators. In fact, in some of the empirical studies in which the countries under analysis are not EU member-states, other indicators have been considered: see
Acuña et al. (
2020);
Karasoy Can and Yüncüler (
2018);
Kwan and Cotsomitis (
2006); and/or
Kłopocka (
2017).
The indicator (in monthly terms) of consumer confidence is calculated by Eurostat as the arithmetic average of the balances (in percentage points) of the answers to questions posed to consumers about the financial situation of their household, the economic situation of the country, prices in consumer goods, unemployment and savings, in terms of the past and predictable situations. For more details, see the annex 2.3 in
European Commission (
2016). A methodological update of the way of computing the consumer confidence indicator took place, as of January 2019; see
European Commission (
2018) for further details.
Regarding the methodology, learning models are to be used. Other methodologies could, in fact, have been chosen. Among these, the multi-criteria analysis, due to its characteristics, would have been an interesting alternative. Intending, however, to continue in the field of bounded rationality—see
Caleiro (
2006) and/or
Caleiro (
2007)—where learning plays a crucial role, we opted for a particular case of that type of (learning) models.
In Economics, learning models have been developed as a reasonable alternative to the unrealistic informational assumption of rational expectations models; see
Evans and Honkapohja (
1995) for a discussion of this. Very recently, the literature has drawn attention to the importance of ‘machine learning’ in Economics, in general, and, in particular, in the progress of economic policies (to overcome crises, such as the current one); see
Athey (
2019); and
Athey and Imbens (
2019) for further information. In this article, a class of machine learning techniques is discussed, namely Classification and Regression Trees (CARTs) (see
Breiman et al. (
1984); and
Sutton (
2005)).
CARTs are often described in graphical terms. Normally, the tree is shown growing from top to bottom, starting at its initial node, i.e., at its root, and ending at the terminal nodes, called leaves. Thus, a given observation goes down the tree through decision rules associated with each node, which indicate the direction to be followed, based on the value of one of the explanatory variables. When a leave is reached, the ‘prediction’ to that observation is provided. Generally, for classification trees, this ‘prediction’ is qualitative, whereas for regression trees, this ‘prediction’ is quantitative. In other words, regression trees are used when the outcome is of a quantitative (continuous) nature, whereas when the outcome is of a qualitative (categorical) nature, classification trees are used.
As mentioned in
Speybroeck (
2012), for this process it is important to take into account that, for categorical variables with
q categories, there are 2
q−1 − 1 possible divisions/splits (in each node), while for quantitative variables, with
v unique values, a split is made for values below (and not below) a certain value, from the
v − 1 possible splits.
To be more specific, classification and regression trees aim to partition the explanatory variables, determining the best decision rules—as in decision trees—in each node, so that the leaves contain results that are as homogeneous as possible or, using the language of trees, with the least possible impurity. Thus, the use of a given decision criterion gives rise to an optimization algorithm, which results in a partition that is binary, since each parent node gives rise to two child nodes, and recursive, since each child node is made a parent node, unless it is a terminal one, i.e., being a leaf. This ensures that each of the two child nodes is characterized by greater homogeneity (purity) than the parent node that gave rise to them.
A more formalized approach to this problem can be found in
Loh (
2011). As in a learning problem, let us suppose that for a variable of interest, Y, there is a training sample of
n observations, which may assume values 1, 2, …,
k, as well as
p predictor variables
X1, …,
Xp. The objective is finding a model allowing the ‘prediction’ of
Y from
X. This is accomplished by partitioning the
X space into
k disjoint sets,
A1, …,
Ak, such that the predicted
Y, which may be a value or a category, is
j if
X belongs to
Aj, for
j = 1, …,
k. In the particular case of CART methods, these produce rectangular sets by recursively partitioning one
X variable at a time in a binary way.
As mentioned, the division rules (in each node) were determined in order to minimize the impurity of each node. Due to the distinct nature of the two types of trees, the criteria used to maximize homogeneity (or, to minimize impurity) are different; see
Moisen (
2008) for further details. For classification trees, the following criteria can be used: misclassification error; Gini index; Entropy index. For regression trees, the following criteria can be used: Least squares; Least absolute deviations.
The use of these criteria, accompanied by a stopping rule—for example, a predetermined number of leaves or an improvement in the objective function smaller than a certain threshold—gives rise to the final tree, which should not have as many terminal nodes, i.e., leaves, as the number of observations.
4. Results
This section presents the results of the application of the methodology in the regression and classification of the level of consumer confidence, according to the unemployment rate. To this end, the R package ‘tree’ provided by
Ripley (
2019) was used.
4.1. Regression Trees
Starting with the default for the minimum deviation, the tree corresponding to the formula = confidence~unemployment has 5 terminal nodes; see
Figure 3. Concerning the residuals, its mean deviance is 55.98 = 13,830/247, whereas its distribution is given in
Table 1.
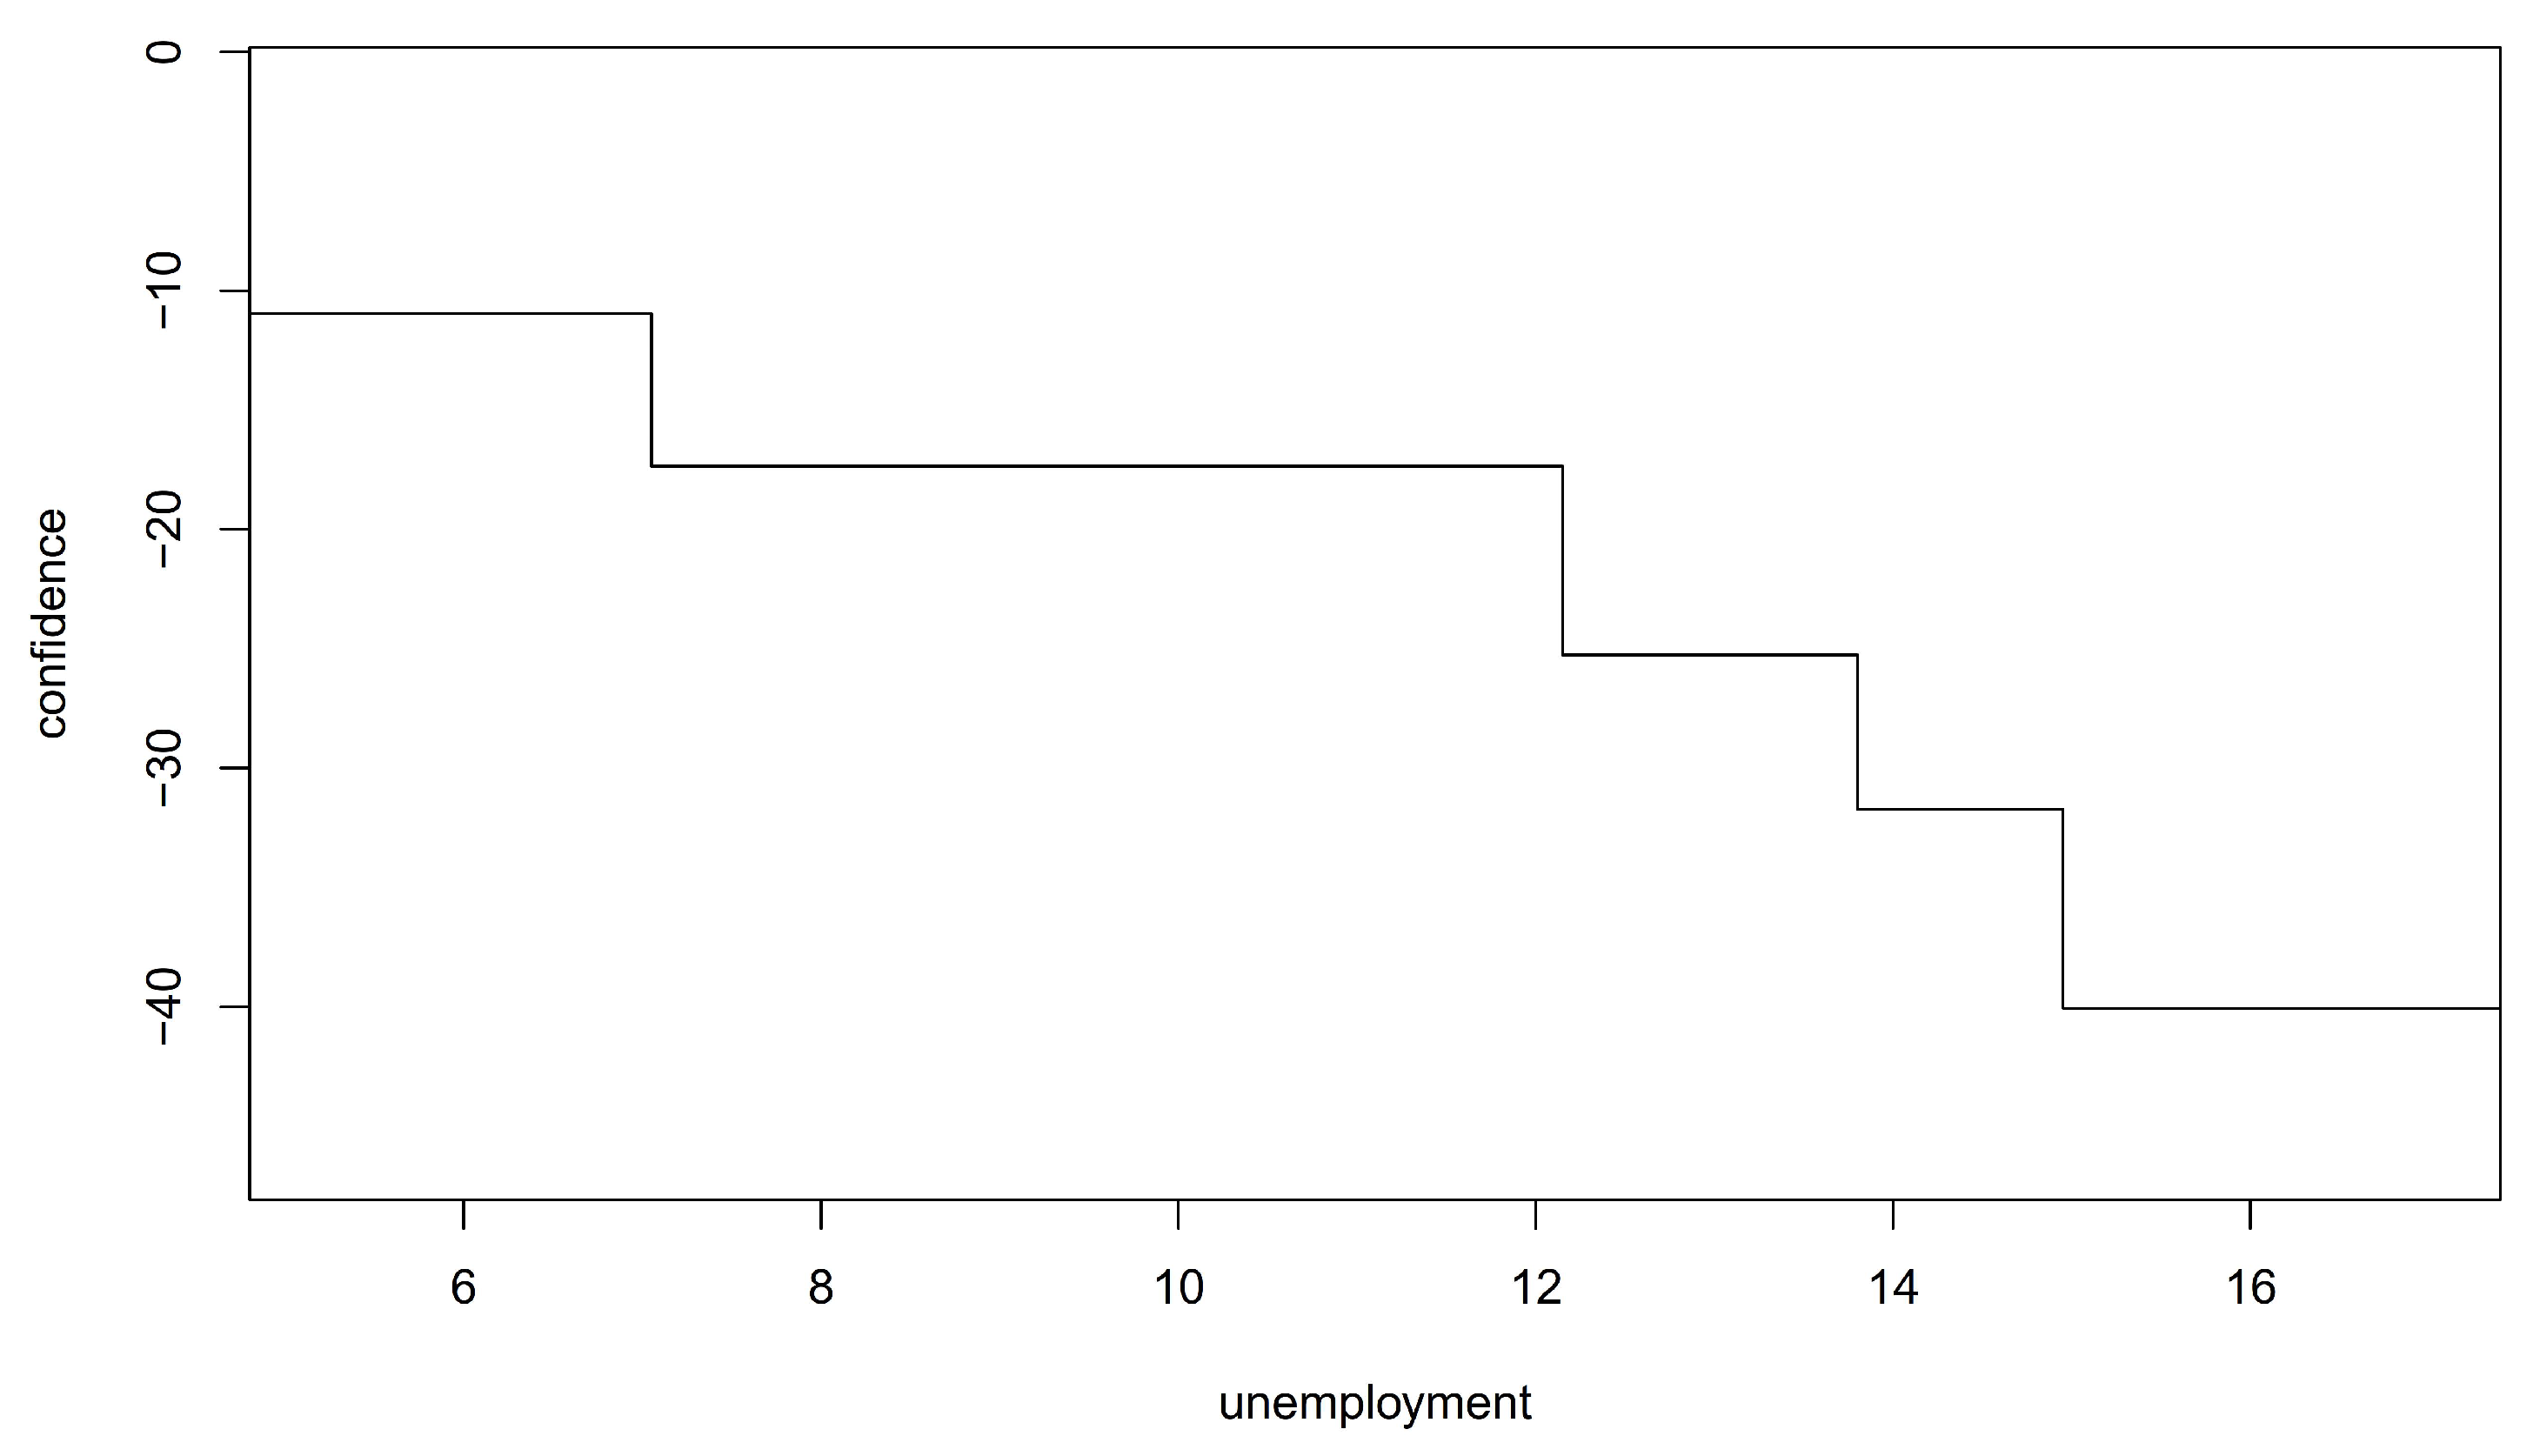
As it is more demanding than the minimum deviation, i.e., it is imposing a value of 0.005, the tree corresponding to the same formula has, as expected, a higher number of terminal nodes, i.e., 7; see
Figure 4. Concerning the residuals, its mean deviance is, as expected, smaller, i.e., 54.53 = 13360/245, being distributed as shown in
Table 2.
4.2. Classification Trees
Using as much parsimony as possible, two categorical variables were created (class_c and class_u), with class_c = ‘low confidence’ (resp. ‘high confidence’) if the value of the confidence level was below (resp. above) the sample mean and class_u = ‘low unemployment’ (resp. ‘high unemployment’) if the value of the unemployment rate was below (resp. above) the sample mean. Given the categorical nature of the outcome, a classification tree was produced for the formula = class_c~class_u, imposing a minimum deviation of 0.001. For this case, the residual mean deviance is 1.016 = 254/250, whereas the misclassification error rate is 0.2341 = 59/252, as revealed in
Table 3.
The second classification tree corresponds to the use of the unemployment rate values, as a continuous variable, in the classification of confidence levels, as a categorical variable. The results of applying the formula = class_c~unemployment gave rise to a tree with 6 terminal nodes, as shown in
Figure 5. The residual mean deviance is 0.7433 = 182.9/246.
The misclassification error rate is 0.1786 = 45/252, as revealed in
Table 4.
5. Discussion
The literature has devoted some attention to the importance of the level of confidence of economic agents, namely consumers. The aim of this article was to contribute to this literature, revisiting the relationship that, supposedly, should exist between the level of consumer confidence and the unemployment rate, using the case of Portugal, as an example. In methodological terms, regression and classification trees were used.
In general terms, the results of the application of this learning methodology can be classified as favorable to the theory that the unemployment rate is an important factor for understanding the evolution of the consumer confidence indicator (in Portugal). In fact, taking into account the parsimony of the models considered—where only the unemployment rate was considered as an ‘input’ in the learning models—the results can effortlessly be considered as acceptable.
With regard to the regression trees, in both cases under consideration, the initial partition node is associated with an unemployment rate value of approximately 12.15%. More relevant than this value is, in fact, the verification that the ranges of levels for the confidence indicator, at the intermediate and final nodes, correspond to values that have a lower confidence level as the value of the split unemployment rate increases. This result is evident in
Figure 6 and
Figure 7.
Regarding the differences between
Figure 6 and
Figure 7, it is interesting to note that, the higher constriction, with regard to the error made in the learning outcome, which was considered in the second regression tree (in relation to the first regression tree), resulted in a greater disaggregation at the highest levels of the unemployment rate, associated, precisely, with the lower values of the confidence indicator.
With regard to classification trees, the same principle of parsimony allowed us to consider the results as being acceptable. In fact, the simplest possible classification tree, i.e., with a single root node and two leaves, allowed us to achieve a correct classification rate of 76.59% of the cases, i.e., 193 in 252 cases, as being particularly sensitive—as a true ‘positive’ rate (or, indeed, with a high specificity, in case of being interpreted as a true ‘negative’ rate) in the case of the “high confidence” category, whereas a true classification rate of 80.90% was recorded, i.e., 144 in 178 cases. From the point of view of the misclassification errors, these resulted from a “low confidence” classification in 15 of the cases in which the confidence level was “high” and from a “high confidence” classification in 25 of the cases in which the confidence level was “low”.
The results of the second classification tree were also noteworthy, which was expected since continuous variables, rather than categorical variables, were used as an input in the classification of the categorical variable of output. These results were even better than those associated with the first classification tree. From the outset, it is worth noting the value of 12.05% for the unemployment rate as the partition value in the root node, which is quite close to what was obtained in both regression trees. The correct classification rate increases (compared to the first classification tree) to 84.13% of the cases, i.e., 212 in 252 cases, which is due to an increase in the correct classification of the “high confidence” category. Plainly, in this second case, the results are even more accurate, i.e., particularly sensitive—or, indeed, with a high specificity, in the case of a reverse condition (concerning the meaning of a ‘positive’ or a ‘negative’ case)—in the case of the “high confidence” category, where a true classification rate of 88.76% was recorded, i.e., 158 in 178 cases. From the point of view of the misclassification errors, these resulted from a “low confidence” classification in 20 of the cases in which the confidence level was “high” and from a “high confidence” classification in 25 of the cases in which the confidence level was “low”.
6. Conclusions
The results obtained in this article confirm that the level of consumer confidence (in Portugal) is much more related to the unemployment rate than is apparent, i.e., from a traditional data analysis point of view. This relationship has obvious implications in terms of economic policies aimed at overcoming the severe economic depression that currently affects so many economies. Considering the particular case of the EU, it has been argued that structural reforms in the labor market would be beneficial because they would contribute significantly to an increase in growth and employment through a positive impact on confidence.
In more specific terms, regarding the practical implications or policy lessons that can be inferred from the results this article has arrived at, it is particularly important to prevent the unemployment rate from rising sharply, as this is associated with falls in the level of consumer confidence. These falls will be greater the more those increases in the unemployment rate are perceived as being substantial, given the context. In turn, falls in consumer confidence level will be catalysts for negative consequences at the level of economic activity in general.
By an unfortunate coincidence, the current pandemic situation is precisely one of the cases in which the unemployment rate has risen sharply. Thus, with regard to this particular case, it is essential that the economic authorities act through measures to support firms, especially small and medium-sized ones, or even individual entrepreneurs, so that the unemployment rate does not increase as much and, as soon as possible, starts decreasing, which will lead consumers to regain their confidence level.
Obviously, this article has limitations, first and foremost, because, on purpose, we wanted to consider the unemployment rate as the only ‘predictor’ (of consumer confidence) and, even so, in parsimonious terms, in the learning models. In fact, it is known that there are other factors that influence the level of confidence of economic agents and, particularly, consumers. In particular, factors of a political or electoral nature stand out. These are promising factors for future works that include them, not least because, by their nature, they will require methodological adaptations.
Another obvious way to generalize the results will be the consideration of other countries in assessing the results that, in this article, refer to Portugal. Comparing the results with those referring to other countries is, undoubtedly, an interesting way to proceed, as well as being a way of verifying the robustness of the methodology. In addition, other methodologies, notably multi-criteria analysis, may be considered (in further analysis) and eventually applied to data focusing on consumer purchasing behavior.


