The Twin Deficit Hypothesis in the MENA Region: Do Geopolitics Matter?
Abstract
1. Introduction
2. The Twin Deficit Hypothesis Resource-Rich Economies: Theory and Literature
3. Geopolitics, Oil-Price Shocks and Twin Deficits in MENA Region: An Empirical Investigation
- Does a twin deficit hypothesis hold in MENA region countries?
- To what extent is the TDH related to geopolitical factors and oil-price related shocks?
3.1. Descriptive Analysis
3.2. Modelling the TDH in MENA Countries: PVAR
3.2.1. Correlation between Budget Balances and Current Account Balances in the MENA Region
3.2.2. Panel Unit Root Tests and Cointegration Analysis
3.2.3. PVAR and Granger Causality Analysis
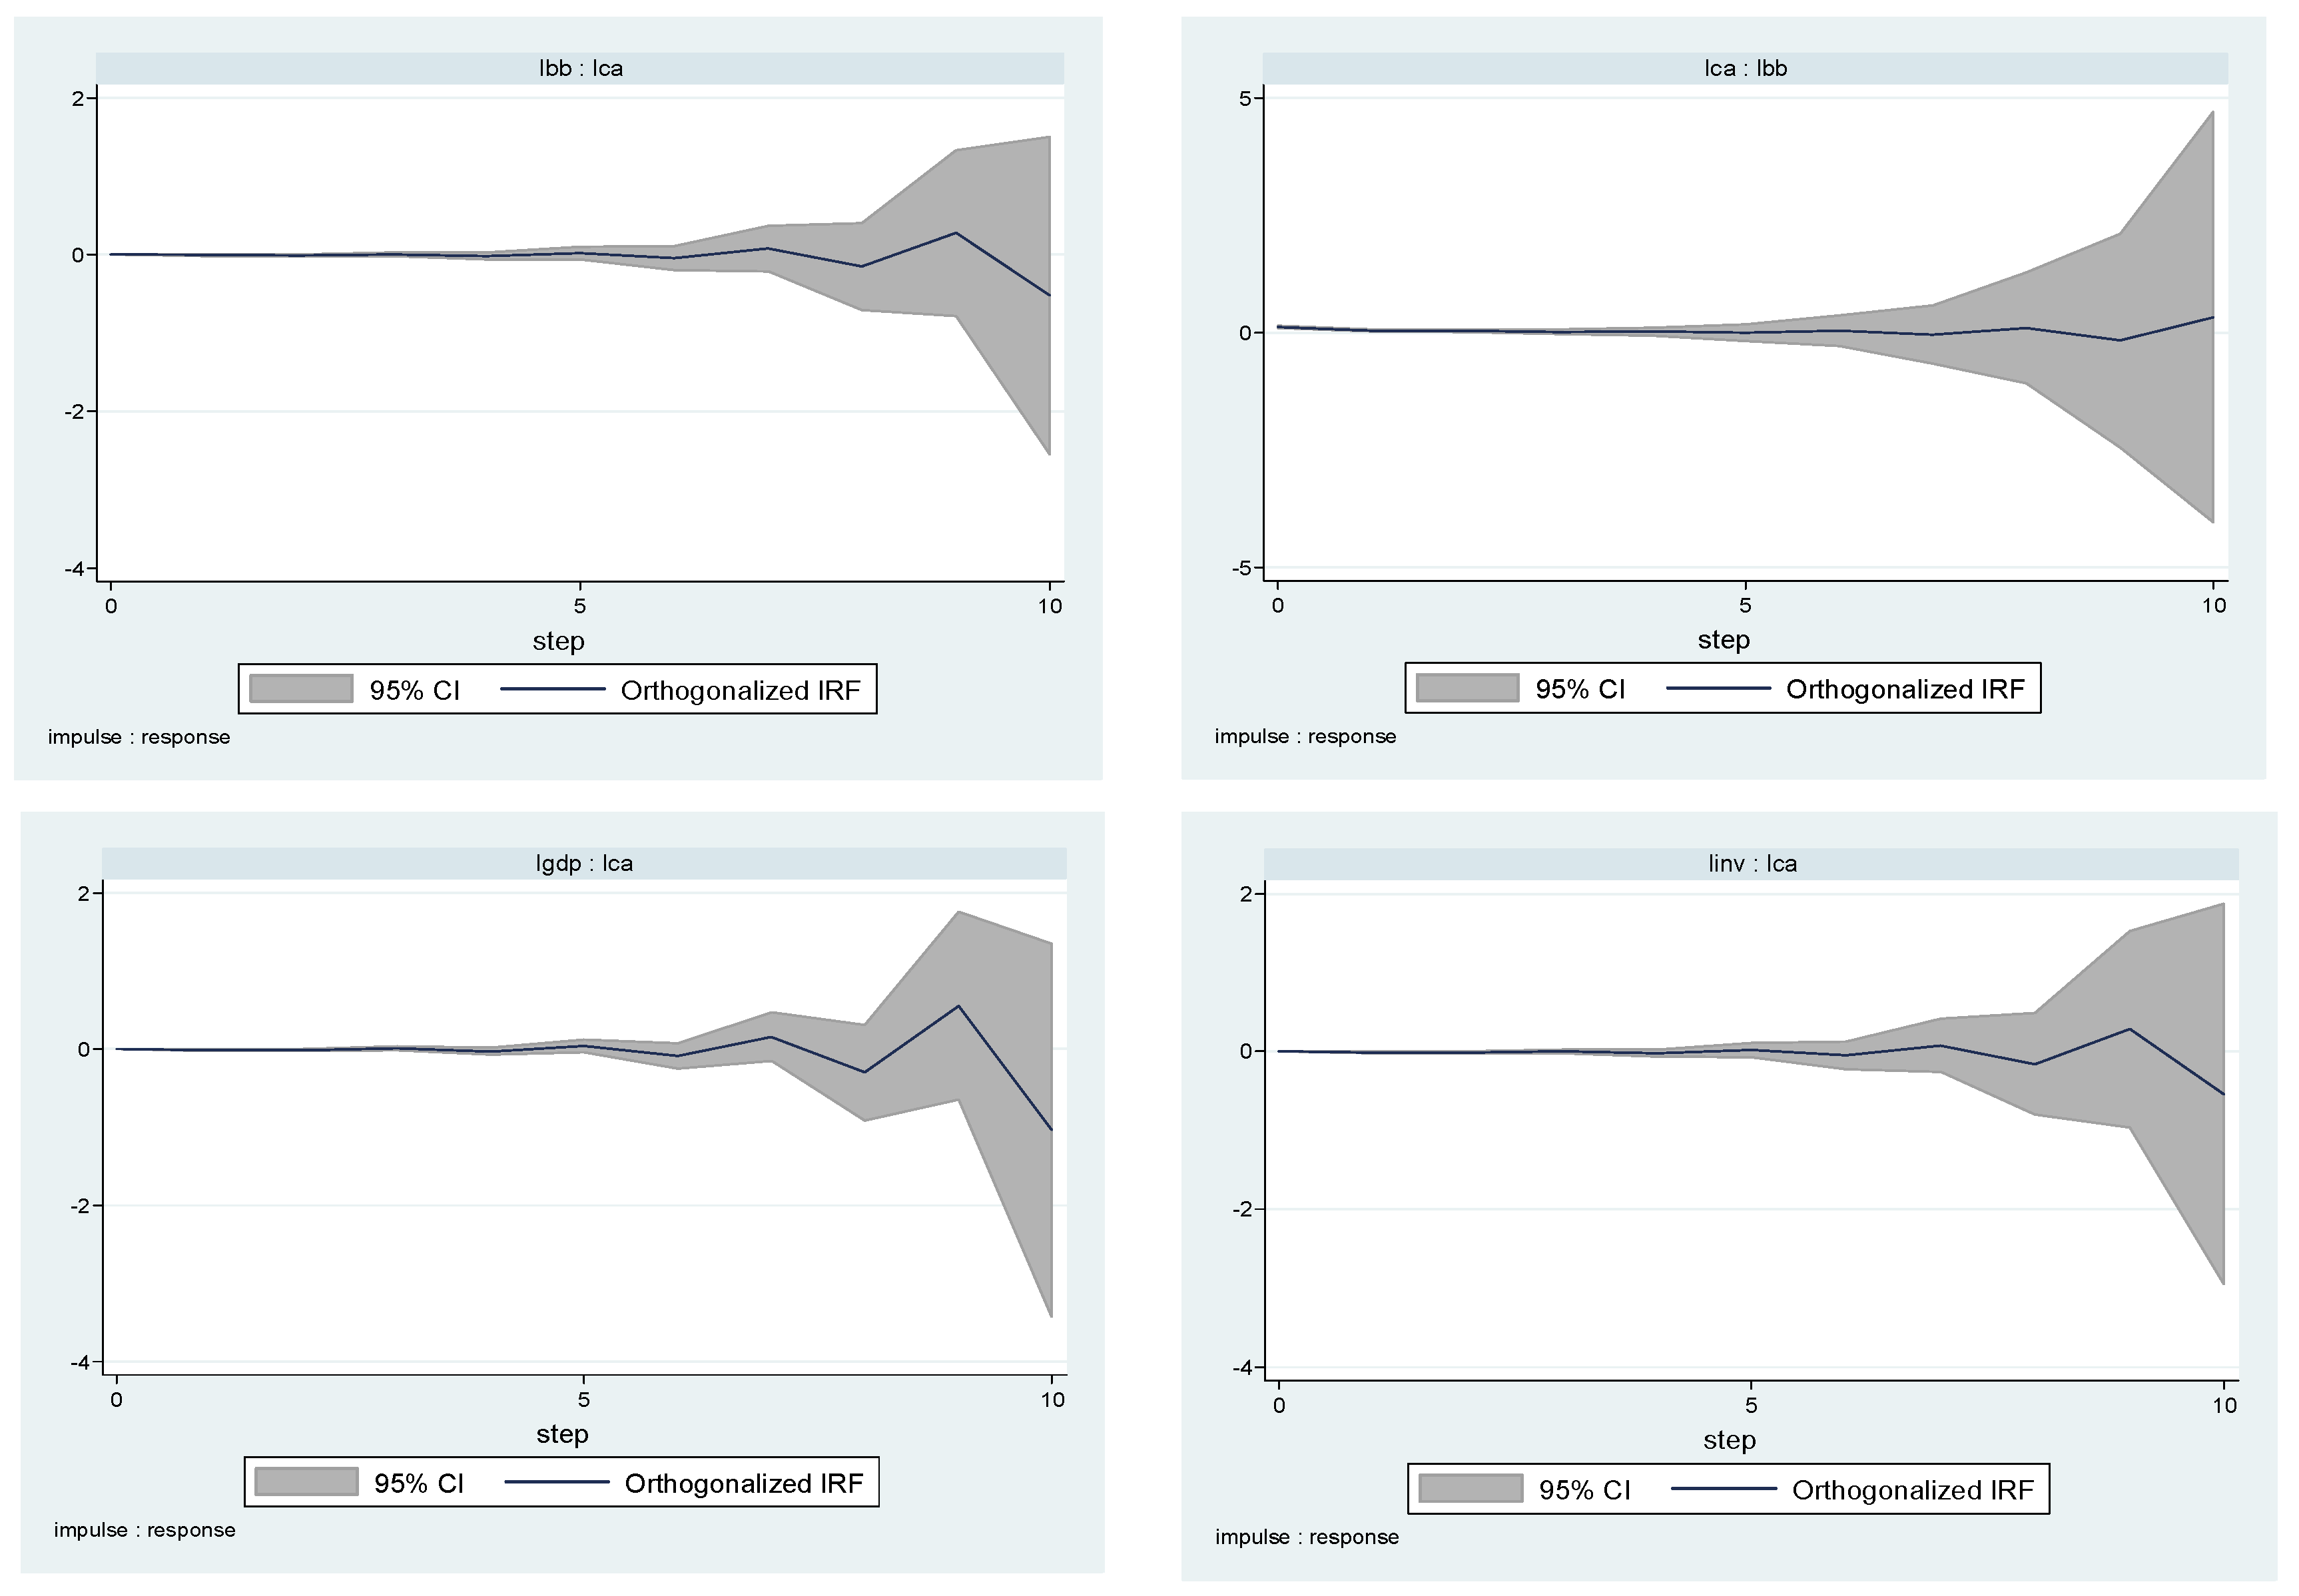
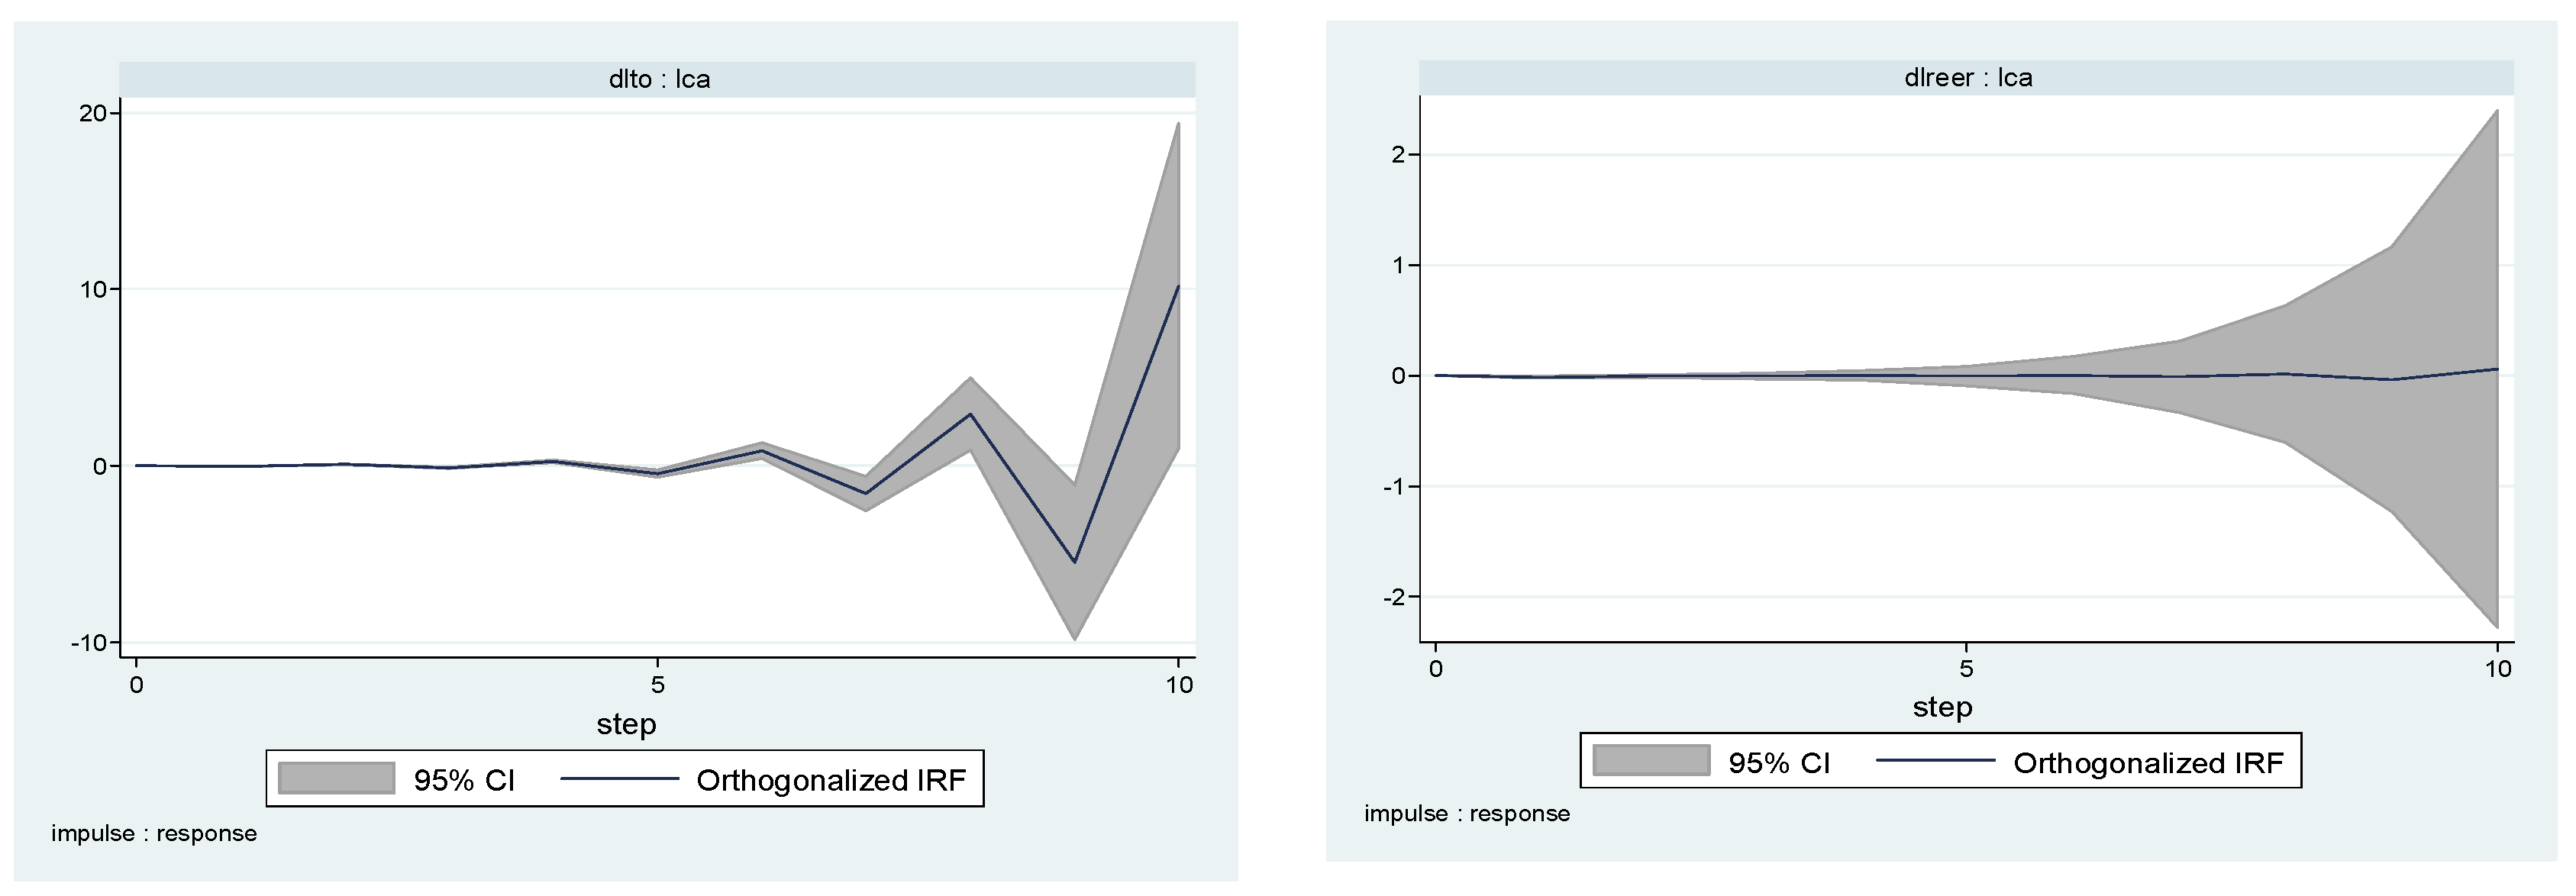
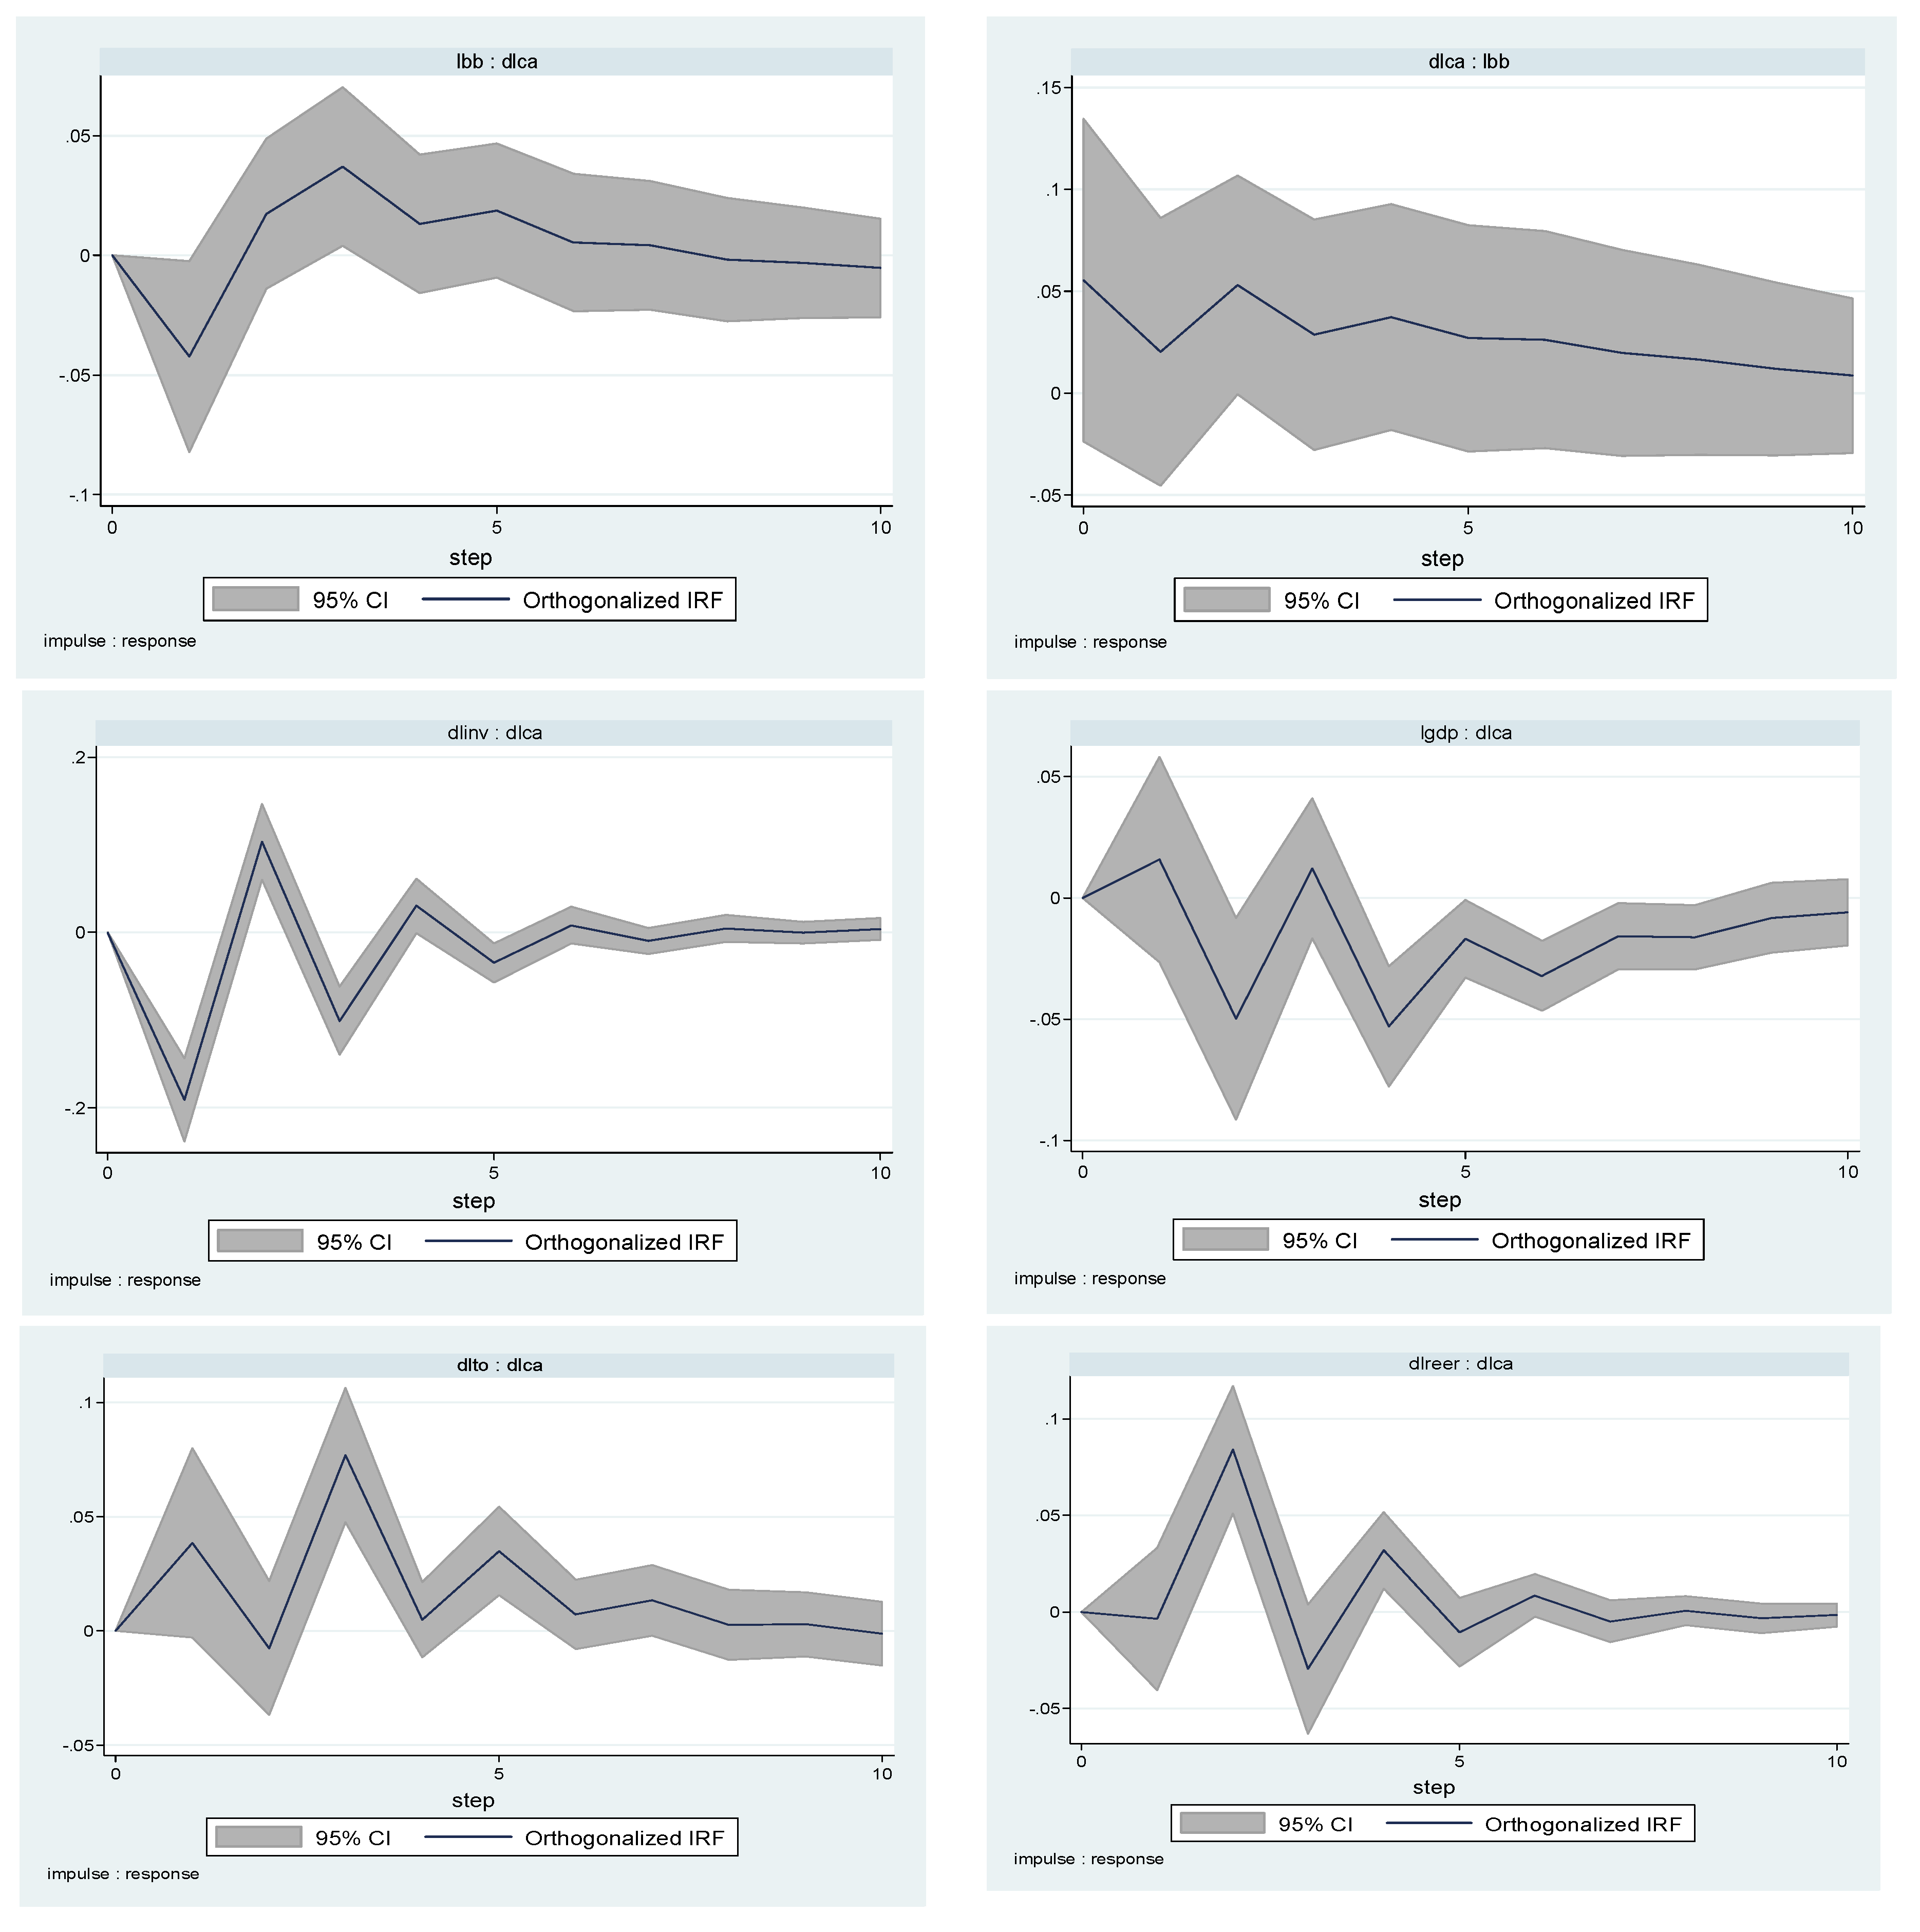
3.2.4. Impulse Response Functions (IRF) Analysis
4. Conclusions and Policy Recommendations
- Primarily, reforming fiscal performance in oil-rich countries is not of less importance than non-oil ones. Oil-rich countries need to reform their fiscal performance in the sense that they need to decrease the reliance on oil revenues and develop the non-oil sector. Those countries are also urged to revise their currency regimes towards more flexible regimes in order to decrease the vulnerability to external shocks.
- Secondly, regarding non-oil countries, fiscal or current account targeting might not be the proper solution under the Ricardian equivalence hypothesis, since most of the examined countries suffer from persistent structural deficits. Those countries need to adopt fiscal consolidation programs that aim at reforming their spending structures on one side as well as improving sources of revenues; particularly tax administration on the other side.
- Thirdly, Non-oil countries need to also adopt rather flexible exchange rate regimes in order to decrease the vulnerability of the external sector to domestic, regional and global shocks.
- Finally, export-led growth strategies and inclusive growth policies would also contribute to improving external accounts in the examined economies.
Author Contributions
Funding
Institutional Review Board Statement
Conflicts of Interest
| 1 | More on the IPU tests as opposed to the LLC tests can be found in Gengenbach et al. (2009). |
| 2 | An increase in REER is a real appreciation and a decreasing index of REER is a real depreciation of the currency. |
References
- Abbas, S. M. Ali, Jacques Bouhga-Hagbe, Antonio Fatás, Paolo Mauro, and Ricardo C. Velloso. 2011. Fiscal policy and the current account. IMF Economic Review 59: 603–29. [Google Scholar] [CrossRef]
- Abell, John D. 1990. Twin deficits during the 1980s: An empirical investigation. Journal of Macroeconomics 12: 81–96. [Google Scholar] [CrossRef]
- Abrigo, Michael R. M., and Inessa Love. 2015. Estimation of Panel Vector Autoregression in Stata: A Package of Programs. Available online: https://ideas.repec.org/p/hai/wpaper/201602.html (accessed on 15 November 2020).
- Akanbi, Olusegun Ayodele, and Rashid Sbia. 2018. Investigating the twin-deficit phenomenon among oil-exporting countries: Does oil really matter? Empirical Economics 55: 1045–64. [Google Scholar] [CrossRef]
- Alkswani, Mamdouh Alkhatib. 2000. The twin deficits phenomenon in petroleum economy: Evidence from Saudi Arabia. Paper presented at Seventh Annual Conference, Economic Research Forum (ERF), Amman, Jordan, October 26–29; pp. 26–29. [Google Scholar]
- Aloryito, Godson, Bernardin Senadza, and Edward Nketiah-Amponsah. 2016. Testing the Twin Deficits Hypothesis: Effect of Fiscal Balance on Current Account Balance-A Panel Analysis of Sub-Saharan Africa. Modern Economy 7: 945. [Google Scholar] [CrossRef][Green Version]
- Anantha Ramu, M. R., and K. Gayithri. 2017. Fiscal Consolidation versus Infrastructural Obligations. Journal of Infrastructure Development 9: 49–67. [Google Scholar]
- Aristovnik, Aleksander. 2007. Short-and Medium-Term Determinants of Current Account Balances in Middle East and North Africa Countries. William Davidson Institute Working Papers Series wp862; Ann Arbor: William Davidson Institute at the University of Michigan. [Google Scholar]
- Aristovnik, Aleksander, and Sandra Djurić. 2010. Twin Deficits and the Feldstein-Horioka Puzzle: A Comparison of the EU Member States and Candidate Countries. MPRA Paper 24149. Munich: University Library of Munich. [Google Scholar]
- Bagheri, Farzane, Khosrow Piraee, and Salma Keshtkaran. 2012. Testing for twin deficits and Ricardian equivalence hypotheses: Evidence from Iran. Journal of Social and Development Sciences 3: 77–84. [Google Scholar] [CrossRef][Green Version]
- Darvas, Zsolt. 2012. Real Effective Exchange Rates for 178 Countries: A New Database. Brussels: Bruegel Datasets. [Google Scholar]
- Eid, Ashraf Galal. 2015. Budgetary Institutions, Fiscal Policy, and Economic Growth: The Case of Saudi Arabia. Economic Research Forum Working Paper (No. 965). Giza: Economic Research Forum. [Google Scholar]
- Eldemerdash, Hany, Hugh Metcalf, and Sara Maioli. 2014. Twin deficits: New evidence from a developing (oil vs. non-oil) countries’ perspective. Empirical Economics 47: 825–51. [Google Scholar] [CrossRef]
- Enders, Walter, and Bong-Soo Lee. 1990. Current account and budget deficits: Twins or distant cousins? The Review of Economics and Statistics 72: 373–81. [Google Scholar] [CrossRef]
- Forte, Francesco, and Cosimo Magazzino. 2013. Twin deficits in the European countries. International Advances in Economic Research 19: 289–310. [Google Scholar] [CrossRef]
- Gengenbach, Christian, Franz C. Palm, and Jean-Pierre Urbain. 2009. Panel Unit Root Tests in the Presence of Cross-Sectional Dependencies: Comparison and Implications for Modelling. Econometric Reviews 29: 111–45. [Google Scholar] [CrossRef]
- Helmy, Heba E. 2018. The twin deficit hypothesis in Egypt. Journal of Policy Modeling 40: 328–49. [Google Scholar] [CrossRef]
- Helmy, Omneia, and Chahir Zaki. 2017. The nexus between internal and external macroeconomic imbalances: Evidence from Egypt. Middle East Development Journal 9: 198–232. [Google Scholar] [CrossRef]
- Im, Kyung So, M. Pesaran, and Yongcheol Shin. 2003. Testing for unit roots in heterogeneous panels. Journal of Econometrics 115: 53–74. [Google Scholar] [CrossRef]
- IMF. 2000. Iran: 2000 Article IV Consultation—Staff Report, September 2000. IMF Country Report No. 00/120. Washington, DC: IMF. [Google Scholar]
- IMF. 2005. Kuwait: 2005 Article IV Consultation—Staff Report, July 2005. IMF Country Report No. 05/234. Washington, DC: IMF. [Google Scholar]
- IMF. 2012. Tunisia: 2012 Article IV Consultation—Staff Report; Public Information Notice on the Executive Board Discussion; and Statement by the Executive Director for Tunisia, September 2012. IMF Country Report No. 12/55. Washington, DC: IMF. [Google Scholar]
- IMF. 2013a. Morocco: 2013. Article IV Consultation—Staff Report; Press Release; and Statement by the Executive Director for Morocco, March 2014. IMF Country Report No. 14/65. Washington, DC: IMF. [Google Scholar]
- IMF. 2013b. Saudi Arabia: 2013. Article IV Consultation—Staff Report, July 2013. IMF Country Report No. 13/230. Washington, DC: IMF. [Google Scholar]
- Kalou, Sofia, and Suzanna-Maria Paleologou. 2012. The twin deficits hypothesis: Revisiting an EMU country. Journal of Policy Modeling 34: 230–41. [Google Scholar] [CrossRef]
- Kim, Soyoung, and Nouriel Roubini. 2008. Twin deficit or twin divergence? Fiscal policy, current account, and real exchange rate in the US. Journal of International Economics 74: 362–83. [Google Scholar] [CrossRef]
- Levin, Andrew, Chien-Fu Lin, and Chia-Shang James Chu. 2002. Unit root tests in panel data: Asymptotic and finite-sample properties. Journal of Econometrics 108: 1–24. [Google Scholar] [CrossRef]
- Library of Congress–Federal Research Division. 2008. Country Profile, Yemen 2008. Available online: https://www.loc.gov/rr/frd/cs/profiles/Yemen.pdf (accessed on 30 August 2020).
- Marinheiro, Carlos Fonseca. 2008. Ricardian equivalence, twin deficits, and the Feldstein–Horioka puzzle in Egypt. Journal of Policy Modeling 30: 1041–56. [Google Scholar] [CrossRef]
- Merza, Ebrahim, Mohammad Alawin, and Ala’ Bashayreh. 2012. The relationship between current account and government budget balance: The case of Kuwait. International Journal of Humanities and Social Science 2: 168–77. [Google Scholar]
- Milne, Elizabeth. 1977. The fiscal approach to the balance of payments. Economic Notes 6: 89–107. [Google Scholar]
- Morsy, Hanan. 2009. Current Account Determinants for Oil-Exporting Countries. International Monetary Fund IMF Working Papers (09/28). Washington, DC: International Monetary Fund. [Google Scholar]
- Nargelecekenlera, Mehmet, and Filiz Giray. 2013. Assessing the twin deficits hypothesis in selected OECD countries: An empirical investigation. Business and Economics Research Journal 4: 1. [Google Scholar]
- Neaime, Simon. 2015. Twin deficits and the sustainability of public debt and exchange rate policies in Lebanon. Research in International Business and Finance 33: 127–43. [Google Scholar] [CrossRef]
- Nikiforos, Michalis, Laura Carvalho, and Christian Schoder. 2015. “Twin deficits” in Greece: In search of causality. Journal of Post Keynesian Economics 38: 302–30. [Google Scholar] [CrossRef]
- Panizza, Ugo. 2001. Macroeconomic Policies in Egypt: An Interpretation of the Past and Options for the Future. Cairo: Egyptian Center for Economic Studies. [Google Scholar]
- Ramachandran, S. 2004. Economic Development in the 1990s and World Bank Assistance. Washington, DC: World Bank, vol. 15, p. 2016. [Google Scholar]
- Rault, Christrophe, and Antonio Afonso. 2009. Bootstrap Panel Granger-Causality between Government Budget and External Deficits for the EU. Economics Bulletin 29: 1027–34. [Google Scholar]
- Sakyi, Daniel, and Eric Evans Osei Opoku. 2016. The Twin Deficits Hypothesis in Developing Countries: Empirical Evidence for Ghana. Technical No. S-33201-GHA-1. London: International Growth Centre, London School of Economics. [Google Scholar]
- Vamvoukas, George A. 1999. The twin deficits phenomenon: Evidence from Greece. Applied Economics 31: 1093–100. [Google Scholar] [CrossRef]
- Westerlund, Joakim. 2007. Testing for error correction in panel data. Oxford Bulletin of Economics and Statistics 69: 709–48. [Google Scholar] [CrossRef]
- World Bank. 2017. Libya Macro Poverty Outlook. Washington, DC: World Bank. [Google Scholar]
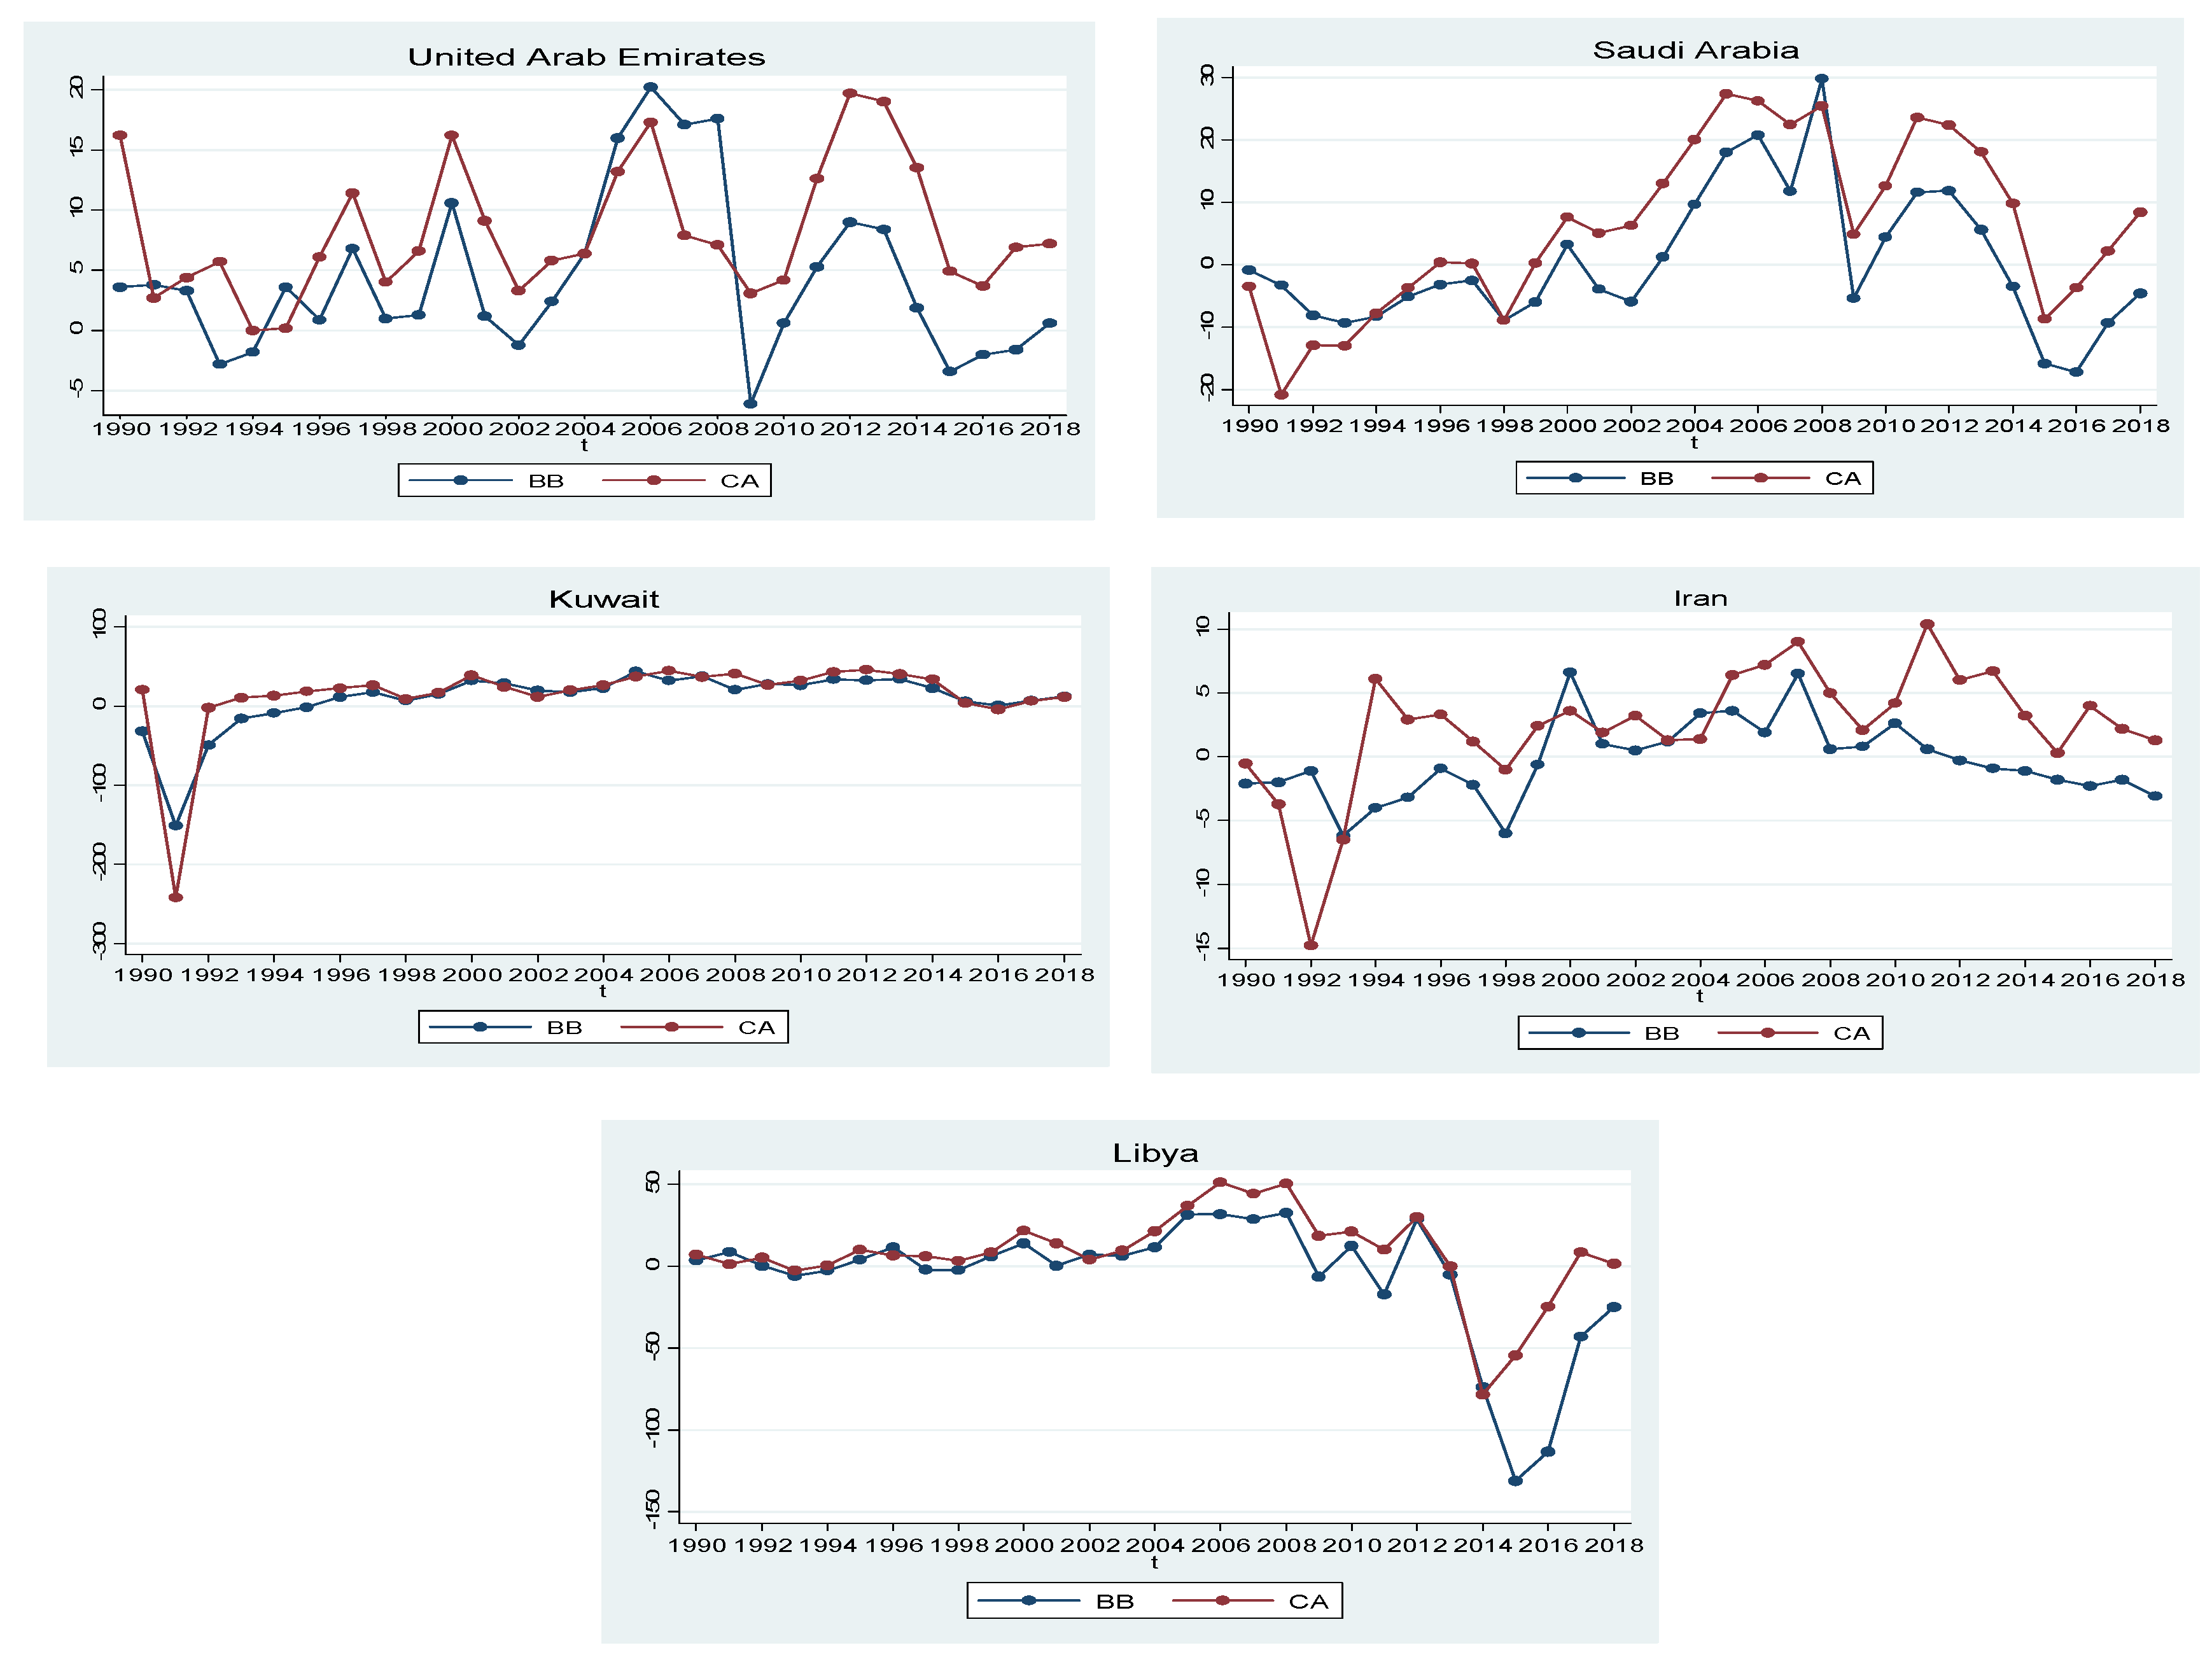
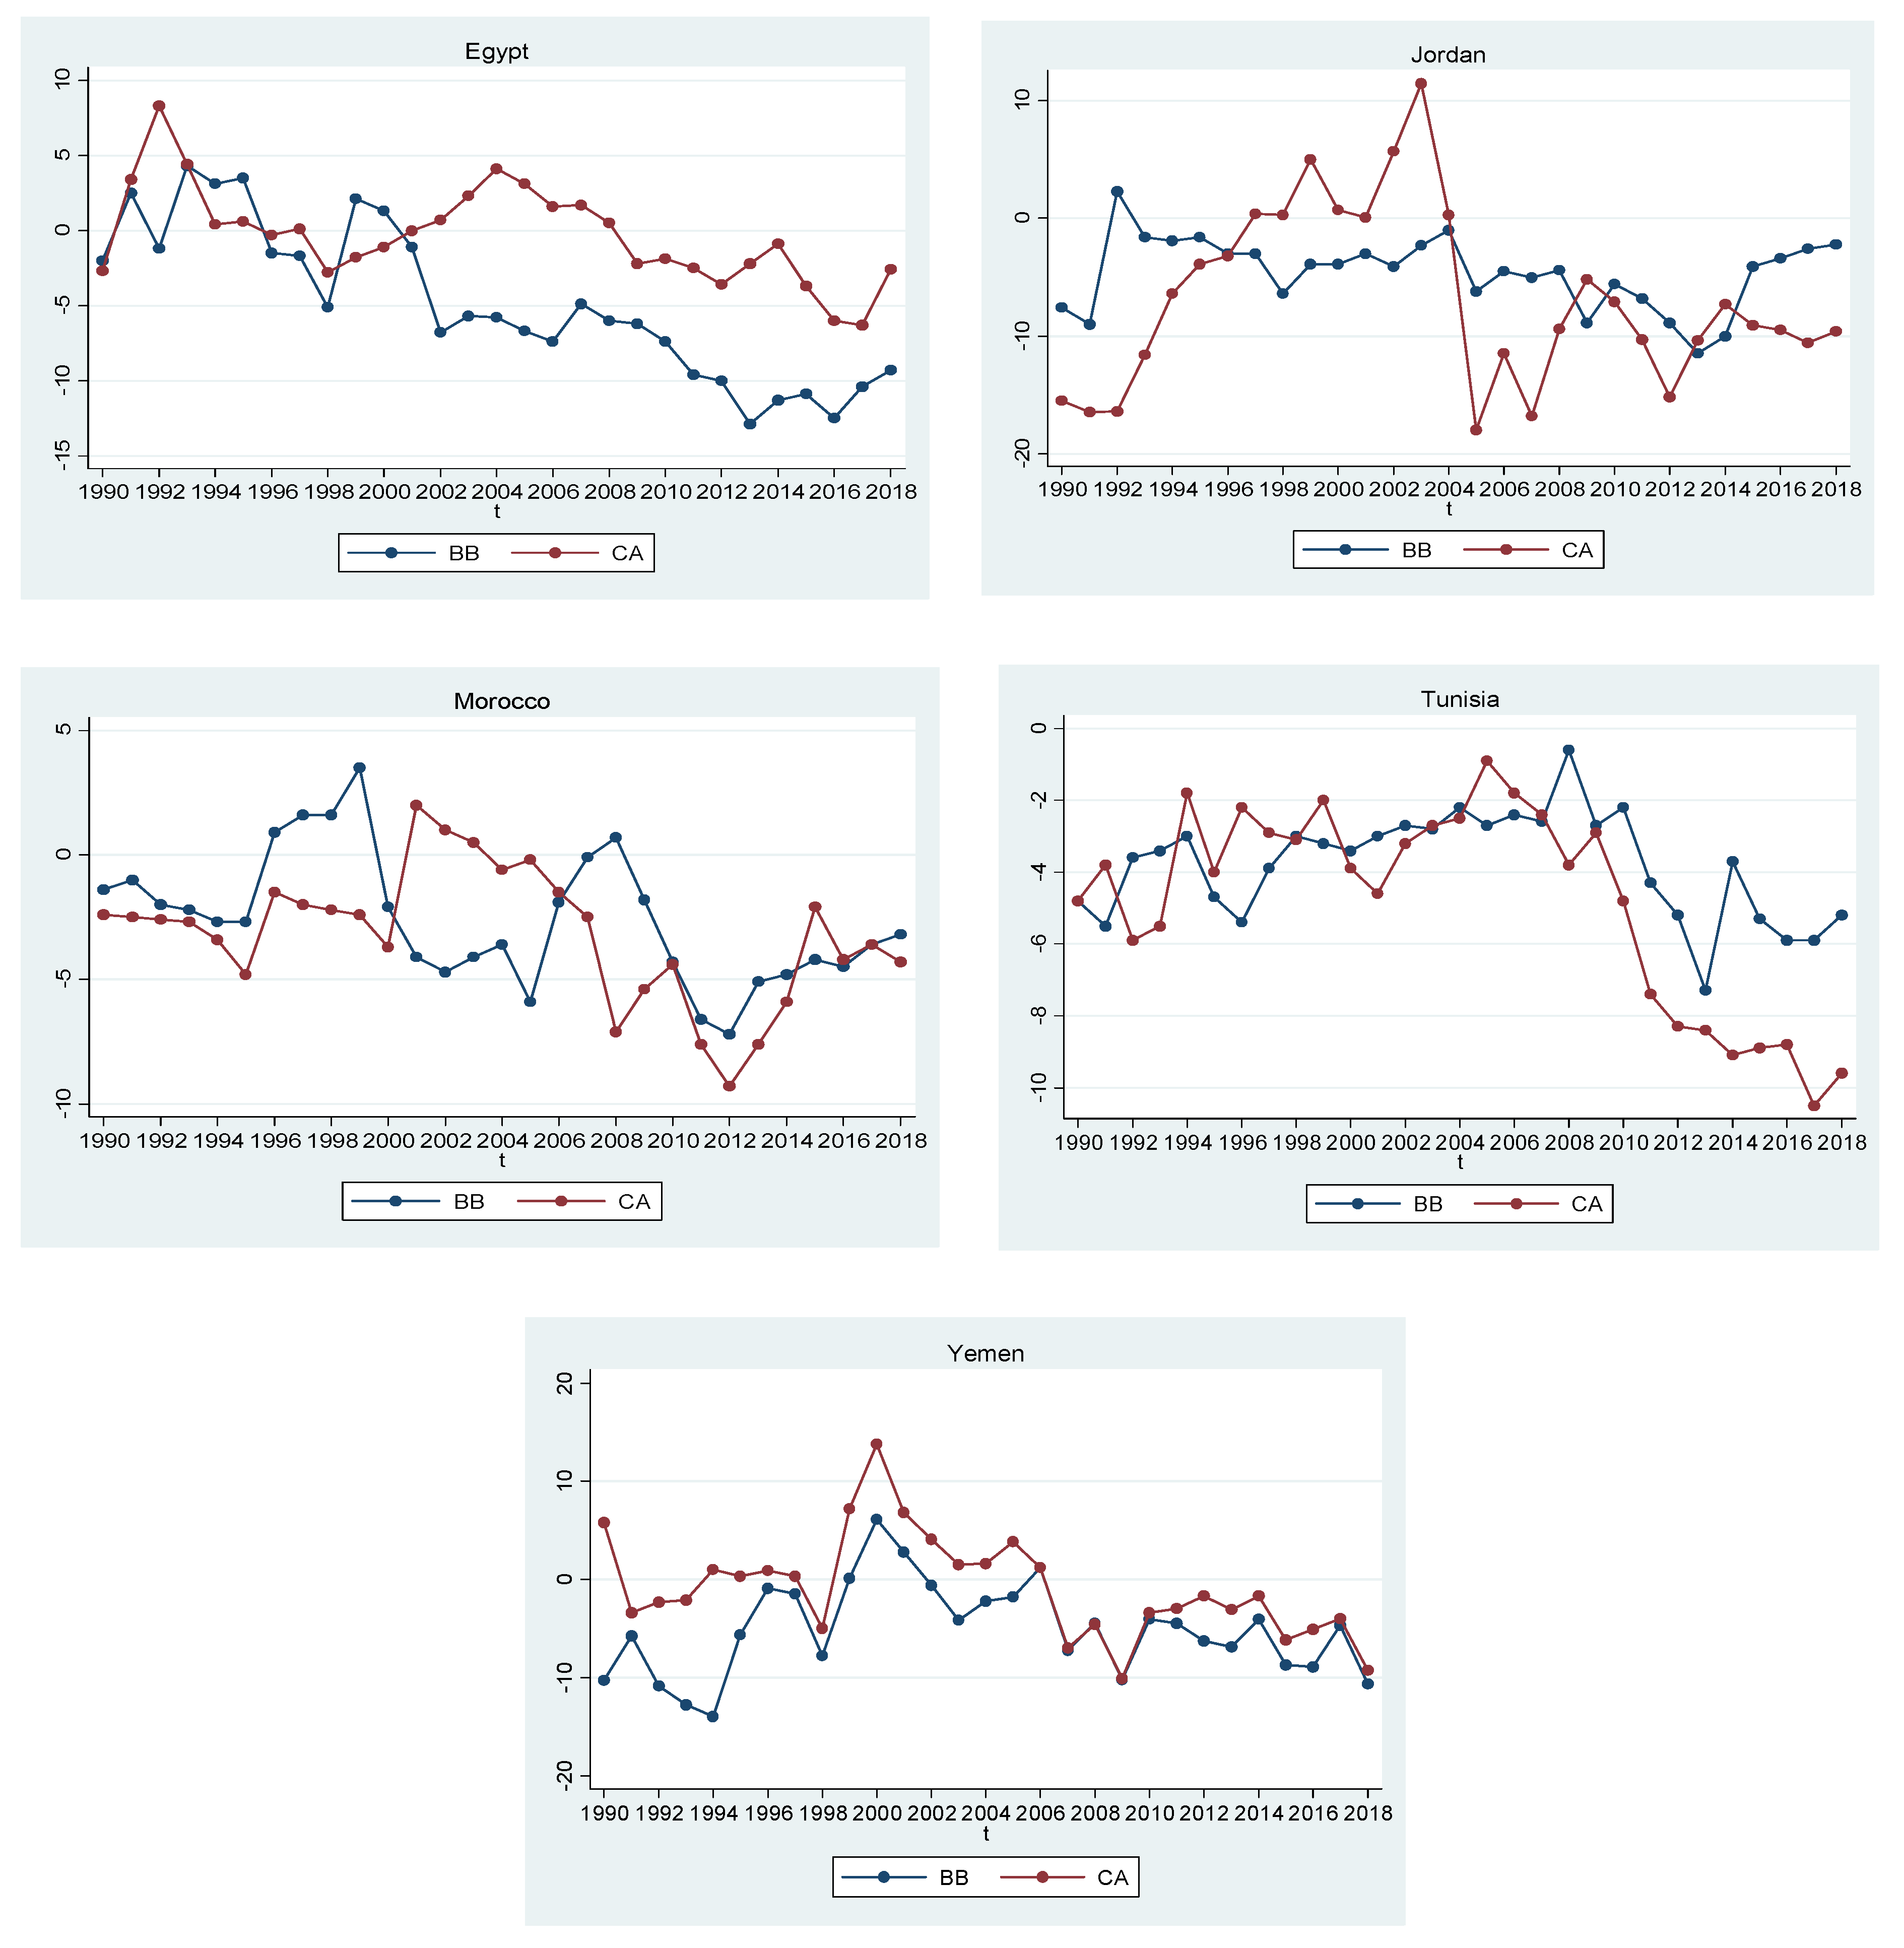
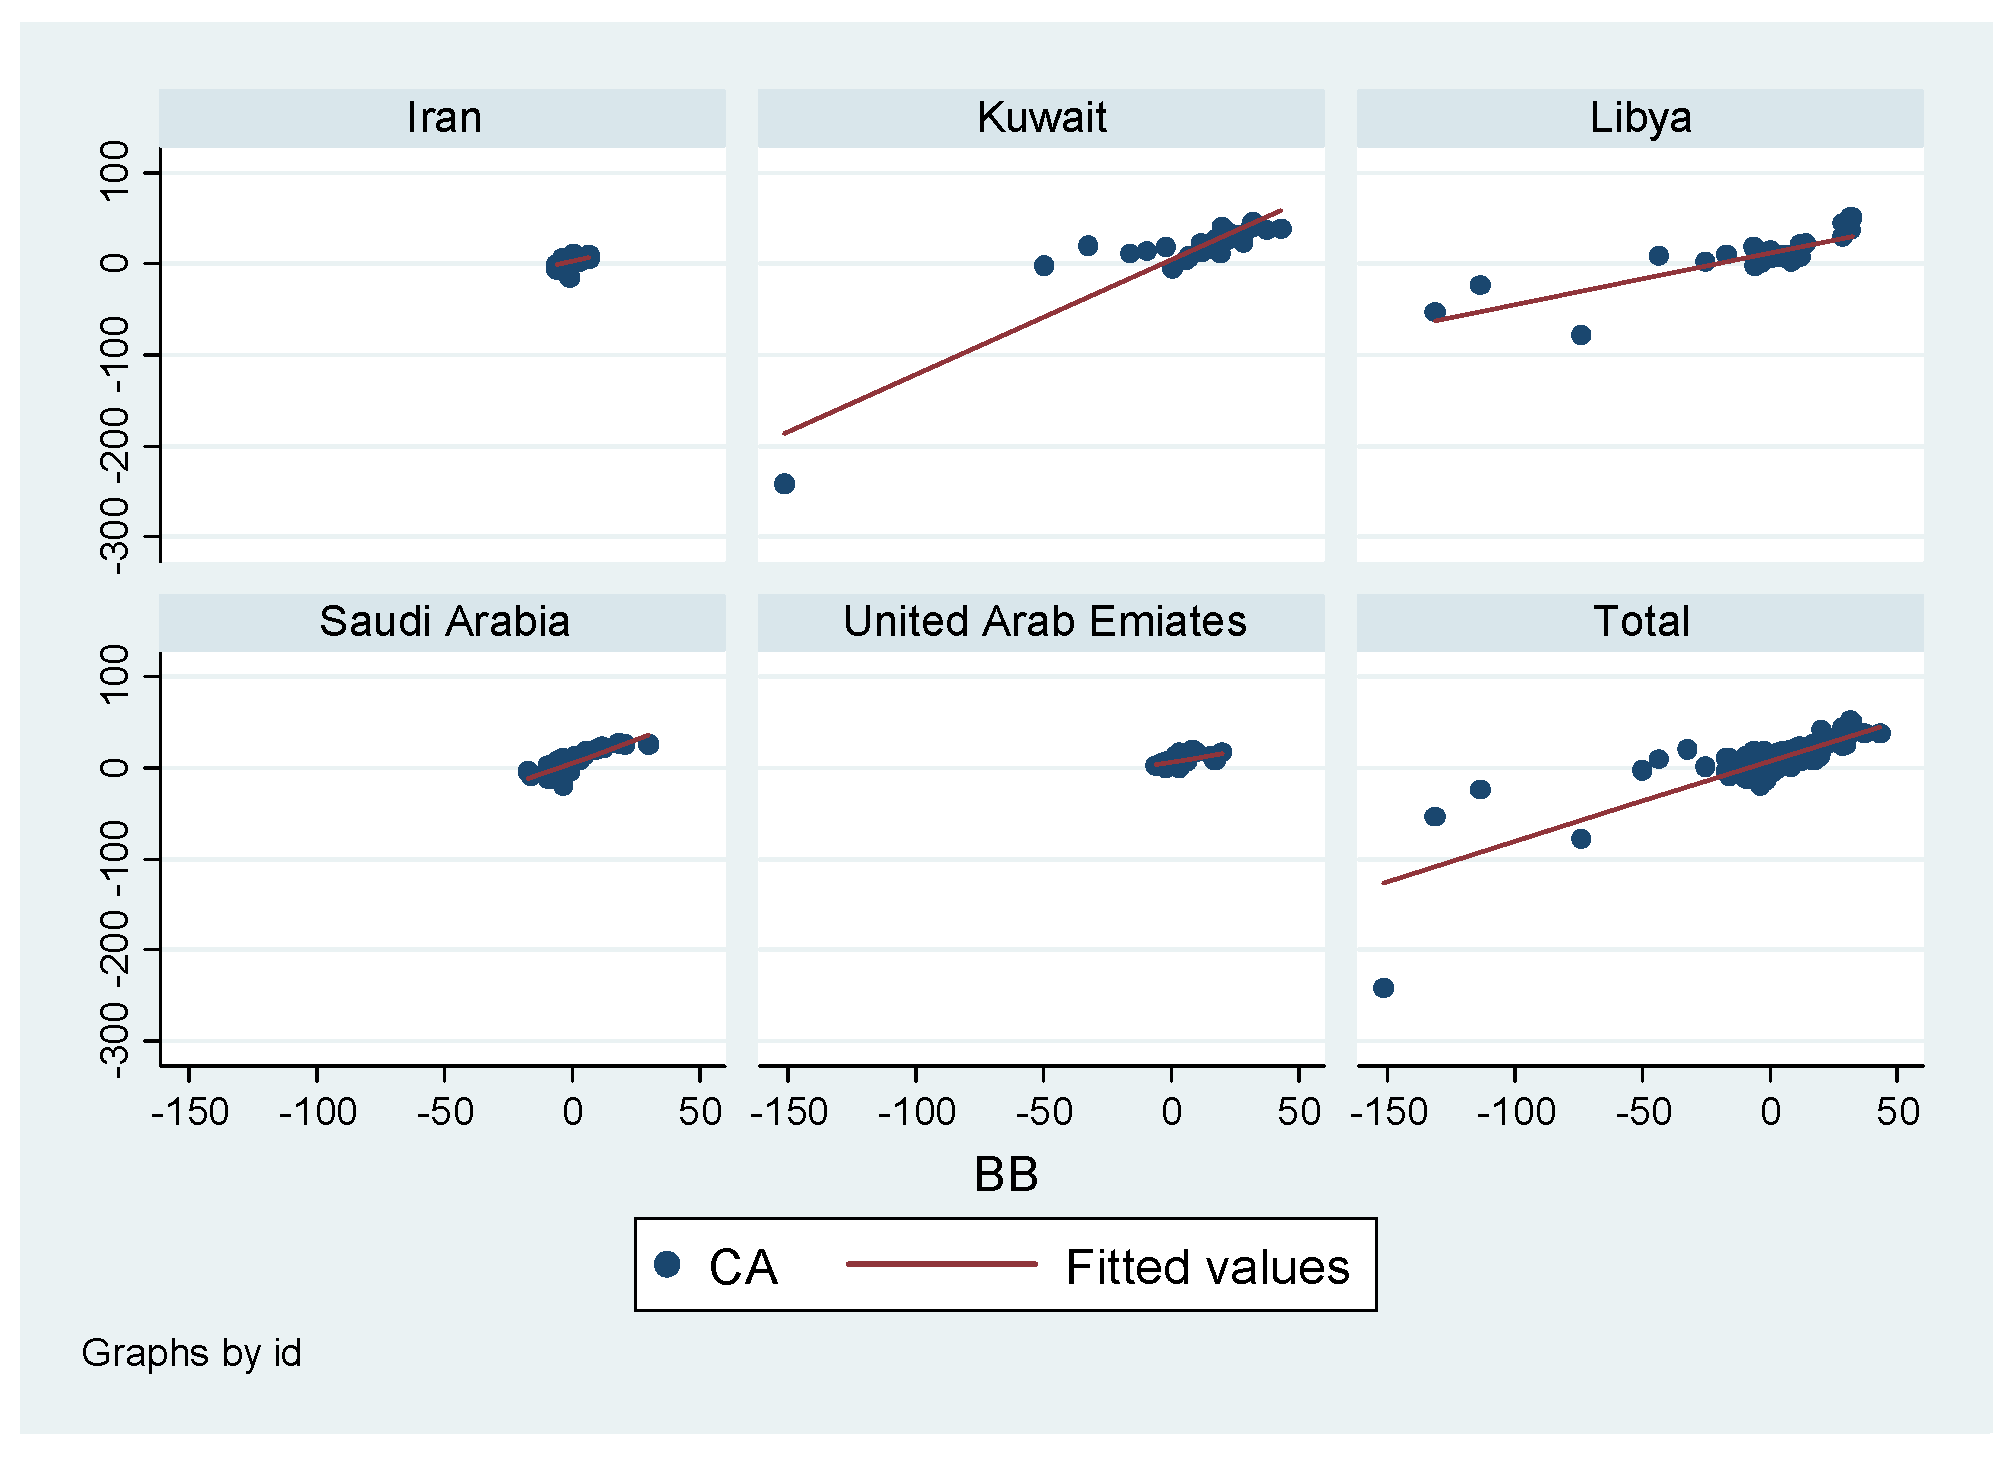
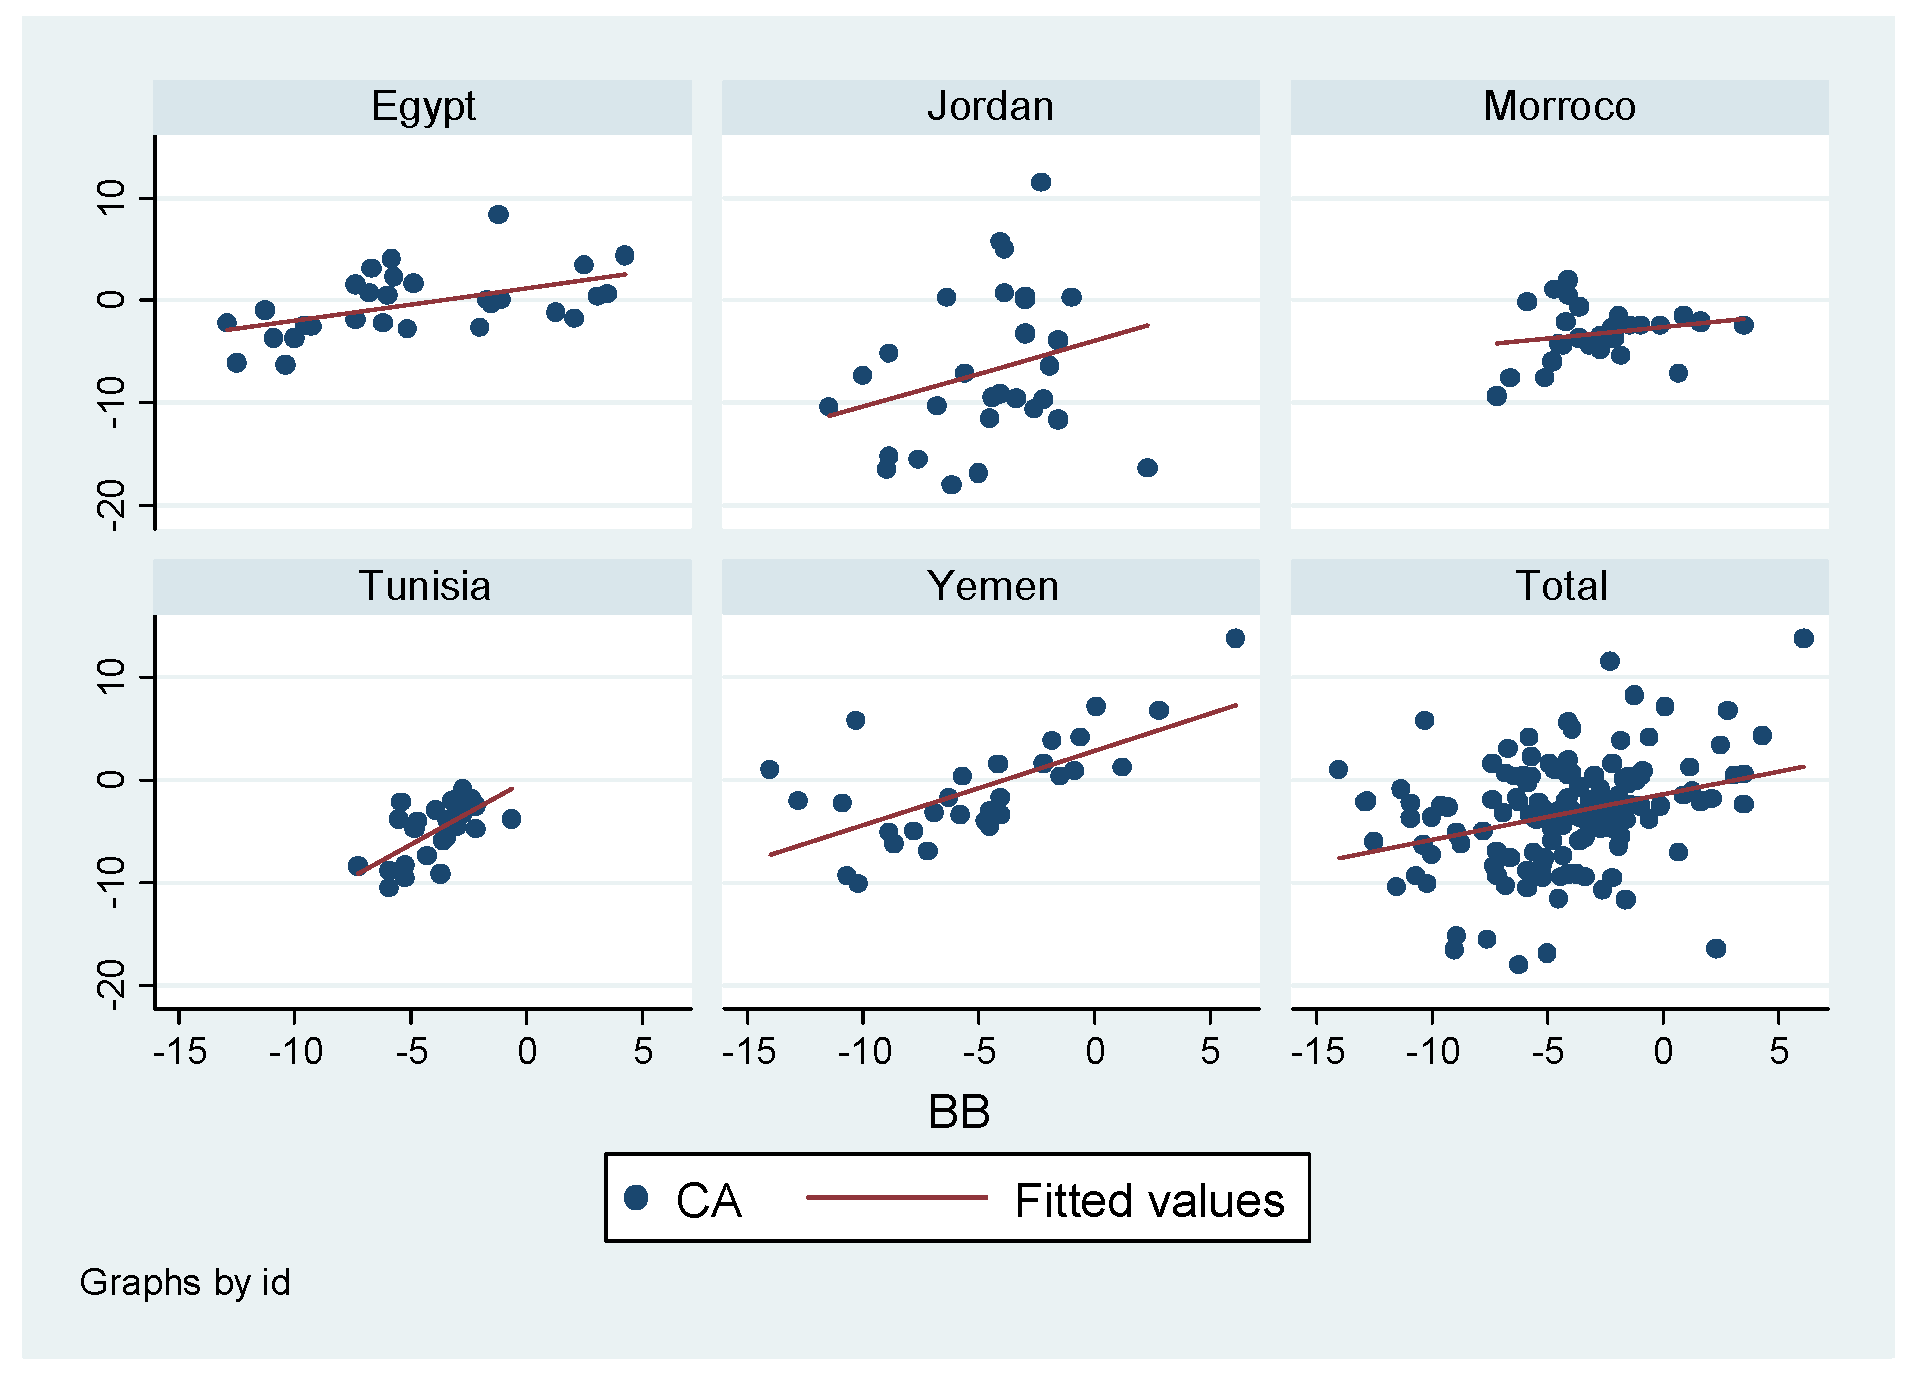
| Country | Period | Oil Price Trends | Impact on Budget Balance and Current Account |
|---|---|---|---|
| Saudi Arabia | 1990 to 2002 | Low oils $20 per barrel. Asian financial crisis resulted in lower demand on oil globally. | Budget deficit of −0.9% to −5.9%. Current account deficit ranging between −3.7% and −8.9% and it reached −20.8% in 1995. |
| 2003–2013 | Increase in oil prices from $31 per barrel to $98 per barrel. Iraq’s war in 2003 which led to a decrease in oil production (Eid 2015). | Continuous budget surplus (1.2–5.6 percent of GDP) with a peak in 2008 of 29.8 percent of GDP in 2003. A surplus in current account balance (7.6–9.8 percent of GDP) with a peak of 27.4 percent in 2004. (IMF 2013b). | |
| Kuwait | 2005–2012 | Budget balance reached 43.3 percent of the GDP in 2005. The current account balance reached 45.5 percent of GDP in the same year. The economy is relatively less oil-dependent and it has other diversified sources of revenues (such as VAT). | |
| 1990–1993 | War with Iraq resulted in the lowest level of oil production and revenues | In 1991, both balances witnessed a huge deficit of −151.3% of GDP in the budget balance and −242.2% of GDP in the current account balance (IMF 2005). | |
| 1990–1998 | War with Iraq resulted in a decrease in oil revenues that accounted for more than 70% of Iranian exports and more than 50% of government revenues (IMF 2000). | Budget deficit ranging from −2.1 to 6.1 percent of GDP. Current account deficit ranging from −0.5 to 6.5 percent of GDP, including a sharp deficit of −14.8 percent in 1992. | |
| Iran | 1999/2000 | Positive oil price shock. | Surplus in both balances. Current account balance is 2.4 percent of GDP and budget surplus reached 6.6 percent of GDP in the same period |
| Libya | 1999–2010 | Rising oil prices and increased oil revenues. | Budget surpluses during this period and it reached 32.5 percent of GDP in 2008. Current account surpluses during this period and it reached 51.1 percent of GDP in 2006. |
| 2014–2016 | Decrease in oil revenues | Budget deficit reaching −113.3 percent of GDP in 2016. Current account deficit was −78.4% in 2014 (World Bank 2017). |
| Variables | Description | Source | Relevance to Literature |
|---|---|---|---|
| CAB | Current account balance (surplus/deficit) as a % of GDP (in log) | IMF World Economic Outlook | The budget balance and current account balance are the main variables to be tested in the TDH. Rault and Afonso (2009) and Forte and Magazzino (2013) for EU countries, Eldemerdash et al. (2014) for oil and non-oil countries and Aloryito et al. (2016) for Sub-Saharan Africa. |
| BB | Net lending(+)/borrowing (-) (overall balance) as a % of GDP (in log) | IMF World Economic Outlook and World Bank | |
| REER | Real Effective Exchange rate (CPI based) (in log) | Bruegel working paper Darvas (2012) | Used in Aristovnik and Djurić (2010) and Forte and Magazzino (2013) for EU countries to show how this variable plays a pivotal role through how the budget balance affects the current account balance, which is similar to the Mundel–Flemming framework. |
| RGDP | Real GDP Growth as % of GDP (in log) | IMF World Economic Outlook | Real GDP growth is used because of the two balances having different responses to economic cycles that needs to be taken into consideration through this variable, which is shown in Eldemerdash et al. (2014) for oil and non-oil countries, Aloryito et al. (2016) for Sub-Saharan Africa and Akanbi and Sbia (2018) for oil exporting countries. |
| INV | Total investment as % of GDP (in log) | IMF World Economic Outlook | The total investment is mentioned in the national account identity explained earlier, which indicates that when there are investments, the current account balance worsens (which is used as a variable in Marinheiro (2008) and Helmy and Zaki (2017) for Egypt, Aristovnik and Djurić (2010) for EU countries, Anantha Ramu and Gayithri (2017) for india and Eldemerdash et al. (2014) for oil and non-oil countries). |
| TO | Trade openness as % of GDP (in log) | World bank and United Nations Statistics (UNCTAD stat) | Included to account for an economy’s integration level, which will help in identifying the current account balance situation such as in Eldemerdash et al. (2014) for oil and non-oil countries and Akanbi and Sbia (2018) for oil exporting countries. |
| Ho: Panels Contain Unit Roots Ha: Panels Are Stationary | Level | First Difference | ||
|---|---|---|---|---|
| p-Value | p-Value | |||
| Panel: full sample | LLC | IPS | LLC | IPS |
| Current account balance | 0.0000 | 0.0011 | 0.0000 | 0.0000 |
| Budget balance | 0.0000 | 0.0001 | 0.0000 | 0.0000 |
| Real effective exchange rate | 0.0780 | 0.3281 | 0.0001 | 0.0000 |
| Real GDP growth | 0.0000 | 0.0000 | 0.0000 | 0.0000 |
| Total investment | 0.0042 | 0.0090 | 0.0042 | 0.0000 |
| Trade openness | 0.6288 | 0.4747 | 0.0000 | 0.0000 |
| Panel: oil countries | LLC | IPS | LLC | IPS |
| Current account balance | 0.0000 | 0.0006 | 0.0000 | 0.0000 |
| Budget balance | 0.0000 | 0.0007 | 0.0000 | 0.0000 |
| Real effective exchange rate | 0.1254 | 0.6960 | 0.0000 | 0.0000 |
| Real GDP growth | 0.0000 | 0.0000 | 0.0000 | 0.0000 |
| Total investment | 0.0003 | 0.0033 | 0.0000 | 0.0000 |
| Trade openness | 0.7619 | 0.3735 | 0.9730 | 0.0001 |
| Panel: non-oil countries | LLC | IPS | LLC | IPS |
| Current account balance | 0.2625 | 0.0550 | 0.0000 | 0.0000 |
| Budget balance | 0.0131 | 0.0092 | 0.0000 | 0.0000 |
| Real effective exchange rate | 0.2030 | 0.1266 | 0.3866 | 0.0000 |
| Real GDP growth | 0.0009 | 0.0000 | 0.0000 | 0.0000 |
| Total investment | 0.2170 | 0.2644 | 0.0000 | 0.0000 |
| Trade openness | 0.4307 | 0.5920 | 0.0154 | 0.0000 |
| Ho: No Cointegration | Panel: Full Sample | Panel: Oil Countries | Panel: Non-Oil Countries |
|---|---|---|---|
| p-Value | p-Value | p-Value | |
| Current account-Budget balance | |||
| Westerlund (2007) | |||
| Group Gt statistic (standard) | 0.000 | 0.000 | 0.000 |
| Group Ga statistic (robust) | 0.005 | 0.003 | 0.000 |
| Panel Pt statistic (standard) | 0.000 | 0.000 | 0.000 |
| Panel Pa statistic (robust) | 0.000 | 0.000 | 0.000 |
| Lag | CD | J | J p-Value | BIC | AIC | QIC |
|---|---|---|---|---|---|---|
| 1 | 0.9976262 | 89.75731 | 0.0766997 | −254.9421 | −54.24269 | −135.7476 |
| 2 | −0.0434123 | 43.06074 | 0.1947116 | −129.289 | −28.93926 | −69.69174 |
| Sample: 1994–2017 No. of obs = 120 No. of panels = 5 Ave. no. of T = 24.000 | ||||||
| Lag | CD | J | J p-Value | BIC | AIC | QIC |
|---|---|---|---|---|---|---|
| 1 | 0.5777068 | 84.97333 | 0.1407282 | −259.7261 | −59.02667 | −140.5316 |
| 2 | 0.593515 | 46.52938 | 0.1123666 | −125.8203 | −25.47062 | −66.22309 |
| Sample: 1994–2017 No. of obs = 120 No. of panels = 5 Ave. no. of T = 24.000 | ||||||
| Variables | Current Account | Budget Balance | ΔREER | GDP Growth | Total Investment | ΔTrade Openness |
|---|---|---|---|---|---|---|
| Lagged Current account | −0.0129291 (0.072) | −0.764252 (0.000) | 0.1850592 (0.000) | 0.9253072 (0.000) | 0.3757229 (0.000) | −1.370283 (0.000) |
| Lagged Budget balance | 0.0172951 (0.008) | 0.8580624 (0.000) | −0.1587018 (0.000) | −1.134299 (0.000) | −0.2639757 (0.000) | 1.411876 (0.000) |
| Lagged REERΔ | −0.0762447 (0.000) | −0.0835283 (0.000) | 0.1517432 (0.000) | −0.130429 (0.000) | 0.2774289 (0.000) | −0.271178 (0.000) |
| Lagged GDP growth | −0.0244887 (0.000) | −0.0116363 (0.011) | −0.0094626 (0.000) | −0.1450394 (0.000) | 0.0143457 (0.000) | 0.0443089 (0.000) |
| Lagged Total investment | −0.0529807 (0.000) | −0.0601517 (0.000) | 0.0346498 (0.058) | −0.6200547 (0.000) | 0.8403708 (0.000) | 0.0558369 (0.205) |
| Lagged trade opennessΔ | −0.1869155 (0.000) | −0.4601908 (0.000) | 0.3980776 (0.000) | −0.0510231 (0.595) | 1.264939 (0.000) | −2.025962 (0.000) |
| Observations | 130 | 130 | 130 | 130 | 130 | 130 |
| Equation/Excluded | Chi2 | df | p > Chi2 |
|---|---|---|---|
| Current account | |||
| Budget balance | 7.035 | 1 | 0.008 |
| REERΔ | 47.094 | 1 | 0.000 |
| GDP growth | 707.110 | 1 | 0.000 |
| Total investment | 37.681 | 1 | 0.000 |
| Trade opennessΔ | 141.104 | 1 | 0.000 |
| ALL | 1326.821 | 5 | 0.000 |
| Budget balance | |||
| Current account | 2095.158 | 1 | 0.000 |
| REERΔ | 82.910 | 1 | 0.000 |
| GDP growth | 6.387 | 1 | 0.011 |
| Total investment | 32.015 | 1 | 0.000 |
| Trade opennessΔ | 397.228 | 1 | 0.000 |
| ALL | 3620.204 | 5 | 0.000 |
| Ho: Excluded variable does not Granger-cause Equation variable Ha: Excluded variable Granger-causes Equation variable | |||
| Variables | Current AccountΔ | Budget Balance | REERΔ | GDP Growth | Total InvestmentΔ | Trade OpennessΔ |
|---|---|---|---|---|---|---|
| Lagged Current accountΔ | −0.4492705 (0.000) | −0.0759679 (0.000) | −0.0112542 (0.000) | −0.0694275 (0.000) | −0.0315228 (0.000) | −0.0055893 (0.028) |
| Lagged Budget balance | −0.1222366 (0.000) | 0.6719996 (0.000) | 0.0459064 (0.000) | 0.0966541 (0.000) | −0.1038255 (0.000) | −0.0235697 (0.002) |
| Lagged REERΔ | 0.136836 (0.003) | 0.1475119 (0.198) | 0.1966597 (0.000) | 0.4415138 (0.000) | −0.4400424 (0.000) | −0.0595654 (0.009) |
| Lagged GDP growth | 0.3784264 (0.000) | 0.3527599 (0.000) | 0.0264484 (0.083) | 0.6512119 (0.000) | 0.1763951 (0.000) | −0.0706059 (0.000) |
| Lagged Total investmentΔ | −1.301331 (0.000) | −1.248774 (0.000) | −0.342208 (0.000) | −0.376846 (0.022) | −0.1710501 (0.014) | −0.1046704 (0.000) |
| Lagged trade opennessΔ | 0.6392724 (0.000) | 0.7071824 (0.000) | 0.8909835 (0.000) | −0.2462973 (0.040) | 0.1311803 (0.034) | 0.4609399 (0.000) |
| Observations | 130 | 130 | 130 | 130 | 130 | 130 |
| Equation/Excluded | Chi2 | df | p > Chi2 |
|---|---|---|---|
| Current accountΔ | |||
| Budget balance | 28.717 | 1 | 0.000 |
| REERΔ | 8.616 | 1 | 0.003 |
| GDP growth | 66.233 | 1 | 0.000 |
| Total investmentΔ | 75.287 | 1 | 0.000 |
| Trade opennessΔ | 33.699 | 1 | 0.000 |
| ALL | 188.665 | 5 | 0.000 |
| Budget balance | |||
| Current accountΔ | 58.472 | 1 | 0.000 |
| REERΔ | 1.659 | 1 | 0.198 |
| GDP growth | 30.237 | 1 | 0.000 |
| Total investmentΔ | 97.756 | 1 | 0.000 |
| Trade opennessΔ | 24.088 | 1 | 0.000 |
| ALL | 143.399 | 5 | 0.000 |
| Ho: Excluded variable does not Granger-cause Equation variable Ha: Excluded variable Granger-causes Equation variable Δ: Change in REER | |||
Publisher’s Note: MDPI stays neutral with regard to jurisdictional claims in published maps and institutional affiliations. |
© 2021 by the authors. Licensee MDPI, Basel, Switzerland. This article is an open access article distributed under the terms and conditions of the Creative Commons Attribution (CC BY) license (https://creativecommons.org/licenses/by/4.0/).
Share and Cite
El-Khishin, S.; El-Saeed, J. The Twin Deficit Hypothesis in the MENA Region: Do Geopolitics Matter? Economies 2021, 9, 124. https://doi.org/10.3390/economies9030124
El-Khishin S, El-Saeed J. The Twin Deficit Hypothesis in the MENA Region: Do Geopolitics Matter? Economies. 2021; 9(3):124. https://doi.org/10.3390/economies9030124
Chicago/Turabian StyleEl-Khishin, Sarah, and Jailan El-Saeed. 2021. "The Twin Deficit Hypothesis in the MENA Region: Do Geopolitics Matter?" Economies 9, no. 3: 124. https://doi.org/10.3390/economies9030124
APA StyleEl-Khishin, S., & El-Saeed, J. (2021). The Twin Deficit Hypothesis in the MENA Region: Do Geopolitics Matter? Economies, 9(3), 124. https://doi.org/10.3390/economies9030124


