Transmission Channels of Central Bank Asset Purchases in the Irish Economy


Abstract
1. Introduction
2. Literature Review
2.1. Portfolio Rebalancing Channel
2.2. The Signalling Channel
2.3. Bank Lending Channel
3. Data Description and Analysis
4. Findings
4.1. The PSPP and the Irish Economy
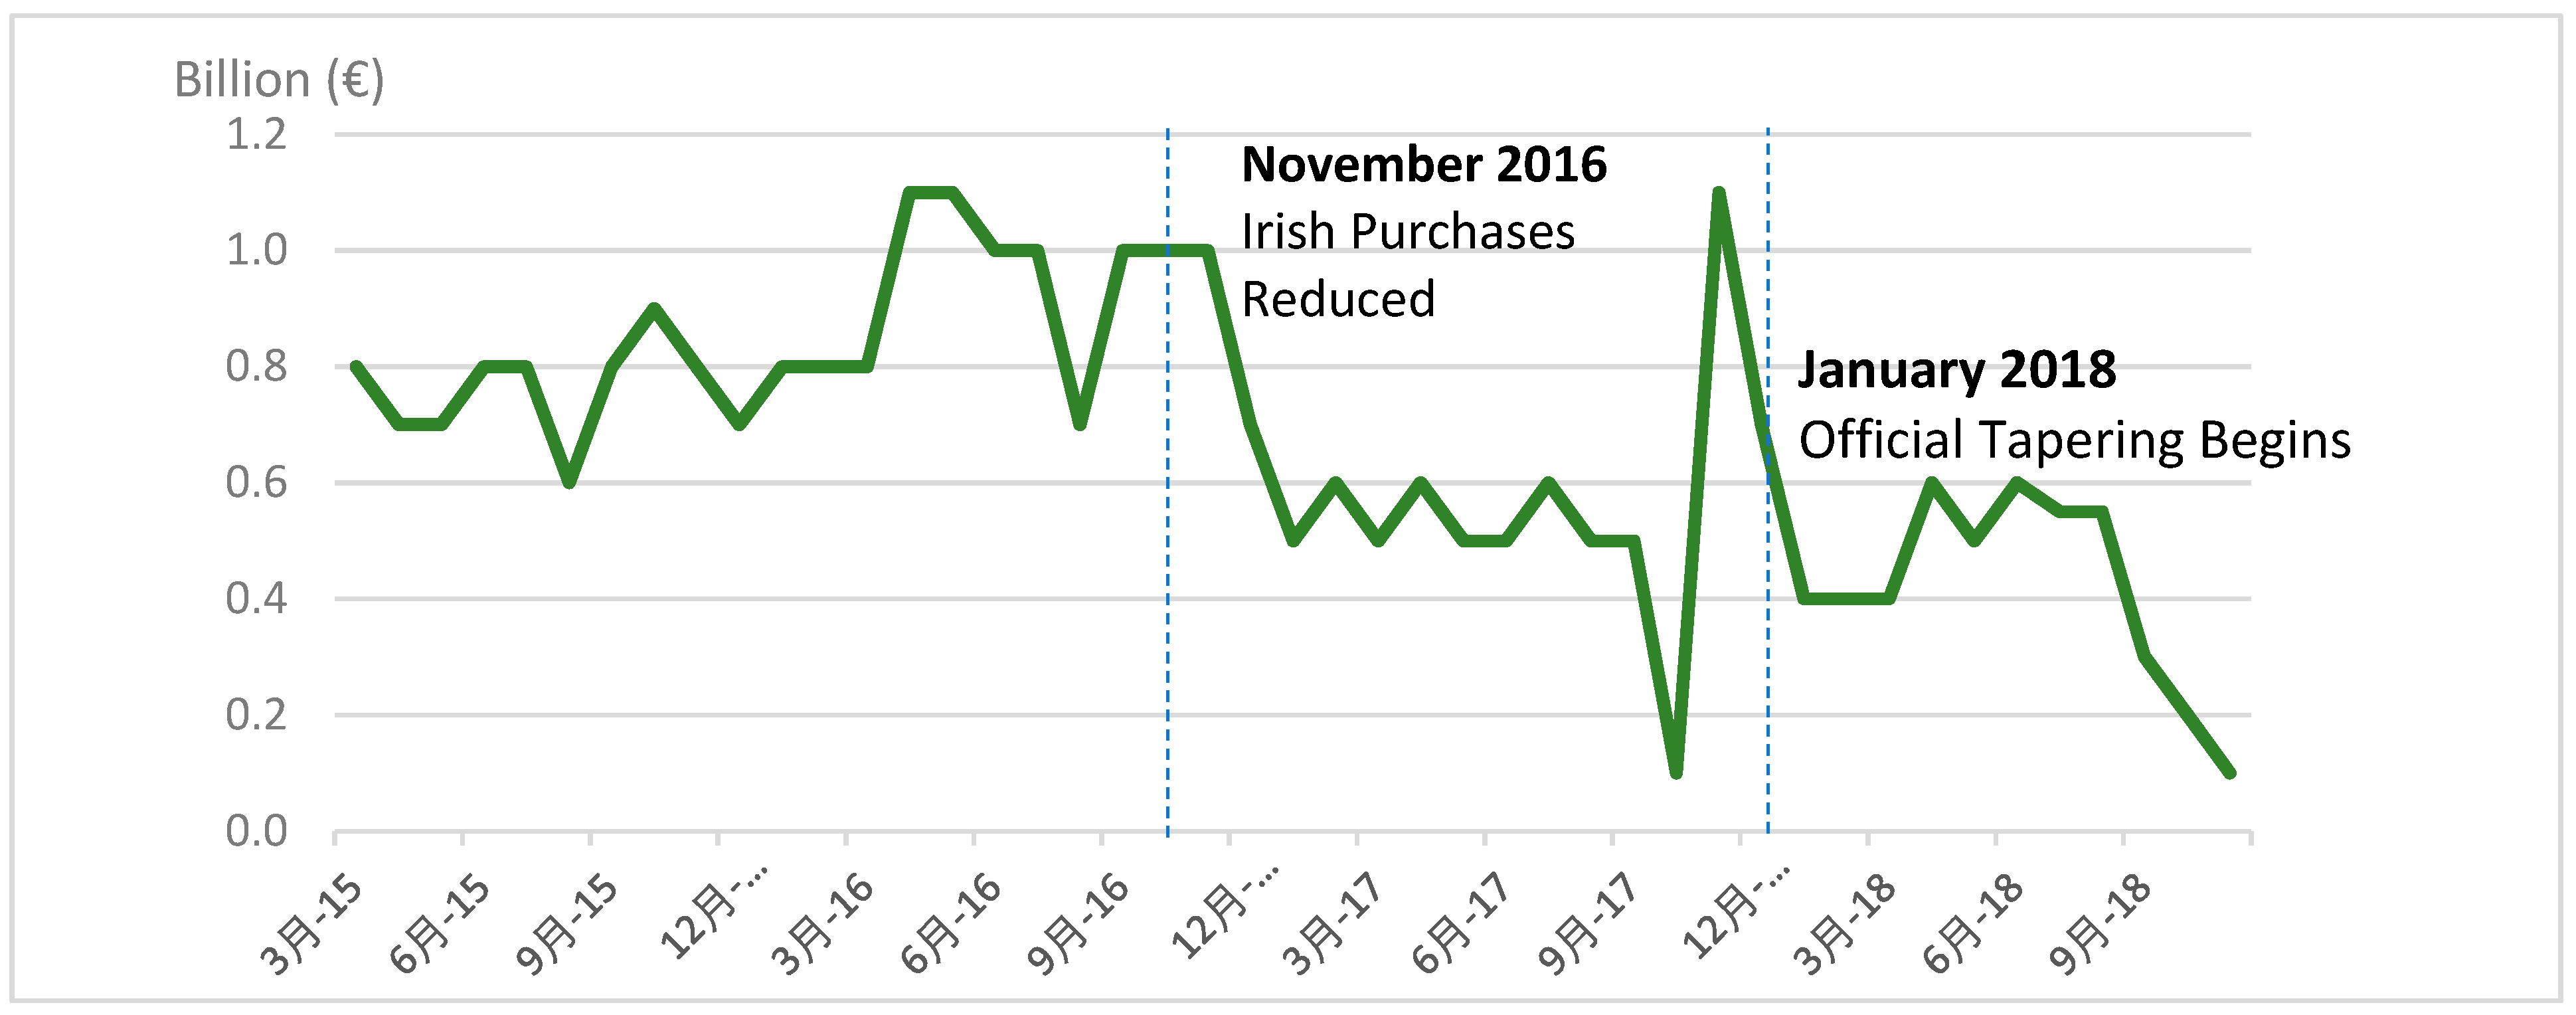
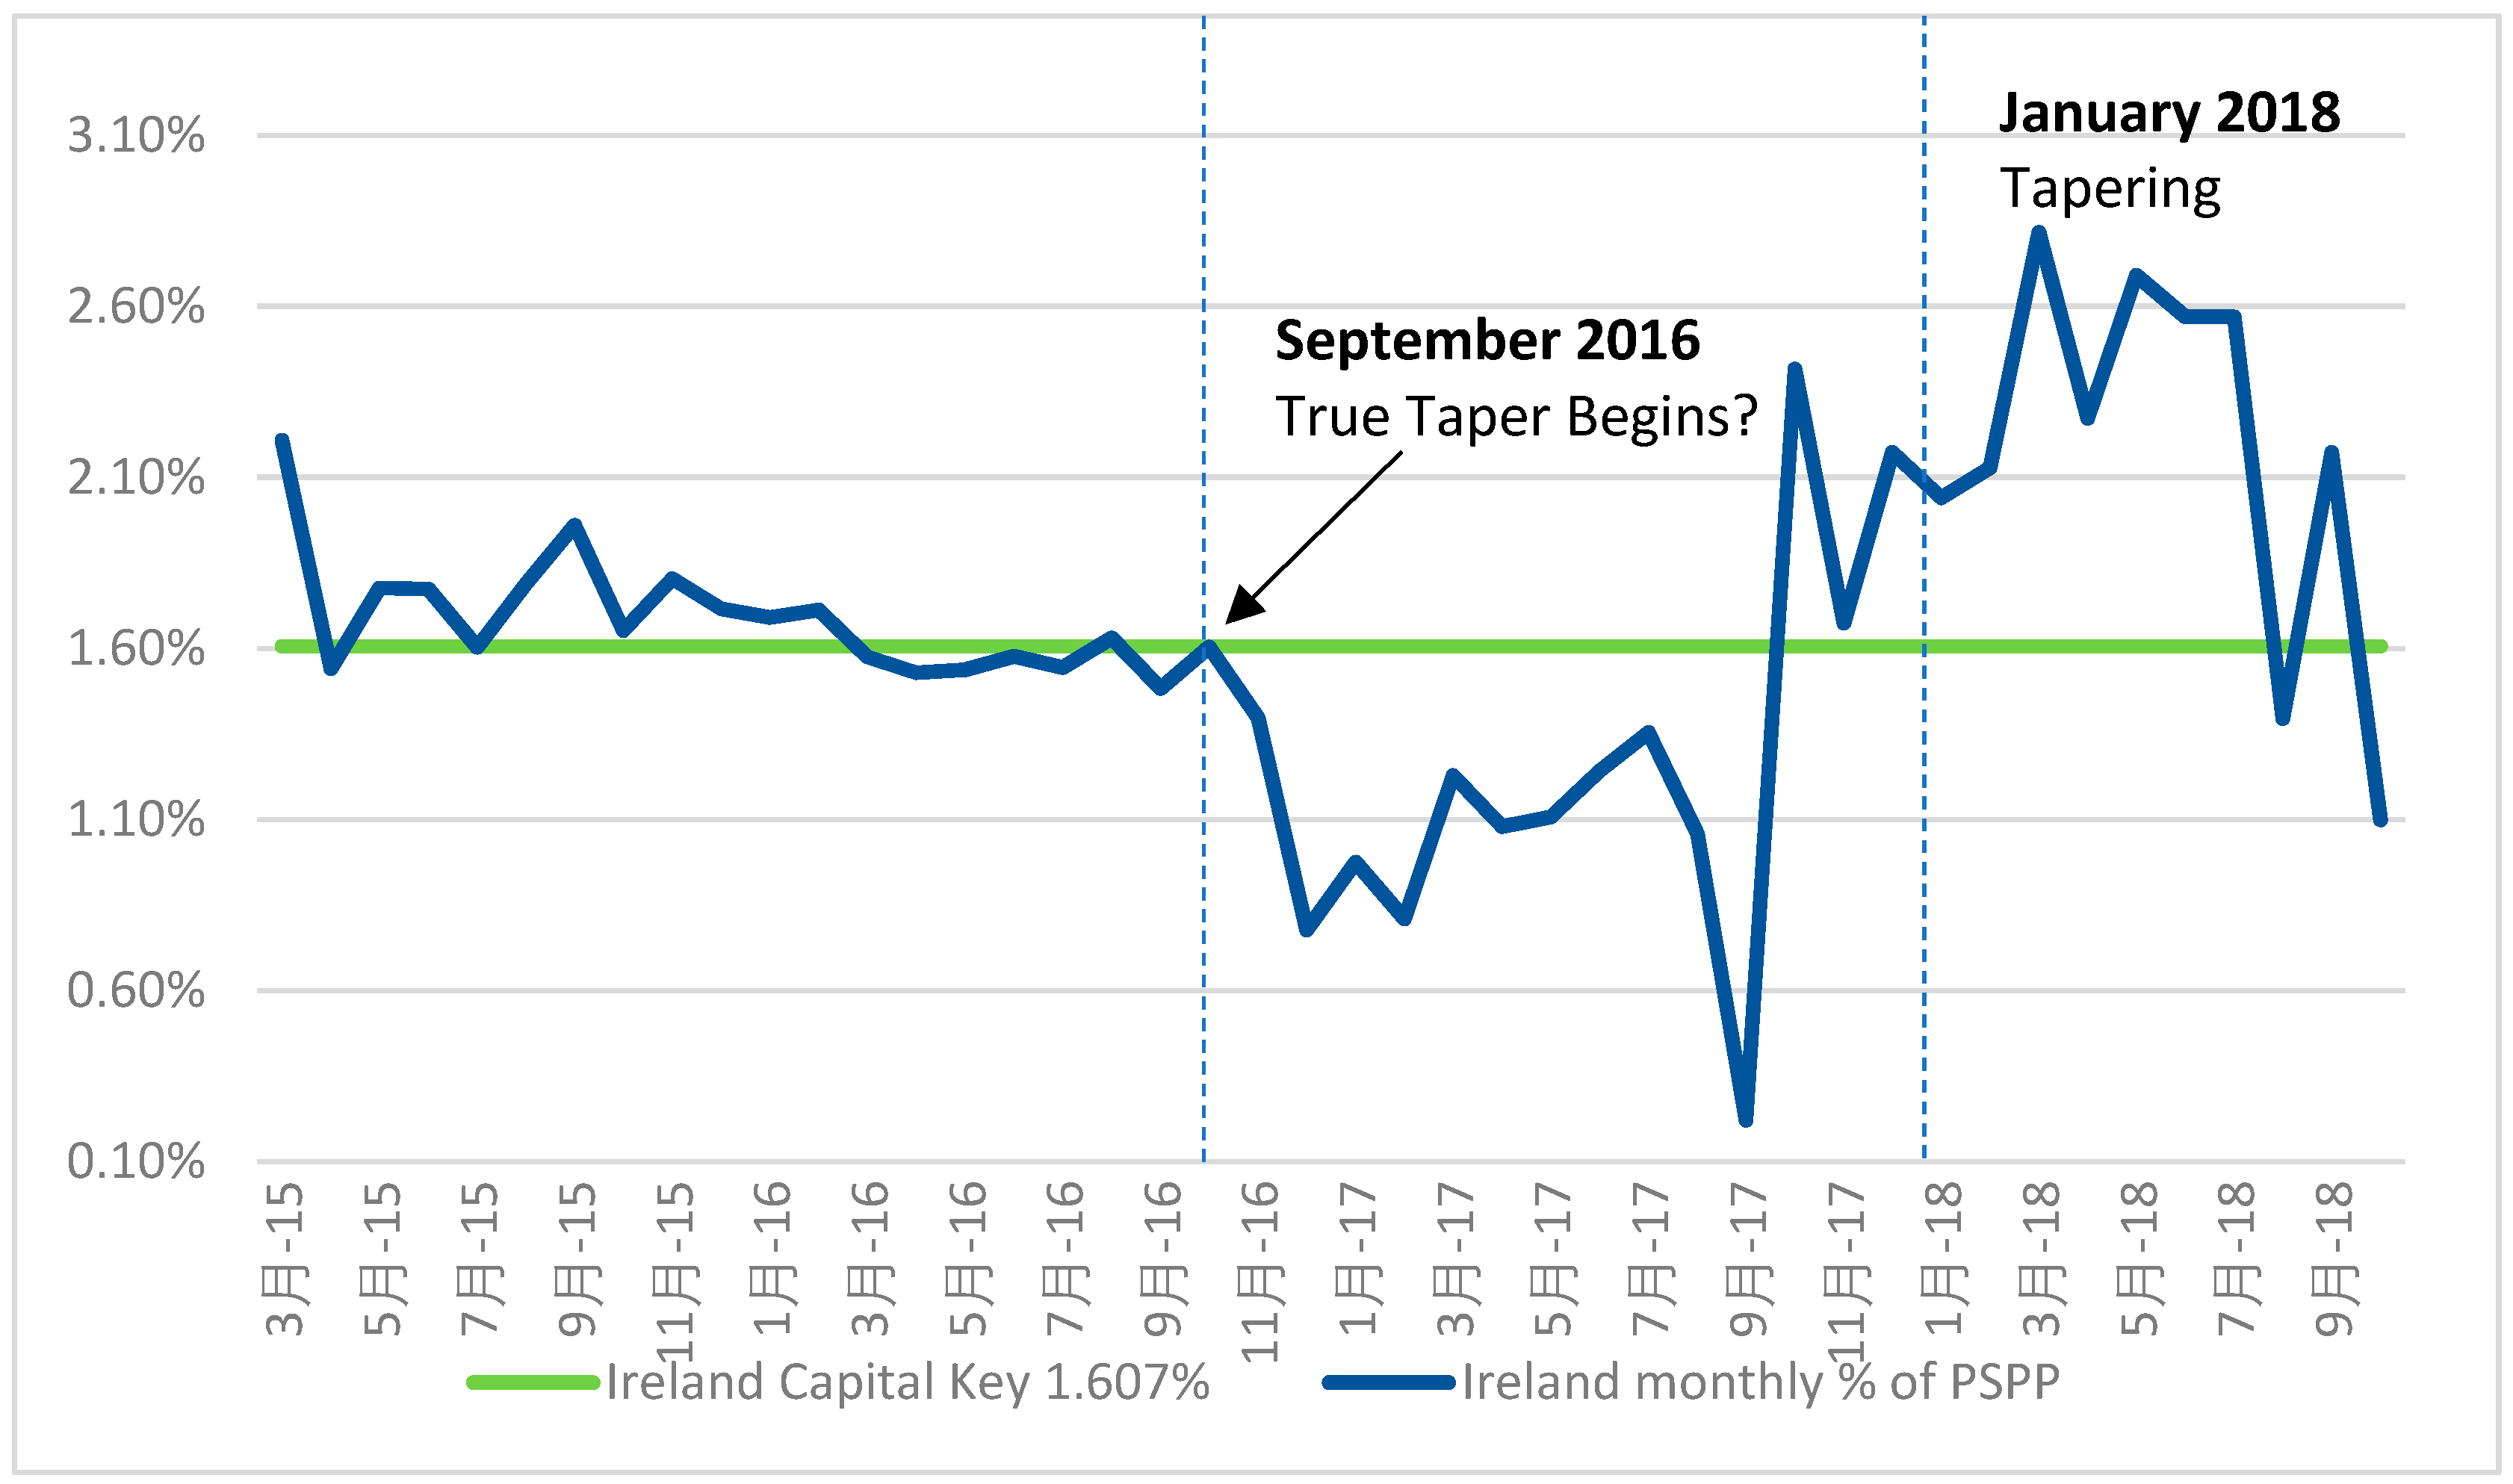
4.1.1. Description of the Irish PSPP
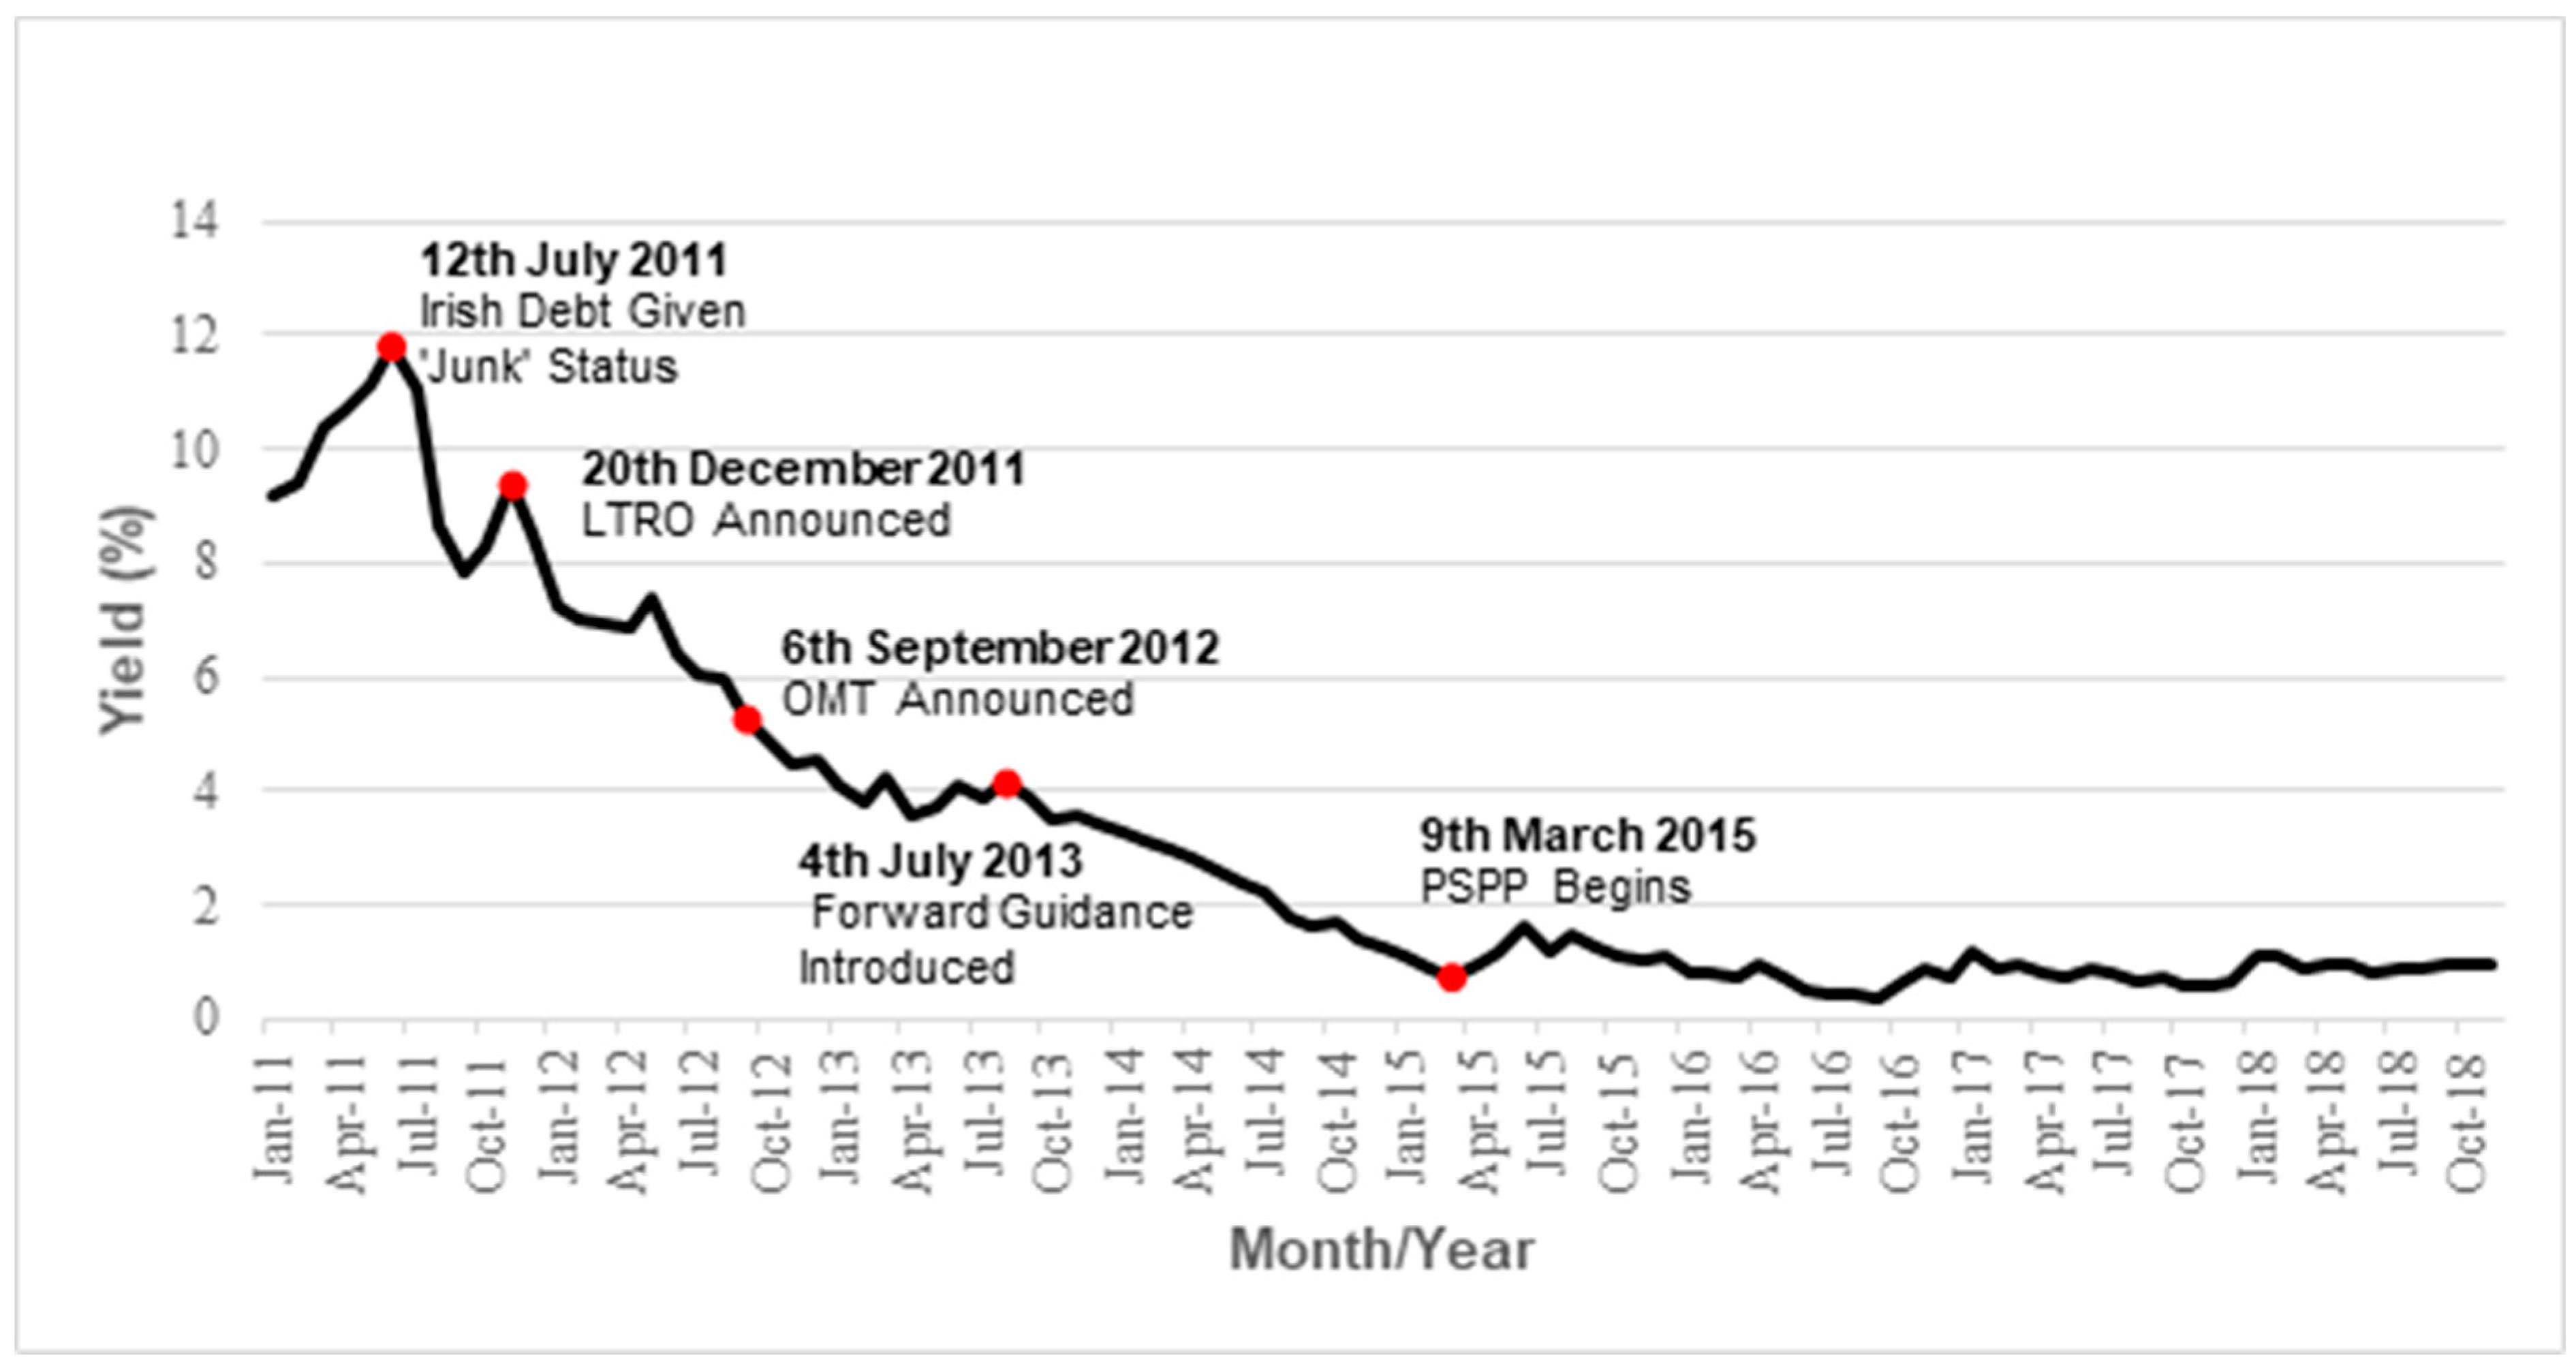
4.1.2. Impact on Irish Government Bond Yields
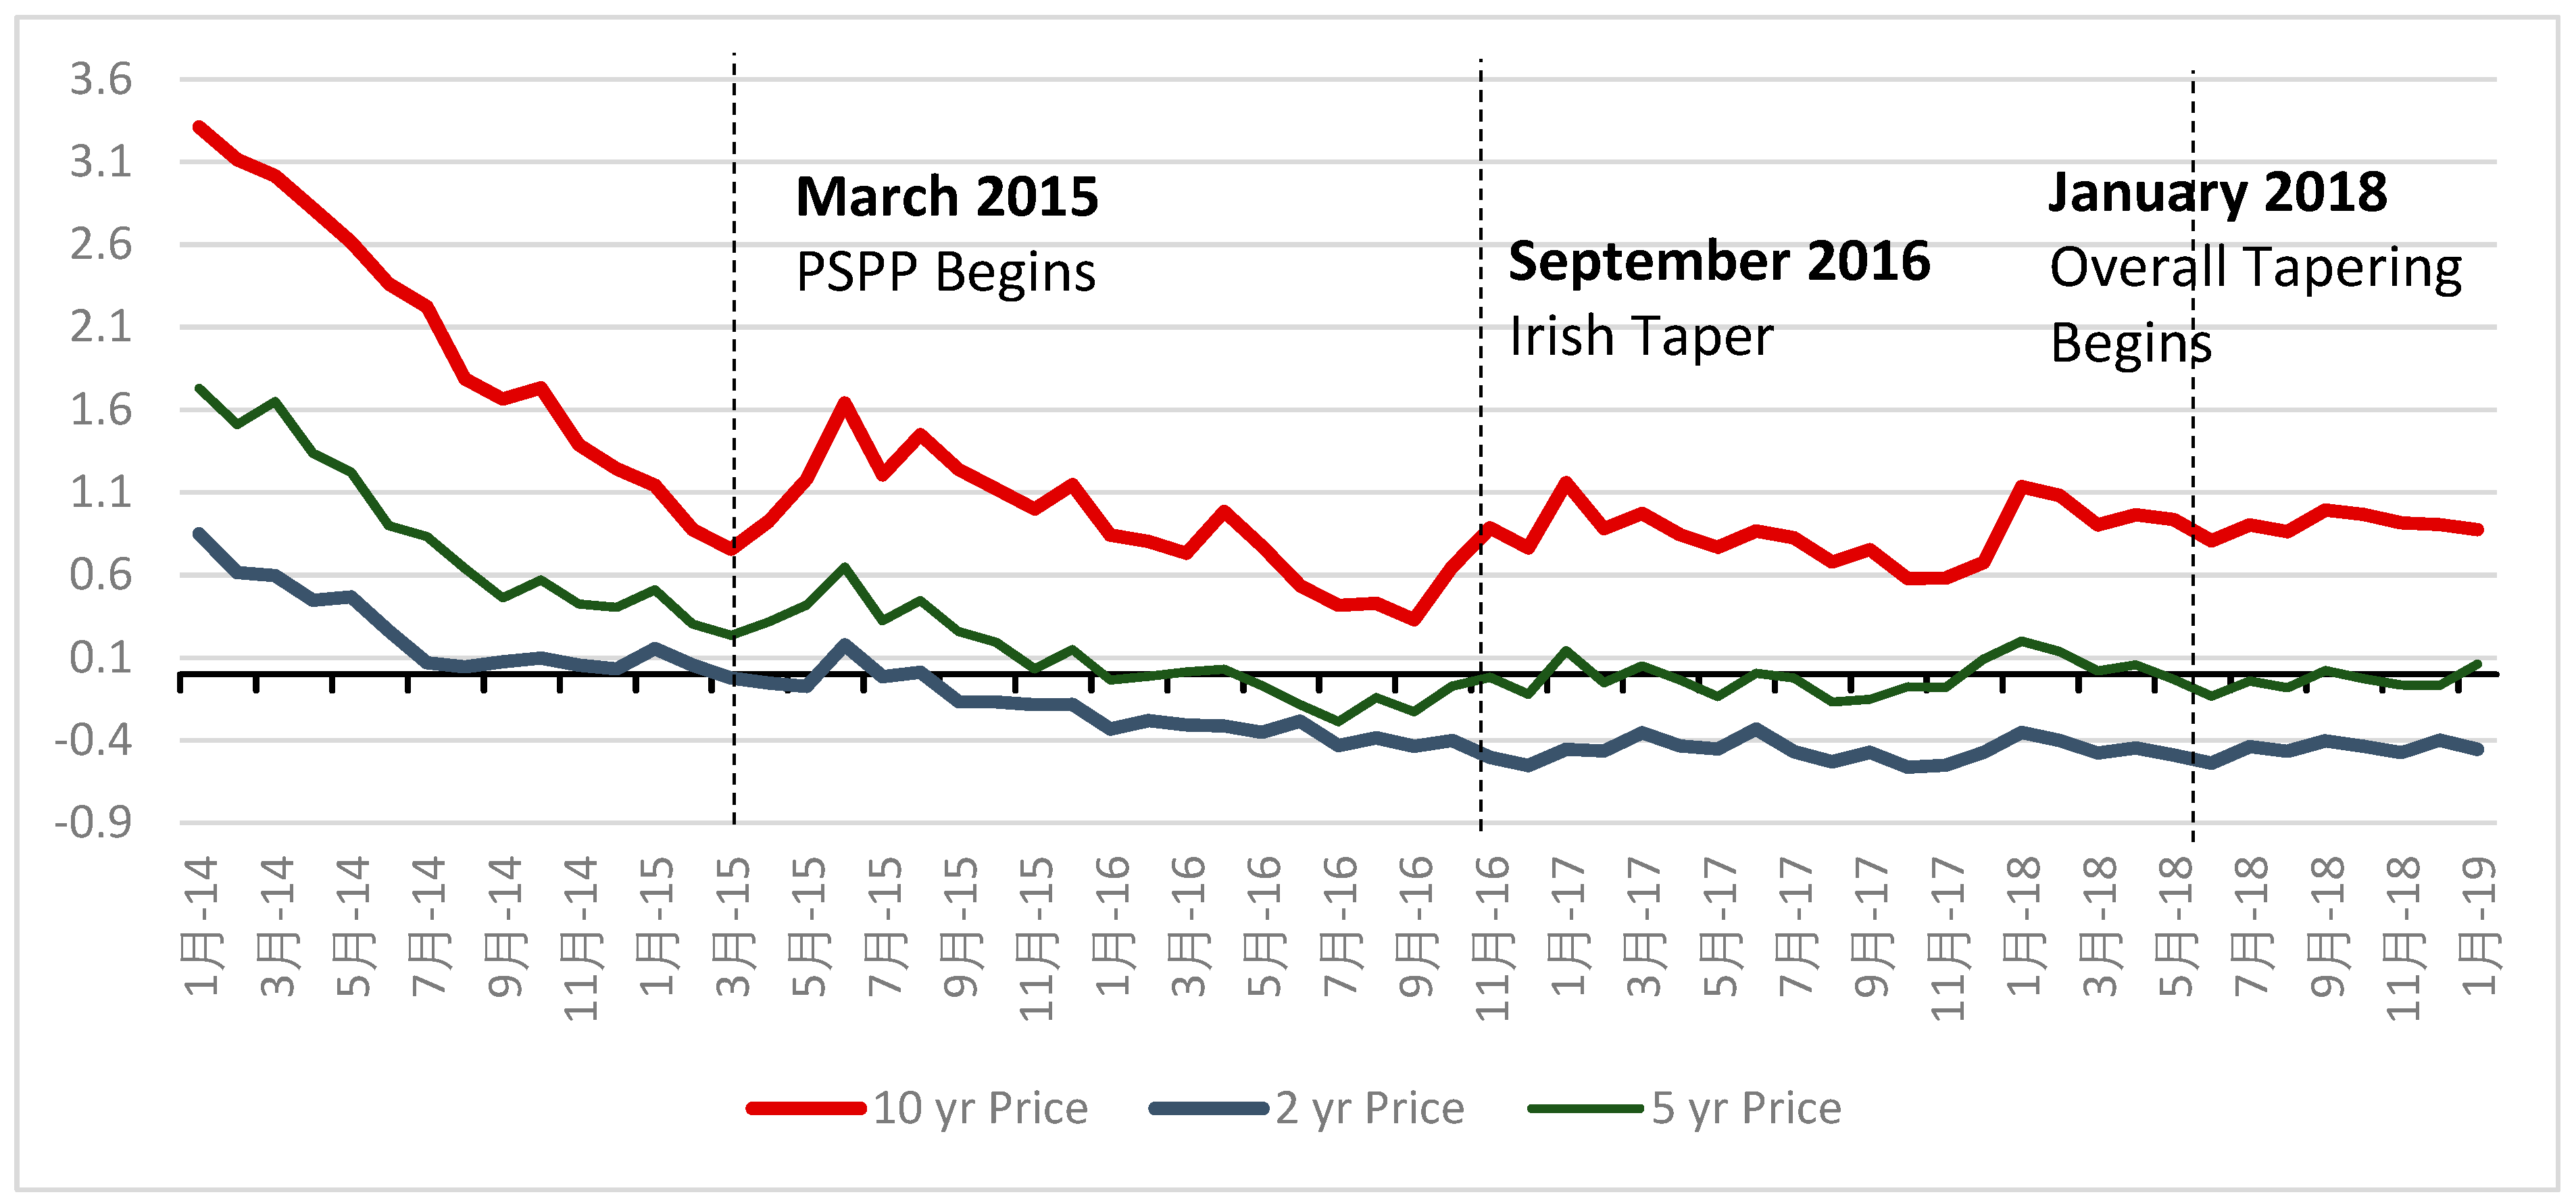
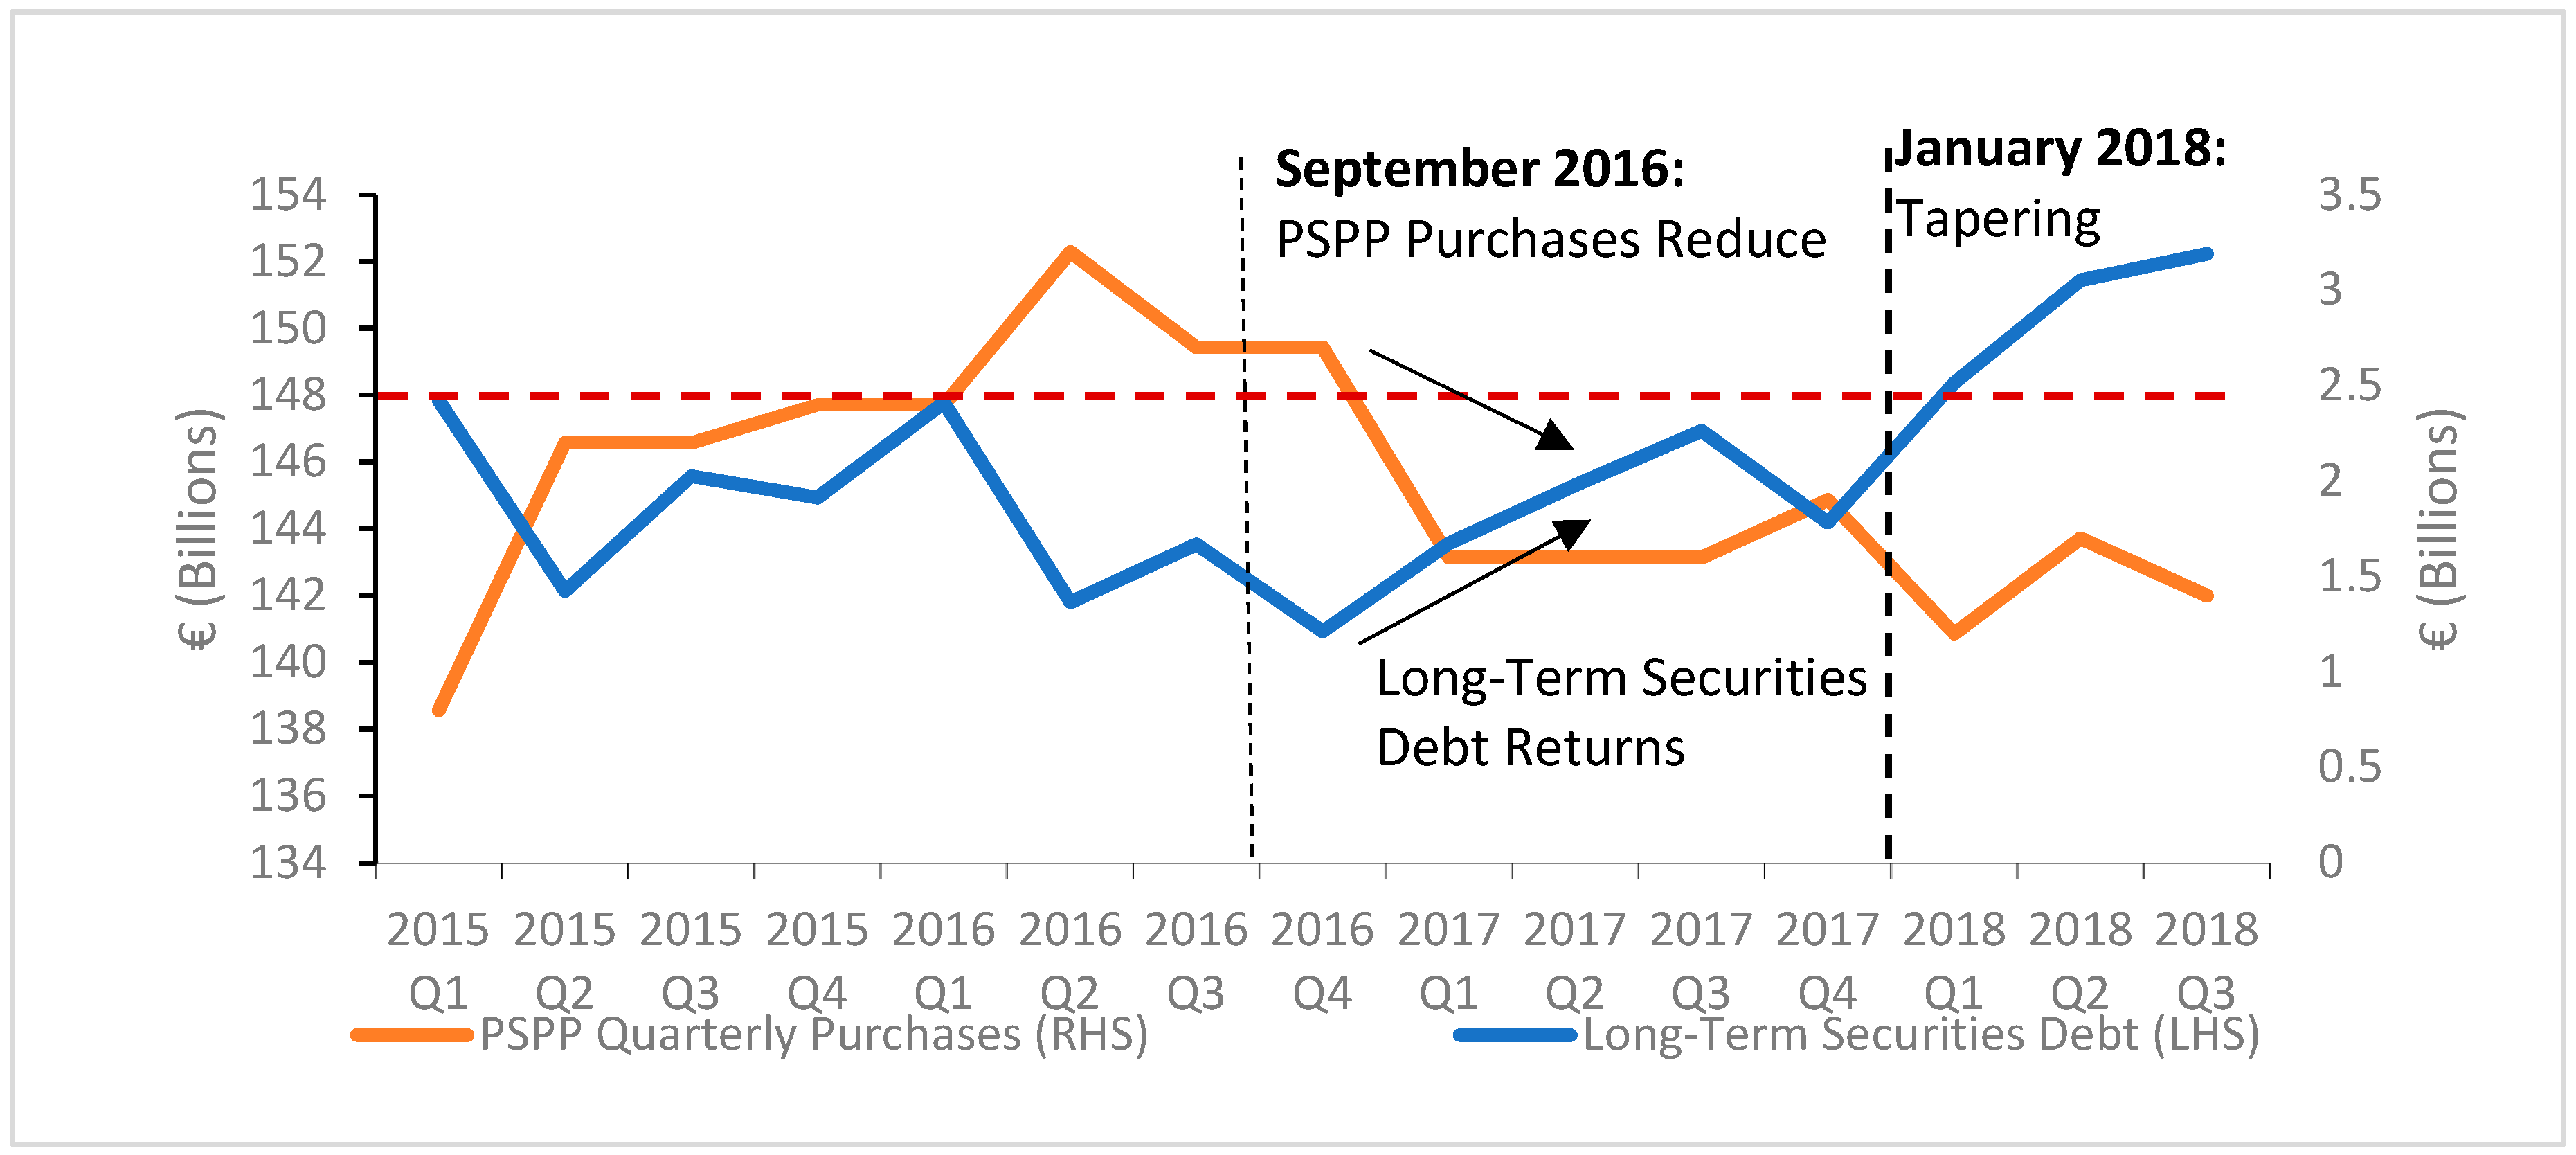
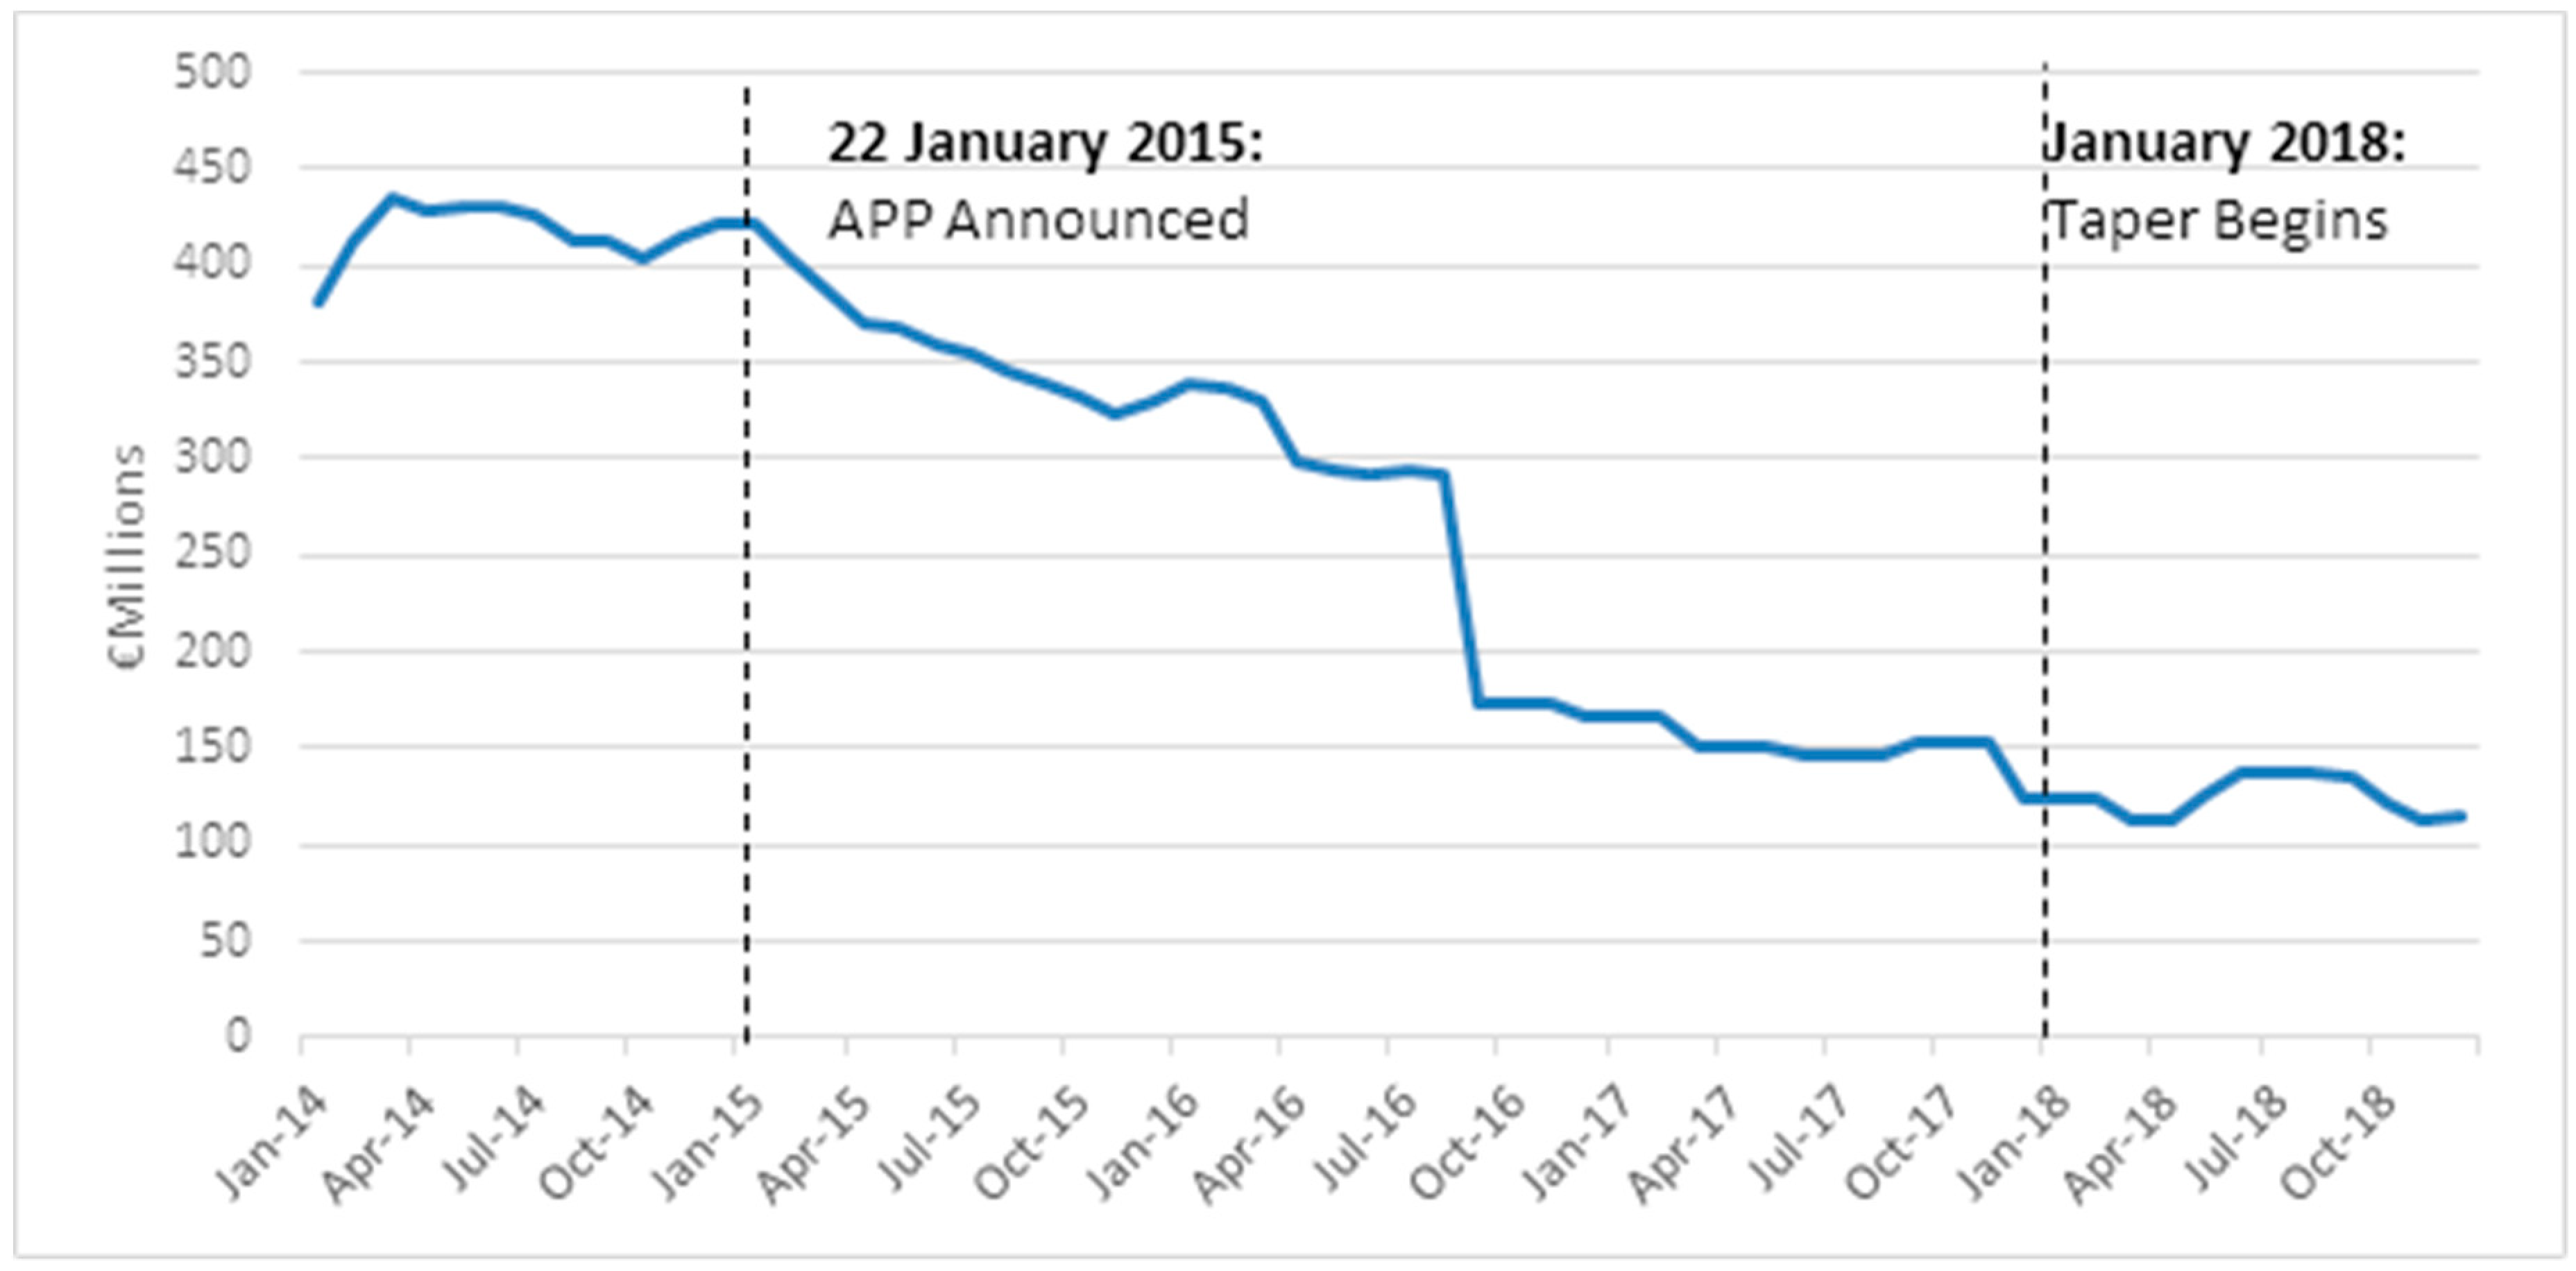
4.1.3. Impact of PSPP on Irish Long-Term Debt
4.2. The CSPP and Corporate Bonds
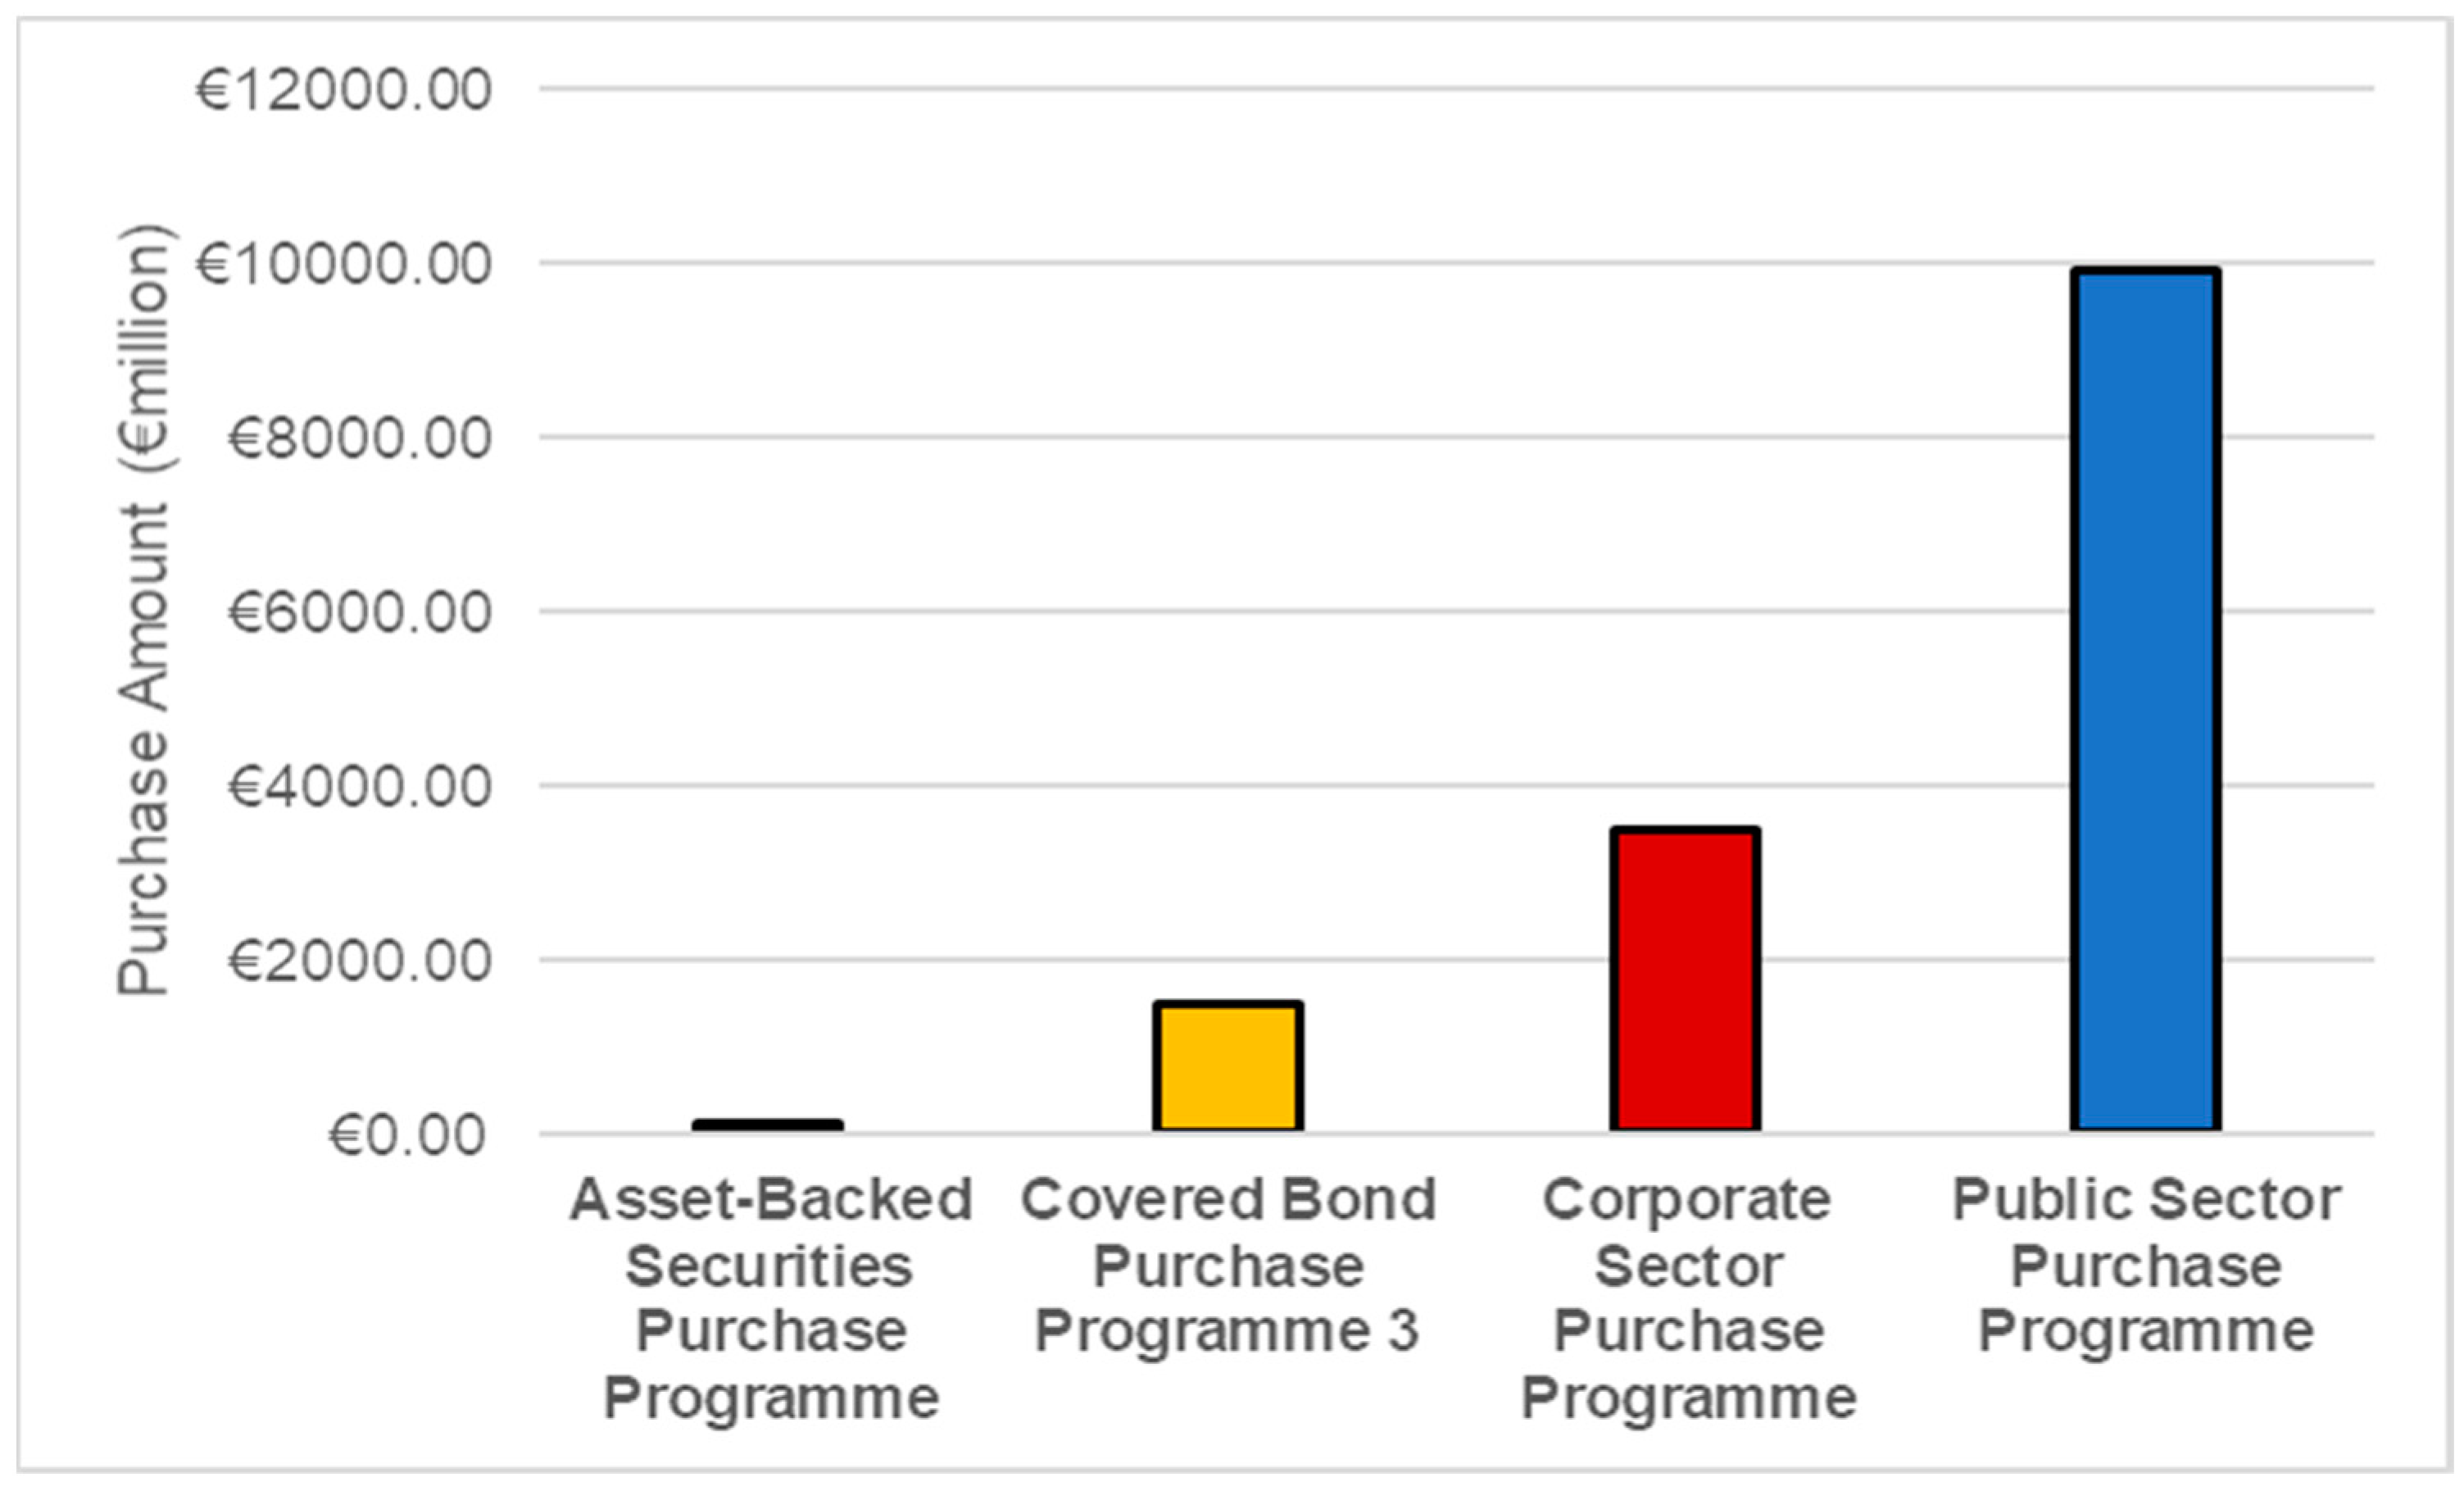
4.2.1. The CSPP in Ireland
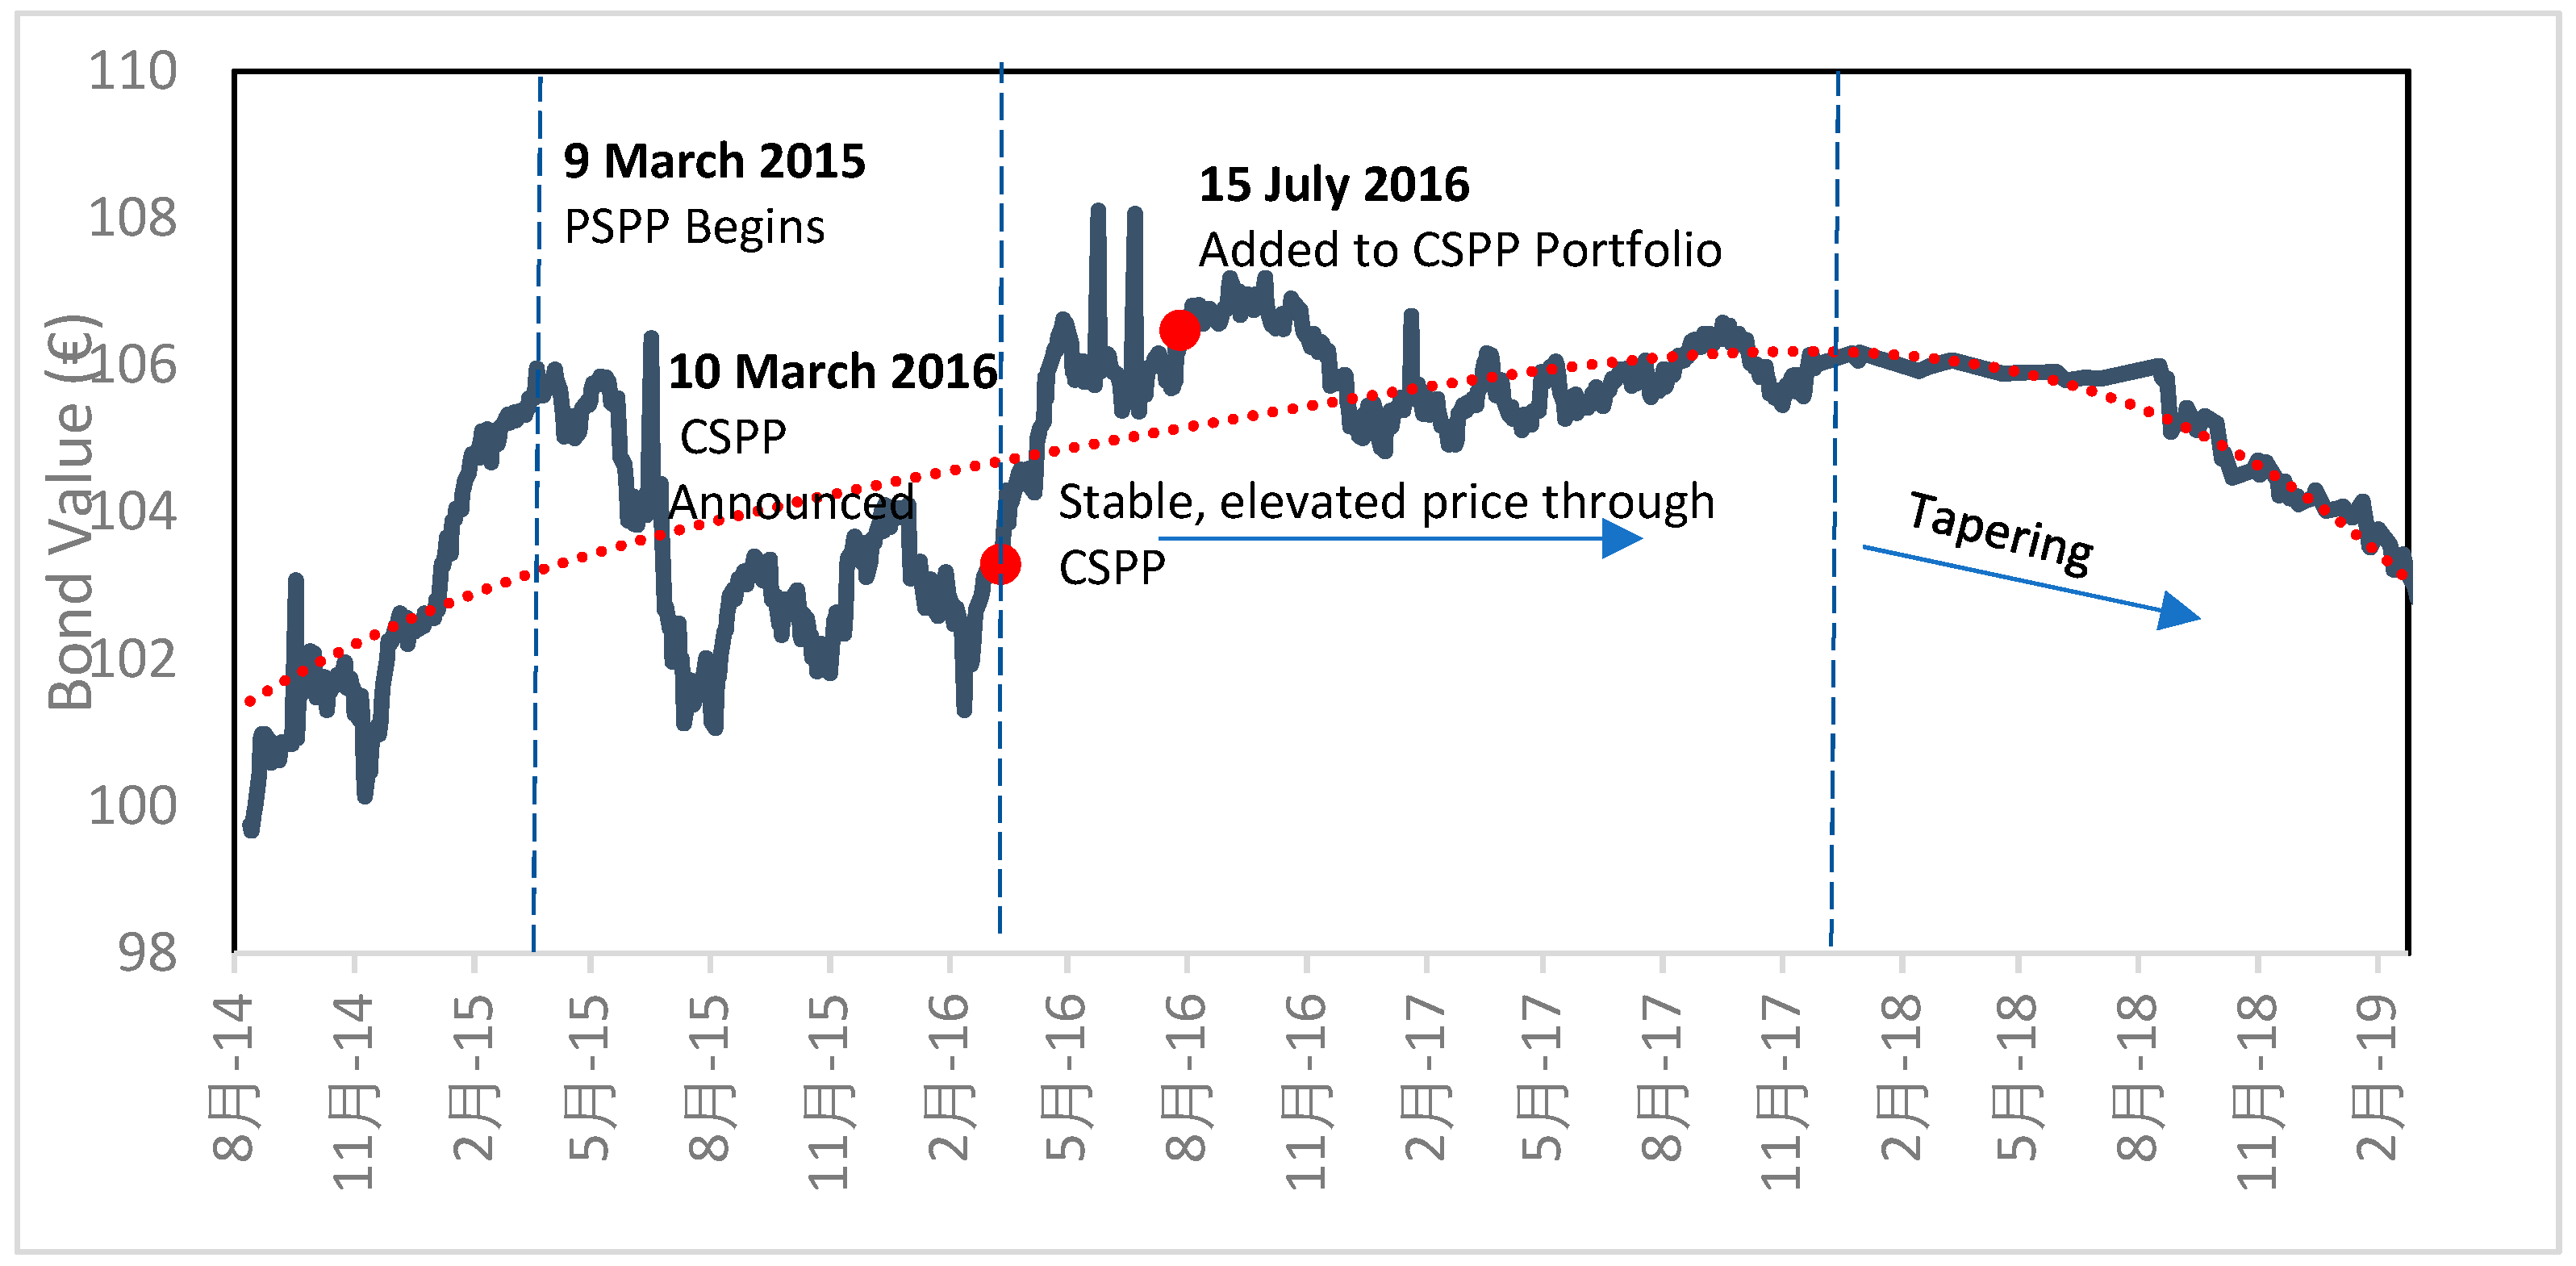
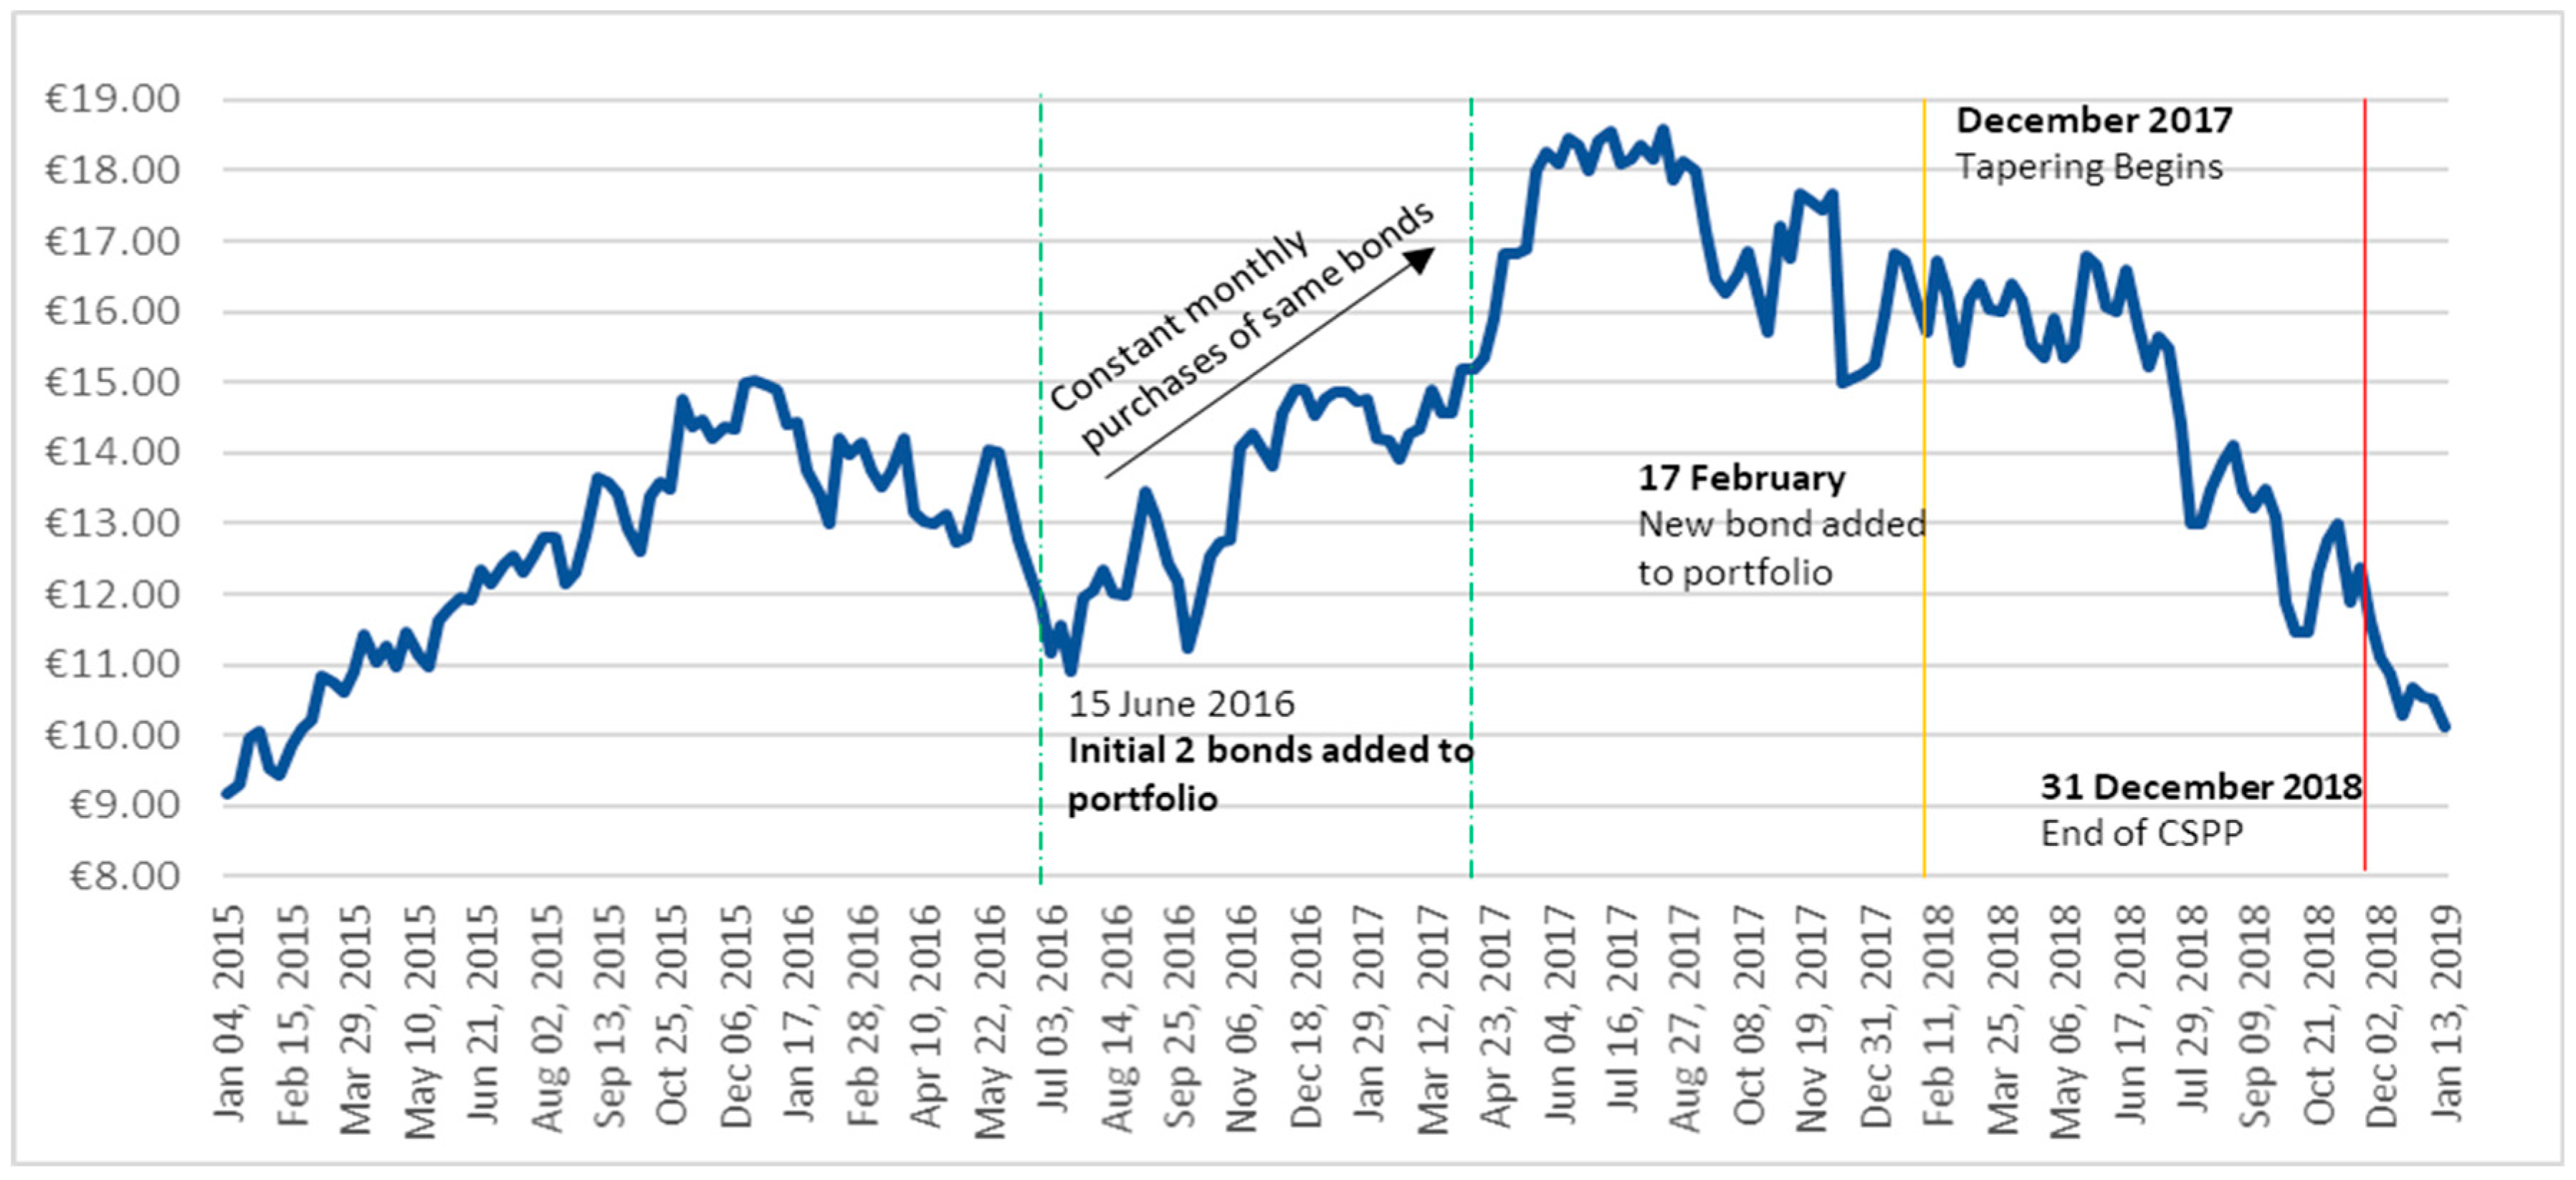
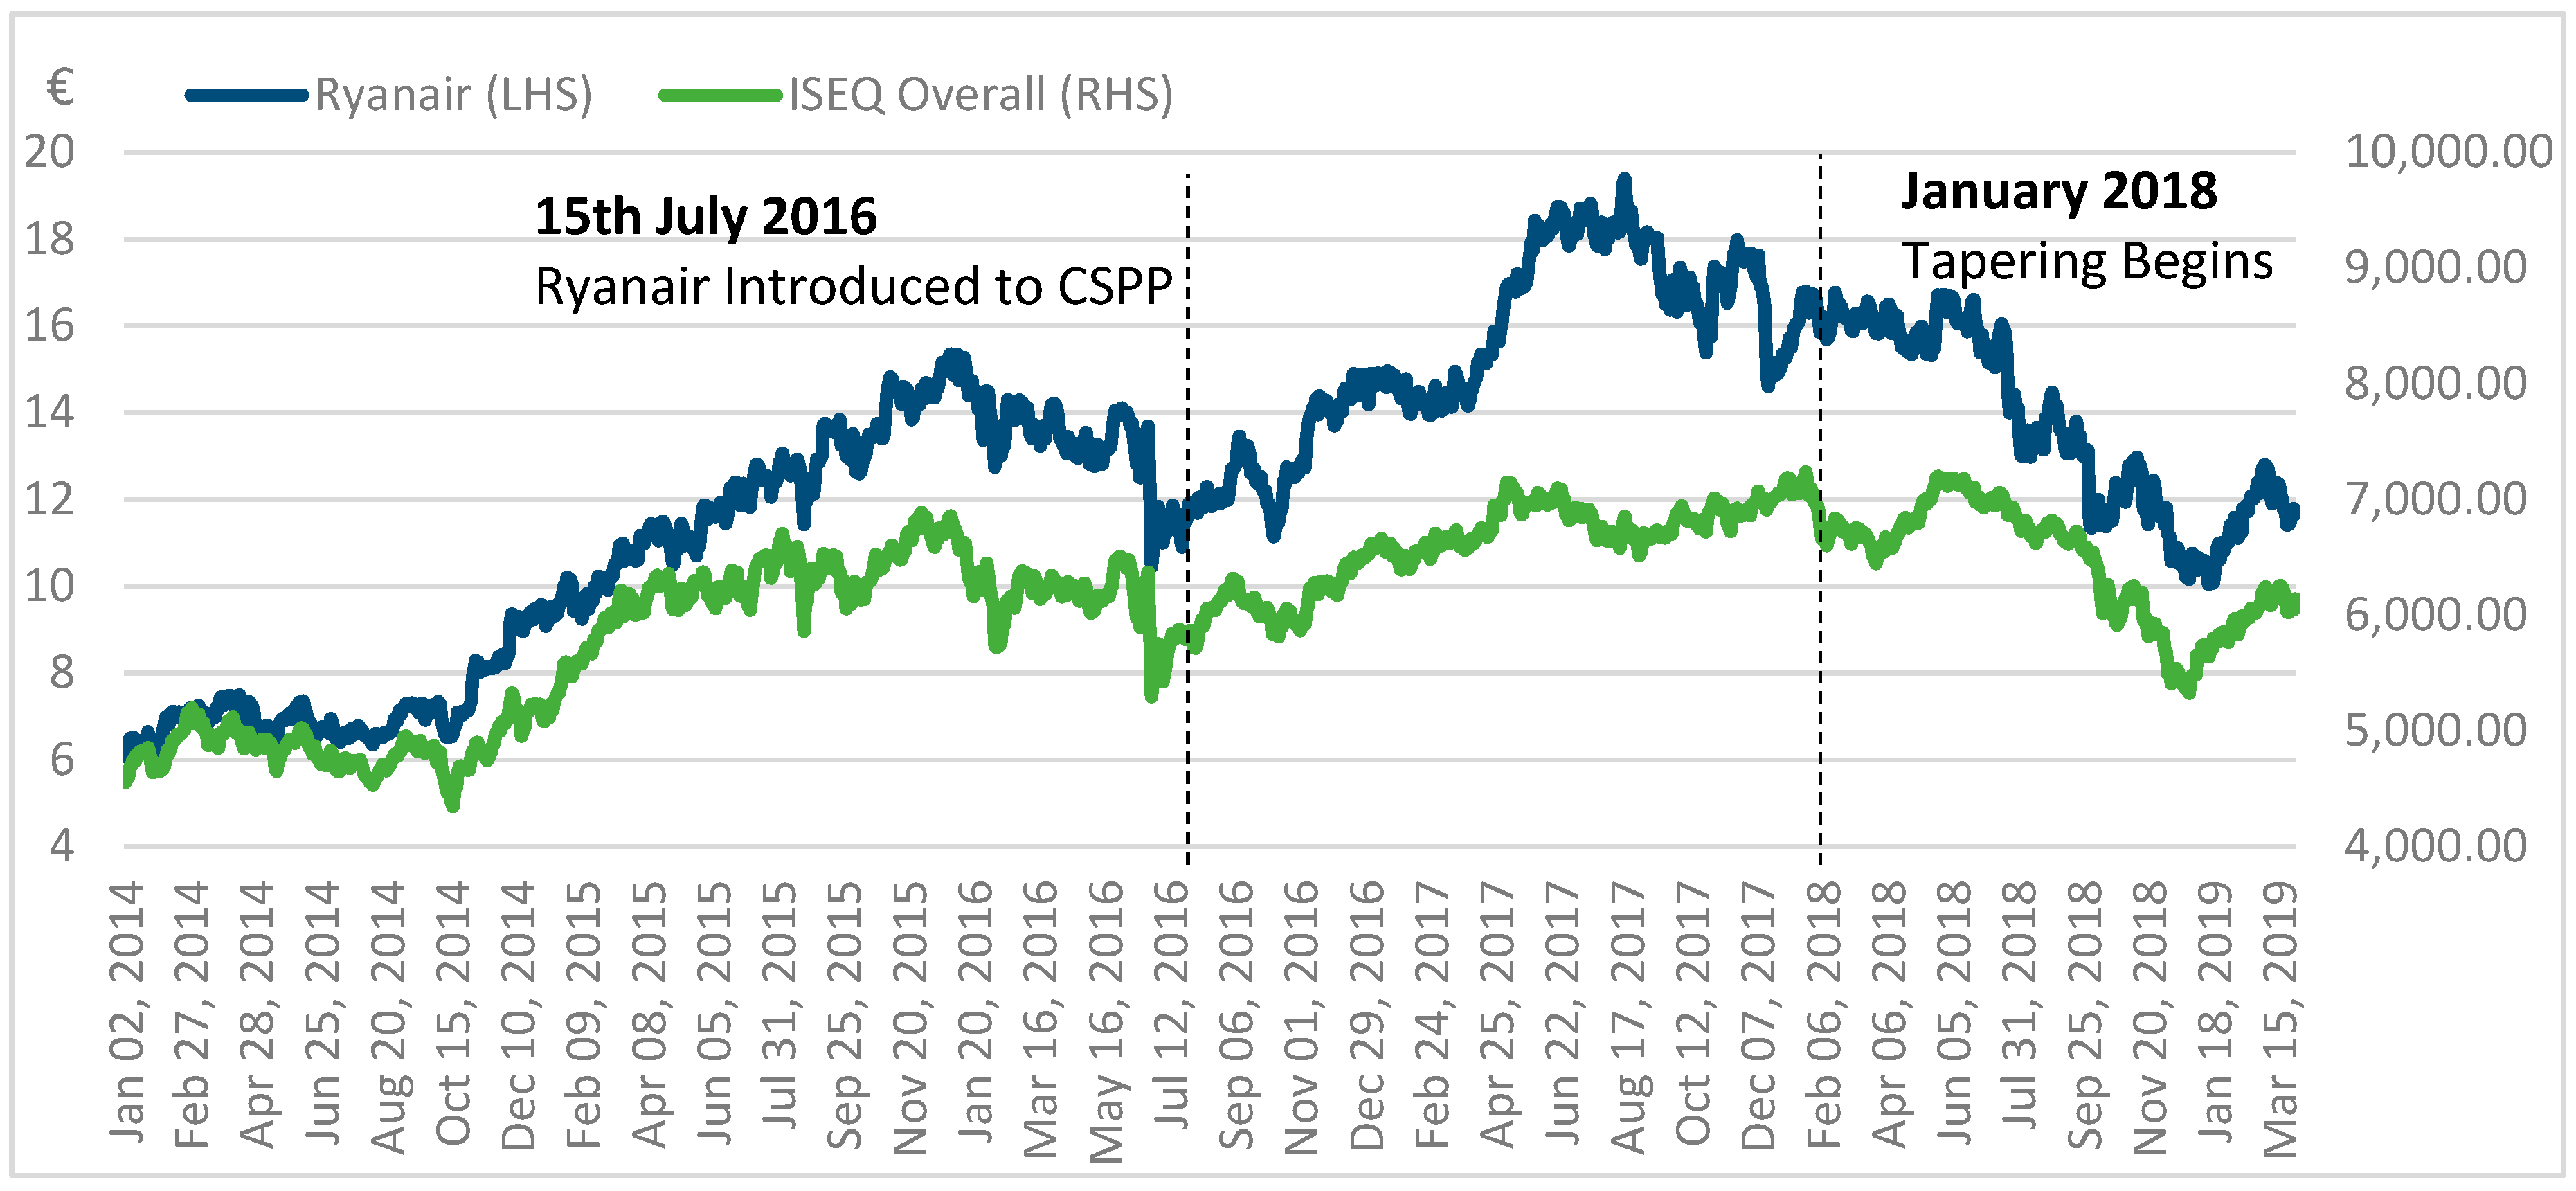
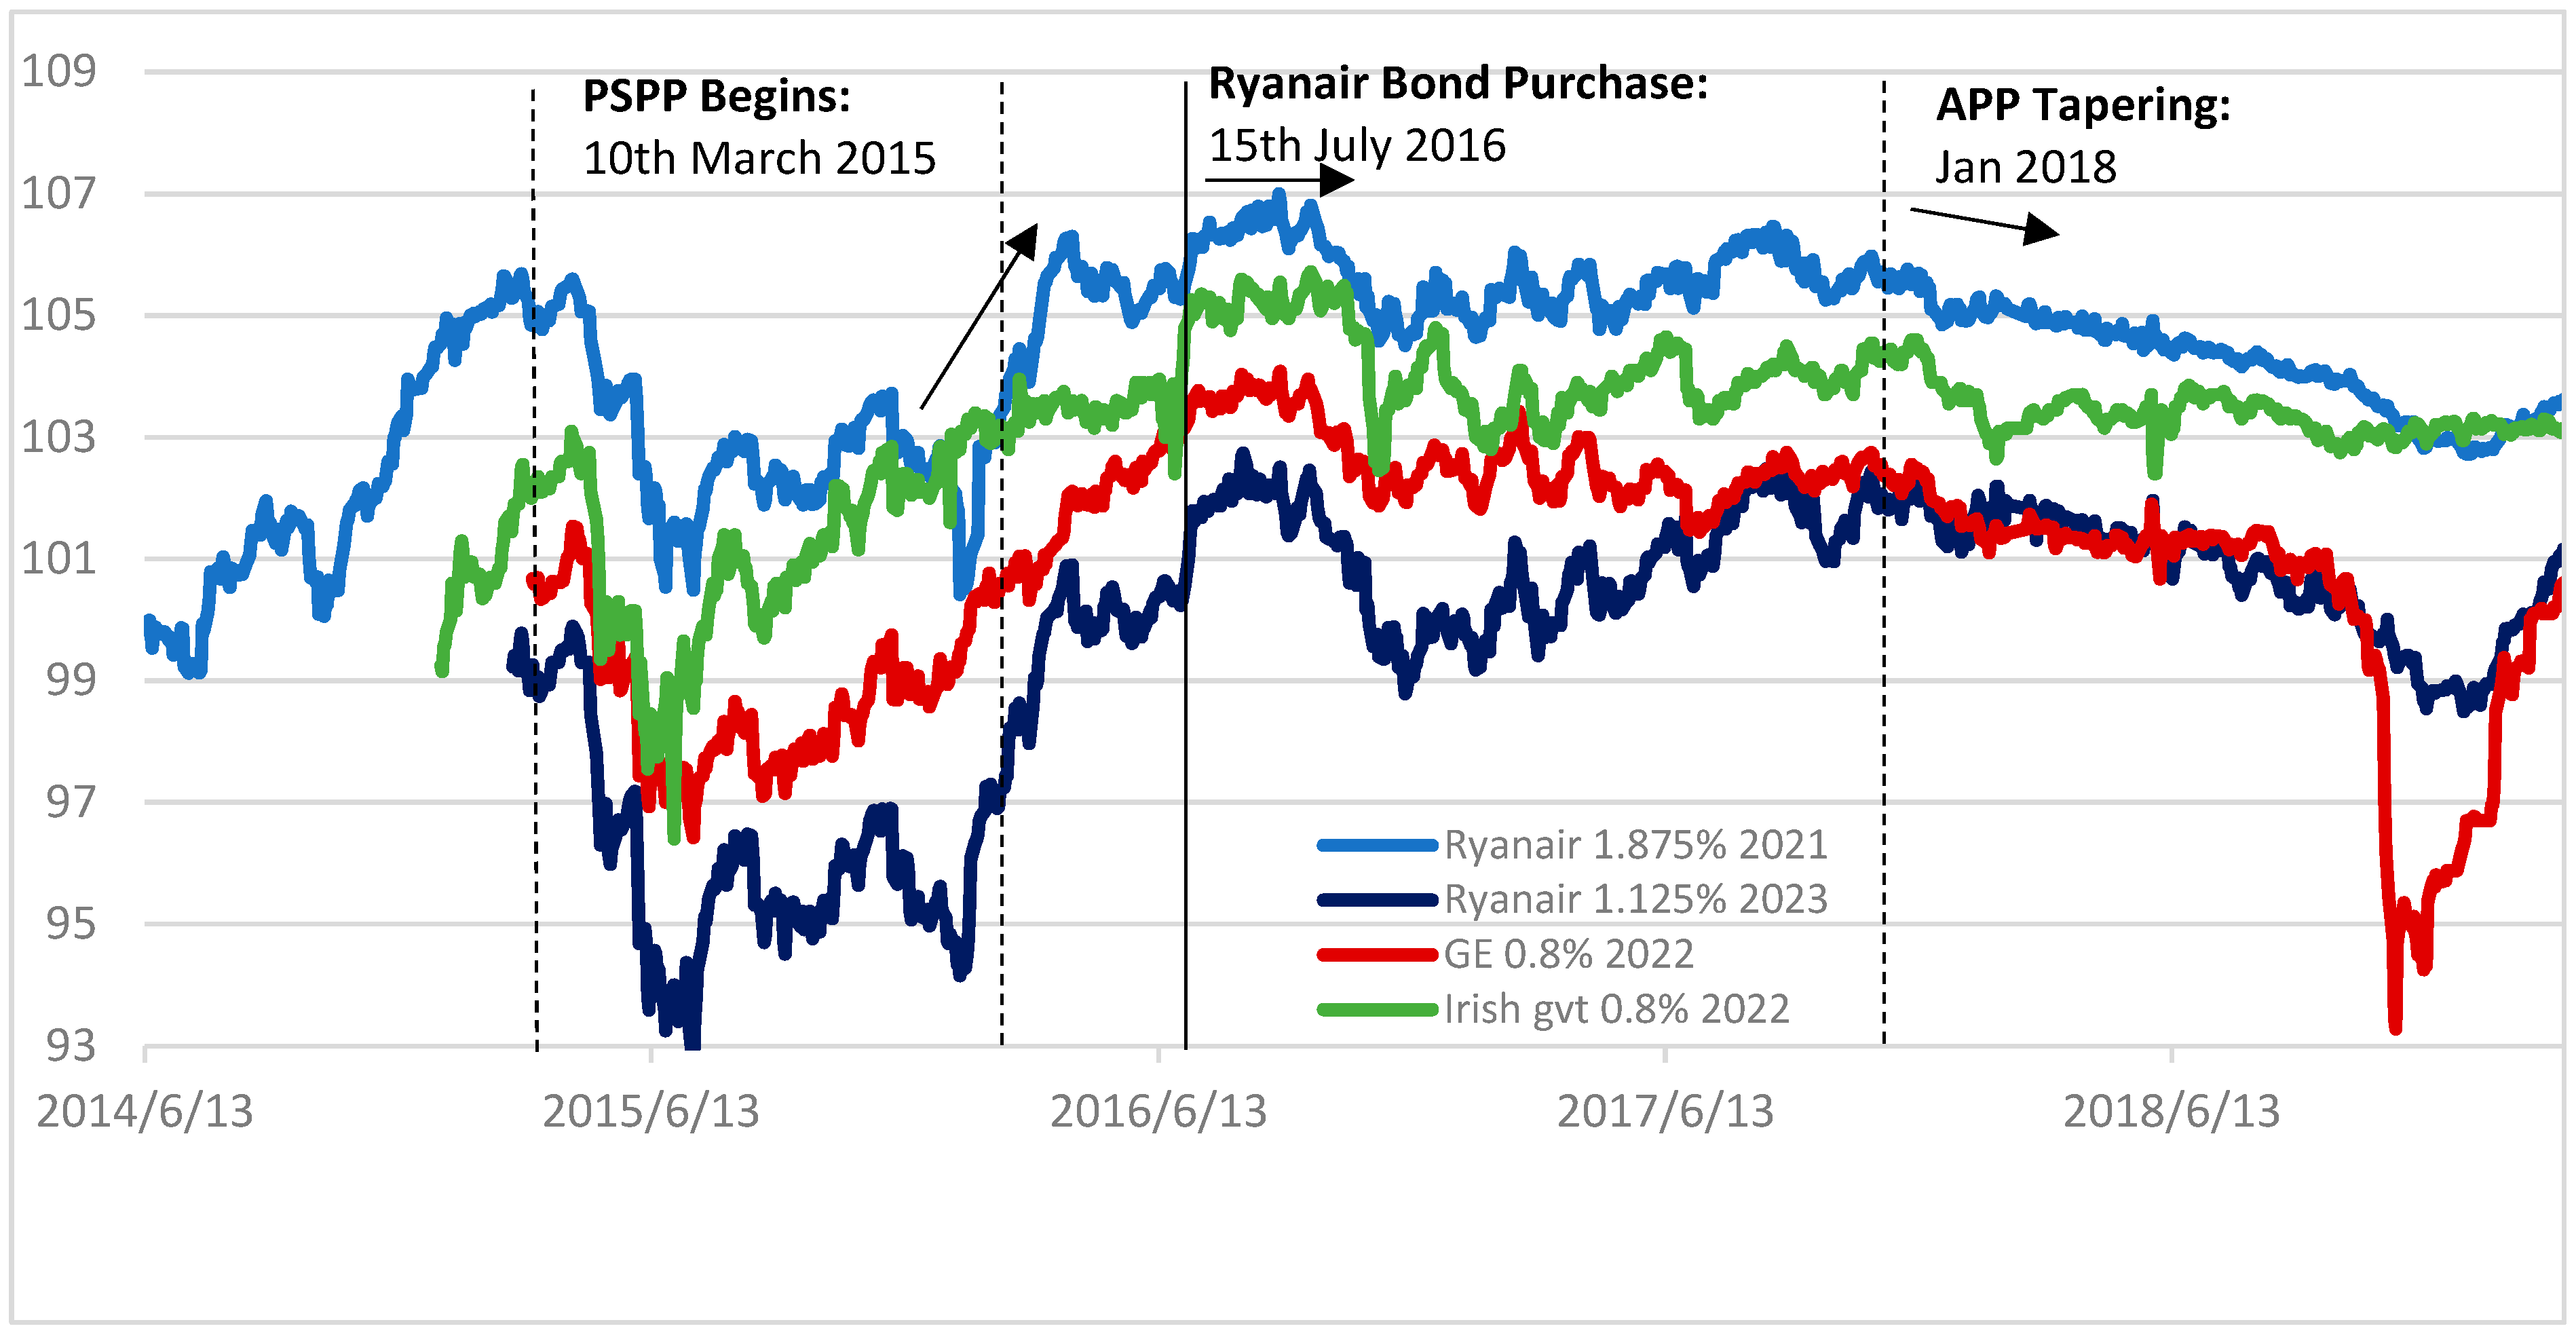
4.2.2. CSPP Case Study: Ryanair
4.2.3. CSPP Spillovers
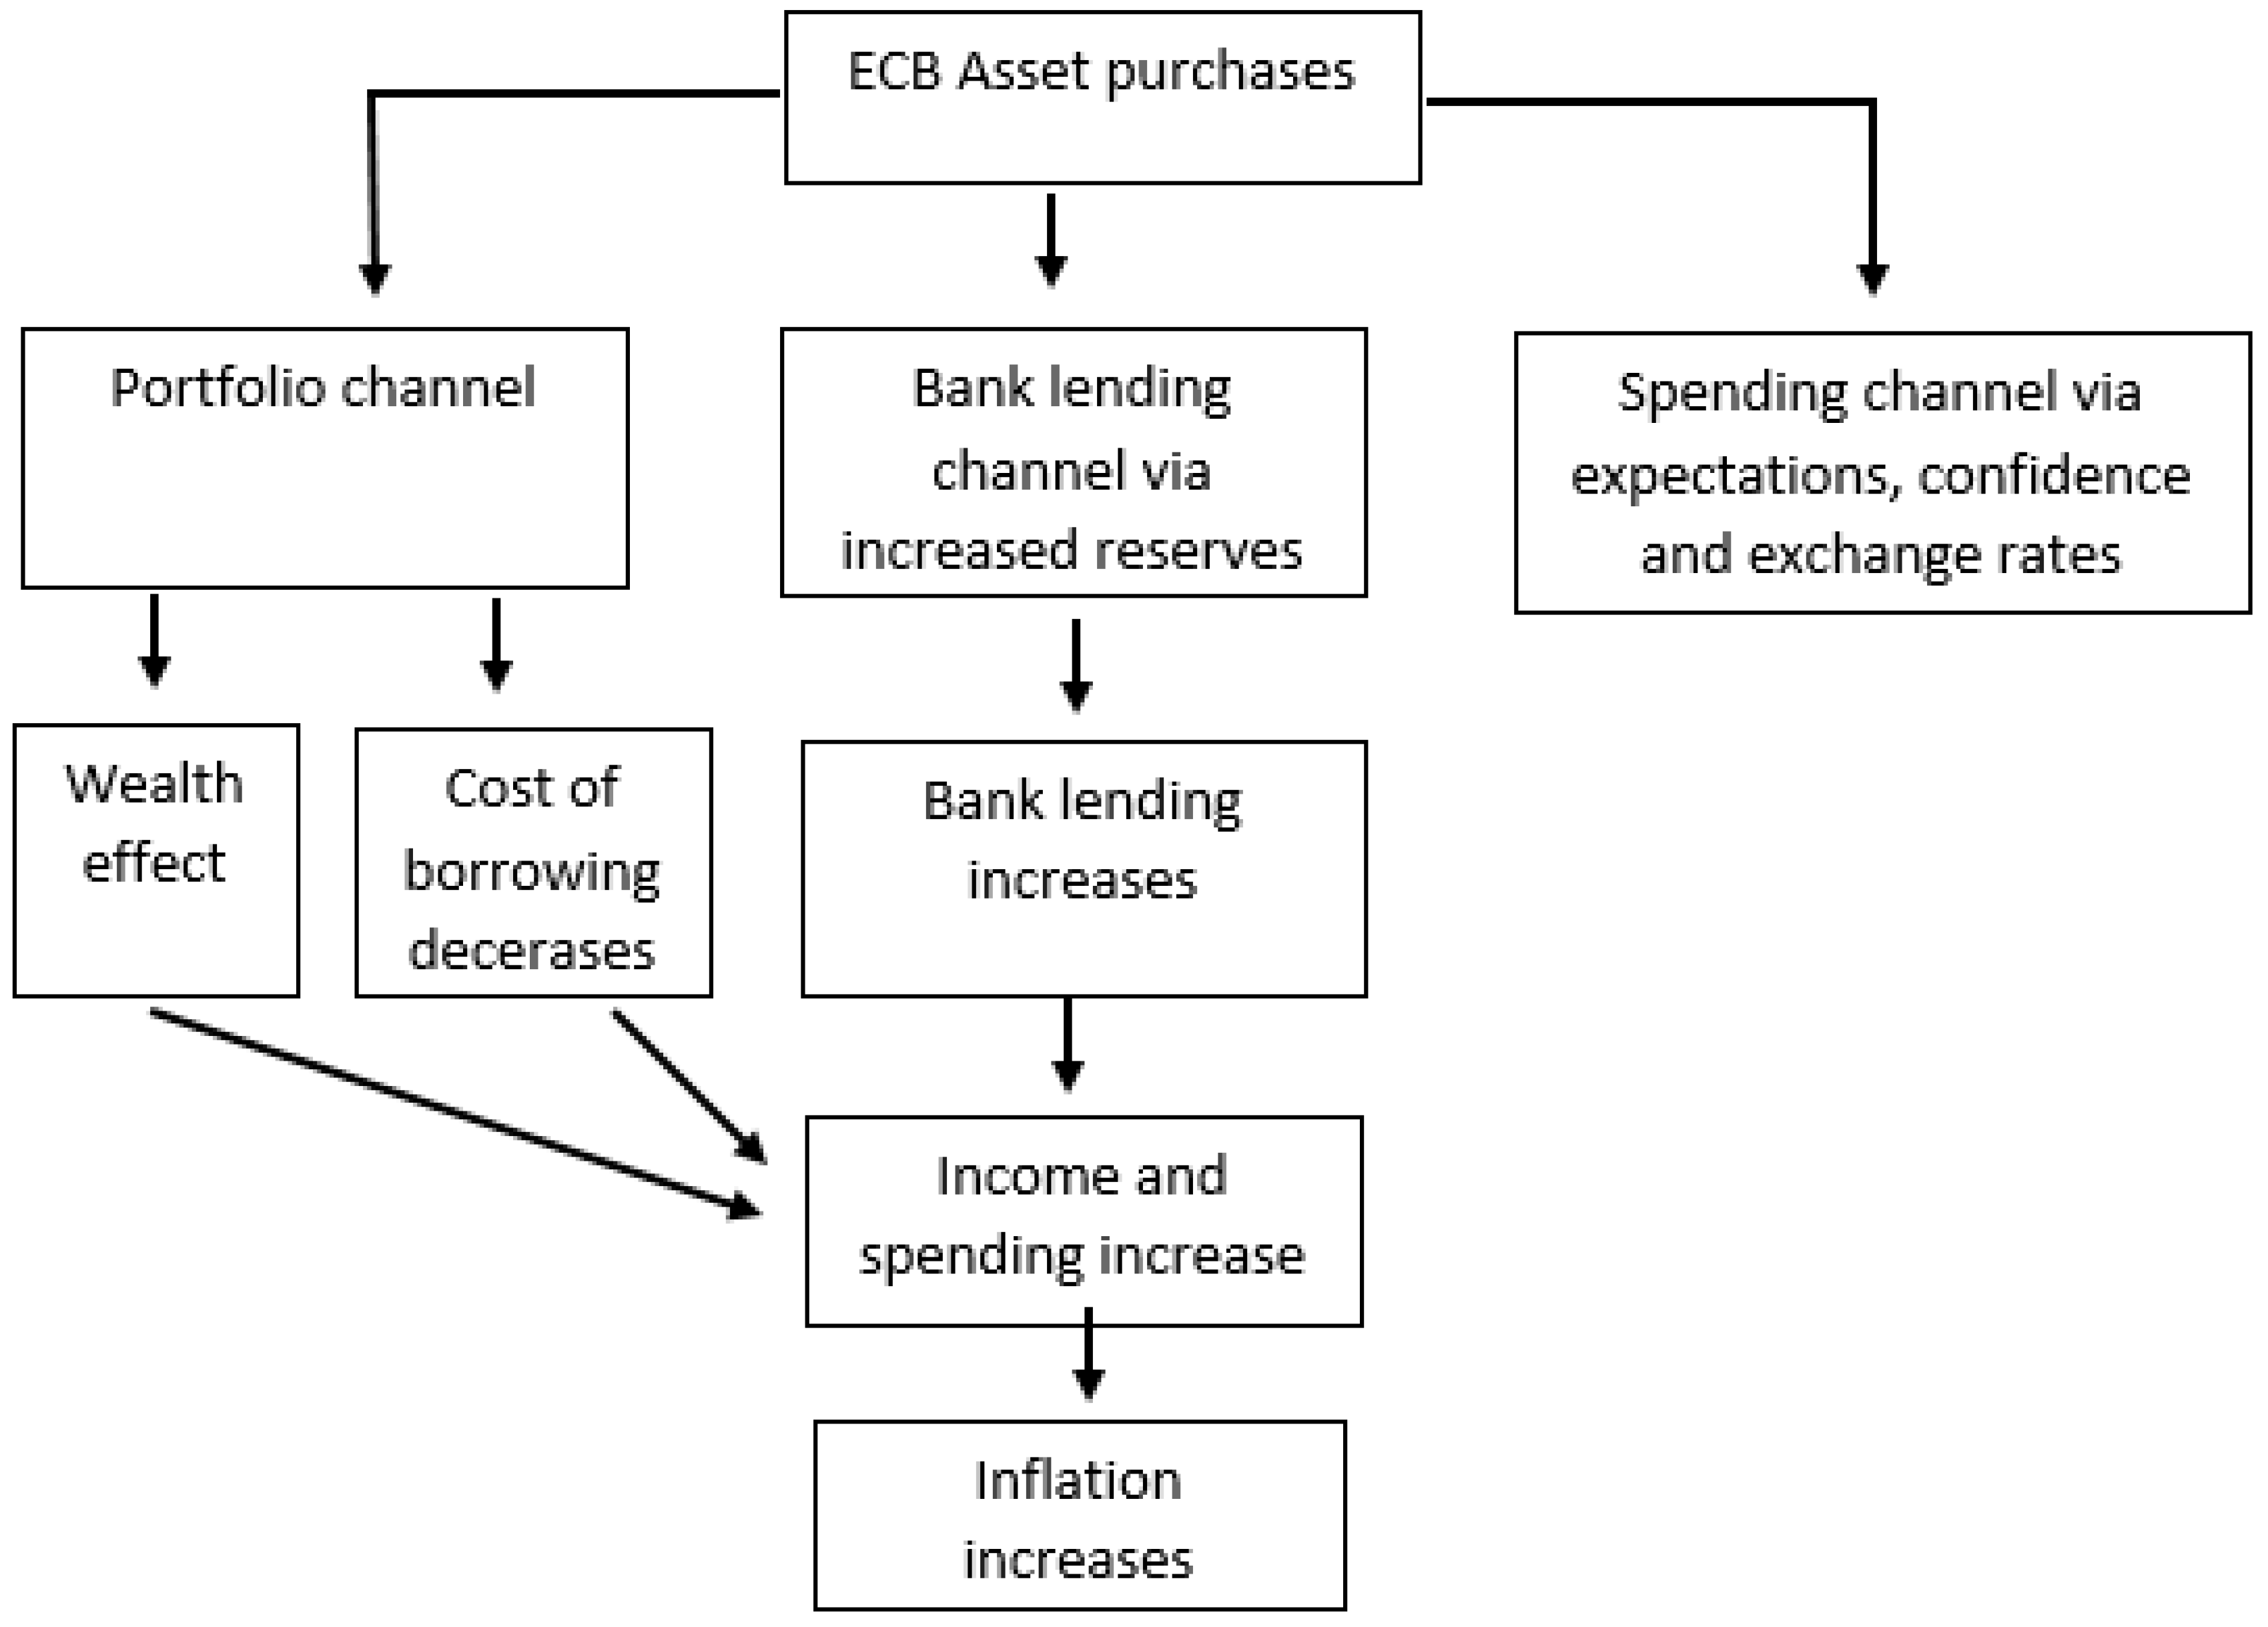
4.3. The APP and Its Transmission Channels
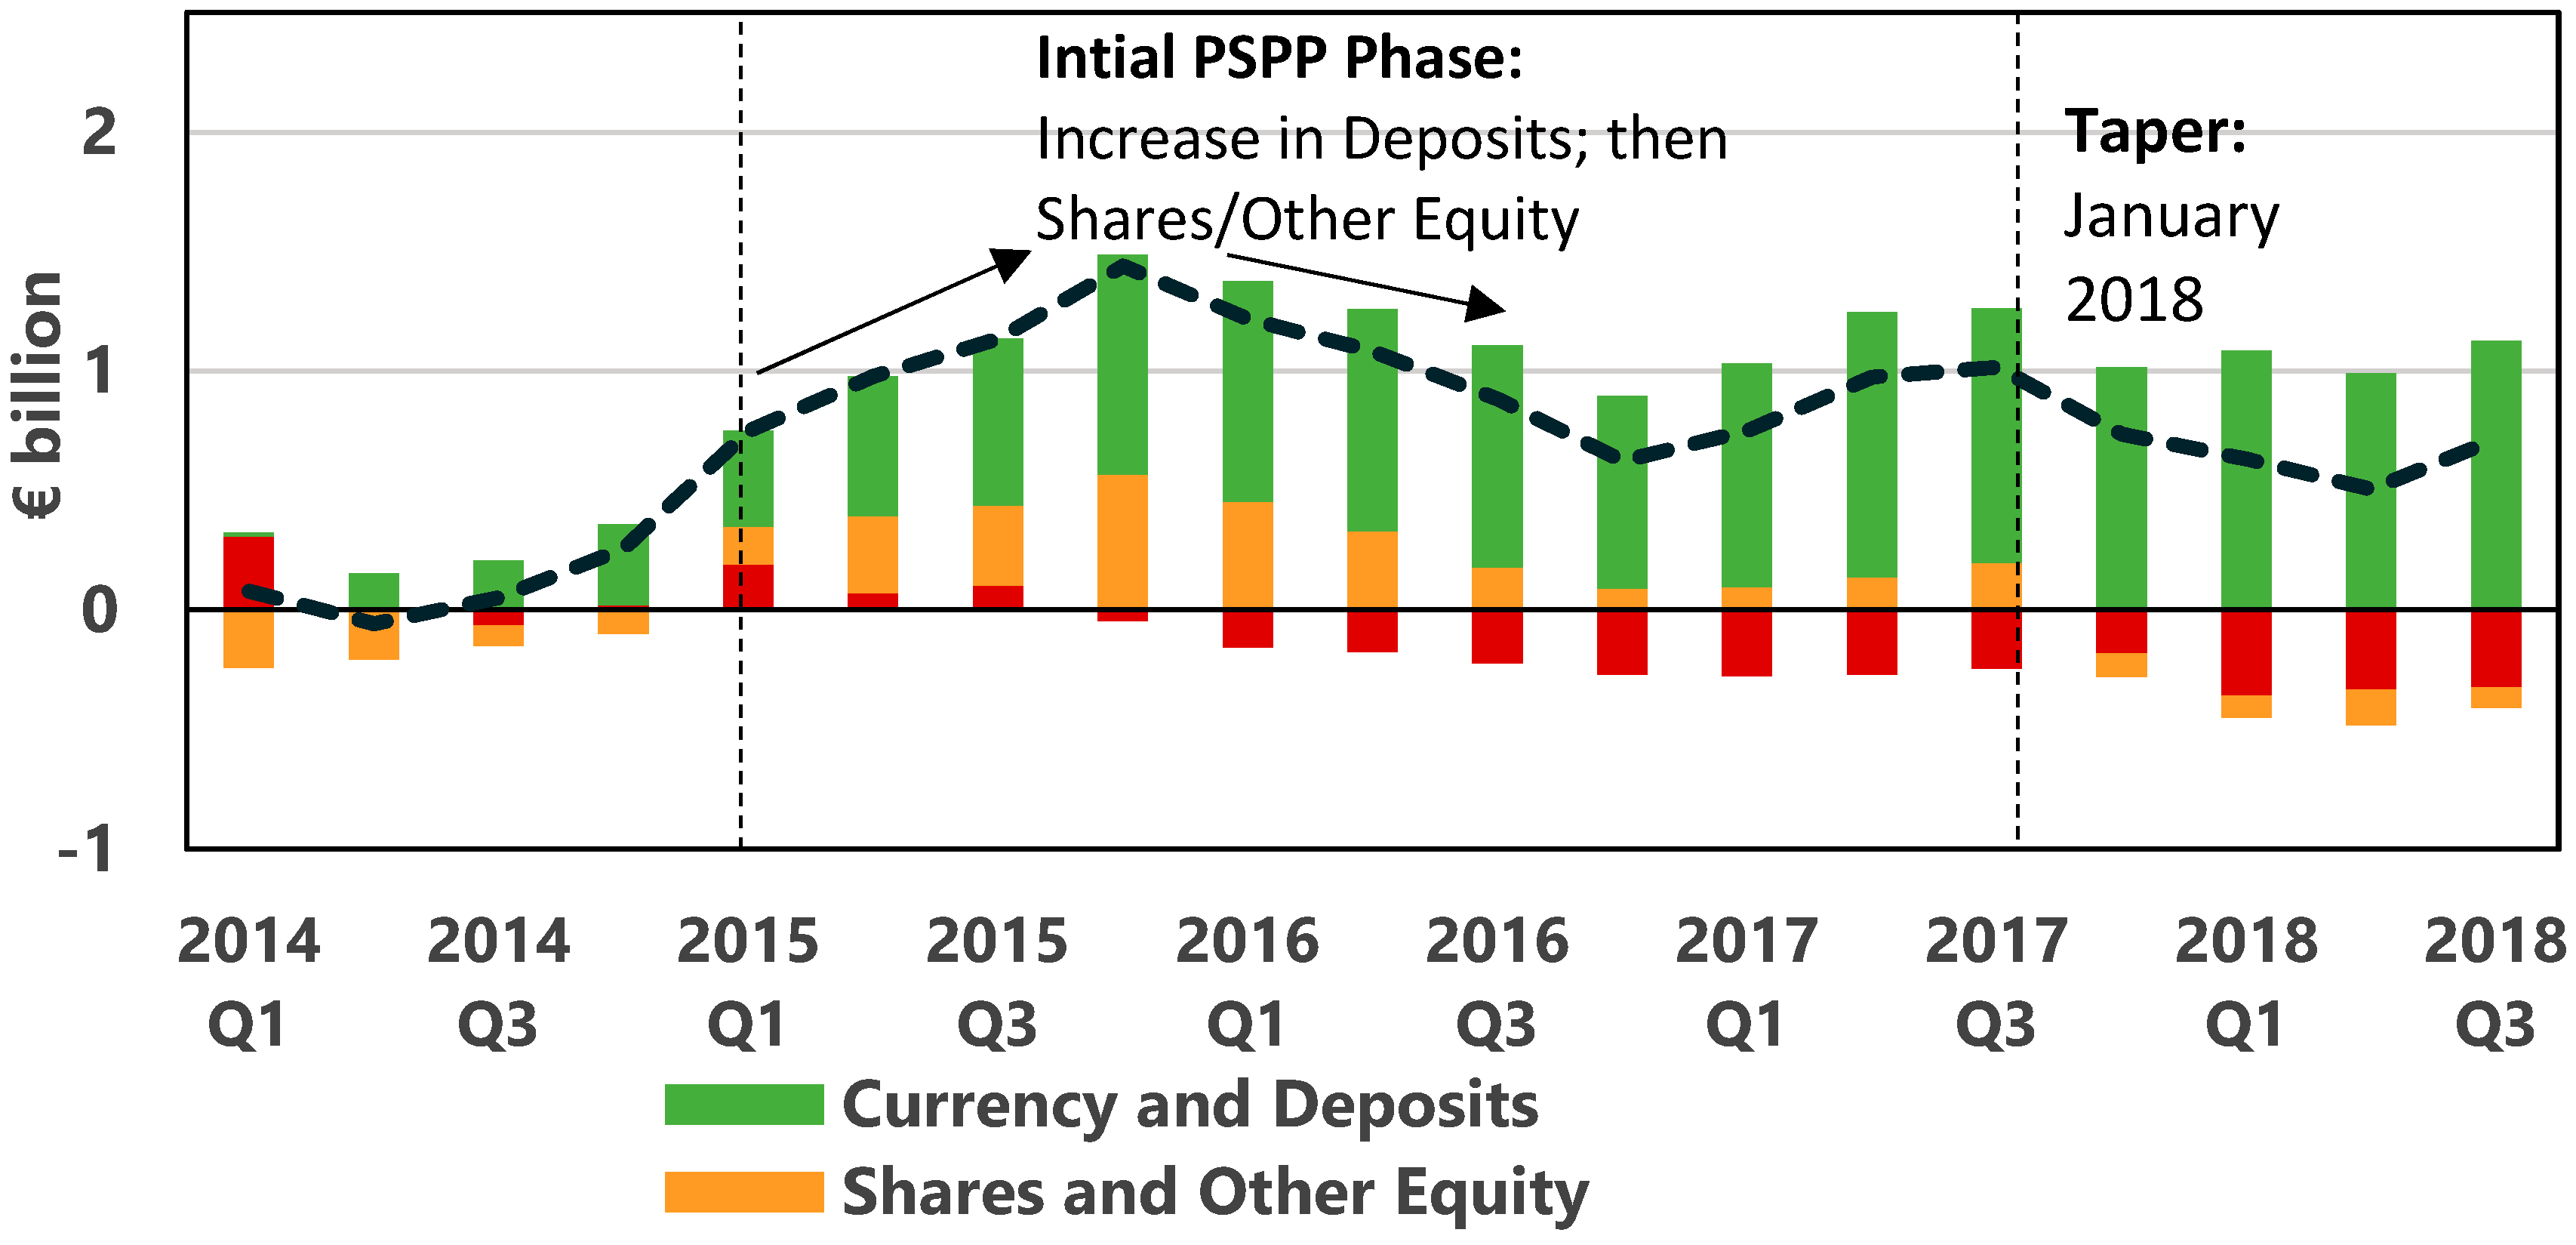
4.3.1. The APP and Portfolio Rebalancing
Irish Households
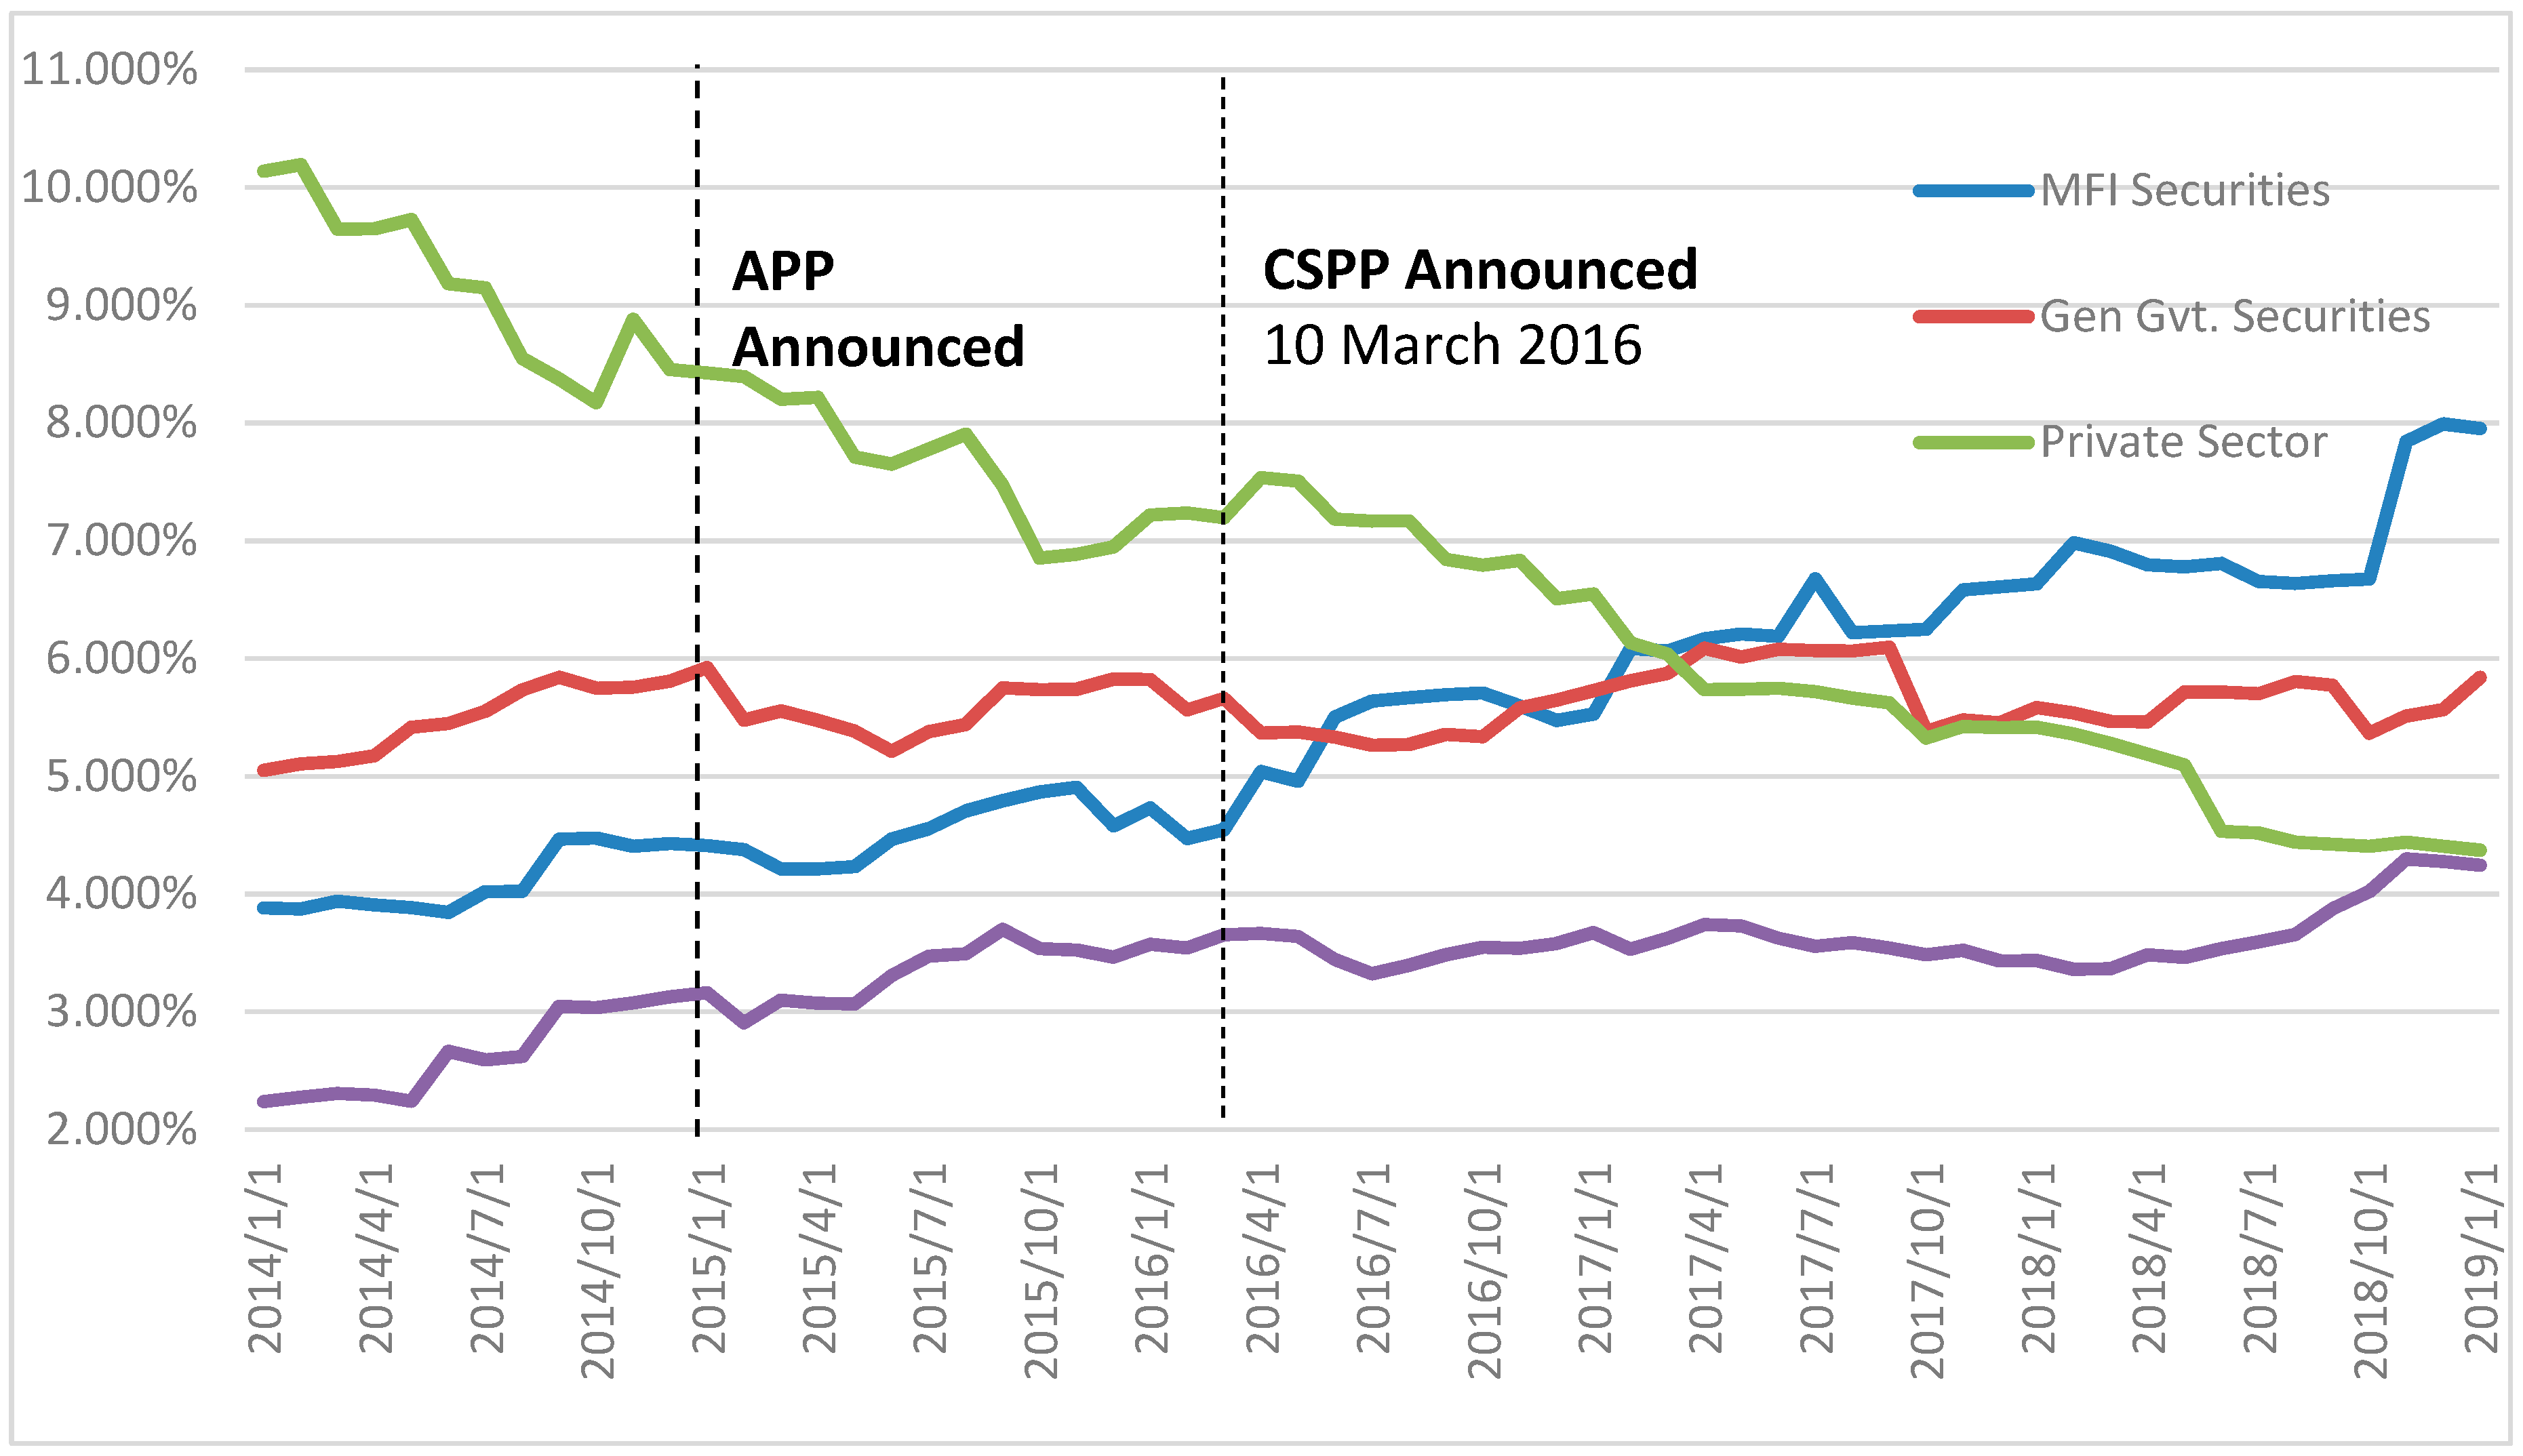
Irish Banks
4.3.2. The APP and Lending Behaviour by Irish Banks
5. Discussion
5.1. Portfolio Rebalancing Channel: Government and Corporate Bonds
5.2. Portfolio Rebalancing in Banks and Households
5.3. The Signalling Channel
5.4. The Lending Channel
5.5. Irish Debt Restructuring
6. Conclusions
Author Contributions
Funding
Acknowledgments
Conflicts of Interest
References
- Albertazzi, Ugo, Andrea Nobili, and Federico Maria Signoretti. 2016. The bank lending channel of conventional and unconventional monetary policy. SSRN; Working Paper Series, No 1094; Banca d’Italia, December 15. Available online: https://www.bancaditalia.it/pubblicazioni/temi-discussione/2016/2016-1094/en_tema_1094.pdf?language_id=1 (accessed on 20 January 2019). [CrossRef]
- Albertazzi, Ugo, Bo Becker, and Miguel Boucinha. 2018. Portfolio rebalancing and the transmission of large-scale asset programmes: Evidence from the euro area. European Central Bank working Paper Series. No. 1225; European Central Bank, May 23. Available online: https://www.ecb.europa.eu/pub/pdf/scpwps/ecb.wp2125.en.pdf (accessed on 22 February 2019).
- Altavilla, Carlo, Giacomo Carboni, and Roberto Motto. 2015. Asset Purchase Programmes and Financial Markets: Lessons from the Euro Area. No. 1864. European Central Bank. Available online: https://www.ecb.europa.eu/pub/pdf/scpwps/ecbwp1864.en.pdf (accessed on 10 May 2018). [CrossRef]
- Altavilla, Carlo, Desislava Andreeva, Miguel Boucinha, and Sarah Holton. 2019. Monetary Policy, credit institutions and the bank lending channel in the euro area. ECB Occasional Paper. May. Available online: https://www.ecb.europa.eu/pub/pdf/scpops/ecb.op222~834b5fece7.en.pdf?729d2503dea9870399465dc23c1d4f8e (accessed on 30 May 2019). [CrossRef]
- Andrade, Philippe, Johannes Breckenfelder, Fiorella De Fiore, Peter Karadi, and Oreste Tristani. 2016. The ECB’s Asset Purchase Programme: An Early Assessment. Working Paper No 1956. Frankfurt: ECB. [Google Scholar]
- Andreasen, Brian, Morten Haastrup, Thorston Larsen, and Lindis Oma. 2015. Favourable Treatment of Government Bonds in Financial Regulation. Denmark National Bank Monetary Review, 1st Quarter. Available online: https://www.nationalbanken.dk/en/publications/Documents/2015/03/Favourable%20treatment_Mon1-15_UK.pdf (accessed on 12 December 2018).
- Bank of Finland. 2018. CSPP Irish Holdings (ISIN Codes Only). Available online: https://www.suomenpankki.fi/find_v2/_click?_t_id=oNYtoRGqVUySELJjHJPXXw%3d%3d&_t_uuid=WVGsEmS4S9GGQ4LZYtjhug&_t_q=cspp&_t_tags=language%3afi%2csiteid%3a4a002108-dc8a-45da-be63-d5ceff3cc3a1%2candquerymatch&_t_hit.id=SuomenPankki_Web_Models_Media_GenericMedia/_6702ac02-5c82-40f9-aa72-b1200bb097f2&_t_hit.pos=5&_t_redirect=https%3A%2F%2Fwww.suomenpankki.fi%2Fglobalassets%2Ffi%2Fmedia-ja-julkaisut%2Fjulkaisut%2Fohjeet_ja_saannot%2Fvastapuoli%2Fdocuments%2Fcspp_isins_10122018.csv (accessed on 18 December 2018).
- Beirne, John, Lars Dalitz, Jacob Ejsing, Magdalena Grothe, Simone Manganelli, Fernando Monar, Benjamin Sahel, Matjaz Susec, Jens Tapking, and Tana Vong. 2011. The impact of the Eurosystem’s Covered Bond Purchase Programme on the Primary and Secondary Markets. Occasional Paper Series No. 122; European Central Bank, January. Available online: https://ssrn.com/abstract=1646280 or https://www.ecb.europa.eu/pub/pdf/scpops/ecbocp122.pdf (accessed on 22 October 2018).
- Benford, James, Berry Stuart, Kalin Nikolov, Chris Young, and Mark Robson. 2009. Quantitative easing. Bank of England Quarterly Bulletin, 2009, Q2. Available online: https://www.bankofengland.co.uk/-/media/boe/files/quarterly-bulletin/2009/quantitative-easing.pdf?la=en&hash=0A59C421AC345729A53E1D976D0064E046884369 (accessed on 11 November 2018).
- Bhattarai, Saroj, Gauti B. Eggertsson, and Bulat Gafarov. 2015. Time Inconsistency and the Duration of Government Debt: A Signaling Theory of Quantitative Easing. NBER Working Paper No. 21336. July. Available online: https://www.nber.org/papers/w21336 (accessed on 20 November 2018).
- Boeckx, Jef, Maite De Sola Perea, and Gert Peersman. 2016. The Transmission Mechanism of Credit Support Policies in the Euro Area. Working Paper Research Series, No 302; Nationale Bank van België/Banque Nationale de Belgique. Available online: https://www.ifo.de/DocDL/cesifo1_wp6442.pdf (accessed on 15 November 2018).
- Bonner, Clemens. 2016. Preferential Regulatory Treatment and Banks’ Demand for Government Bonds. Journal of Credit, Money and Banking 28: 1195–21. Available online: https://onlinelibrary.wiley.com/doi/abs/10.1111/jmcb.12331 (accessed on 10 May 2019). [CrossRef]
- Brózda, Dominika. 2016. Transmission Mechanism of the Federal Reserve System’s Monetary Policy in the Conditions of Zero Bound on Nominal Interest rates. Equilibrium. Quarterly Journal of Economics and Economic Policy 11: 751–67. Available online: https://www.researchgate.net/publication/332259296_Transmission_Mechanism_of_the_Federal_Reserve_System%27s_Monetary_Policy_in_the_Conditions_of_Zero_Bound_on_Nominal_Interest_Rates (accessed on 13 June 2019). [CrossRef]
- Bruno, Brunella, Alexandra D’Onofrio, and Immacolata Marino. 2017. Determinants of Bank Lending in Europe and the US: Evidence from Crisis and Post Crisis Years. Centre for Studies in Economics and Finance. Working Paper, No. 402. January. Available online: http://www.csef.it/WP/wp462.pdf (accessed on 22 February 2019).
- Bundesbank. 2017. The Role of Banks, non-Banks and the Central Bank in the Money Creation Process. Bundesbank.de. Deutsche Bundesbank Monthly Report. April. Available online: https://www.bundesbank.de/resource/blob/654284/df66c4444d065a7f519e2ab0c476df58/mL/2017-04-money-creation-process-data.pdf (accessed on 4 May 2019).
- Butt, Nicholas, Rohan Churm, Michael F. McMahon, Arpad Morotz, and Jochen F. Schanz. 2014. QE and the Bank Lending Channel in the United Kingdom. Bank of England, Working Paper No. 511. September. Available online: https://www.bankofengland.co.uk/-/media/boe/files/working-paper/2014/qe-and-the-bank-lending-channel-in-the-uk.pdf?la=en&hash=6AF72E1A11C9CCCE53D1A8CBA0D35AB8D95D8E31 (accessed on 11 November 2018).
- Carpenter, Seth, Selva Demiralp, Jane Ihrig, and Elizabeth Klee. 2015. Analysing Federal Reserve Asset Purchases: From whom does the Fed buy? Journal of Banking & Finance 52: 230–44. Available online: https://www.sciencedirect.com/science/article/pii/S0378426614002052 (accessed on 5 April 2019).
- Central Bank of Ireland. 2018. Banks Directed to Adhere to New Capital Requirements from July 2019. Press Release. July 5. Available online: https://www.centralbank.ie/news-media/press-releases/banks-directed-to-adhere-to-new-capital-requirements-from-july-2019-5-july-2018 (accessed on 15 March 2019).
- Christensen, Jens, and Signe Krogstrup. 2018. A Portfolio Model of Quantitative Easing. Working Paper 2016-12. Federal Reserve Bank of San Francisco. Available online: https://www.frbsf.org/economic-research/files/wp2016-12.pdf (accessed on 11 February 2019).
- De Santis, Roberto A., André Geis, Aiste Juskaite, and Lia Vaz Cruz. 2018. The impact of the corporate sector purchase programme on corporate bond markets and the financing of euro area non-financial corporations. Economic Bulletin Articles 3: 66–84. Available online: https://www.ecb.europa.eu/pub/pdf/other/ecb.ebart201803_02.en.pdf (accessed on 15 March 2019).
- Dedola, Luca, Georgios Georgiadis, Johannes Gräb, and Arnaud Mehl. 2018. Does a Big Bazooka Matter? Central Bank Balance-Sheet Policies and Exchange Rates (2018-11-02). Globalization and Monetary Policy Institute Working Paper No. 350. Available online: https://ssrn.com/abstract=3289012 or http://dx.doi.org/10.24149/gwp350 (accessed on 5 January 2019).
- Demertzis, Maria, and Guntram B. Wolff. 2016. The Effectiveness of the Central Bank’s Asset Purchase Programme. Bruegel Policy Contribution, Issue 2016-10. June. Available online: http://bruegel.org/wp-content/uploads/2016/06/pc_2016_10-1.pdf (accessed on 21 March 2019).
- Disyatat, Piti. 2010. The Bank Lending Channel Revisited. BIS working Papers. No. 297. Available online: https://www.bis.org/publ/work297.pdf (accessed on 19 October 2018).
- Donnery, Sharon, Trevor Fitzpatrick, Darren Greaney, Fergal McCann, and Micheal O’Keeffe. 2018. Resolving Non-Performing Loans in Ireland: 2010–2018. Special Article, Central Bank of Ireland. Quarterly Bulletin. April 2, pp. 54–70. Available online: https://www.centralbank.ie/docs/default-source/publications/quarterly-bulletins/quarterly-bulletin-signed-articles/resolving-non-performing-loans-in-ireland-2018-(donnery-fitzpatrick-greaney-mccann-and-o’keeffe).pdf?sfvrsn=6 (accessed on 5 April 2019).
- Dunne, Peter, Mary Everett, and Rebecca Stuart. 2015. The Expanded Asset Purchase Programme—What, why and How of Euro Area QE. Central Bank of Ireland Quarterly Bulletin. July 3, pp. 61–71. Available online: https://www.centralbank.ie/docs/default-source/publications/quarterly-bulletins/quarterly-bulletin-signed-articles/the-expanded-asset-purchase-prog.pdf?sfvrsn=4 (accessed on 22 October 2018).
- ECB. 2014a. ECB announces operational details of asset-backed securities and covered bond purchase programmes. ECB Press Release. October 2. Available online: https://www.ecb.europa.eu/press/pr/date/2014/html/pr141002_1.en.html (accessed on 22 September 2018).
- ECB. 2014b. The ECB’s Forward Guidance. ECB Monthly Bulletin. April. Available online: https://www.ecb.europa.eu/pub/pdf/other/art1_mb201404en_pp65-73en.pdf (accessed on 11 October 2018).
- ECB. 2014c. Recommendations of the European Central Bank. Official Journal of the European Union. March 27. Available online: https://www.ecb.europa.eu/ecb/legal/pdf/oj_joc_2014_186_r_0001_en_txt.pdf (accessed on 17 October 2018).
- ECB. 2015. ECB Announces Expanded Asset Purchase Programme. Available online: https://www.ecb.europa.eu/press/pr/date/2015/html/pr150122_1.en.html (accessed on 12 February 2019).
- ECB. 2016. ECB adds corporate sector purchase programme (CSPP) to the asset purchase programme (APP) and announces changes to APP. ECB Press Release. March 10. Available online: https://www.ecb.europa.eu/press/pr/date/2016/html/pr160310_2.en.html (accessed on 16 October 2018).
- ECB. 2019a. Public Sector Purchase Programme (PSPP)—Questions & Answers, 2.1. Allocation of Purchases. Available online: https://www.ecb.europa.eu/mopo/implement/omt/html/pspp-qa.en.html (accessed on 19 October 2018).
- ECB. 2019b. Press Release Monetary Policy Decisions. September 12. Available online: https://www.ecb.europa.eu/press/pr/date/2019/html/ecb.mp190912~08de50b4d2.en.html (accessed on 12 September 2019).
- Eggertsson, Gauti, and Michael Woodford. 2003. The Zero Bound on Interest Rates and Optimal Monetary Policy. Brookings Papers on Economic Activity. No. 1. Available online: http://www.columbia.edu/~mw2230/BPEA.pdf (accessed on 15 February 2019).
- Falagiarda, Matteo, and Stefan Reitz. 2015. Announcements of ECB unconventional programs: Implications for the sovereign spreads of stressed euro area countries. Journal of International Money and Finance 53: 276–95. Available online: https://www.sciencedirect.com/science/article/pii/S0261560615000200 (accessed on 17 October 2019). [CrossRef]
- Ferrari, Massimo, Jonathan Kearns, and Andreas Schrimpf. 2017. Monetary policy’s rising FX impact in the era of ultra-low rates. BIS Working Papers No 626. SSRN; Monetary and Economic Department, March 21. Available online: https://www.bis.org/publ/work626.pdf (accessed on 15 February 2019).
- Fullwiler, Scott T. 2013. An endogenous money perspective on the post-crisis monetary policy debate. Review of Keynesian Economics 1: 171–94. Available online: https://www.researchgate.net/publication/256043652_An_Endogenous_Money_Perspective_on_the_Post-Crisis_Monetary_Policy_Debate (accessed on 15 October 2018). [CrossRef]
- Gern, Klaus-Jürgen, Nils Jannsen, Stefan Kooths, and Maik Wolters. 2015. Quantitative Easing in the Euro Area: Transmission Channels and Risks. Quantitative Easing in the Euro Area: Transmission Channels and Risks. Available online: https://archive.intereconomics.eu/year/2015/4/quantitative-easing-in-the-euro-area-transmission-channels-and-risks/ (accessed on 8 November 2018).
- Glick, Reuven, and Sylvain Leduc. 2013. The Effects of Unconventional and Conventional U.S. Monetary Policy on the Dollar. Federal Reserve Bank of San Francisco Working Paper Series 2013-11. Available online: https://www.frbsf.org/economic-research/files/wp2013-11.pdf (accessed on 16 October 2018).
- Haldane, Andrew, Matt Roberts-Sklar, Chris Young, and Tomasz Wieladek. 2016. QE: The story so far. Bank of England Staff Working Paper No. 624. Available online: https://www.bankofengland.co.uk/working-paper/2016/qe-the-story-so-far (accessed on 16 October 2018).
- Houses of the Oireachtas. 2019. Small and Medium Sized Businesses in Ireland. Seanad Public Consultation Committee Report. Available online: https://data.oireachtas.ie/ie/oireachtas/committee/dail/32/seanad_public_consultation_committee/reports/2019/2019-05-16_small-and-medium-sized-businesses-in-ireland_en.pdf (accessed on 16 July 2019).
- Joyce, Michael, Zhuoshi Liu, and Ian Tonks. 2014. Institutional investor portfolio allocation, quantitative easing and the global financial crisis. Bank of England Working Paper No. 510. Available online: https://www.bankofengland.co.uk/working-paper/2014/institutional-investor-portfolio-allocation-quantitative-easing-and-the-global-financial-crisis (accessed on 18 October 2018).
- Krishnamurthy, Arvind, and Annette Vissing-Jorgensen. 2013. The Ins and Outs of LSAPs. Paper presented at Proceedings—Economic Policy Symposium—Jackson Hole, Federal Reserve Bank of Kansas City, Jackson Hole, WY, USA, August 21–23; Available online: http://faculty.haas.berkeley.edu/vissing/jh.pdf (accessed on 17 October 2018).
- Lane, Philip. 2019. Tail Risks and the Irish Economy. Lecture delivered to UCD School of Economics. April 16. Available online: https://www.centralbank.ie/news/article/tail-risks-and-the-irish-economy-governor-philip-r-lane (accessed on 20 May 2019).
- Larkin, John, Pj Anderson, and Sean Furlong. 2019. The Irish Government Bond Market and Quantitative Easing. Central Bank of Ireland Quarterly Bulletin. April 2. Available online: https://www.centralbank.ie/docs/default-source/publications/quarterly-bulletins/quarterly-bulletin-signed-articles/the-irish-government-bond-market-and-quantitative-easing-(larkin-anderson-and-furlong).pdf (accessed on 23 May 2019).
- Lavoie, Marc. 2014. Post-Keynesian Economics: New Foundations, 1st ed. Cheltenham: Edward Elgar Publishing. [Google Scholar]
- McLeay, Michael, Amar Radia, and Ryland Thomas. 2014. Money Creation in the Modern Economy. Bankofengland.co.uk. Available online: https://www.bankofengland.co.uk/-/media/boe/files/quarterly-bulletin/2014/money-creation-in-the-modern-economy (accessed on 4 May 2019).
- Moessner, Richhild, and Phurichai Rungcharoenkitkul. 2019. The zero lower bound, forward guidance and how markets respond to news. BIS Quarterly Review. March 5. Available online: https://www.bis.org/publ/qtrpdf/r_qt1903h.htm (accessed on 10 May 2019).
- Neugebauer, Frederic. 2018. The Effects of the ECB’s Asset Purchase Announcements on Euro Area Government Bond Yields. Available online: https://cepr.org/sites/default/files/40021_Neugebauer_ECB%20announcments_Neugebauer.pdf (accessed on 19 October 2018).
- NTMA. 2017. NTMA Annual Report 2017. Available online: https://www.ntma.ie/download/publications/NTMA-Annual-Report-2017.pdf (accessed on 23 May 2019).
- NTMA. 2019. NTMA Investor Presentation January 2019. Available online: https://www.ntma.ie/uploads/publication-articles/Investor-Presentation-January-2019.pdf (accessed on 23 May 2019).
- Peek, Joe, and Eric Rosengren. 1993. Bank Regulation and the Credit Crunch. Federal Reserve Bank of Boston Working Paper Series No. 93. February 2. Available online: http://scholar.google.com/scholar_url?url=https://www.bostonfed.org/-/media/Documents/Workingpapers/PDF/wp93_2.pdf&hl=en&sa=X&scisig=AAGBfm1CNHhYA0ZpEEzUnW4ltwjAmkiTxQ&nossl=1&oi=scholarr (accessed on 17 September 2019).
- Peek, Joe, and Eric Rosengren. 1995. Bank Regulatory Agreements in New England. New England Economic Review, May/June. [Google Scholar]
- Ryan, Ellen, and Karl Whelan. 2019. Quantitative Easing and the Hot Potato Effect: Evidence from Euro Area Banks. Research Technical Paper. SSRN. February 4. Available online: https://www.centralbank.ie/docs/default-source/publications/research-technical-papers/01rt19-quantitative-easing-and-the-hot-potato-effect-evidence-from-euro-area-banks-(ryan-and-whelan).pdf (accessed on 22 April 2019).
- Tischer, Johannes. 2018. Quantitative Easing, Portfolio Rebalancing and Credit Growth: Micro Evidence from Germany. Bundesbank Discussion Paper, No. 20. Available online: https://www.econstor.eu/bitstream/10419/180673/1/1027069444.pdf (accessed on 15 September 2018).
- Urbschat, Florian, and Sebastian Watzka. 2017. Quantitative Easing in the Euro Area. Munich Discussion Paper No. 2017-10. Department of Economics University of Munich. Available online: https://pdfs.semanticscholar.org/3c25/7a16bbc130d1a96c6875736228ef7edcc7bc.pdf (accessed on 16 September 2018).
- Zaghini, Andrea. 2019. The CSPP at work, yield heterogeneity and the portfolio rebalancing channel. ECB working Paper Series, No. 2264. Journal of Corporate Finance 56: 282–97. Available online: https://www.ecb.europa.eu/pub/pdf/scpwps/ecb.wp2264~c4382400c5.en.pdf?aa27b02e90dfab19b28f36dd5c8e3ed0 (accessed on 5 June 2019). [CrossRef]
| 1 | QE and APP will be used interchangeably in this paper as they are taken to mean the same monetary policy. |
| 2 | The ECB had engaged in covered bond purchases before 2014 with a covered bond purchase programme (CBPP) announced in May 2009. |
| 3 | Purchases by the ECB are taken to mean purchases by the Eurosystem, including the ECB and the national central banks of euro-area countries. |
| 4 | Andrade et al. (2016, pp. 19–22); Tischer (2018) also suggest that quantitative easing can increase banks’ equity through higher asset prices and that this also is conducive to a more productive lending environment. |
| 5 | Official ECB tapering refers to the first major reduction of purchases from €60 billion until December 2017, to €30 billion in January 2018. See the chronology of asset purchases here: https://www.ecb.europa.eu/mopo/implement/omt/html/index.en.html. |
| 6 | It is worth noting that the Irish corporate bond market is relatively thin compared to, for example, the French corporate bond market. |
| 7 | It is worth noting that the poor increase in loans to SME’s over the period may also be driven by weak credit demand in this sector and it is difficult to separate these demand and supply effects in practice. |


| Total Holdings | Monthly Purchase | Total Holdings | Monthly Purchase | ||
|---|---|---|---|---|---|
| (€Billions) | (€Billions) | (€Billions) | (€Billions) | ||
| Mar-15 | 0.80 | 0.80 | Feb-17 | 19.70 | 0.60 |
| Apr-15 | 1.50 | 0.70 | Mar-17 | 20.20 | 0.50 |
| May-15 | 2.20 | 0.70 | Apr-17 | 20.80 | 0.60 |
| Jun-15 | 3.00 | 0.80 | May-17 | 21.30 | 0.50 |
| Jul-15 | 3.80 | 0.80 | Jun-17 | 21.80 | 0.50 |
| Aug-15 | 4.40 | 0.60 | Jul-17 | 22.40 | 0.60 |
| Sep-15 | 5.20 | 0.80 | Aug-17 | 22.90 | 0.50 |
| Oct-15 | 6.10 | 0.90 | Sep-17 | 23.40 | 0.50 |
| Nov-15 | 6.90 | 0.80 | Oct-17 | 23.50 | 0.10 |
| Dec-15 | 7.60 | 0.70 | Nov-17 | 24.60 | 1.10 |
| Jan-16 | 8.40 | 0.80 | Dec-17 | 25.30 | 0.70 |
| Feb-16 | 9.20 | 0.80 | Jan-18 | 25.70 | 0.40 |
| Mar-16 | 10.00 | 0.80 | Feb-18 | 26.10 | 0.40 |
| Apr-16 | 11.10 | 1.10 | Mar-18 | 26.50 | 0.40 |
| May-16 | 12.20 | 1.10 | Apr-18 | 27.10 | 0.60 |
| Jun-16 | 13.20 | 1.00 | May-18 | 27.60 | 0.50 |
| Jul-16 | 14.20 | 1.00 | Jun-18 | 28.20 | 0.60 |
| Aug-16 | 14.90 | 0.70 | Jul-18 | 28.75 | 0.55 |
| Sep-16 | 15.90 | 1.00 | Aug-18 | 29.30 | 0.55 |
| Oct-16 | 16.90 | 1.00 | Sep-18 | 29.60 | 0.30 |
| Nov-16 | 17.90 | 1.00 | Oct-18 | 29.80 | 0.20 |
| Dec-16 | 18.60 | 0.70 | Nov-18 | 29.90 | 0.10 |
| Jan-17 | 19.10 | 0.50 |
| Government Long-Term Securities | PSPP Quarterly Purchases | |
|---|---|---|
| Mean | 146 | 1.973 |
| Variance | 11.162 | 0.416 |
| Median | 148.506 | 1.9 |
| Standard deviation | 3.341 | 0.645 |
| Correlation coefficient | −0.6432 |
| ISIN | Issuer | Coupon | Maturity | Date of Issue | CSPP Purchase Date | Initial Issue Volume (€mn) |
|---|---|---|---|---|---|---|
| XS1419674525 | Dublin Airport Authority | 1.554 | 7/06/28 | 07/06/16 | 15/07/16 | 290 |
| XS1239586594 | ESB | 2.125 | 08/06/27 | 05/06/15 | 15/07/16 | 850 |
| XS1288849471 | Kerry Group | 2.375 | 10/09/25 | 10/09/15 | 15/07/16 | 850 |
| XS1077584024 | Ryanair | 1.875 | 17/06/21 | 17/06/14 | 15/07/16 | 500 |
| XS1199964575 | Ryanair | 1.125 | 03/10/23 | 10/03/15 | 15/07/16 | 750 |
| XS0375220588 | Dublin Airport Authority | 6.872 | 09/07/18 | 09/07/08 | 29/07/16 | 400 |
| XS1428782160 | ESB | 1.875 | 14/06/31 | 14/06/16 | 29/07/16 | 600 |
| XS1505896735 | CRH | 1.375 | 18/10/28 | 18/10/16 | 21/10/16 | 600 |
| XS1529684695 | Gas Networks Ireland | 1.375 | 05/12/26 | 05/12/16 | 20/01/17 | 500 |
| XS1560853670 | ESB | 1.75 | 07/02/29 | 07/02/17 | 10/02/17 | 500 |
| XS1565699763 | Ryanair | 1.125 | 15/08/23 | 15/02/17 | 17/02/17 | 750 |
| Initial ECB Purchase | 15/072016 | 15/07/2016 | 17/02/2017 | Total |
|---|---|---|---|---|
| ISIN | XS1077584024 | XS1199964575 | XS156569963 | |
| Coupon | 1.875 | 1.125 | 1.125 | |
| Maturity | 17/06/21 | 10/3/23 | 15/8/23 | |
| Date of issue | 17/06/2014 | 10/03/2015 | 15/02/2017 | |
| Initial (€mn) | 850 | 850 | 750 | |
| Holdings as at Sept 2016 | €38,484,542.53 | €38,484,542.53 | €76,969,085.06 | |
| Holdings as at Nov 2017 | €147,381,620.72 | €142,205,088.32 | €125,249,704.23 | €414,836,413.77 |
| Holdings as at March 2018 | €164,597,763.51 | €159,594,371.03 | €140,383,694,33 | €464,575,828.87 |
| Holdings as at June 2018 | €169,361,040.92 | €163,675,808.38 | €143,799,186.96 | €476,836,036.27 |
| % of Irish CSPP Portfolio | 12% | 13% | 11% | 37% |
| January 2014–May 2016 (Pre-CSPP) | June 2016–February 2017 (First Bond Added to CSPP) | February 2017–January 2018 (Second Bond Added to CSPP) | |
|---|---|---|---|
| Mean | €10.29 | €13.24 | €16.90 |
| Variance | 8.514239 | 1.297385 | 1.603317 |
| Median | €10.23 | €13.43 | €16.81 |
| Standard Deviation | €2.917917 | €1.139028 | €1.266222 |
| Correlation coefficient (with ISEQ Average) | 0.956 | 0.576 | −0.068 |
| Ryanair 1.875 2021 Bond | General Electric 0.8 2023 Bond | Ryanair 1.125 2023 Bond | |
|---|---|---|---|
| Mean | 104.498 | 100.8711 | 99.448 |
| Variance | 104.885 | 101.38 | 100.3 |
| Median | 1.875 | 4.378 | 24.906 |
| Standard deviation | 1.369 | 2.092 | 3.881 |
| Correlation coefficient | 0.8627 | 0.7288 |
© 2019 by the authors. Licensee MDPI, Basel, Switzerland. This article is an open access article distributed under the terms and conditions of the Creative Commons Attribution (CC BY) license (http://creativecommons.org/licenses/by/4.0/).
Share and Cite
Cawley, C.; Finnegan, M. Transmission Channels of Central Bank Asset Purchases in the Irish Economy. Economies 2019, 7, 98. https://doi.org/10.3390/economies7040098
Cawley C, Finnegan M. Transmission Channels of Central Bank Asset Purchases in the Irish Economy. Economies. 2019; 7(4):98. https://doi.org/10.3390/economies7040098
Chicago/Turabian StyleCawley, Cormac, and Marie Finnegan. 2019. "Transmission Channels of Central Bank Asset Purchases in the Irish Economy" Economies 7, no. 4: 98. https://doi.org/10.3390/economies7040098
APA StyleCawley, C., & Finnegan, M. (2019). Transmission Channels of Central Bank Asset Purchases in the Irish Economy. Economies, 7(4), 98. https://doi.org/10.3390/economies7040098