1. Introduction
Accounting information is significant to internal and external information users to make reasonable decisions. However, it is noticed that the disclosure of information in the private and public sectors is insufficient. The issue of accounting information disclosure quality is encountered.
Having analysed the existing research,
Kundelienė (
2009) distinguished two directions of accounting quality research. Firstly, the accounting quality is evaluated under the informational aspect when the quality characteristics (properties) of accounting information are analysed. Secondly, the research oriented to the issues of accounting information disclosure in the financial statements is reviewed.
In the beginning, the first approach to the characteristics of accounting information quality will be discussed.
Hellstrom (
2009) points out that accounting information quality is measured by the concept of usefulness and a timely manner. On the one hand, useful information is information that is relevant for decision-making, in other words, it makes a difference in the process of decision-making. Useful information also has to be reliable in order to decrease insecurity in decision-making. On the other hand, the accounting information has to be timely so that it can influence the decision-making process in time.
Researchers emphasize the quality aspect of financial statements; however, they interpret the concept of financial reporting quality (FRQ) differently. When analysing FRQ interpretations, several opinions of scientists can be distinguished. Various characteristics of financial reporting quality as the main characteristics are emphasized by different authors. Further, some examples are provided.
(1) There is a possibility to distinguish a separate group of authors (
Biddle et al. 2009), who link FRQ to the benefit to users of financial reporting information. For example,
Obaidat (
2007) claims that the primary objective of financial reporting is to provide useful information to interested parties. Therefore, it is important to identify the groups concerned in the financial statements. The scientists point out that FRQ should be discussed with regard to the interests of shareholders and that FRQ should be assessed on the basis of the benefits to the shareholders. (2) Another group of researchers (
Biddle et al. 2009;
Elbannan 2011;
Gorgieva-Trajkovska and Kostadinovski 2012) indicate that FRQ reflects the accuracy of the company’s financial information, in particular, the expected cash flows. (3) The reliability of information in the FRQ definition is highlighted in scientific papers (
Martínez-Ferrero 2014). Moreover, researchers refer FRQ to the use of accounting legislation or standards. Researchers specify normative documents and link FRQ to the use of International Financial Reporting Standards (IFRSs) (
Barth et al. 2008) or Generally accepted accounting principles (GAAP) (
Giroux and McLelland 2003).
Generally, the questions of accounting information disclosure quality gain quite some attention in the private sector; nevertheless, the research on this issue is insufficient in the public sector.
The studies on accounting information disclosure quality are also conducted in the public sector. According to
Chen et al. (
2016), “government financial information disclosure allows the general public and stakeholders to understand a government’s macro policy and dynamic guidelines, to evaluate the government’s resource allocation and to supervise government behaviour”. Consequently, investors arrive at better investment decisions, which increases the efficiency of investment. Chang (as cited by
Chen et al. (
2016)) emphasizes that “information asymmetry between the public and government creates a strong desire for access to information”. Moreover, researchers (Zhang et al.; Lu 2010 (as cited by
Chen et al. (
2016)) point that “even internal stakeholders in the government have a strong need for information, which may be greater even than that of external stakeholders”.
On the basis of the New Public Management reform, nowadays, these issues have become relevant to many countries as they have changed from cash-based accounting towards accrual accounting in their public sector (
Falkman and Tagesson 2008). Several examples of research are given when the level of disclosure in financial statements of local governments, i.e., compliance with disclosure requirements, was investigated.
Adi et al. (
2016) and
Martani and Lestiani (
2012) have analysed the disclosure of accounting information in the Government of Indonesia and showed that the disclosure level of the information is low. Similar results are given by
Falkman and Tagesson (
2008) in Swedish municipalities. The accounting reforms have not brought the expected increase of financial reporting quality in other countries, for instance, in Australia (
Stanley et al. 2008) or in Italy (
Steccolini 2004).
Such research is carried out not only in the private but also in the public sector, which is supported by the following findings.
Adi et al. (
2016) have identified that in empirical research on local government disclosure, many types of research are more focused on disclosure attached to financial statements of local governments in the form of notes to the financial statements of local governments. This can be confirmed by the research examples.
Martani and Lestiani (
2012) have investigated the level of disclosure of local government financial statements that are presented in the notes of financial statements based on the Indonesian Government Accounting Standard.
Adi et al. (
2016) have focused on the quality of management information, since “management report shows that the accountability to the public is not only accountable for financial aspects but also the quality of local government performance”.
The question of accounting information disclosure quality in the Lithuanian public sector is relevant, as since 2010, after the Public Sector Accounting and Financial Reporting Reform, the accounting management has been changed from the cash basis to the accrual basis. The Public Sector Accounting and Financial Reporting Standards have been introduced which are employed to improve the presentation quality of the financial statements of the public sector entities. The financial statements prepared according to these standards would help the users of financial information to make more reasonable economic decisions that deal with the distribution of resources. In addition, the transparency indicators of the financial statements would increase. However, this aim can be reached only if the information introduced in the financial statements meets all of the requirements in the standards.
The majority of assets in municipalities are non-current
1 tangible assets, therefore, these types of assets were selected to analyse the issue of the accounting information disclosure quality. The consolidated annual financial statements of the local government (the municipalities) of Lithuania for the time period of 2013–2016 have been selected for the analysis of this research.
The aim of the research is to examine and evaluate the accounting information disclosure quality of the non-current tangible assets (hereinafter referred to as tangible assets) in the consolidated annual financial statements of the municipalities of Lithuania and identify municipality characteristics having an impact on the accounting information disclosure quality.
In order to reach the aim, the following objectives have been set: (1) to design the research model of the accounting information disclosure quality in the financial statements, (2) in accordance with the designed disclosure quality index, to evaluate and compare the accounting information disclosure quality of the tangible assets in the consolidated annual financial statements of the municipalities of Lithuania, and (3) to identify specific factors (municipality characteristics) having an impact on the accounting information disclosure quality.
The rest of the paper is structured as follows. The subsequent section describes the methodology of research, i.e., the data, variables and methods. The next section provides the empirical results and discussion. In the last section, the concluding remarks are presented.
2. Methodology
During the research, the analysis of financial statements was carried out with the objective to assess the accounting information disclosure quality of the tangible assets in the financial statements of the municipalities of Lithuania.
Financial Reporting Regulation in the public sector in Lithuania: Following the reform of accounting and financial reporting system in the public sector of Lithuania, since 1 January 2010, the accounting regulation in Lithuania is implemented on several levels. The first level of regulation is the Republic of Lithuania Accounting Law, valid for all economic entities (both private and public). This Law shall govern the accounting of assets, equity, funding sums and liabilities of legal persons <…>, also the organisation and handling of accounting thereof. (Article 1, Accounting Law of the Republic of Lithuania). The second level of regulation is the legislation for the preparation of annual financial statements. In the public sector—Public Sector Accountability Law of the Republic of Lithuania (adopted on 26 June 2007). The third level of regulation—standards specifying financial accounting content and accounting policies. In the public sector—the (
Public Sector Accounting and Financial Reporting Standards (PSAFRSs) n.d.).
On the one hand, Lithuanian normative documents indicate that if there is no specific requirement, the head of a public sector entity has to choose an accounting policy that ensures that the information in financial statements is: (1) adequate for financial statement information of users’ decisions, (2) reliable and (3) comprehensive in all respects. On the other hand, public sector entities are subject to strict standards. This is justified by the provisions of these standards.
Firstly, if a public sector entity keeps accounts in breach of any one of the PSAFRS or its requirements, it cannot claim that the financial statements have been prepared in accordance with the PSAFRSs. Hence, deviations from the standards are not allowed.
Secondly, the financial reporting forms provided by PSAFRSs are mandatory, i.e., a public sector entity cannot change the way information is presented and grouped. A public sector entity may change the presentation of information in the financial statements only when permitted by PSAFRSs.
Thirdly, if the information not specified by PSAFRSs is relevant to users of the financial statements, such information should be disclosed in the explanatory notes. More detailed information on the articles where the amounts are significant, if the mandatory submission of this information is not regulated by PSAFRSs, should be included in the notes.
In this study, we focus on the presentation of mandatory disclosure, i.e., disclosures required by the accounting standards in the financial statements.
2.1. Data
The research provides an analysis of the annual financial statements of 60 municipalities of Lithuania. The sample included the consolidated annual financial statements of the municipalities of Lithuania for the time period of 2013–2016.
Reports are gathered from municipal websites, where they must be published on a mandatory basis. Not all municipalities have complied with this mandatory requirement, i.e., not all of them provide financial statements on their websites. The research included the analysis of 56 sets of financial statements of Lithuanian municipalities.
Based on these assumptions, the starting point for the research was 2013. Firstly, since 2010, after the Public Sector Accounting and Financial Reporting Reform, there was a shortage of qualified accountants and the accountants working in the public sector still lacked theoretical knowledge. Therefore, until 2013, the training of public sector accountants was organized through seminars and consultations in the workplaces. Secondly, in 2013, the accounting staff of municipalities had the training of new accounting standards already completed and, accordingly, had to be sufficiently qualified to prepare sets of financial statements that comply with the accounting standards.
Characteristics data of the municipalities such as size, total assets, tangible assets, total liabilities, government funding revenue and total revenue are collected from their annual financial statements or websites.
2.2. The Dependent Variable: Accounting Information Disclosure Quality
According to
Hassan and Marston (
2010), “disclosure is a theoretical concept that is difficult to measure directly”. As
Beattie et al. (
2004) state, the disclosure index can solve this problem, and describe this index as “a fairly objective, form-oriented content-analytic method”.
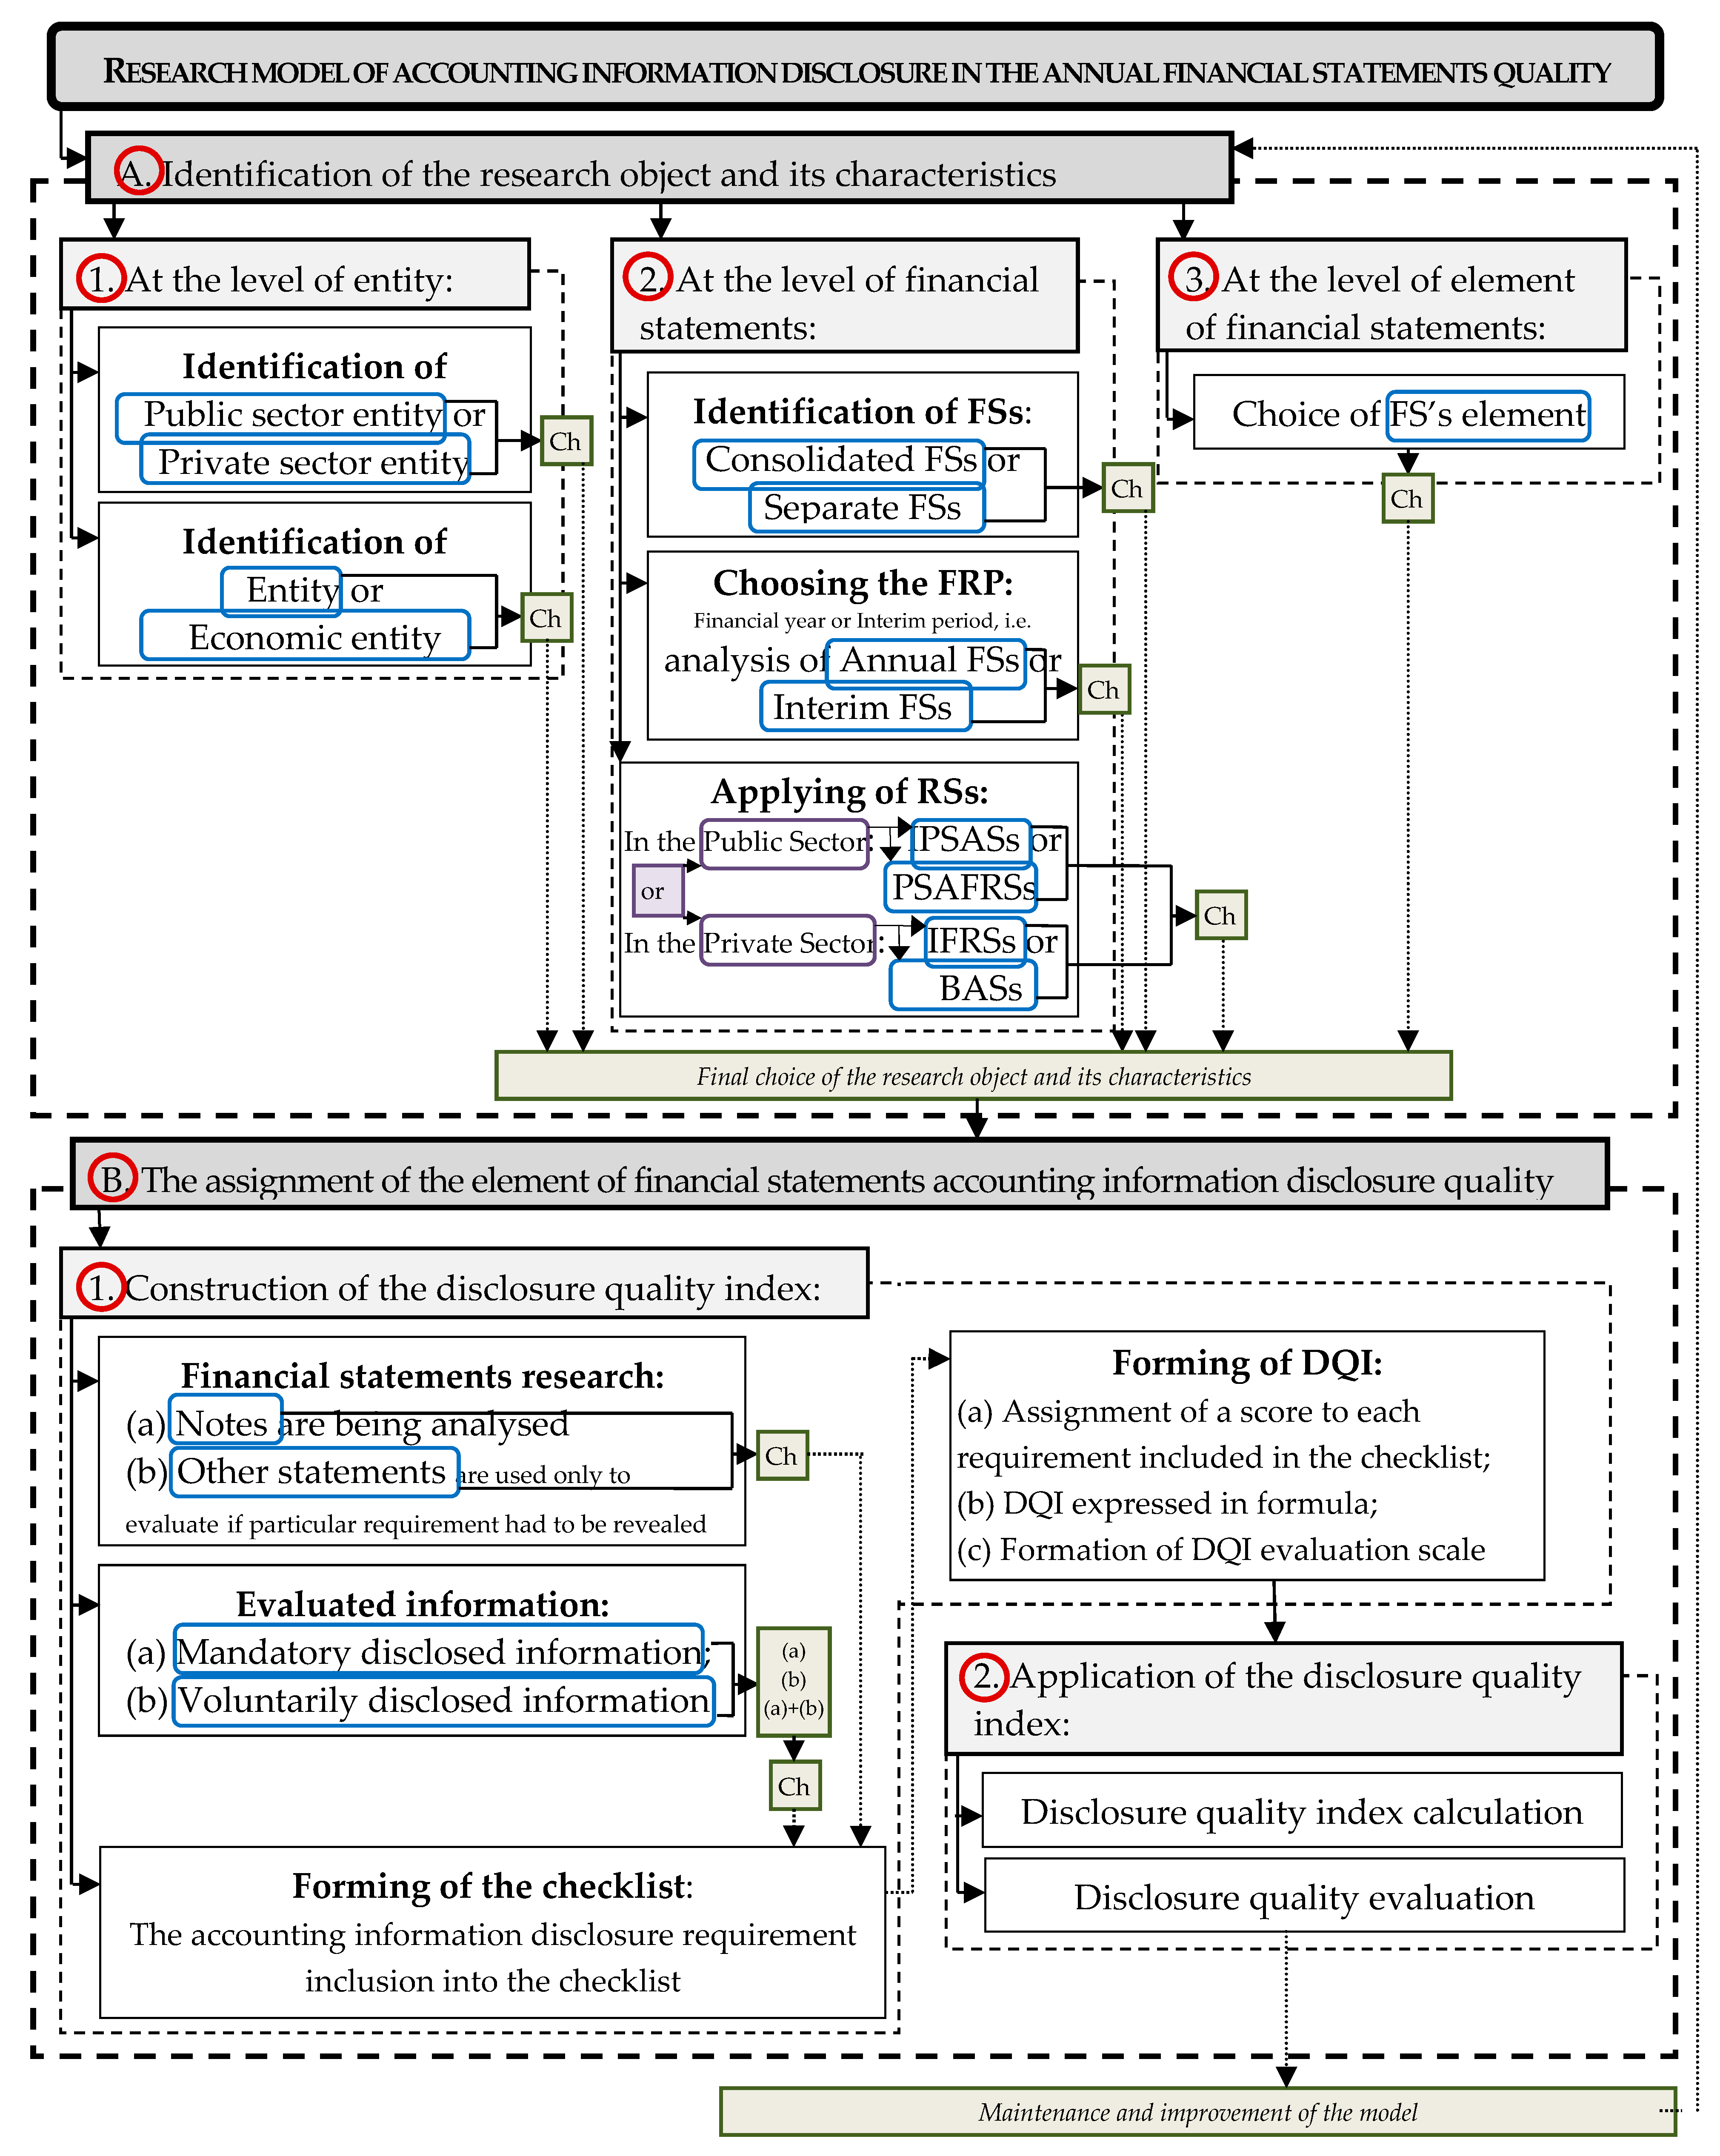
Therefore, in particular, it is appropriate to apply an evaluation model of accounting information disclosure in the annual financial statements’ quality. It is not recommended to evaluate the whole set of financial statements, but its single accounting information disclosure quality elements (e.g., tangible assets, inventories, revenue and other). Hence, the model is orientated to a specific (chosen) element of financial statements accounting information disclosure quality.
Firstly, the research object and its characteristics are identified.
Research object. It is the element of financial statements accounting information disclosure quality (hereinafter accounting information disclosure quality (AIDQ)). The characteristics of the research object are developed at the level of (1) the entity, (2) financial statements and (3) element of financial statements (
Figure 1), which will be discussed in detail.
(1) Identification of entity. There are two possibilities: (a) Public sector entity (PSE) or private sector entity (PrSE) and (b) the entity or economic entity. According to International Public Sector Accounting Standard (IPSAS) 1, an economic entity means “a group of entities comprising the controlling entity and any controlled entities” (
IPSASB 2018a).
(2) Identification of financial statements. (a) Consolidated financial statements or separate financial statements are analysed. According to IPSAS 35, consolidated financial statements are the financial statements of an economic entity “presented as those of a single economic entity” (
IPSASB 2018b). It is worth noting that these statements are defined parallel with International Accounting Standard (IAS) 28 (
International Financial Reporting Standards (IFRSs) 2008). (b) A financial year or a shorter financial reporting period (interim period) is chosen to analyse, i.e., it is selected whether annual or interim financial statements shall be analysed. (c) Evaluation of the standards, according to which annual financial statements are prepared, is discussed. Financial reports can be prepared in the public sector according to International Public Sector Accounting Standards (IPSASs) or National Public Sector Accounting Standards (NPSASs)—in the case of Lithuania—(
Public Sector Accounting and Financial Reporting Standards (PSAFRSs) n.d.). In the private sector, the entity can follow International Financial Reporting Standards (IFRSs) or National Accounting Standards (NASs)—in the case of Lithuania—Business Accounting Standards (BASs).
(3) Identification of an element of financial statements. The researched element of a financial statement is chosen (e.g., intangible assets, tangible assets, inventories, revenue and other.)
In this research, the tangible fixed assets are selected as the element of financial statements. The annual financial statements of the municipalities of Lithuania are analysed as the public sector economic entities. Moreover, the municipalities prepare the annual financial statements using the PSAFRSs.
The assignment of the element of financial statements accounting information disclosure quality: The identification of the research object, i.e., an element of financial statements provides the possibility to assess the accounting information disclosure quality (AIDQ) of the evaluated element of financial statements.
The AIDQ assessment consists of two stages (
Figure 1): (1) construction and (2) application of the disclosure quality index (DQI), which will be discussed in detail.
Construction of the disclosure quality index involves (i) the financial statements research, (ii) the evaluated information, (iii) the forming of the checklist, and (iv) the forming of DQI.
(i) Financial statements research. The previous research has shown that the AIDQ is evaluated by analysing the notes, i.e., one of the financial statements. Other statements are used only to the extent necessary to assess whether a particular requirement should have been disclosed.
(ii) Evaluated information. Accounting information disclosed in the annual financial statements can be mandatory or voluntary. This information can be defined in IPSAS 1. Mandatory disclosed information is described as follows: “the notes shall disclose the information required by IPSASs that is not presented on the face of the statement of financial position, statement of financial performance, statement of changes in net assets/equity or cash flow statement” (
IPSASB 2018a). The list of mandatory disclosed information is usually indicated in accounting standards. In the case of Lithuania, according to PSAFRS 6 (Article 15) (
Public Sector Accounting and Financial Reporting Standards (PSAFRSs) n.d.), (a) the public sector subject, when forming notes, has to provide explanatory notes that are mandatory under PSAFRSs requirements, and (b) explanatory notes can be omitted, if no relevant information is available in the financial statements for the current and prior reporting period, i.e., the sums of the items in the financial statements are equal to zero.
The importance of the mandatory disclosed information is discussed in the scientific literature. According to
Abdullah and Minhat (
2013), “mandatory disclosure is the minimum information which promulgated regulation requires from a reporting entity”, consequently, “failure to publish mandatory information can be easily identified”. Moreover, according to Pownall and Schipper (as cited by
Abdullah and Minhat (
2013)), “mandatory disclosures increase transparency by providing insight on the accounting policies and underlying assumptions”.
According to IPSAS 1, voluntarily disclosed information is described as follows: “the notes shall provide additional information that is not presented on the face of the statement of financial position, statement of financial performance, statement of changes in net assets or cash flow statement, but that is relevant to an understanding of any of them” (
IPSASB 2018a).
Prior research (
Hassan and Marston 2010;
Pivac et al. 2017) indicate that the “disclosure index could include mandatory items of information and/or voluntary items of information”. In this research, the DQI includes only mandatory information, while voluntarily provided information is not being assessed.
(iii) Forming of the checklist. According to
Pivac et al. (
2017), “disclosure indexes are commonly based on a text analysis” conducted through an a priori defined checklist. In this research, an original checklist is structured to evaluate the AIDQ of the tangible assets in the financial statements of the municipalities of Lithuania. This method of research was chosen as (a) the disclosure of tangible fixed assets in public sector subjects of Lithuania, investigated for the first time, while in previous research there was no checklist to evaluate the AIDQ. (b) Information on tangible fixed assets, which is mandatory to be disclosed in PSAFRSs (specifically in PSAFRS 12), differentiates from the required information in IPSASs (specifically IPSAS 17 “Property, plant and equipment”) and IAS (specifically IAS 16). Therefore, there is no possibility to use previously structured indexes in other countries.
This research examines specifications indicated in the balance of non-current tangible assets in notes, as much as it is required by PSAFRS 12.
Appendix A (
Table A1) presents the checklist formed of information required by the PSAFRS 12. The checklist consists of 17 requirements, which are divided into two groups: (1) common requirements—disclosed information about tangible and intangible assets (11 requirements) and (2) specific requirements—given information includes only non-current tangible assets (6 requirements).
(iv) Forming of disclosure quality index. It involves the following: (a) assignment of a score to each requirement included in the checklist, (b) disclosure quality index expressed in the formula and (c) the formation of the scale of disclosure quality index evaluation.
(a) Assignment of a score to each requirement included in the checklist. The weights of the items included in the index can differ (
Pivac et al. 2017) or be equal (
Street and Bryant 2000;
Hassan et al. 2008). Following an assumption that every accounting information disclosure is equally important, in this research, the disclosure quality based on an unweighted index has been assessed. A score of “one” is assigned to the disclosed requirement, and “zero”—otherwise.
In the research, (
Kanapickienė et al. 2019) a problem-solving approach is used to provide the criteria in notes tables, which are not followed by zero meaning (as the confirmation that during the reporting period the scope of the researched criterion equals zero) or a hyphen (as confirmation that a public sector entity (or economic entity) during the reporting period did not have any assets); however, the cell left empty, without inserted data, is considered as the refusal to present any particular information.
(b) Disclosure quality index expressed in the formula. The disclosure quality index (DQI) is defined following the viewpoint of
Street and Bryant (
2000) and
Pivac et al. (
2017), who claim that, “the total disclosure index is measured as the sum of scores awarded to a particular entity in a particular year divided by the maximum number of applicable items (in order not to penalize entities for disclosing clearly non-applicable items of information)”.
The DQI Index was computed by the following equation:
where
is entity’s actual disclosure score;
xi is score of i component (i = 1 to N) (a score of 1 is assigned to the disclosed requirement, and 0—otherwise), N is the number of mandatory disclosed elements, (N-n)—of applicable elements and n—of non-applicable elements.
(c) Formation of disclosure quality index evaluation scale. In the structuring of the DQI rating scale, it is considered that DQI = 0, when no information is disclosed and DQI = 100, when information is fully disclosed. In this research, the DQI rating scale suggested by
Pivac et al. (
2017) is used: quality measures of the financial statements are: “poor quality (DQI 0–20), low quality (DQI 21–40), average quality (DQI 41–60), sufficient quality (DQI 61–80) and high quality (DQI 81–100)”.
The process of the disclosure index application involves two main steps (
Figure 1), the realization results of which are described in
Section 3. It is also necessary to mention that the maintenance and improvement of the model must be realized, which ensures the feedback in the model.
2.3. The Independent Variable and Development of Hypotheses
In order to explain accounting practice, the research is based on several theories, which we will briefly discuss.
Agency theory is based on the self-interest of the agents and the principals. In the public sector, according to
Zimmerman (
1977), politicians (the agents) are self-interested in the maximisation of their wealth, which depends on their re-election, advancement, and current and future income. Voters (the principals) are also self-interested to increase their wealth, which, in addition, is related to the actions of their agents. Thus, the voters (the principals) have an incentive to monitor the behaviour of politicians (the agents). Accounting disclosure level is explained based on agency theory by
Zimmerman (
1977);
Giroux and McLelland (
2003);
Laswad et al. (
2005);
Falkman and Tagesson (
2008);
Garcia and Garcia-Garcia (
2010);
Ali and Saidin (
2016) and other researchers.
The concept of agency theory is the background of positive accounting theory. As stated by
Falkman and Tagesson (
2008), accounting has the function of producing information for decision-makers and the selection of accounting solutions is affected by the relative power between the agent and the principal.
Zimmerman (
1977) has shown that the politicians (the agents) will prefer an accounting system which allows them to report a selective subset of information to different groups and the voters (the principals) can use accounting information.
The accounting disclosure level is explained based on institutional theory. Using this theory, it is explained how institutional and organisational pressures constrain accounting choice in the public sector.
Carpenter and Feroz (
2001) have stated that “in the public sector, where statutes often dictate the choice of accounting methods, interest-maximizing accounting bureaucrats may not independently have the political influence or organisational power necessary to change the accounting practices of governmental entities”.
In analysing the compliance with mandatory disclosure,
Mir et al. (
2019) have used legitimacy theory that explained that “organisation will continue work to ensure that the organisation operates within the frame and norms that exist in community or environment in which the organisation was and continues to ensure that activities of the organisation accepted by stakeholders as legitimate”. Following this theory,
Gabrini (
2013) states that failures in the governance of a certain institution may cause stakeholders to question the transparency of government activities. Disclosure can be perceived as a communication tool to inform stakeholders about the state and performance of the organisation, which ensures the legitimacy of the organisation’s activities.
Accounting disclosure decisions are explained using information asymmetry theory. According to Chang (2008) and
Chen et al. (
2016), information asymmetry between the public (voters) and the government creates a strong desire for access to information.
To sum up, in this research the selection of independent variables is explained using these theories.
2.3.1. Size of Municipality
Martani and Lestiani (
2012) argue that the increasing size of the local government will make the voters concerned about its performance. Researchers (
Garcia and Garcia-Garcia 2010;
Ali and Saidin 2016;
Moreno-Enguix et al. 2019) agree that the size of the organisation in the public sector is considered as one of the determining variables of accounting practices and characteristics of financial disclosure, which is based on different theories. For instance, following the positive accounting theory,
Falkman and Tagesson (
2008) have claimed that size should influence the political pressure that municipalities experience to comply with accounting standards. According to
Gabrini (
2013), one of the factors related to the theory of legitimacy is the aspect of visibility that is determined by the size of the subject, i.e., larger public sector entities are more visible in society and, according to legitimacy theory, these entities should be motivated to disclose more information in order to meet public expectations.
Hypothesis 1. Size of municipality is significantly positively related to the level of the accounting information disclosure quality (AIDQ).
Ingram (
1984) and
Martani and Lestiani (
2012) have used a number of inhabitants as a measure of the complexity of governance that was encouraging municipalities to improve disclosure in financial reports. Researchers rely on the notion that “more population means that the government must provide more public services to the society”. In this research, the size of a municipality is measured by a number of inhabitants for a municipality (TPop). A new measure—population density (PopDen)—is also proposed, as not only the size of the population but also the area occupied by the municipality is important for describing the size of a municipality.
Other researchers select different measures to assess the size of the municipality. (1) The size of municipality is measured by municipality assets. For instance,
Laswad et al. (
2005) have used total assets,
Gordon et al. (
2002) have used a natural log of gross assets adjusted for interfund receivables/payables and
Mir et al. (
2019) have used a logarithm of total year-end assets. In this research, the size of municipality measured by natural logarithm of total assets for a municipality (lnTA) is used as a control variable (see
Table 1). (2)
Laswad et al. (
2005) and
Falkman and Tagesson (
2008) have used total revenue (TR) that is used as a control variable in this research.
2.3.2. Municipality Debt-Paying Capacity and Municipality Indebtedness
The motivation to disclose information can be explained by agency theory. The contractual relationship of separate interest groups raises incentives to report information to the public.
Zimmerman (
1977) argues that “politicians have incentives to reduce the cost of debt, thereby increasing the resources available for other programs which increase the politician’s welfare more than paying higher interest”. Therefore, as discussed by
Laswad et al. (
2005), “such incentives motivate public sector managers to provide information for the monitoring of their actions”.
Giroux and McLelland (
2003) extend this point of view and claim that “financial conditions should be positively related to disclosure levels since the entity has incentives to signal financial health to creditors, voters and other users of financial information”.
Garcia and Garcia-Garcia (
2010) agree to this approach and claim that “the incentive to reduce financing costs may lead politicians to provide financial information that signals a low level of financial risk”. Thus, it can be stated that higher debt-paying capacity (lower liabilities to the ratio of assets) should increase the motivation of a municipality to disclose information in greater detail. Based on these statements, the second hypothesis is formulated as follows:
Hypothesis 2. Municipality debt-paying capacity is significantly positively related to the level of accounting information disclosure quality (AIDQ).
The researchers select different measures to assess municipality debt-paying capacity. For instance, for assessment of leverage,
Laswad et al. (
2005) use two measures: long-term liabilities divided by total assets and long-term liabilities divided by total public equity. In this research, the ratio of total liabilities-to-total assets (TL/TA) is used as a measure of municipality debt-paying capacity.
For assessment of financial condition
Giroux and McLelland (
2003) also use two measures: Total debt in the general long-term debt account group to total revenues and general fund equity divided by general fund revenues. In this research, these measures, named as ratio municipality debt turnover (TL/TR), is used as a control variable.
Hypothesis 3. Indebtedness of municipality is significantly positively related to the level of the accounting information disclosure quality (AIDQ).
2.3.3. Municipality Tangible Assets
IPSAS 1 describes an asset as resources “controlled by an entity as a result of past events and from which future economic benefits or service potential are expected to flow to the entity”.
Increasing assets will make the voters concerned about the performance of local government. According to
Mir et al. (
2019), assets of local government influence the compliance with mandatory disclosure.
Garcia and Garcia-Garcia (
2010) have determined that when local governments invest heavily, they are also more concerned with the reporting of financial information. It is based on the fact that “most citizens have a positive attitude towards public projects that require an important investment effort because they understand that they will improve their living conditions”. Moreover,
Bunget et al. (
2014) show that “the municipalities with the largest value of intangible assets show a higher disclosure index”.
Analysing the size of the municipality as an independent variable, we have shown that in the works of some researchers (
Gordon et al. 2002;
Laswad et al. 2005;
Mir et al. 2019), the size of municipality is measured by municipality assets. As the object of this research is municipality tangible assets, this type of asset is selected as an independent variable.
Based on these statements, the fourth hypothesis is formulated as follows:
Hypothesis 4. Municipality tangible assets are significantly positively related to the level of accounting information disclosure quality (AIDQ).
In this research, the municipality tangible assets are measured by the ratio of tangible assets-to-total assets (TngA/TA) and the tangible assets per capita (TngAperCap).
2.3.4. Municipality Dependence on Central Government Funding
Organisations that provided resources to municipalities (including the government) can exercise power over them.
Falkman and Tagesson (
2008) refer to “the more dependent the organisation is, the more pressure it will feel”. This statement might be discussed in greater detail. The central government adopts the National Public Sector Accounting Standards (NPSASs) (in the case of Lithuania—(
Public Sector Accounting and Financial Reporting Standards (PSAFRSs) n.d.) are adopted by the Minister of Finance.). The accounting standards are used by municipalities to prepare financial statements. Moreover, a significant part of municipality revenue comes from the central government. Therefore, the government can use its power to dictate the municipalities to use the accounting standards—in case of Public Sector—NPSASs. Thus, as
Giroux and McLelland (
2003) claim, “high levels of grants should be associated with greater compliance with requirements” of the government—in this case—accounting requirements of the government.
Falkman and Tagesson (
2008) point out that “compliance by municipals to the accounting standard was influenced by the amount of income derived from central government grants”.
Martani and Lestiani (
2012) further elaborate on this statement and claim that, “if the proportion of the local budget coming from central government is high, the local government will increase disclosures” of financial information and their research results show that “the level of local dependence on central government has a positive relationship to the level of disclosure”; however, this relationship is not significant to the level of disclosure. Based on these statements, the fifth hypothesis is formulated as follows:
Hypothesis 5. Municipality dependence on central government funding is significantly positively related to the level of accounting information disclosure quality (AIDQ).
2.3.5. Control Variables
As
Li (
2016) points out, three major sources of endogeneity problems are “omitted variables, simultaneity, and measurement error”. In order to solve the endogeneity problem, it is proposed by
Li (
2016) to “include as many important and time-variant control variables as possible”.
In prior research of enterprises (
Li 2016;
Hassan 2018;
Cho et al. 2019), different variables of enterprise characteristics are used as control variables. For example, to analyse the relationship between CSR (corporate social responsibility) and firm value, researchers (
Li 2016;
Cho et al. 2019) select firm size, leverage and the expenses of research and development as the control variables. ROA (return on assets), advertising expense (
Li 2016), ratios of capital expenditure and book-to-market, cash flows from operating activities and the standard divergence from daily stock returns (
Cho et al. 2019) are being chosen too.
In this research, the financial ratios and financial data of municipality discussed in previous research are used as control variables. Nine control variables are collected (
Table 1), the selection of which is discussed in more detail.
(i) Municipality debt turnover (measured as total liabilities and total revenue ratio (TL/TR)). The choice of this control variable is based on the analysis of the variable municipality debt-paying capacity.
(ii) Municipality tangible assets (measured as tangible assets per capita (TngAperCap)). The choice of this control variable was determined by previous research.
Garcia and Garcia-Garcia (
2010) and
Moreno-Enguix et al. (
2019) have investigated investment as an independent variable.
Moreno-Enguix et al. (
2019) have determined that the variable investment do not show any significant relation with the variable quality of the financial information disclosed.
Garcia and Garcia-Garcia’s (
2010) research shows a positive and statistically significant relationship.
(iii) Municipality tangible assets (expressed as natural logarithm of tangible assets (lnTngA)). As TngAperCap variable is selected, it is important to evaluate the effect of the lnTngA variable as well.
(iv) Municipality assets (expressed as total assets per capita (TAperCap)). As lnTA variable is selected, it is important to evaluate the effect of the TAperCap variable as well.
(v) Municipality assets (expressed as natural logarithm of total assets (lnTA)). The choice of this control variable is determined by the analysis of the variable: size of municipality.
(vi) Municipality revenue (municipality total revenue (TR)). The choice of this control variable is determined by the analysis of the variable: size of municipality.
(viii) Municipality revenue (municipality total revenue per capita (TRperCap)). As the TR variable is selected, it is important to evaluate the effect of TRperCap variable as well.
(viii) Municipality wealth (municipality own revenue (difference between total revenue and government funding revenue) (TR-GFR)). As the TR-GFRperCap variable is selected, it is important to evaluate the effect of the TR-GFR variable as well.
2.4. Model Specification and Variable Measurement
Identification of DQI factors using panel regression model: The last step of analysis is to identify specific factors (municipality characteristics) having an impact on QDI. Taking into account the number of periods analysed (4 years: 2013–2016), as well as municipalities observed (56), as it is not sufficient to analyse the dynamics of DQI and its factors properly in terms of time, panel data models that allow using a larger volume of data are chosen. In this case, the variation within a group of 56 municipalities as well as the municipalities in the period of 2013–2016 is examined. Thus, a single group (56 municipalities × 4 years) including the observations of all selected groups allows for acquiring reliable results of the statistical analysis.
As a reference point, in this research, the invariant constant panel model, including a dependent variable (accounting information disclosure quality (DQI)), 6 independent variables ((i) size of municipality (number of inhabitants for a municipality (TPop), population density in a municipality (PopDen)), (ii) municipality debt paying capacity (the ratio of total liabilities-to-total assets (TL/TA)), (iii) municipality indebtedness (total liabilities per capita (TLperCap)), (iv) municipality tangible assets (the ratio of tangible assets-to-total assets (TngA/TA)) and (v) municipality dependence on central government funding (government funding revenue-to-total revenue ratio (GFR/TR)) and control variables (ConVar) is created (
Table 1):
In this model, coefficient α constant is identical for all observed objects (municipalities),
j = 1 to 56 and corresponds to municipalities,
t = 1 to 4 and corresponds to year,
k = 1 to 9 and corresponds to control variables and
ε corresponds to error. A multivariate regression model is created using the method of least squares. Having excluded insignificant variables, the final panel regression model is created. The descriptive statistics of independent and control variables is provided in
Table 2.
3. Results and Discussion
Evaluation of the accounting information disclosure quality using the disclosure quality index. Data analysis revealed that, throughout the reporting period, in the explanatory notes, the number of cases of information disclosure on tangible assets had increased according to the following DQI components: G1, G2, G3, G4, G7, S1, S2, S3, S4.1, S4.2, S4.3 (
Appendix B,
Table A2). It can be concluded that in an overall analysis of the frequency of disclosure of tangible assets in explanatory notes of municipalities, the disclosure of the disclosure quality index (DQI) components is (
Table 3):
1. The most frequent: G1.2, G1.3, G3, G4, G9. It can be stated that general requirements are disclosed best. Such information on (i) assets accounting policies as depreciation and measurement methods (G1.2, G1.3) is best disclose; however, the methods of assets recognition (G1.1) are disclosed less frequently. (ii) The acquisition or production cost of fully depreciated assets, which is still in use in the activities (G4) and (iii) assets reconciliation of the carrying amount at the beginning and the end of the period (G3, G9). G3 and G9 might be clarified given that this information must be included in the tables of standard format.
2. The least frequent: G5, G6, G8, S1, S2, S4.1, S4.2, S4.3. The specific requirements can be defined as the least disclosed. The least frequent disclosures are the following: (i) Carrying an amount of assets restricted by contracts and law acts (G5), (ii) carrying an amount of assets reported as security for liabilities (G6), (iii) carrying an amount of interim idle assets in a public sector entity (PSE) activity (G8), (iv) carrying an amount of land and buildings, no longer in exploitation in PSE activity and held to earn rentals (S1), (v) the total estimate of contracts for the future acquisition of assets at the last reporting period day (S2) and (vi) information on land, movable or immovable cultural values (S4.1, S4.2, S4.3).
The second part of the research presents the analysis of the municipal tangible assets DQI of the period 2013–2016 (
Appendix B,
Table A3). Analysis of DQI variation trends in the period of 2013–2016 revealed that (1) since 2013 to 2016, DQI had increased in 29 municipalities (X3, X4, X5, X8, X9, X11, X12, X15, X18, X19, X20, X24, X27, X28, X29, X30, X35, X36, X38, X39, X40, X42, X44, X45, X49, X53, X56, X57, X58); however, the DQI regression equation made for each municipality provides stable growth trend of DQI in 16 municipalities (X4, X5, X12, X15, X19, X20, X24, X27, X29, X35, X36, X39, X45, X49, X53, X58, where R2 > 0.6). (2) Ten municipalities (X1, X2, X21, X32, X33, X41, X50, X52, X55, X60) observe a decrease in the disclosed information.
In virtue of DQI analysis: (1) in 2013, the accounting information disclosure quality was: (i) very low (DQI 0–20) in 5 municipalities, (ii) low (DQI 21–40) in 24 municipalities, (iii) the average (DQI 41–60) in 13 municipalities, (iv) sufficient (DQI 61–80) in 3 municipalities and (v) high (DQI 81–100) in 2 municipalities. (2) In 2016, the accounting information disclosure quality was: (i) very low (DQI 0–20) in 5 municipalities, (ii) low (DQI 21–40) in 15 municipalities, (iii) the average (DQI 41–60) in 20 municipalities, (iv) sufficient (DQI 61–80) in 12 municipalities, (v) high (DQI 81-100) in 2 municipalities. It means that during the reporting period, the municipal DQI has increased: the number of municipalities with low and high information disclosure quality remained unchanged, the number of municipalities with low DQI in the period of 2013–2016 decreased by 37.5%, the number of municipalities with an average DQI increased by 45% over the same period, while the number of municipalities with sufficient DQI increased even 4 times.
Descriptive statistics of DQI are reported in
Table 4. During the reporting period (2013–2016), the results indicated the increase of DQI.
In 2013, on average, the municipalities of Lithuania had disclosed 37.87% (respectively, 44.44% in 2014, 45.82% in 2015 and 45.50% in 2016) of the information of mandatory disclosure on tangible assets. The lowest found value of the disclosure index during the period in question was 6 (12 in 2014–2016, respectively) and the highest was 82 (82 in 2014 and 2016, respectively, and 94 in 2015). The lower quartile in 2013 shows that 25% of Lithuanian municipalities have disclosed less than 29% (35% in 2014, 34.5% in 2015 and 30.5% in 2016, respectively) of the information of mandatory disclosure. The top quartile indicates that 75% of all examined municipalities revealed less than 45.5% (56% in 2014, 54.5% in 2015 and 62% in 2016, respectively) of the mandatory disclosure information on tangible assets (see
Table 4).
It is ascertained that the municipalities of Lithuania in 2013 on average have revealed 37.87% of the information of mandatory disclosure on tangible assets, which allows for making an assumption that on average, the accounting information disclosure quality was low (DQI 21–40) (accordingly, average (DQI 41–60) in 2014–2016). The results cannot be compared to those of other authors, as the quality of the tangible assets of accounting information disclosure in the financial statements of the municipalities of Lithuania has not been studied by other authors. A similar conclusion compared to the research carried out in other countries (
Adi et al. 2016;
Martani and Lestiani 2012;
Falkman and Tagesson 2008), i.e., low disclosure level, is drawn.
Martani and Lestiani (
2012) used the mandatory disclosure required by the Indonesian Government Accounting Standard and examined compliance of local government financial accounting with accounting standards. The research result shows that the disclosure level of the local government is very low (on average, 35.45%).
Falkman and Tagesson (
2008) have investigated compliance with accounting standards in Swedish municipalities. The findings of the research reveal that, in general, compliance with accounting standards was poor.
Adi et al. (
2016) have analysed the disclosure of management performance in the Government of Indonesia and showed that the published information disclosed only 35.46% of the required information.
Moreno-Enguix et al. (
2019) have observed that 43.5% of Spanish municipalities do not disclose the financial information required by law. The conclusion is explained by the recent establishment of new accounting standards in the public sector.
On the one hand, the low level of disclosure regarding this issue can be explained by the fact that municipalities provide all the mandatory information in the explanatory notes without considering its relevance. However, the disclosure of mandatory but irrelevant information can cause problems for stakeholders to make decisions. On the other hand, when the government standardizes the presentation of mandatory information (e.g., by providing standardized tables), the authors of the explanatory notes provide tables with blank cells. It also creates confusion as it was unclear whether the financial amount to be disclosed, in this case, tangible assets, is missing or its value is zero. As well, it poses problems in the evaluation of financial statements’ information. This issue, therefore, requires further consideration.
Identification of specific factors (municipality characteristics) having an impact on the accounting information disclosure quality. Finally, the research aimed to identify the factors (municipality characteristics) that may have an impact on information disclosure quality (DQI). Panel regression models are constructed on the basis of the methodology revealed in
Section 2.
At first, binary panel linear regression models are constructed to reject insignificant variables. DQI factors binary panel regression models are shown in
Table 5.
Based on the results of
Table 5 (t value and
p statistics): (i) four control variables (lnTngA
jt and lnTA
jt, TR
jt and (TR-GFR)
jt), proved to be significant at the 99% confidence level and are selected for futher calculations and (ii) four control variables (TngAperCap
jt, TAperCap
jt, TRperCap
jt, (TR-GFR)perCap
jt) are eliminated from further research as insignificant and providing the similar information as independent variables TngA/TA
jt and GFR/TR
jt.
Whereas certain significant control variables (lnTngA
jt and lnTA
jt; TR
jt and (TR-GFR)
jt) considerably correlate with each other (Corr(lnTngA
jt, lnTA
jt) = 0.9937 and Corr(TR
jt, (TR-GFR)
jt = 0.9934), they cannot be applied in the same panel regression model. Consequently, three primary multivariate linear regression models with dependent (DQI) and six independent variables and a few of four selected control variables are created (
Table 6): (i) Model I includes six independent variables, (ii) Model II includes six independent variables and two “best performing” control variables (with highest p statistics) and (iii) Model III includes six independent variables and two control variables the least correlating with corresponding independent variables (Corr(lnTngA
jt, TngA/TA
jt) = −0.5903, Corr(TRjt, GFR/TRjt = −0.3261, while Corr(lnTAjt, TngA/TAjt)=−0.6781, Corr(TR-GFRjt, GFR/TRjt = −0.3734).
After checking all reasonable combinations of variables, the final DQI factors’ models (Model I, Model II, Model III) are created (
Table 7). Having estimated the statistical characteristics of each independent variable included in the primary Model I, three irrelevant independent variables were eliminated from the model—size of municipality (TPop
jt), municipality indebtedness (TLperCap
jt) and municipality dependence on central government funding (GFR/TR
jt). One additional independent variable (municipality size (PopDen
jt)) was eliminated from Model II and Model III. Control variables, measuring municipality assets (lnTA
jt) and municipality tangible assets (lnTngA
jt), were eliminated from Model II and Model III, respectively. Generally, all of the three final DQI factors models are significant at the level of 90% confidence (10% probability).
Panel estimation of disclosure quality in municipalities (
Table 7) reveals that: (i) three out of six selected independent variables (size of municipality (population density in municipality (PopDen), municipality debt-paying capacity (total liabilities-to-total assets ratio (TL/TA) and municipality tangible assets (tangible assets-to-total assets ratio (TngA/TA)) have a statistically significant impact on DQI (at least 90% confidence level (
p = 0.10)) (Model I). (ii) In the case of municipality size, expressed in total number of inhabitants (TPop), municipality indebtedness (total liabilities per capita (TLperCap) and municipality dependence on central government funding (government funding revenue-to-total revenue ratio (GFR/TR), no statistically significant impact was found (Model I). (iii) Larger municipalities (population density) tend to demonstrate a higher disclosure quality degree (positive impact) (Model I). (iv) Municipalities with higher liabilities and assets ratio (lower debt-paying capacity) and municipalities with higher tangible assets-to-total assets ratio tend to demonstrate a lower degree of disclosure quality estimated by DQI (Model I). (v) Control variables related to revenue of municipality (total revenue (TR) and own revenue or difference between total revenue and government funding revenue (TR-GFR)) were proven to have a statistically significant impact on DQI (95% confidence level (
p = 0.05)) (Model II and Model III, respectively). (vi) Municipalities with higher total and own revenue tend to demonstrate a higher disclosure quality degree (positive impact).
In conclusion, the findings of the research support the following hypotheses: H1 and H2, while hypotheses H3, H4 and H5 cannot be supported (
Table 8).
This research shows that the size of municipality measured by number of inhabitants for a municipality is not related to the level of the accounting information disclosure quality (AIDQ). This result differs from the results by
Giroux and McLelland (
2003),
Falkman and Tagesson (
2008),
Garcia and Garcia-Garcia (
2010),
Martani and Lestiani (
2012) and
Moreno-Enguix et al. (
2019). In their research, the size of municipality measured by number of inhabitants has a positive relationship. However, this research shows that size of municipality measured by population density in a municipality was positively related to the level of the accounting information disclosure quality (AIDQ), on the other hand, this relationship has not been tested in previous studies. It has been found that densely populated municipalities show higher quality of the financial information. According to
Moreno-Enguix et al. (
2019), “these entities have to manage a greater volume of resources, which means developing their accounting, control and internal management systems”.
This research shows that municipality debt-paying capacity is significantly positively related to the level of accounting information disclosure quality (AIDQ). The result is consistent with the findings of previous public sector disclosure studies (
Gore 2004;
Laswad et al. 2005).
Laswad et al. (
2005) have pointed out that political managers of municipalities, which have relatively high debt burdens, realise the financial statements as “a potential means to facilitate the monitoring by creditors”.
This research shows that municipality tangible assets are significantly negatively related to the level of accounting information disclosure quality (AIDQ). Therefore, we cannot claim that the municipalities that invest heavily, are more concerned with the quality of financial information. On the other hand, this relationship has not been tested in previous studies.
This research shows that municipality dependence on central government funding is not related to the level of accounting information disclosure quality (AIDQ). These results support
Ingram (
1984),
Giroux and McLelland (
2003) and
Martani and Lestiani (
2012). It implies that the degree of dependency on the central government does not provide an incentive for the local government to increase the level of disclosure.
Martani and Lestiani (
2012) explain this by stating that “the central government in the autonomy era lacks control over local governments”. On the other hand,
Falkman and Tagesson’s (
2008) results have shown that the tendency of municipalities to comply with the accounting standards decreases with the relative amount of the income of the municipalities that derive from government grants.
The control variables are found to be not significant to the level of accounting information disclosure quality (AIDQ) except for variables TR and TR-GFR. Control variables, the municipality total revenue (TR) and own revenue, i.e., difference between total revenue and government funding revenue (TR-GFR)), have a statistically significant impact on DQI. Whereas,
Laswad et al. (
2005) and
Falkman and Tagesson (
2008) have found a statistically insignificant relationship.
It is important to note, that this research is limited to panel estimation using the invariant constant model (α is identical for all objects). The assessment of DQI factors using the models with fixed effects (different αj for each municipality) and dynamic effects (same α but different error αj = α + vi) as well as the inclusion of additional internal and external factors, could increase statistical characteristics of the assessment of DQI factors, which could be a further direction for future research.
4. Conclusions
In order to carry out more extensive financial reporting quality in the Lithuanian public sector research, first, the status of FRQ must be evaluated. In the course of this research, in accordance with the accounting information disclosure requirements by the national public sector accounting standards (more specifically PSAFRS 12), an original checklist has been structured for the evaluation of the accounting information disclosure quality of the tangible assets in the financial statements of the public sector entities of Lithuania. Based on this checklist, the DQI was constructed. This index is dedicated not only to the assessment of the changes in disclosure quality of the tangible assets over different years in different entities of the public sector but also to the comparison of different entities.
The empirical research showed that the quality of disclosure of tangible assets in separate municipalities of Lithuania increased during the reporting period (2013–2016). Although the overall quality of tangible assets disclosure has improved over time (the results have indicated that DQI mean level increased from 37.87 (standard deviation (SD) = 17.36) in 2013 to 45.50 (SD = 18.65) in 2016)), the disclosure of certain information remains problematic (DQI was only average in 2014–2016). The identification of problem areas might help public sector entities focus on information disclosure in the sets of financial statements.
The study of the information disclosure quality of municipalities in Lithuania revealed that during the reporting period, the information disclosure on tangible assets had increased according to DQI components related to general requirements, while the specific requirements appeared to be the least disclosed.
The research conducted also revealed that in 2013–2016, the DQI had increased in 29 municipalities while 10 municipalities had demonstrated a decrease in the disclosed information.
Generally, it can be stated that during the reporting period, the municipal information disclosure has increased: (i) though the number of municipalities with low and high information disclosure quality remained unchanged, the number of municipalities with low, average and sufficient DQI significantly increased. (ii) On average, in 2013, the quality of accounting information disclosure of Lithuanian municipalities was low (revealed 37.87% of the mandatory information), while in subsequent years, the disclosure of mandatory information increased and the quality of information disclosure became average.
At the 90% confidence level, population density, total liabilities and total assets ratio and tangible assets and total assets ratio of a municipality proved to have a statistically significant impact on DQI. Taking these results into account, it could be stated that larger municipalities tend to demonstrate a higher degree of disclosure quality, while municipalities with lower debt-paying capacity and higher tangible assets to total assets ratio tend to demonstrate a lower degree of disclosure quality.
At the 95% confidence level, municipality total revenue and municipality own revenue (difference between total revenue and government funding revenue) have a statistically significant impact on DQI: municipalities with higher revenue tend to demonstrate a higher degree of accounting information disclosure quality.


