1. Introduction
Over the years, growing integration and globalization has made the world’s economy more interdependent. This interdependence in part reflects the success of decades of liberalization efforts, and is largely the result of expansion, diversification, and the deepening of trade and financial links between countries enhanced by technological developments. In the 1980s, many African governments initiated liberalization efforts as part of structural adjustment programs aimed at promoting economic development. The resulting integration into the world economy not only raised the living standards in many African countries, but also saw the rapid proliferation of telecommunication technology, the globalization of business activity, and increased policy and regulatory coordination.
Although economic integration has yielded numerous benefits, the resulting global interdependency of markets and economies has made countries more vulnerable to fluctuations in prices in the world market and global economic shocks in general. There is growing evidence that mean and volatility spillovers occur between asset markets; that is, events in one market can be transmitted to others, and that the magnitude of such interrelationships may be strengthened during crisis periods. African economies are particularly susceptible to this exposure and vulnerability, given their economic dependence on foreign markets and aid arising from the export of a few primary commodities, structural problems, and weak institutions and policy frameworks (
IMF 2003;
Varangis et al. 2004). Since commodity prices are volatile and subject to frequent shocks, commodity-dependent countries are frequently exposed to large deteriorations in their current account, which may create broader distress across the rest of the economy, compromising financial stability and setting back growth gains that have already been achieved.
Indeed, external shocks such as commodity price fluctuations are often highlighted as one of the major reasons for macroeconomic instability and the poor economic performance of African countries (
IMF 2003;
Raddatz 2007;
Varangis et al. 2004). However,
Raddatz (
2007) found that external shocks, including commodity price fluctuations, explain only a small fraction of the output variance of low-income countries, which includes most sub-Saharan African countries, while other factors—most likely internal causes—are the main source of fluctuations. Nevertheless, the effects of commodity price volatility on output and macroeconomic stability may vary across regions and countries, depending on the duration of the shock, the economic significance of the commodity for the country in question, and whether it is a net importer or exporter of this commodity (
IMF 2003;
UNCTAD 2012;
Varangis et al. 2004).
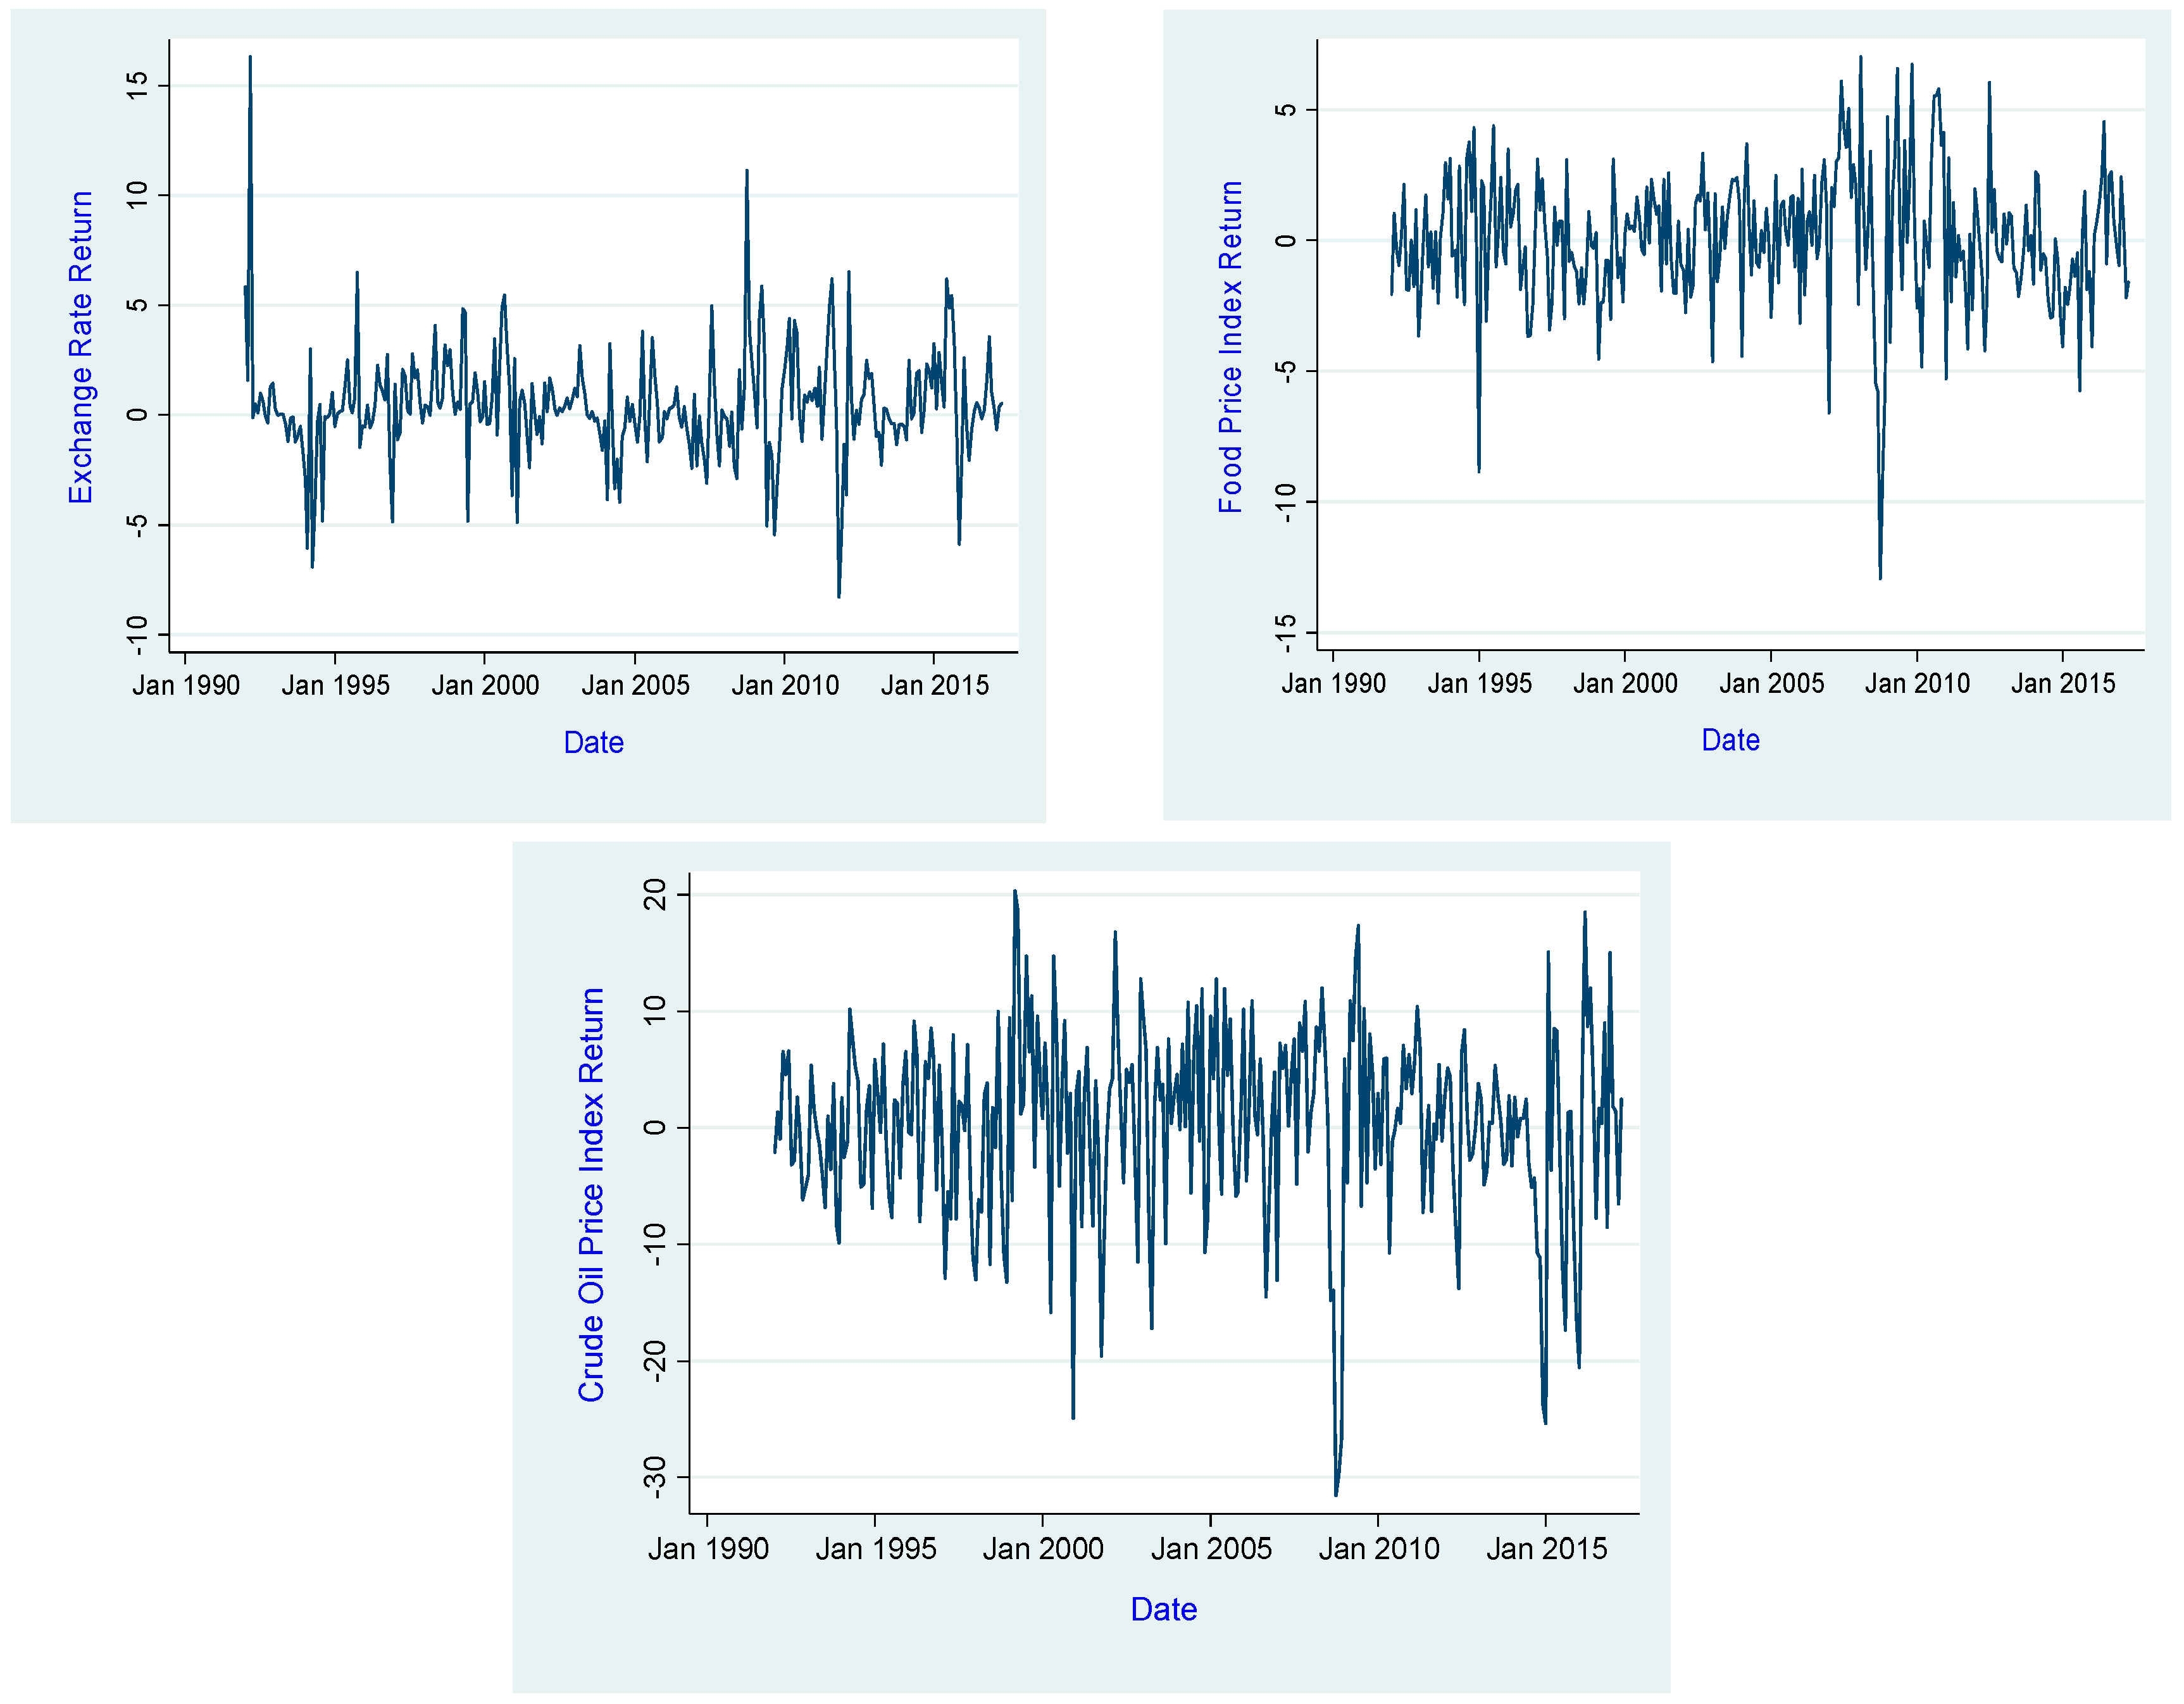
Consequently, understanding the country-specific dynamics of volatility spillovers in international commodity prices on financial stability is important from a policy perspective, especially if appropriate policies that maximize the potential benefits from globalization and minimize the downside risks of destabilization are to be developed. For instance, an understanding of spillover dynamics may inform global policy coordination efforts, as well as inform central banks’ foreign exchange market intervention efforts aimed at maintaining financial sector stability, especially during crisis periods. This notwithstanding, the existing literature provides a paucity of empirical evidence on the effects of commodity price volatility on financial stability in developing countries. This paper undertakes to fill this gap in the extant literature by investigating volatility spillovers between commodity prices and macroeconomic indicators of importance regarding financial stability in Uganda. Specifically, the study investigates the spillover effects of oil and food price volatility on the volatility of a key macroeconomic indicator of importance to financial stability, the nominal Uganda shilling per United States dollar (UGX/USD) exchange rate. The study focuses on the UGX/USD exchange rate, mainly because it accounts for a majority of foreign currency transactions in the Ugandan economy. To the best of our knowledge, this is the only study that investigates the spillover effects between commodity price volatility and financial sector stability in the context of Uganda. The rest of study is organized as follows:
Section 2 presents a brief overview of the Ugandan financial sector stability;
Section 3 provides a brief review of the literature, while
Section 4 presents the methodology applied. Empirical results are provided in
Section 5, and conclusions with recommendations are drawn in
Section 6.
2. Overview of Financial Sector Stability
Undeniably, Uganda’s rapid economic growth in the past was in part supported by key reforms in the financial sector, including the liberalization of domestic financial markets and the removal of quantitative controls on credit. Indeed, Uganda’s prudent macroeconomic management resulted in a consistent record of impressive performance, as evidenced by the average gross domestic product (GDP) growth rates of 7.4%, single digit inflation averaging at 6.5% and an improved external position with an average current account deficit as a percent of GDP of 4.3% in the period of 2001 to 2010 (
World Bank 2015). However, in the recent past, the country has witnessed more economic volatility, and GDP growth slowed to an average of just about 5% (
World Bank 2016).
The importance of a sound and well-functioning financial system in facilitating the mentioned outcomes in economic growth above cannot be understated. As such, the maintenance of price stability and a sound financial system remains at the core of Bank of Uganda’s mission (
Bank of Uganda 2016). In line with international best practice, the Bank of Uganda’s regulatory and supervisory framework encourages innovation and efficient competition in financial services based on prudent risk taking and the avoidance of reckless bank management. Until the late 1990s, Uganda’s financial sector was predominantly small and fragile due to a combination of misguided financial policies pursued by successive governments along with severe macroeconomic and political instability (
Henstridge and Kasekende 2001;
Whitworth and Williamson 2010). During this period, the financial sector recorded severe incidences of crisis and distress, including episodes of hyperinflation, which resulted in severe financial disintermediation. In an effort to address these weaknesses, the country undertook extensive reforms in the financial sector in the 1990s, including the liberalization of financial markets, restructuring distressed banks, and strengthening prudential regulation.
Since then, the financial sector in Uganda has experienced rapid change and growth as a result of these reforms, showing resilience and soundness with an infrastructure that is largely considered safe and efficient. The sector has grown considerably, and presently consists of a range of institutions, such as the formal commercial banks, development banks, credit institutions, microfinance deposit-taking institutions, insurance companies, capital markets, and pension funds. In the semi-formal sector, there is the Savings and Credit Cooperative Associations (SACCO), while informal institutions include village savings and loans associations. Commercial banks remain the most dominant financial institutions in Uganda, comprising over 80% of the financial system (
Mugume 2008). Several key indicators demonstrate the degree of improvement in the banking system. As of March 2016, there were 25 licensed commercial banks operating in the country, up from 15 banks in 2004 (
Bank of Uganda 2016). However, most of these commercial banks are foreign-owned. The Ugandan banking system has also attained some degree of outreach, investing heavily in physical infrastructure such as branches and ATMs. Although the banking system in Uganda is highly concentrated (
Mugume 2008), there has been a marked reduction in concentration over the last 10 years due to the growth of medium-sized banks that have taken market share from the traditionally dominant large international banks, strengthening competition in the banking industry.
Since 1993, Uganda has operated a flexible exchange rate system, which was introduced as a means of improving the country’s trade performance and promoting macroeconomic stability and sustainable economic growth (
Kasekende et al. 2004). The Uganda shilling’s exchange rate is determined by market forces, with the Bank of Uganda’s involvement in the foreign exchange market limited to regulatory interventions to dampen excessive volatility in the foreign exchange market Bank of Uganda, “Bank of Uganda Annual Report 1998/99” (
Bank of Uganda 1999); Bank of Uganda, “Bank of Uganda Annual Report 2010/11” (
Bank of Uganda 2011). As a small open economy, Uganda’s exchange rate is highly vulnerable to both external and domestic shocks. A flexible exchange rate performs a dual role in small open economies. Its movements can achieve and maintain international competiveness, and thus ensure a viable balance of payments, while at the same time, a stable exchange rate can anchor domestic prices. As such, the importance placed on exchange rate dynamics is unlikely to wane in the present environment of financial deregulation, globalization, and crises, especially as excessive volatility increases uncertainty, engenders financial instability, and adversely affects macroeconomic performance (see
Crockett 1996).
Although the financial system and economy remained strong at the advent of the global financial crisis (GFC), which was due in part to the country’s limited exposure to the subprime crisis, Uganda has experienced an increase in exchange rate fluctuations and strong depreciation pressures, which fed through to other asset prices in the domestic financial market Bank of Uganda, “Bank of Uganda Annual Report 2008/09” (
Bank of Uganda 2009); Bank of Uganda, “Bank of Uganda Annual Report 2010/11”. Since the onset of the global financial crisis, Uganda has experienced exacerbated and persistent excessive exchange rate volatility, despite central bank intervention Emmanuel Tumusiime-Mutebile, “Bank of Uganda’s Position on the Exchange Rate” (Kampala: BIS Central Bankers’ Speeches, Bank for International Settlements (
Tumusiime-Mutebile 2011)); Emmanuel Tumusiime-Mutebile, “Macroeconomic Management in Turbulent Times” (Kyankwanzi, Kampala: BIS Central Bankers’ Speeches, Bank for International Settlements (
Tumusiime-Mutebile 2012)). In the post-crisis period, pressures in the financial market in the form of rapid exchange rate depreciation and rising inflation threatened to undermine gains from earlier periods. The Uganda shilling has come under strong depreciation pressures as a result of a harsh global environment, a weak balance of payments, and speculative attacks on the currency, which in turn has exacerbated inflationary pressures, prompting the Bank of Uganda to tighten monetary policy and push up interest rates Bank of Uganda, “Bank of Uganda Annual Report 2010/11”. Given the considerable influence that global developments have on Uganda’s macroeconomic performance, an understanding of exchange rate dynamics is crucial for maintaining financial stability and robust economic growth.
Like many lower-income developing nations, Uganda specializes in exporting low value-added primary commodities, and imports capital and intermediate inputs. The prices of primary commodities can be quite volatile on world markets. When prices fall, the country grapples with sharp reductions in export revenues, producing an adverse movement in their terms of trade, and risking a higher trade deficit. Thus, the resultant movement in the nominal exchange rate is the product of an economy’s natural and desirable response to changes in domestic and international macroeconomic conditions. The evolution of commodity prices has significantly affected the shilling exchange rate. The Ugandan shilling has since then weathered intense appreciation and depreciation, reflecting commodity booms or bursts. For instance, in the course of the 1990s, Ugandan farmers were confronted with pronounced changes in coffee prices. World prices went up dramatically in the first half of the 1990s, more than doubling between 1992/93 and 1994/95. The surge in world prices coincided with a radical liberalization of the coffee market, which included, for instance, the complete withdrawal of the state from marketing, an abolishment of minimum prices, and a removal of the export tax. To ease exchange rate pressures and preserve macroeconomic stability during the boom phase, the Ugandan government introduced a coffee stabilization tax, which came into force in late 1994 (
Henstridge and Kasekende 2001). This surge in coffee prices started to unwind in 1996/97, and by 2001/02 coffee prices had reached a trough, falling below the levels of the early 1990s. Uganda’s economic performance in the years to come will largely depend on its ability to adapt to adverse external conditions.
3. Literature Review
The consensus in the literature is that financial market volatility has increased over time (
Becketti and Sellon 1989;
Reszat 2002). Excessive volatility is of concern to policymakers, as it may adversely impact financial market stability and economic performance (
Becketti and Sellon 1989). As a result, considerable effort has gone into the study of volatility dynamics within markets, as well as volatility spillovers in different markets over time. The interest in volatility spillover effects arises from the globalization of the world economy and the increased incidence of crises that span regions and continents. Despite the considerable amount of research conducted in the field of volatility and its spillover, the results are mixed. Volatility spillover effects reflect a variable’s second moment relationship, whereby the volatility in one market is influenced by (among other things) the volatility coming from other markets. Seminal contributions in the study of volatility spillover effects include (
Engle et al. 1990), who contributed to the theory of volatility spillovers underpinned by the “heat waves” and “meteor showers” hypotheses.
Since then, volatility spillover effects have been identified in different types of financial markets and different regions such as the foreign exchange, stock, and commodity markets. For instance,
Lin and Tamvakis (
2001) and
Milunovich and Thorp (
2006) suggested that volatility spillover appear widely in energy markets and financial markets, respectively. Also,
Diebold and Yilmaz (
2009) showed that spillovers are important, and the behavior of return and volatility spillovers may differ. In addition, their study found evidence that spillover intensity is indeed time varying, and the nature of the time variation is also strikingly different for returns and volatilities. Therefore, it is necessary, from time to time, to reinvestigate spillover effects in different markets.
Using high-frequency data of the most actively traded currencies,
Baruník et al. (
2017) provided evidence for asymmetric volatility connectedness on the foreign exchange (forex) market. They also showed that negative spillovers are chiefly tied to the dragging sovereign debt crisis in Europe, while positive spillovers are correlated with the subprime crisis, different monetary policies among key world central banks, and developments in commodities markets. They concluded that a combination of monetary and real-economy events is behind the positive asymmetries in volatility spillovers, while fiscal factors are linked with negative spillovers. Similarly,
Ghosh (
2014) found evidence of significant volatility co-movements and/or spillover effects from different financial markets affecting the foreign exchange market in India. Importantly, among the large number of variables examined, volatility spillovers from international crude oil markets to the foreign exchange market were found to be significant. The study also found asymmetric reactions in foreign exchange market volatility, even though there is evidence that the asymmetric response in the foreign exchange volatility during the post-crisis period in India has declined.
Using daily data,
Wei and Chen (
2014) examined whether the volatility of the West Texas Intermediate oil spot returns (WTIR) is affected by the Texas Light Sweet oil futures returns (FUR), the exchange rate returns between the US dollar and the Euro (ERR), and the S&P 500 energy index returns (EIR), and if any of those have changed over time. The study finds that WTIR is significantly affected by its own past volatility, and by the volatility of the FUR, ERR, and EIR. Likewise,
Mo et al. (
2018) examined the dynamic linkages among the gold market, US dollar, and crude oil market, and found evidence of long-term dependence among these markets. Specifically, the dynamic gold–oil relationship is always positive, and the oil–dollar relationship is always negative, while after the crisis, they observed evidence of a positive non-linear causal relationship from gold to US dollar and US dollar to crude oil, and a negative non-linear causal relationship from US dollar to gold.
In contrast,
Samanta and Zadeh (
2012) found evidence indicating co-movements—although the spillover indices were found to be very small—in a study of the co-movements of several macro variables, including the real dollar exchange rate and the oil price of crude oil in the world economy over a period of more than 20 years. This finding was similar to that of
Zhang et al. (
2008), who explored mean spillover, volatility spillover, and risk spillover between the U.S dollar exchange rate and crude oil prices and found that despite the apparent volatility and clustering of the U.S dollar exchange rate and crude oil prices, their volatility spillover effect was insignificant, which revealed that their individual price volatilities took relatively independent paths, and thus fluctuations in the US dollar exchange rate would not cause significant changes in the oil market. The study also found a significant long-term equilibrium cointegrating relationship between the two markets. They concluded that while the US dollar exchange rate has a significant effect in the long term on the international crude oil market, its short-term and instant influence is quite limited. Indeed,
Rickne (
2009) found that the co-movements between oil price and real exchange rates in a sample of 33 oil-exporting countries were conditional on political and legal institutions. Specifically, currencies in countries with strong bureaucracies are less affected by oil price variation.
Nevertheless, the research on the volatility spillover effects has most often been focused on advanced and emerging market economies, and less often on developing counties. In addition, few empirical studies have investigated the spillover effects of global commodity price volatility on developing countries’ exchange rates, and to the best of our knowledge, no study exists in the context of Uganda. It is against this backdrop that we revisit the debate on volatility spillover effects in developing country foreign exchange markets with a focus on Uganda in particular. Thus, we use the results of other country and regional studies for comparison (where possible).
4. Methodology
This study investigates the volatility spillovers among commodity prices, namely food and oil, and the foreign exchange rate using multivariate generalized autoregressive conditional heteroskedasticity (MGARCH) models and Generalized Vector Autoregressive framework proposed by
Diebold and Yilmaz (
2012). It is widely accepted that financial volatilities are correlated across assets and markets (
Jondeau et al. 2007). Among the various models developed to capture this is the multivariate generalized autoregressive conditional heteroskedasticity (MGARCH) model, which was built to model volatility relationships between two time-series data, and offers relevant information on risk measures and spillovers. The power of MGARCH models lies in determining an asset’s volatility transmission to another asset directly through its conditional variances, and indirectly through its conditional covariance. MGARCH models strongly depend on the definition of the matrix of conditional correlations such that under the assumption of correlations independent of time, the constant conditional correlations (CCC) model (
Bollerslev 1990) allows a straightforward computation of the correlation matrix. However, if correlations vary over time, the models such as the dynamic conditional correlations (DCC) (
Engle 2002) and the time-varying conditional correlations (TCC) (
Tse and Tsui 2002) are more appropriate to compute the returns variations.
This study investigates the volatility spillovers effects of commodity price volatility, namely food and oil price volatility, on the foreign exchange market using MGARCH models. In particular, three MGARCH models are applied, including the CCC model proposed by
Bollerslev (
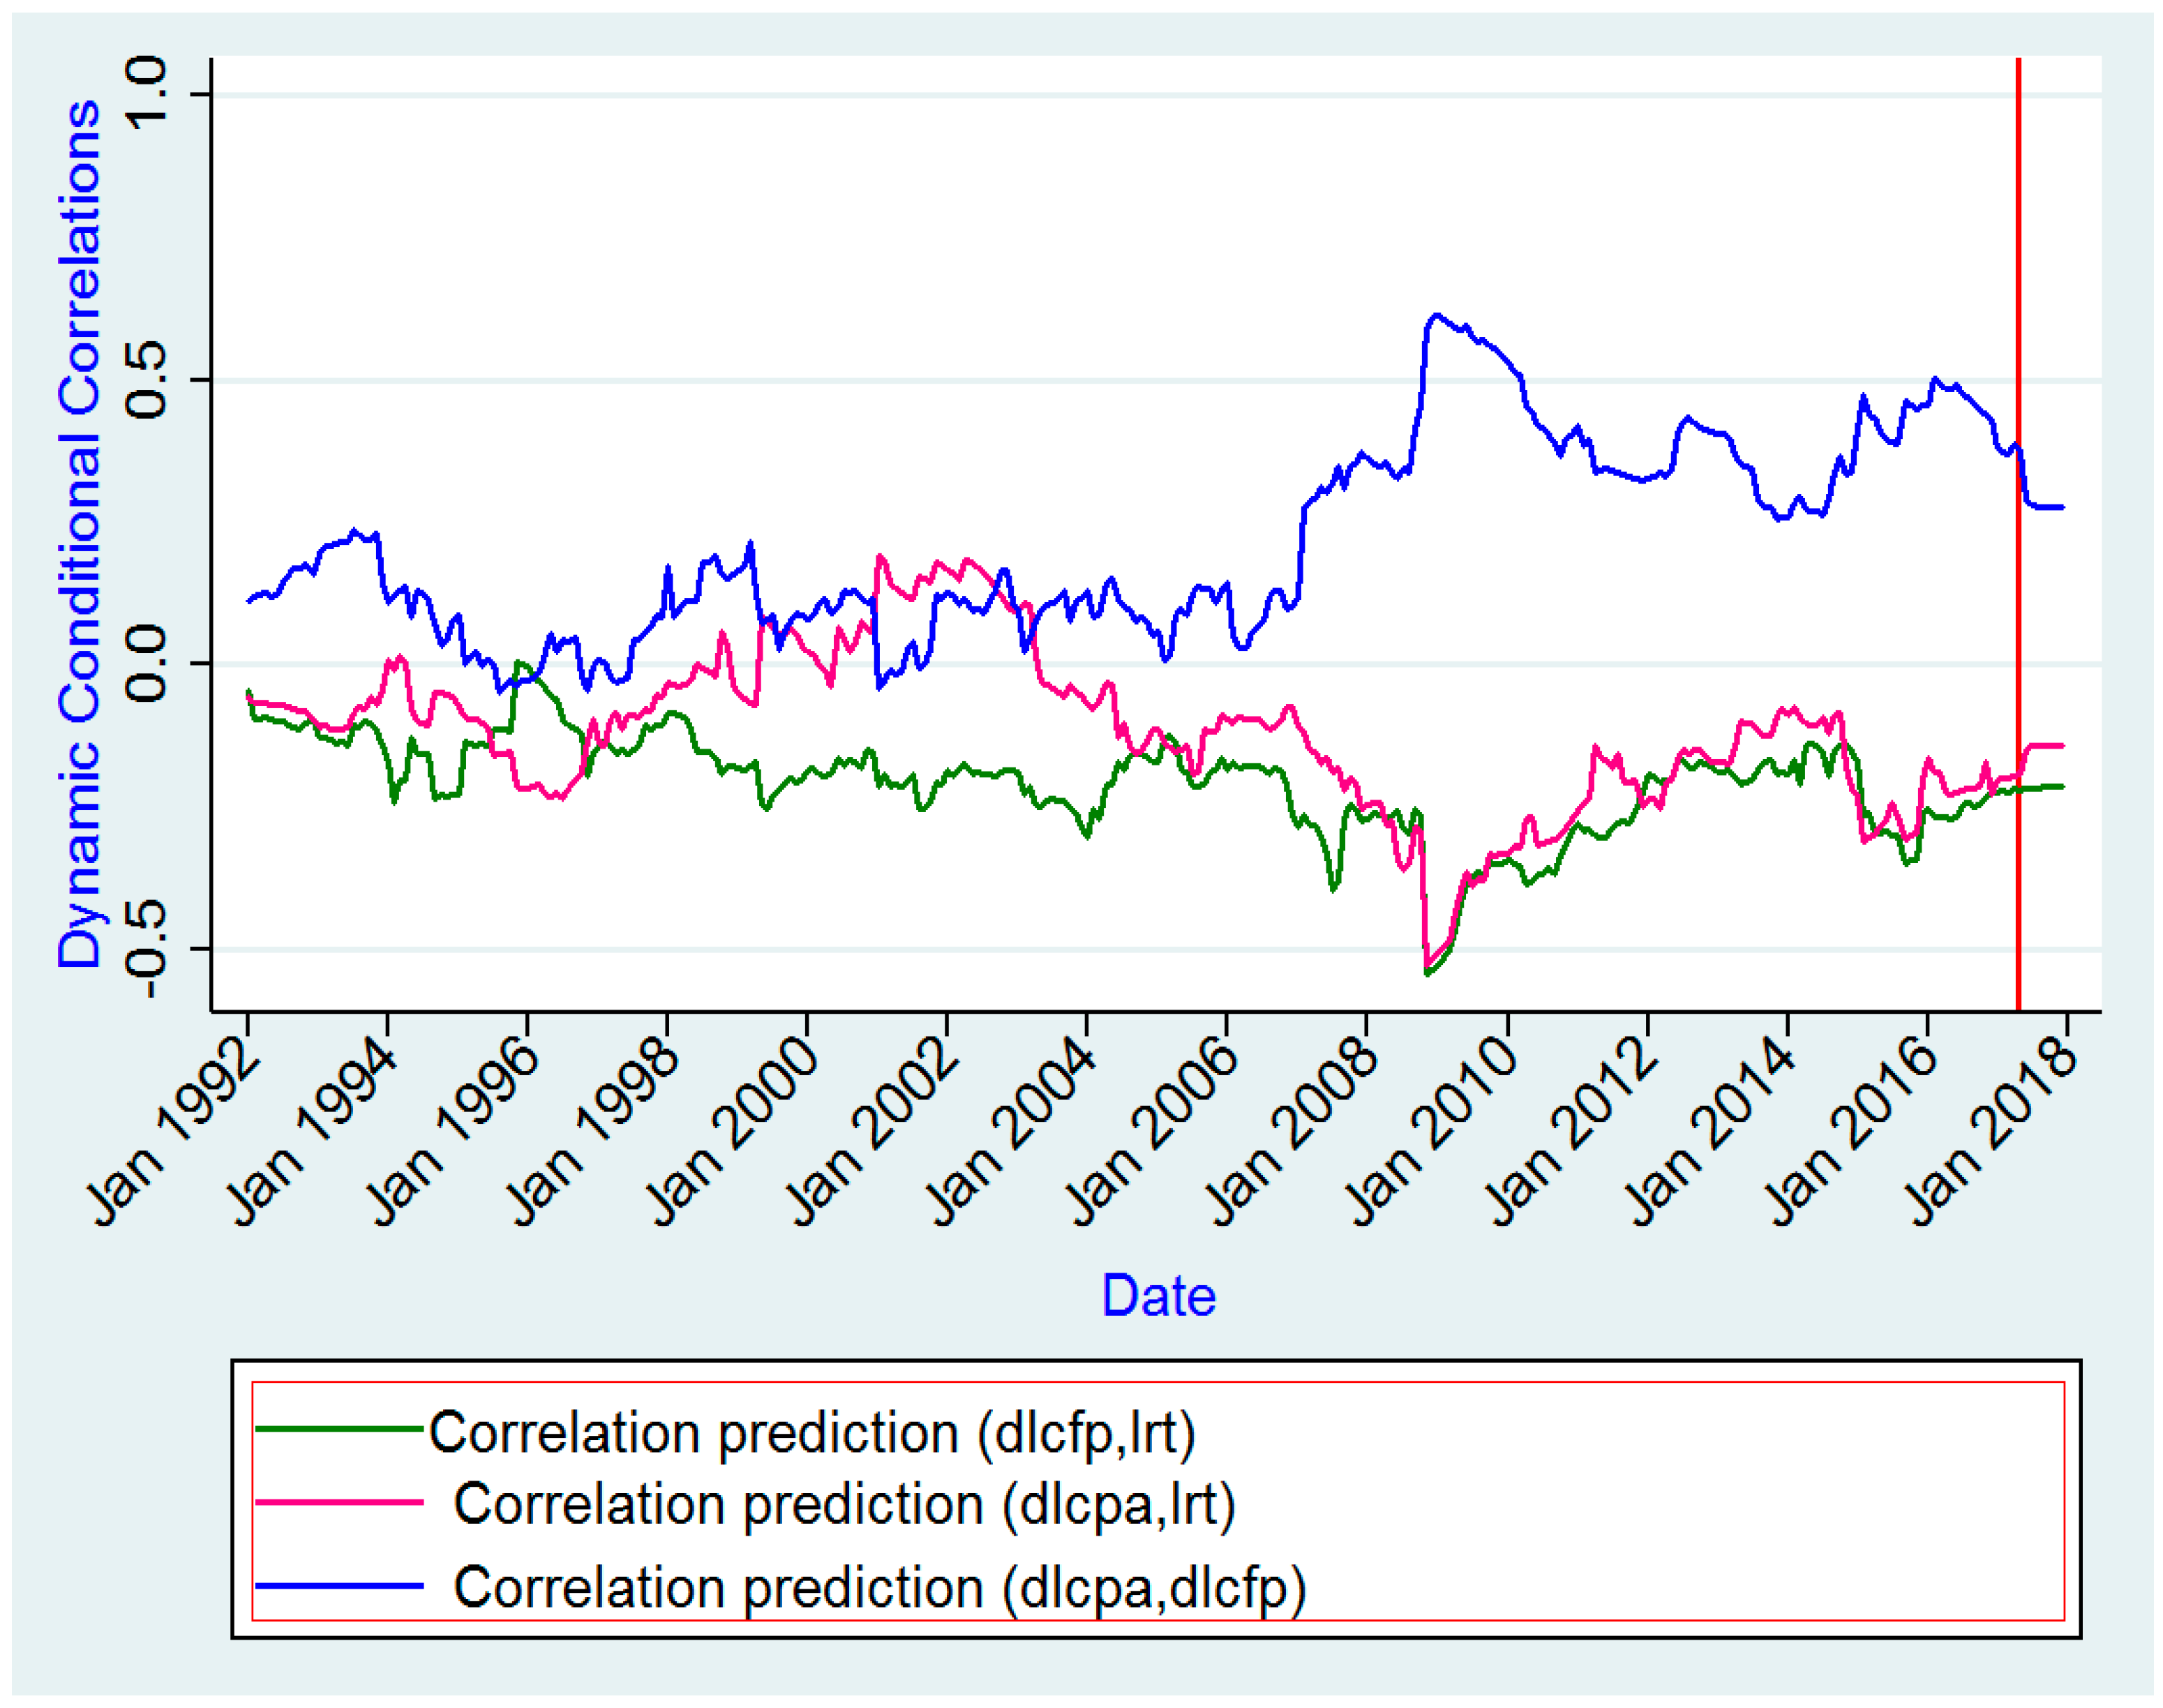
1990), which assumes that the conditional correlation is constant. However, the constant conditional correlation hypothesis of the CCC model is too restrictive, and thus may not always hold, especially in a high-frequency financial time series. As such, the study also applies the DCC model by
Engle (
2002), and the TCC model by
Tse and Tsui (
2002). The general MGARCH model is given by:
,
, where
is an
vector of dependent variables;
C is an
matrix of parameters;
is a
vector of independent variables, which may contain lags of
;
is the Cholesky factor of the time-varying conditional covariance matrix
; and
is an
vector of zero mean, unit variance, and independent and identically distributed innovations. In the general MGARCH model,
is a matrix generalization of univariate GARCH models. The CCC model is defined as:
, and the correlation matrix
is positive definite with
The off-diagonal elements of the conditional covariance matrix
are given by:
. The process
is modeled as a univariate GARCH. Hence, the conditional variances can be written in a vector form:
, where
c is a
vector,
and
are diagonal
matrices, and
is the element-wise product.
is ensured as positive definite when the elements of c and
and
are positive, since R is positive definite. The estimation of CCC models is attractive, because the correlation matrix is constant. When the correlation matric
is time varying,
is positive definite if
is positive definite at each point in time and the conditional variances
are well defined. Both the DCC and the TCC models extend the CCC model with a few extra parameters. Unlike the CCC model, time-varying model variations require that the correlation matrix be inverted for each time t in every iteration.
Several specifications of
have been suggested in the literature. In the TCC model, GARCH-type dynamics are imposed on the conditional correlations, so that they are a function of past conditional correlations and a set of estimated correlations. More specifically,
, where
S is a constant, positive definite parameter matrix with ones on the diagonal,
and
are non-negative scalar parameters such that
, and
is a sample correlations matrix of past
M standardized residuals
, where
. The positive definiteness of
is ensured by construction if
and
are positive definite. A necessary condition for this to hold is
. In the DCC model, the conditional correlation structure is similar to that of the TCC model in that it considers a dynamic matrix process
, where a is positive and b a non-negative scalar parameter such that
,
S is the unconditional correlation matrix of the standardized errors
, and
is positive definite. This process ensures positive definiteness, but does not generally produce valid correlation matrices. They are obtained by rescaling
as follows:
. In the TCC and DCC models, the dynamic structure of the time-varying correlations is a function of past returns. The bivariate dynamic conditional correlation coefficient of
Engle (
2002) is, thus, defined as:
In the bivariate case, the conditional correlation coefficient of
Tse and Tsui (
2002) is defined as:
.
The study also applies the approach proposed by
Diebold and Yilmaz (
2012) to measure total and directional volatility spillovers. In contrast with
Diebold and Yilmaz (
2009), which relies on Cholesky factorization, the approach by
Diebold and Yilmaz (
2012) yields results that are unique and invariant to the ordering of variables. The procedure is based on the generalized VAR framework of
Koop et al. (
1996) and
Pesaran and Shin (
1998), and calculates the forecast error variance decomposition without the orthogonalization of shocks. Nevertheless, the Generalized forecast error Variance Decomposition GVD requires normality of the shock distribution, and as such, we take logarithms to make the data more normal-like. In general, for variance decompositions, own variance shares are defined to be the fractions of the
-step-ahead error variances in forecasting
due to shocks to
, for
, and spillovers to be the fractions of the
-step-ahead error in forecasting
due to shocks to
, for
, such that
. The H-step-ahead generalized variance decomposition matrix
,
is defined to have entries:
where
is a selection vector with
-th element unity and zeros elsewhere,
is the
-th moving average coefficient matrix,
is the covariance matrix off the error terms, and
is the
-th diagonal element of
. The denominator is the forecast error variance of variable
, and the numerator is the contribution of shocks in variable
to the
-step-ahead forcast error variance of variable
. Given that the shocks do not need to be orthogonal, forecast error variation contributions do not necessarily sum up to 100, i.e., row sums of
are not necessarily equal to 100. Hence, in order to be able to interpret the entries of a variance decomposition matrix as shares, they have to be scaled. Hence, we use
with
instead of
. The entries of
can be used to analyze the connectedness between assets
and
. More precisely, as described in
Diebold and Yılmaz (
2014), the matrix
leads to a spillover table, which displays pairwise as well as system-wide spillovers. For a system with N variables
, its upper-left
-block matrix contains the scaled generalized variance decomposition matrix of the
-step-ahead forecast error, i.e.
. Its rightmost column contains row sums “From Others”, and the next to last bottom row contains column sums “To Others”, and the lower-right element contains the average of the column sums, where, in all of the cases,
, i.e., the diagonal elements are excluded. The off-diagonal entries of
measure pairwise directional spillovers from
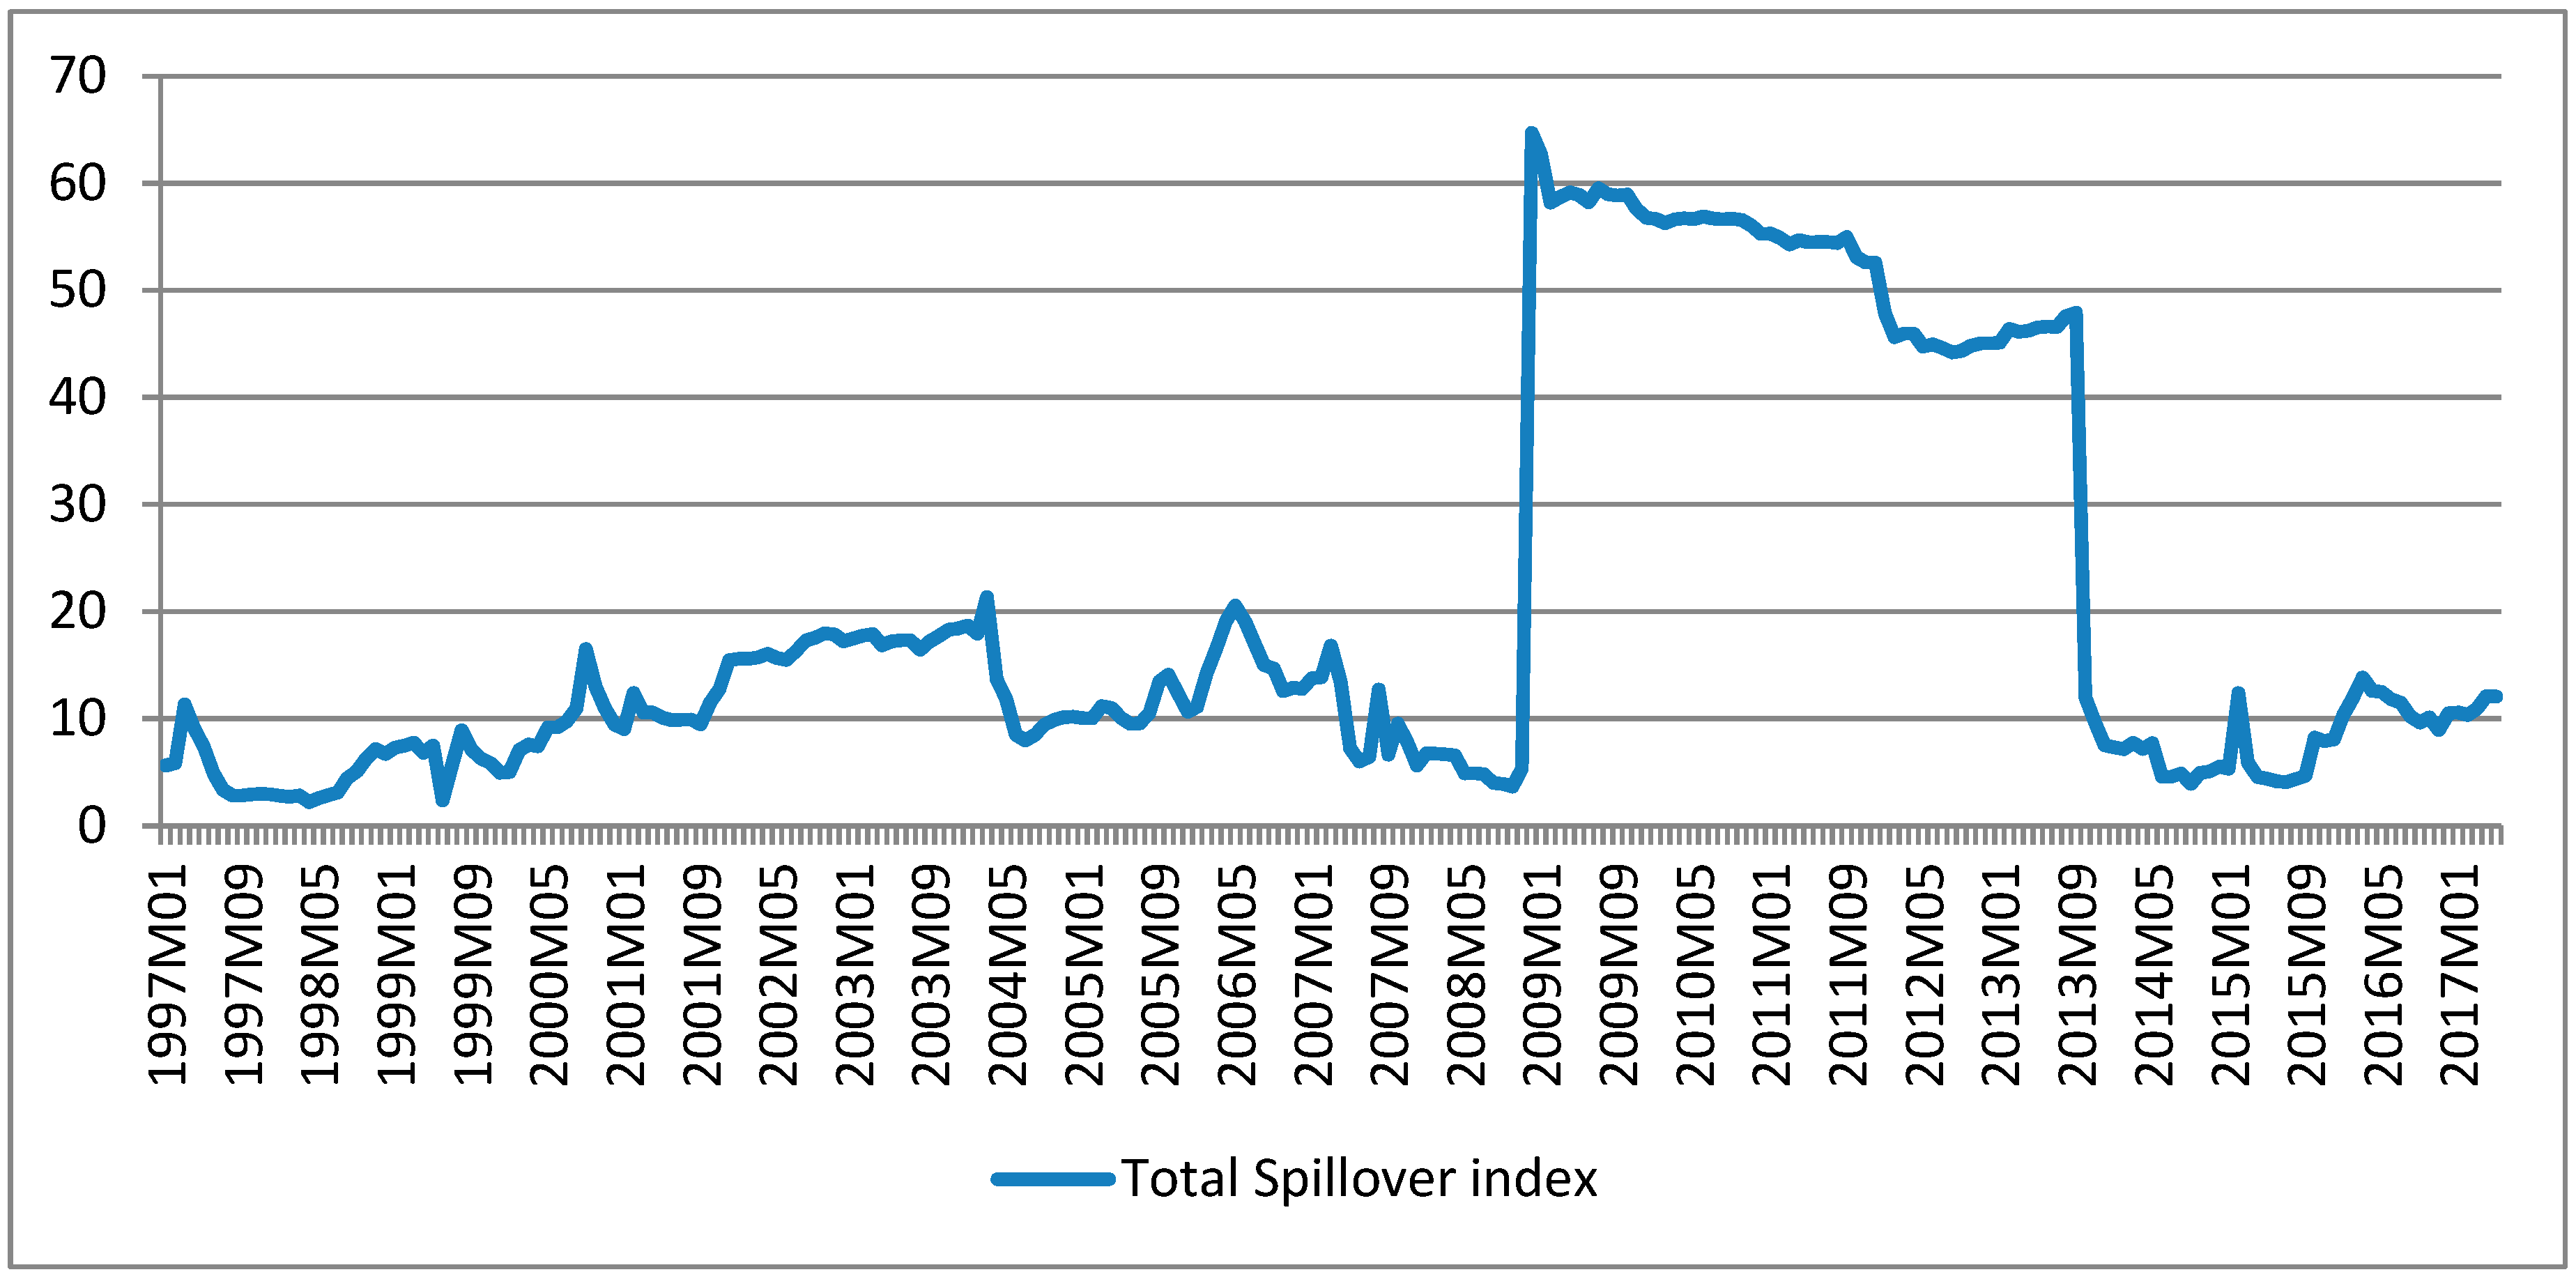
to
. Moreover, total spillover variation over time is also assessed using a rolling window methodology that captures the evolution of the total spillover index, which is a measure of the contribution of spillovers of shocks across all variables to the total forecast error variance over time.


