Does Foreign Direct Investment Improve Inclusive Green Growth? Empirical Evidence from China
Abstract
1. Introduction
2. Literature Review
3. Method and Variable Declaration
3.1. Construction of Inclusive Green Total Factor Productivity Index
3.2. The PVAR Model of FDI Impact on Inclusive Green Total Factor Productivity
3.3. Generalized Impulse Response Function (GIRFs) and Generalized Variance Decomposition Function
3.4. Variable Declaration
4. The Comparative Analysis of Four Total Factor Productivities in China
5. The Empirical Analysis of the Impact of FDI on Inclusive Green Total Factor Productivity in China
5.1. Panel Data Unit Root Test and Cointegration Test
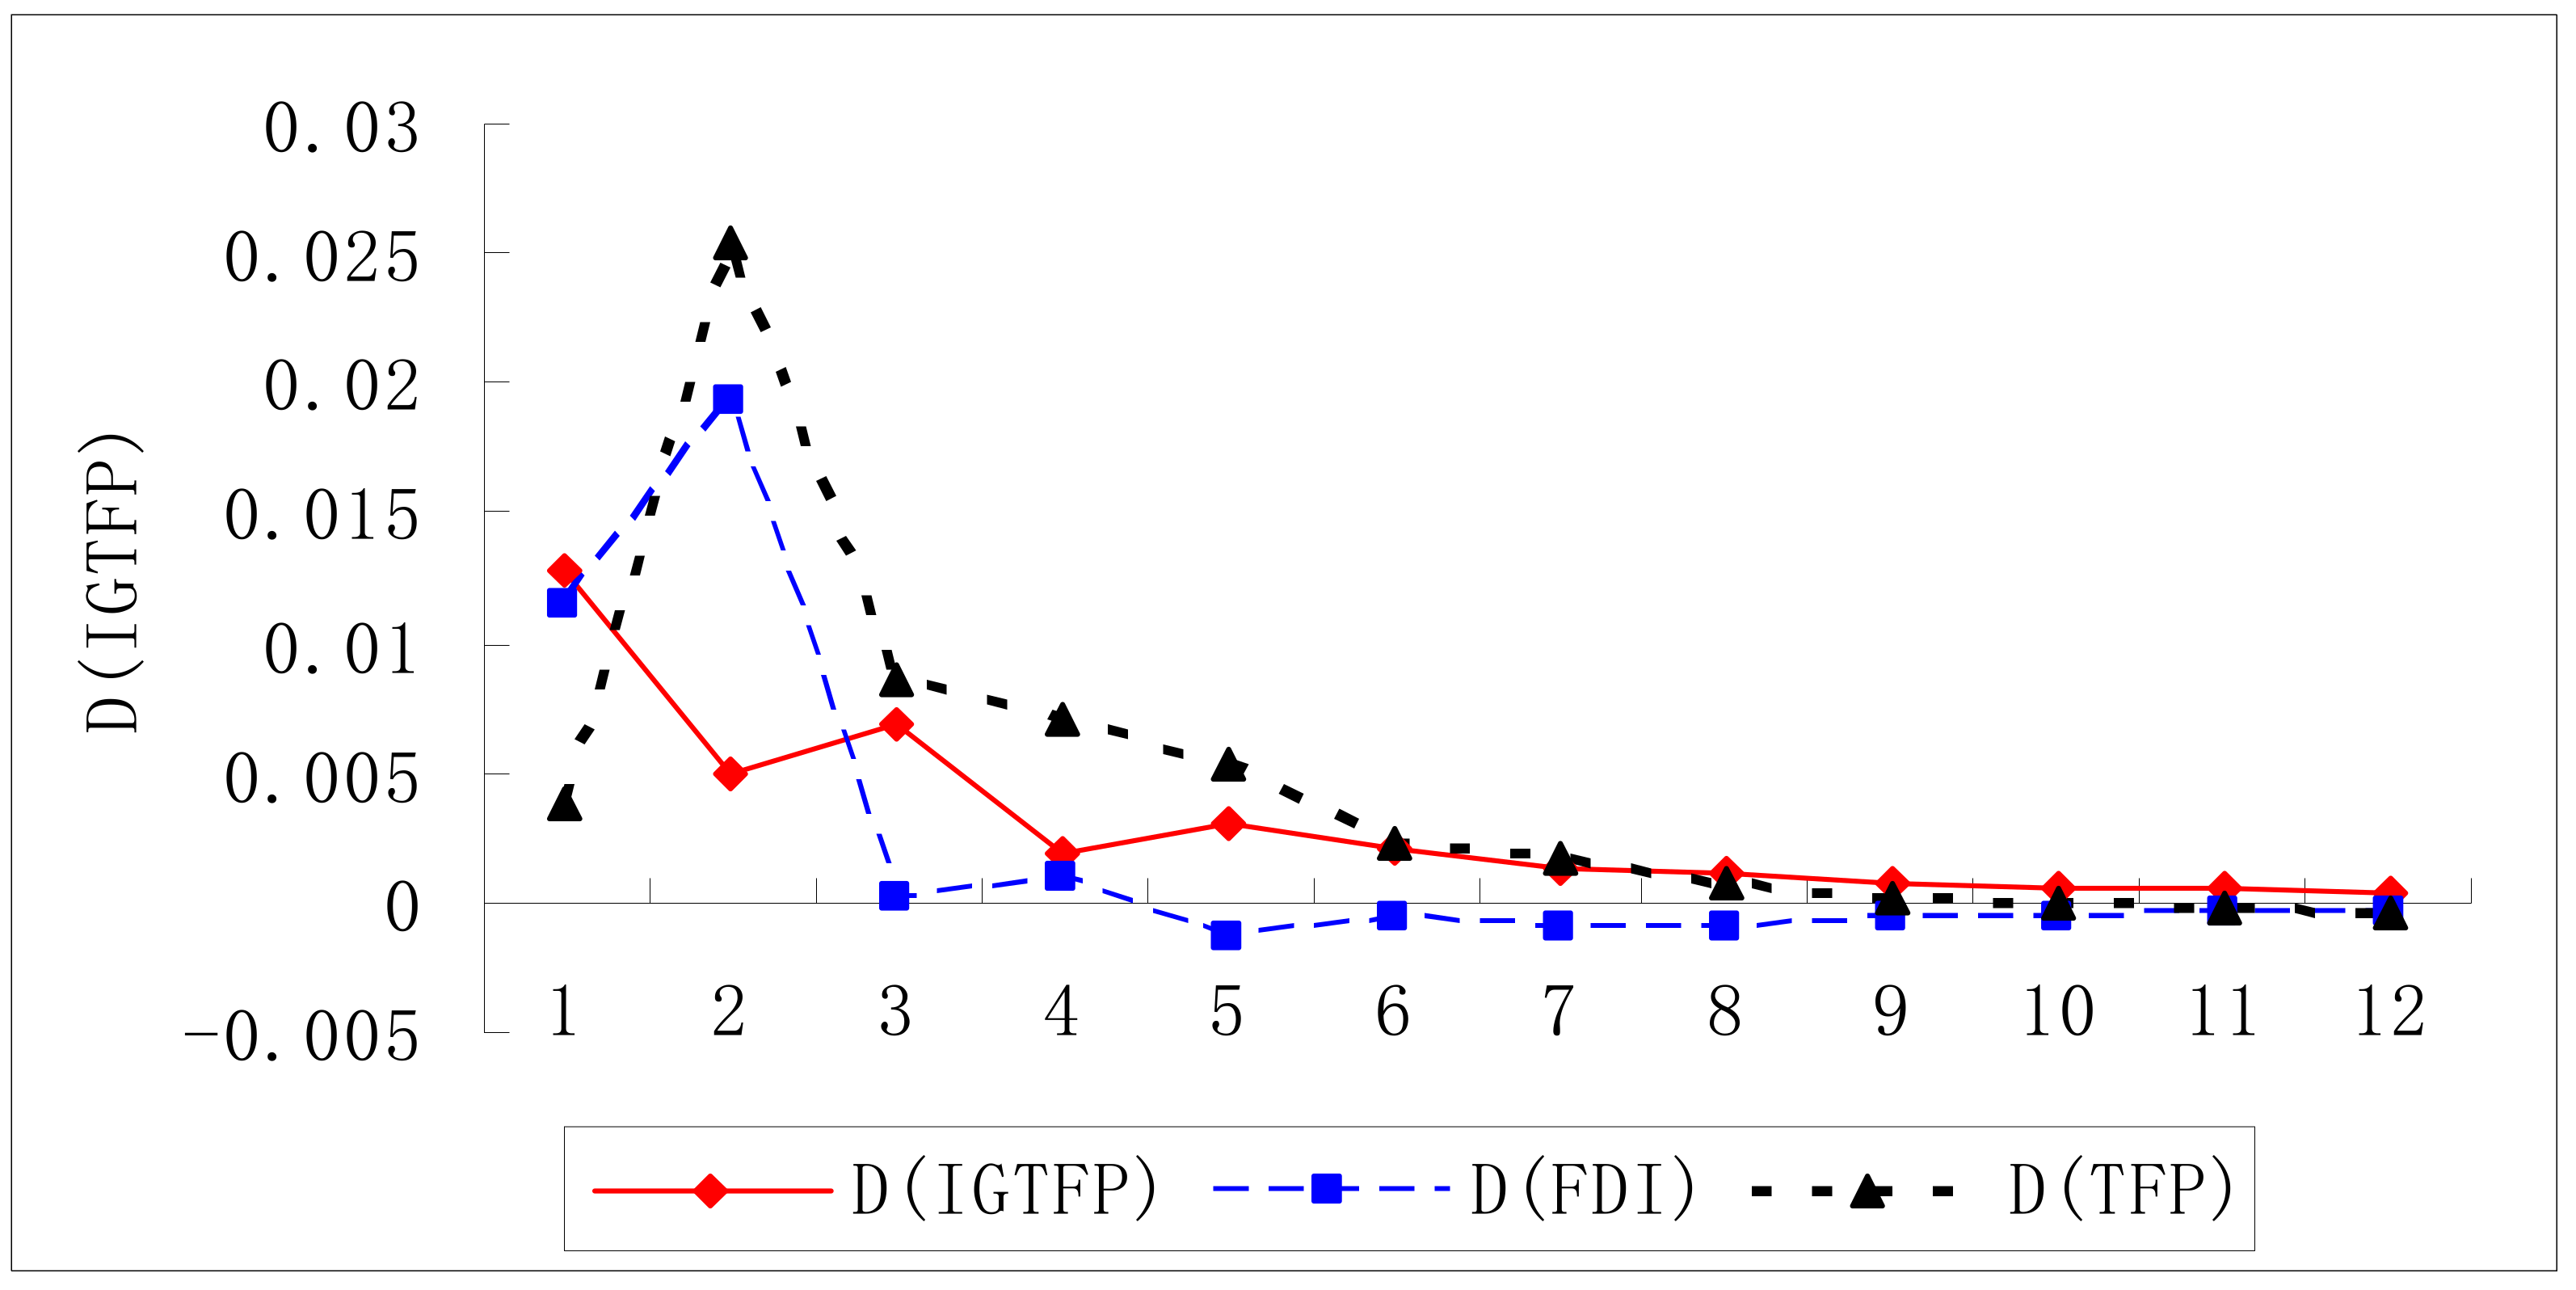
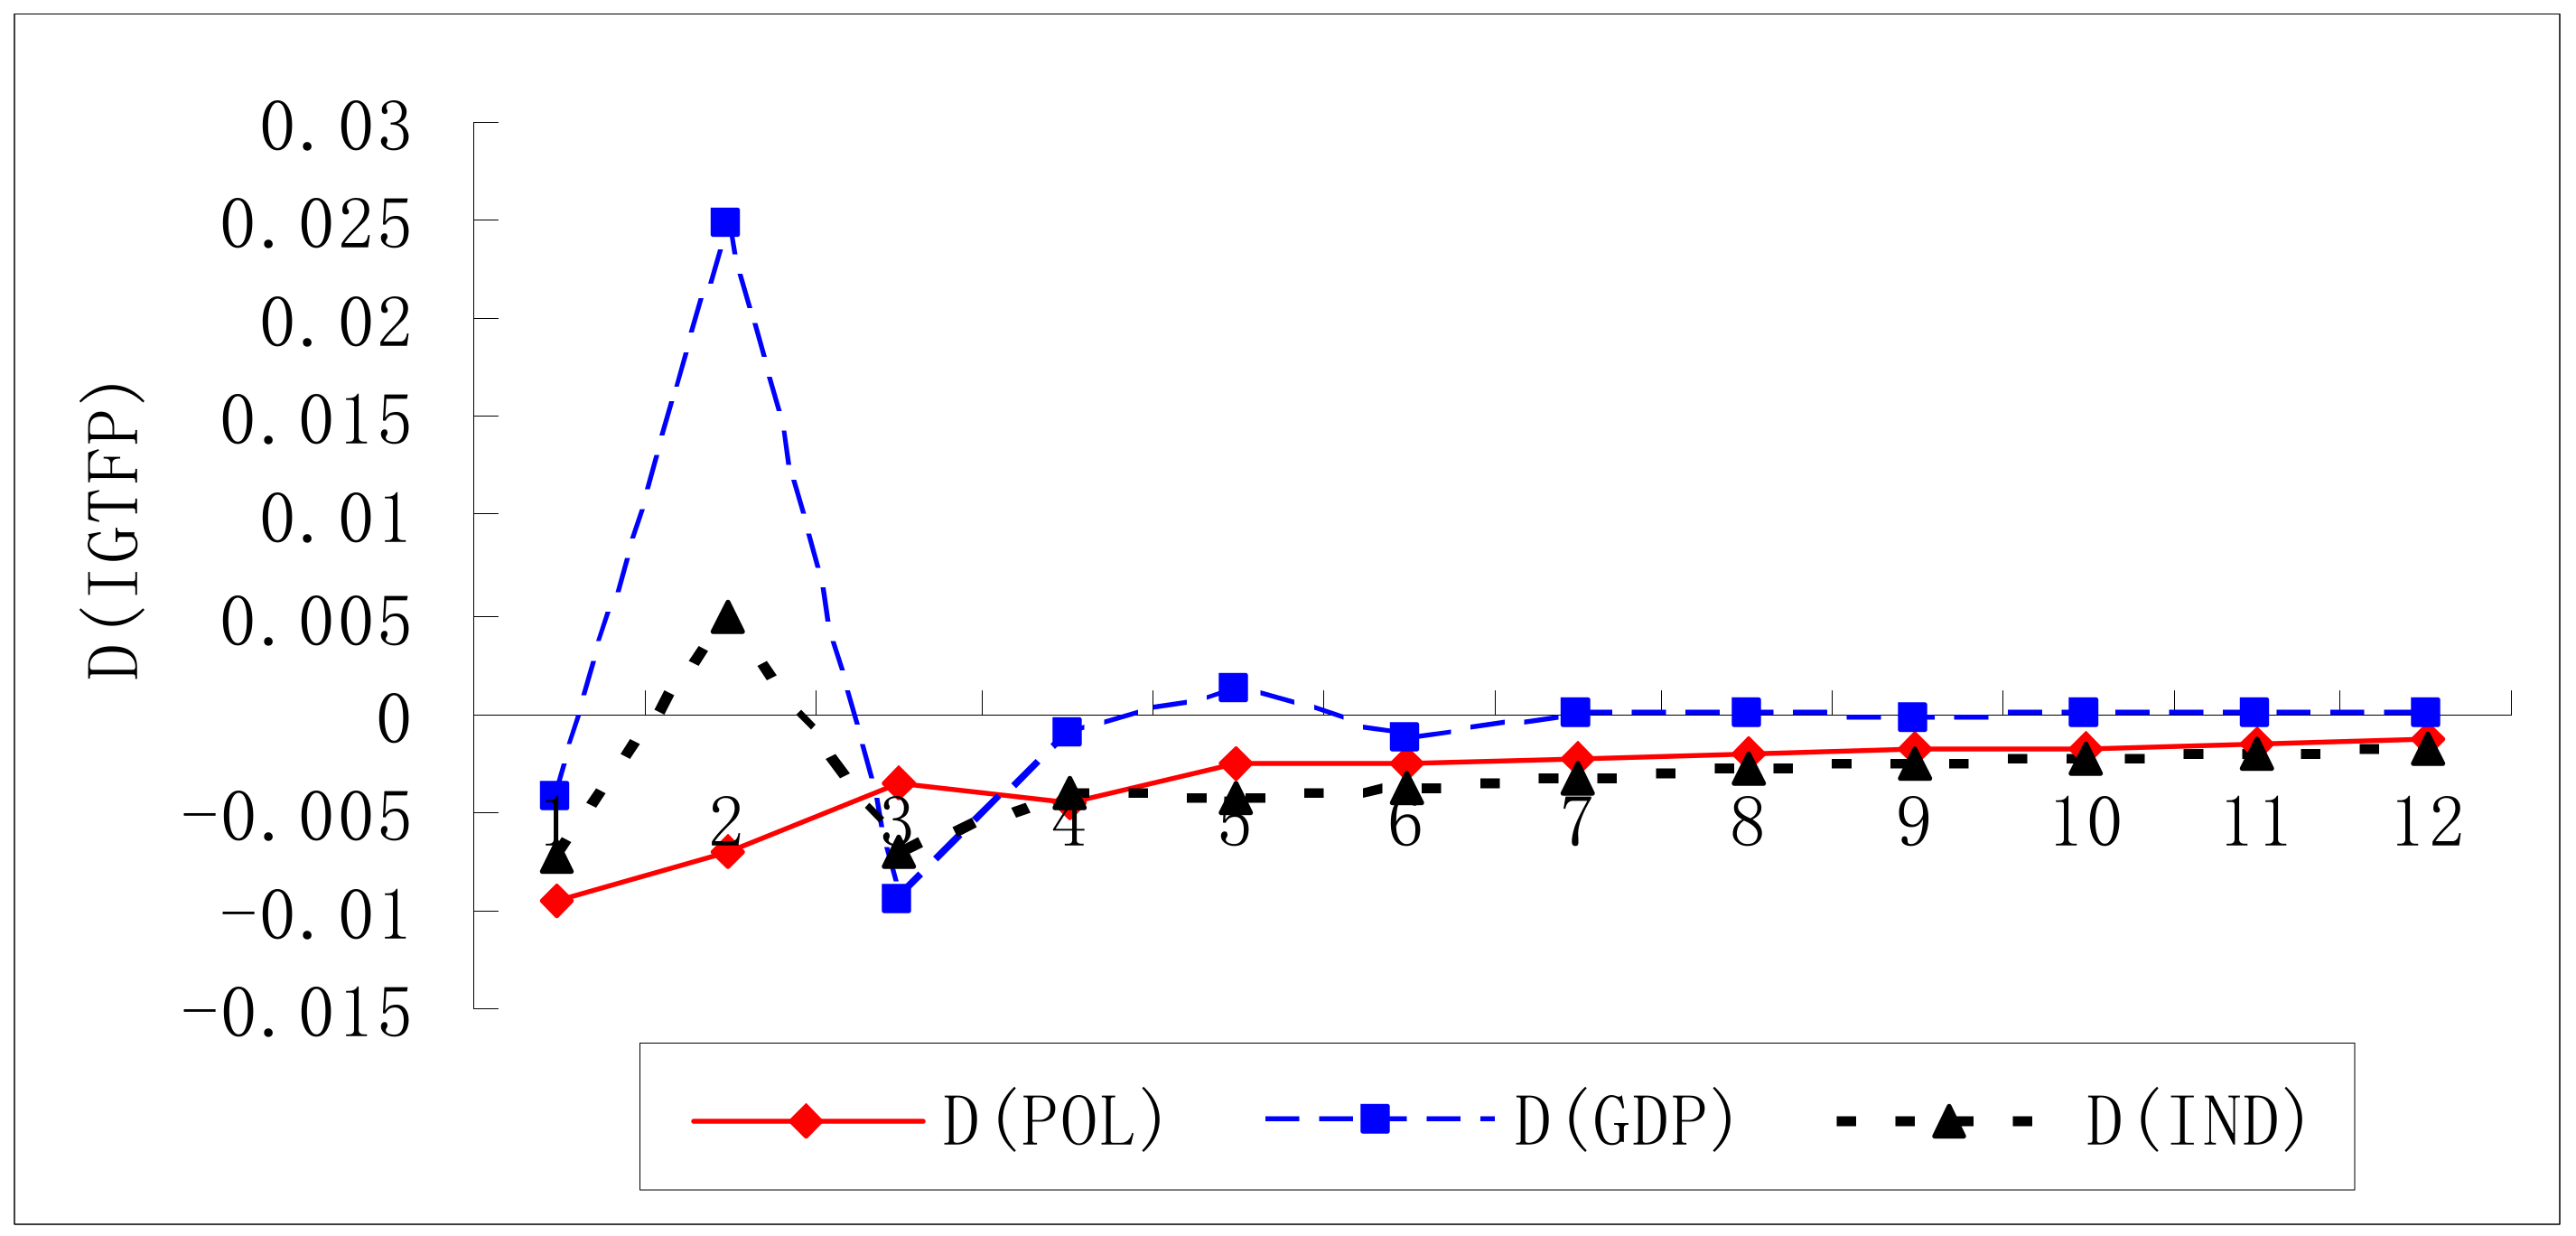
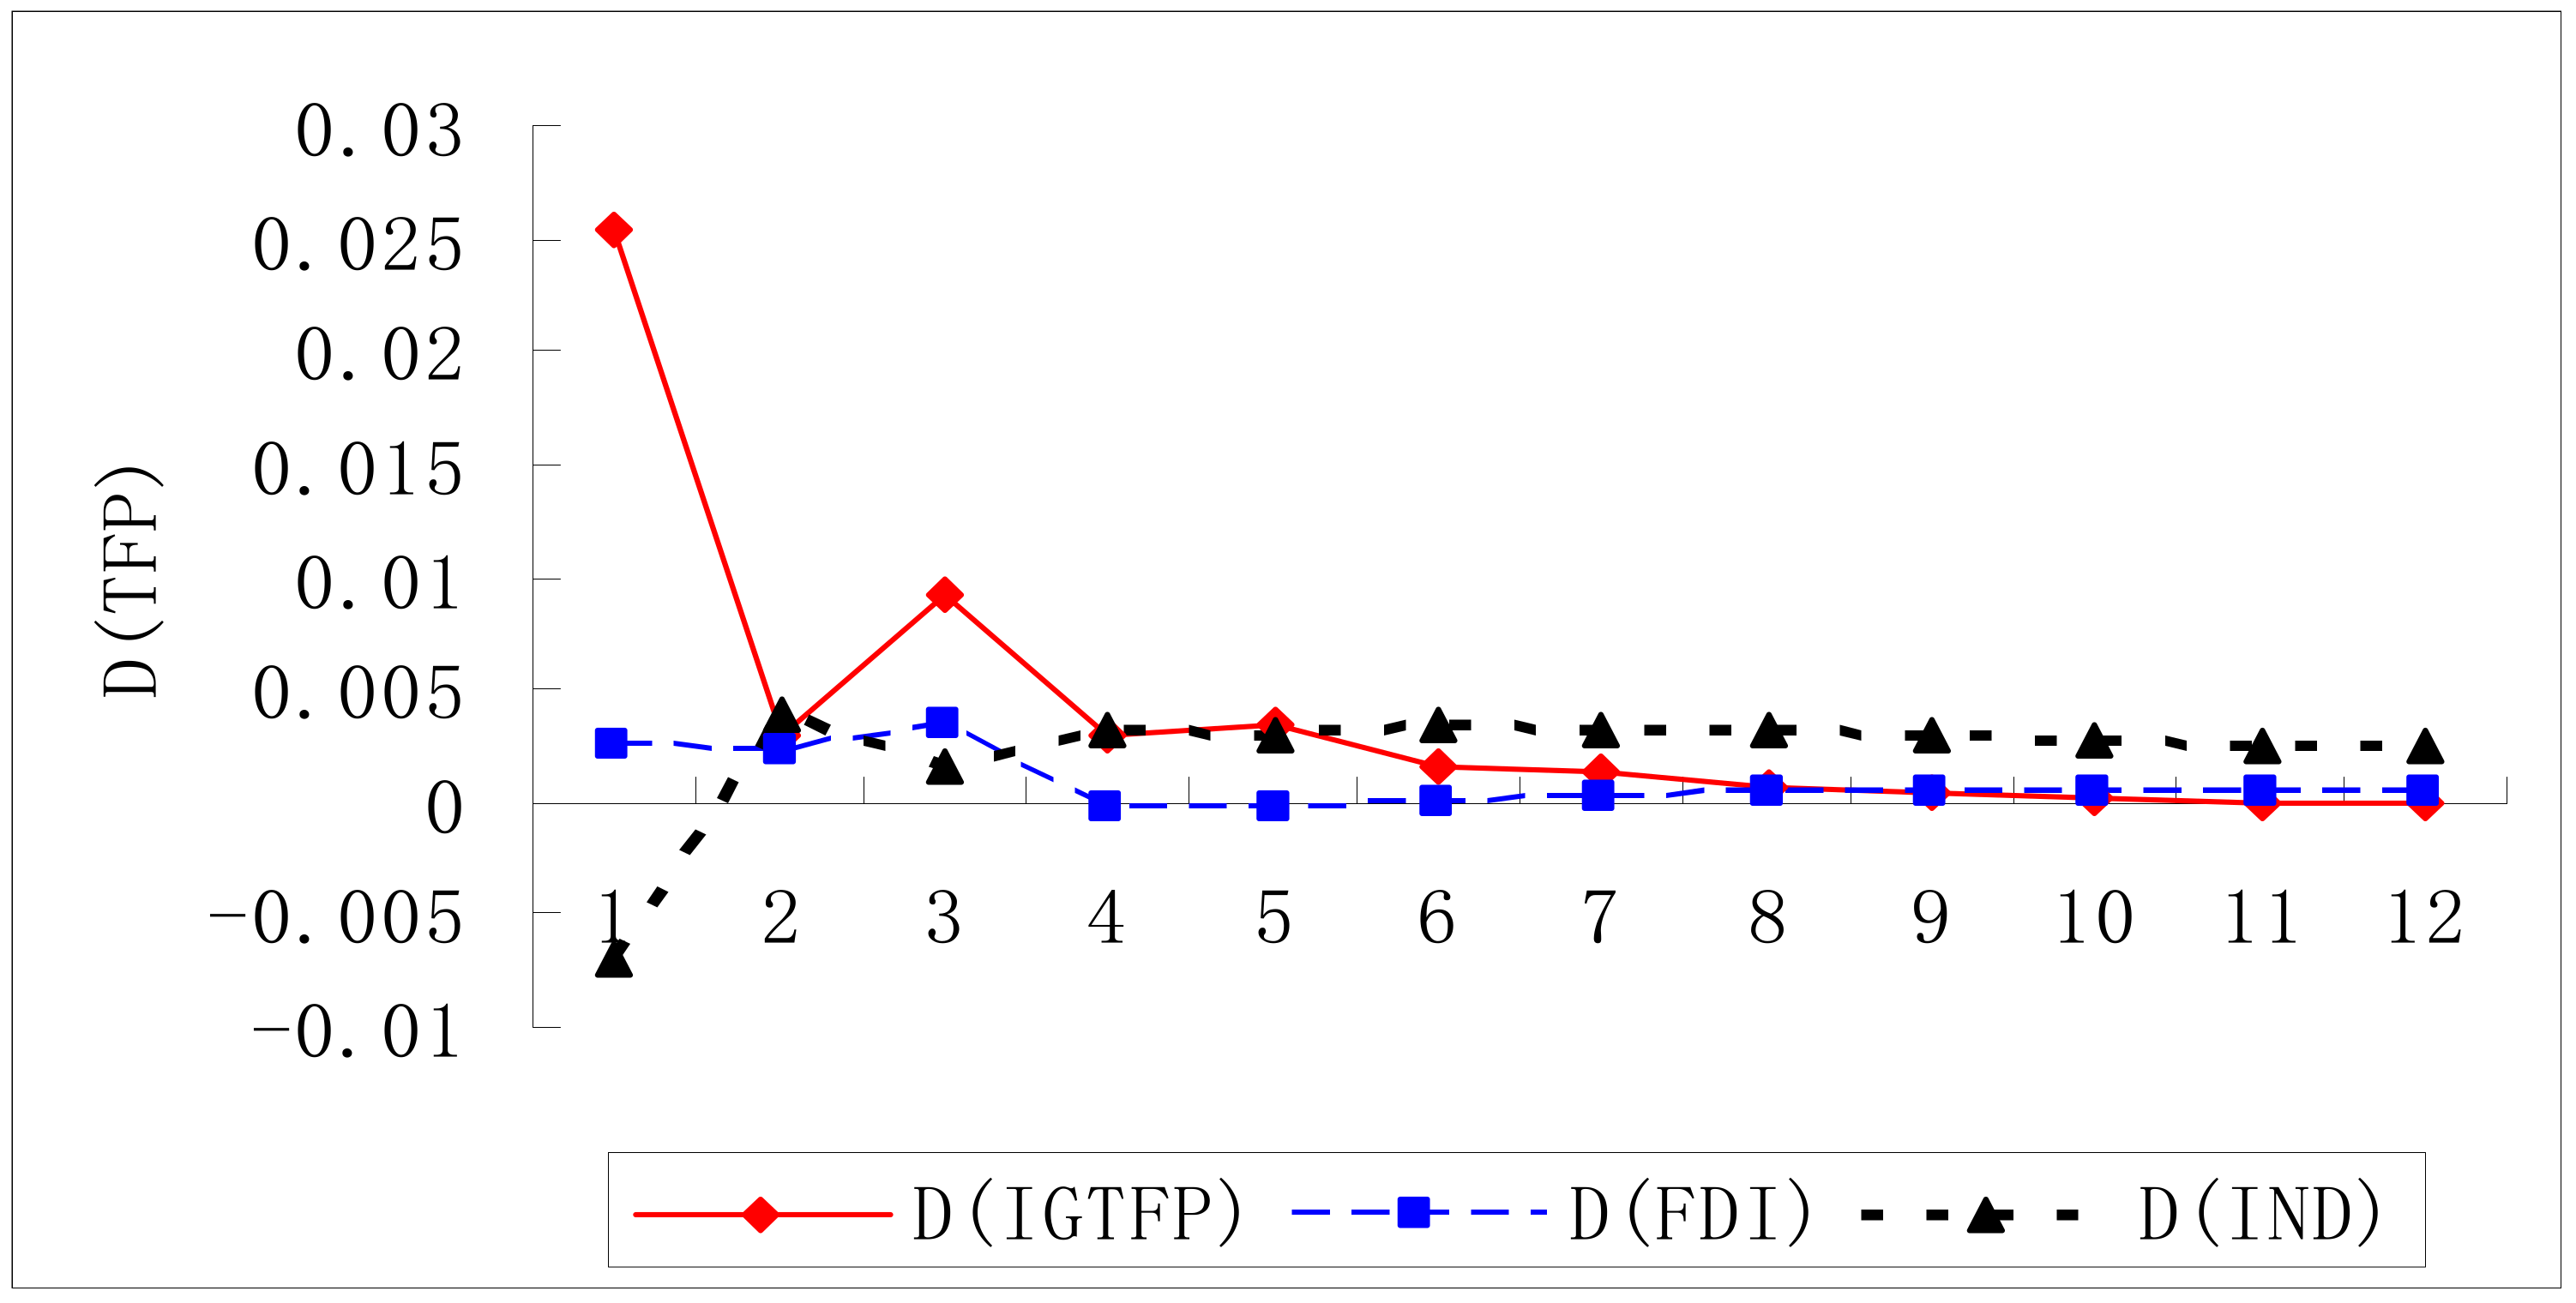
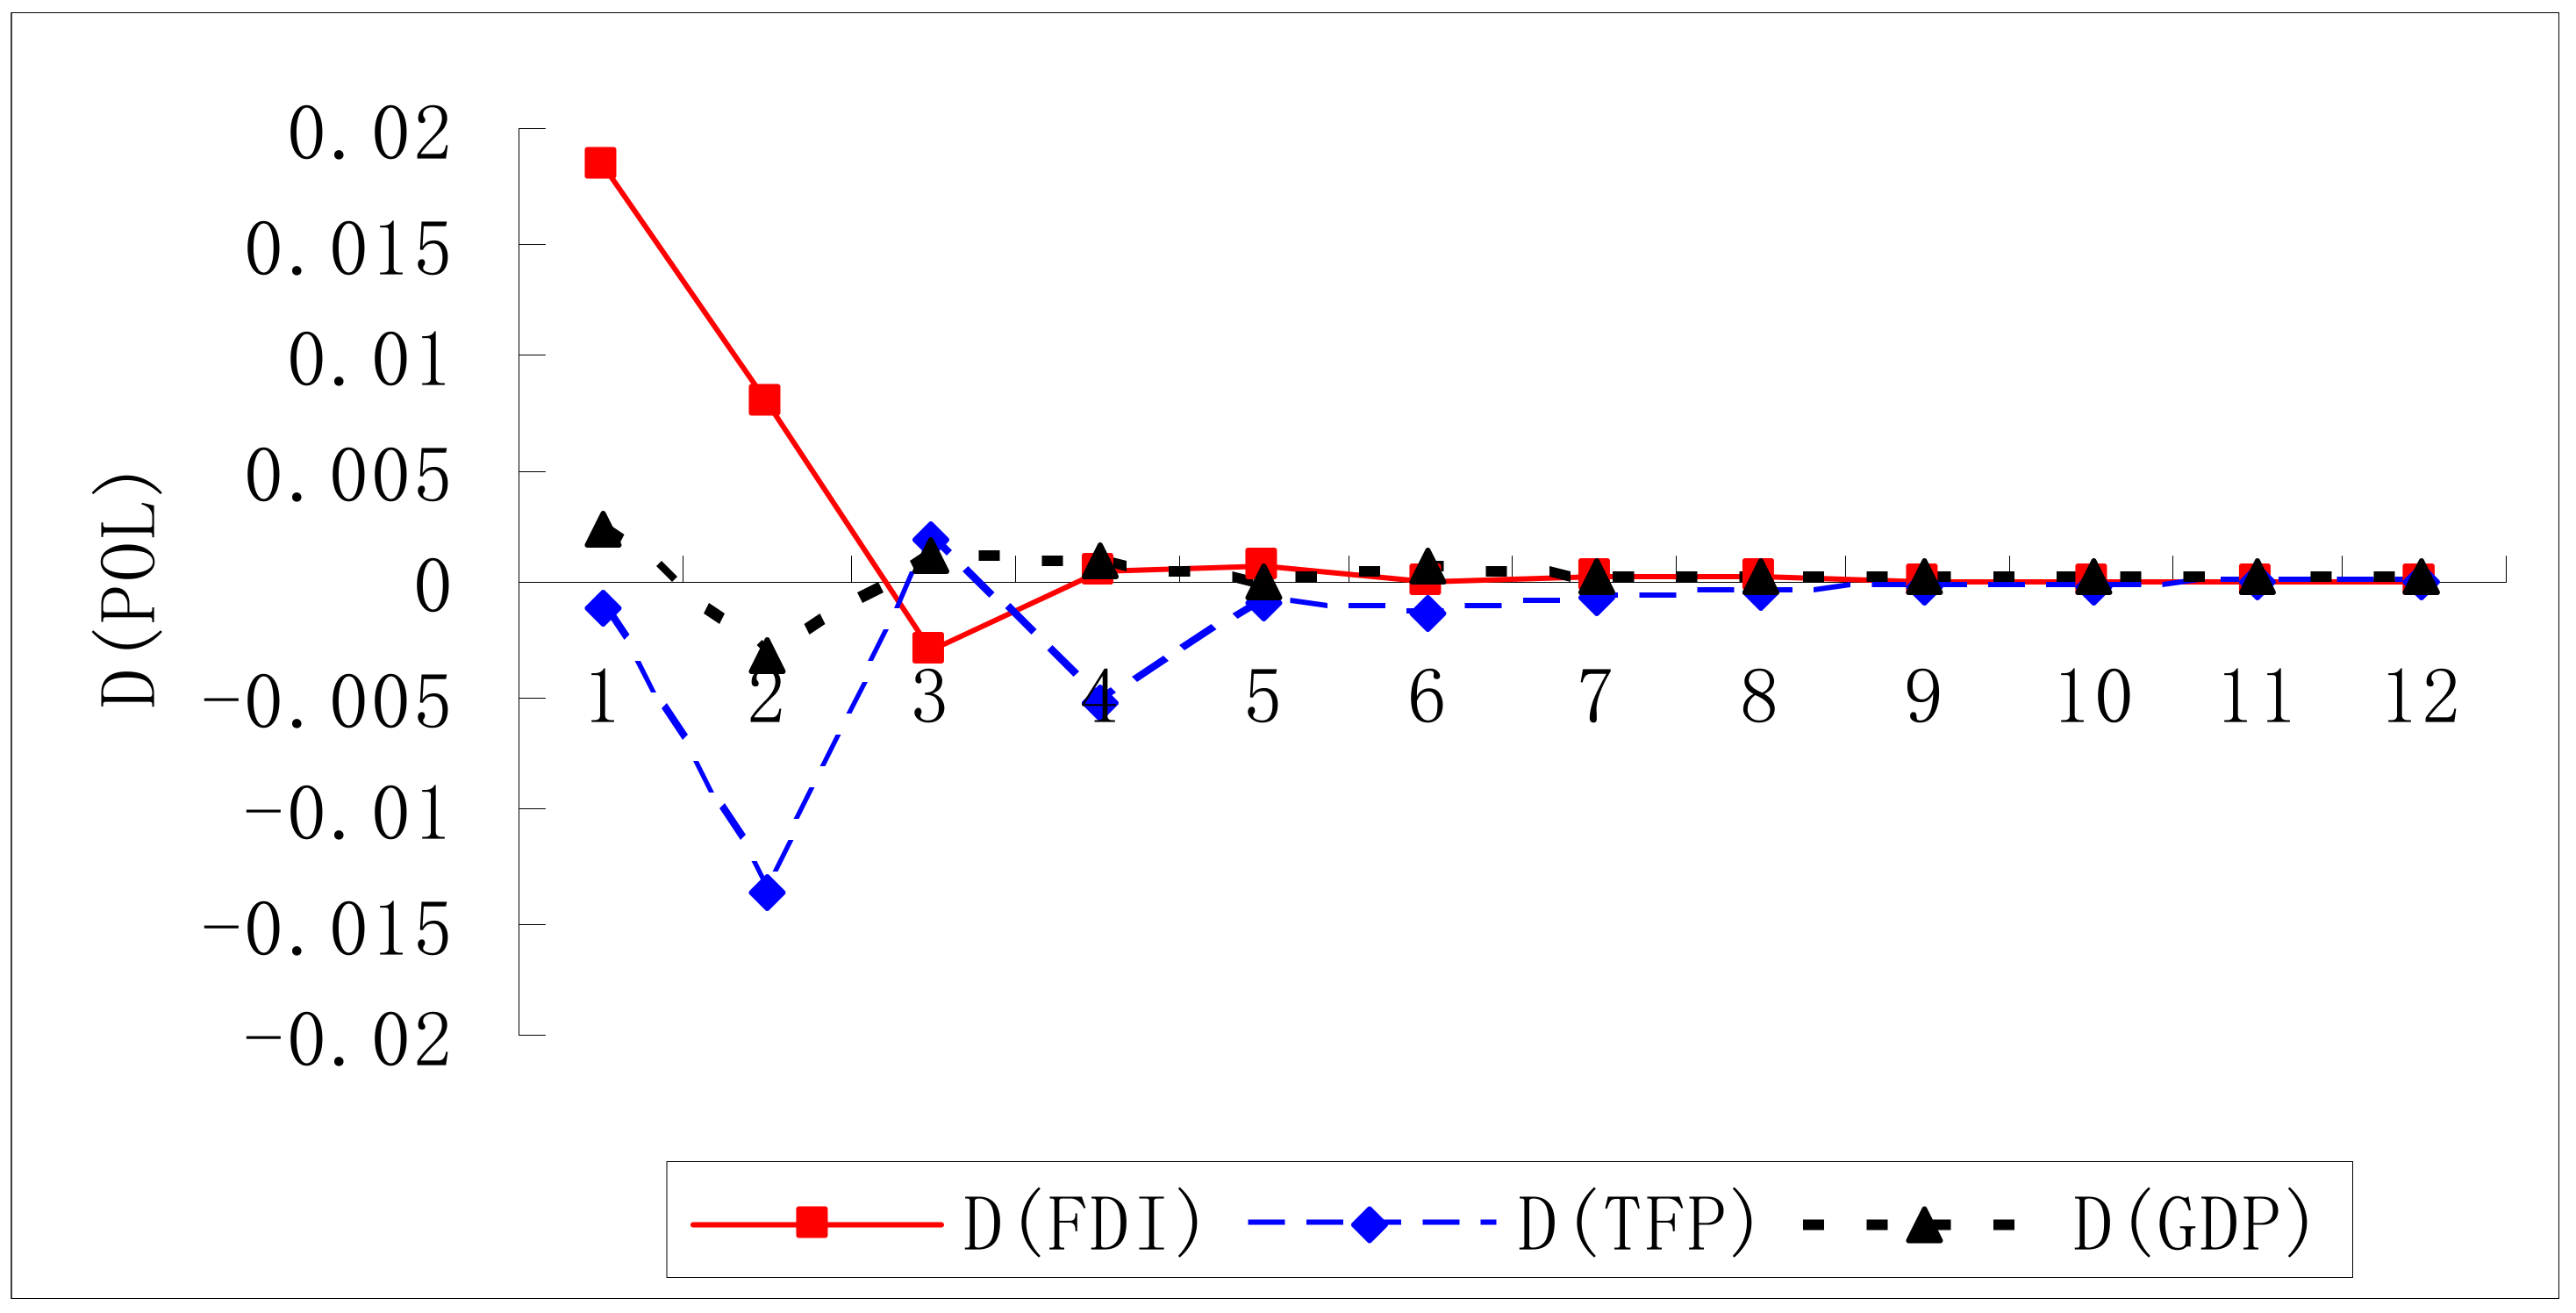
5.2. Generalized Impulse Response Analysis of FDI on Inclusive Green Total Factor Productivity in China
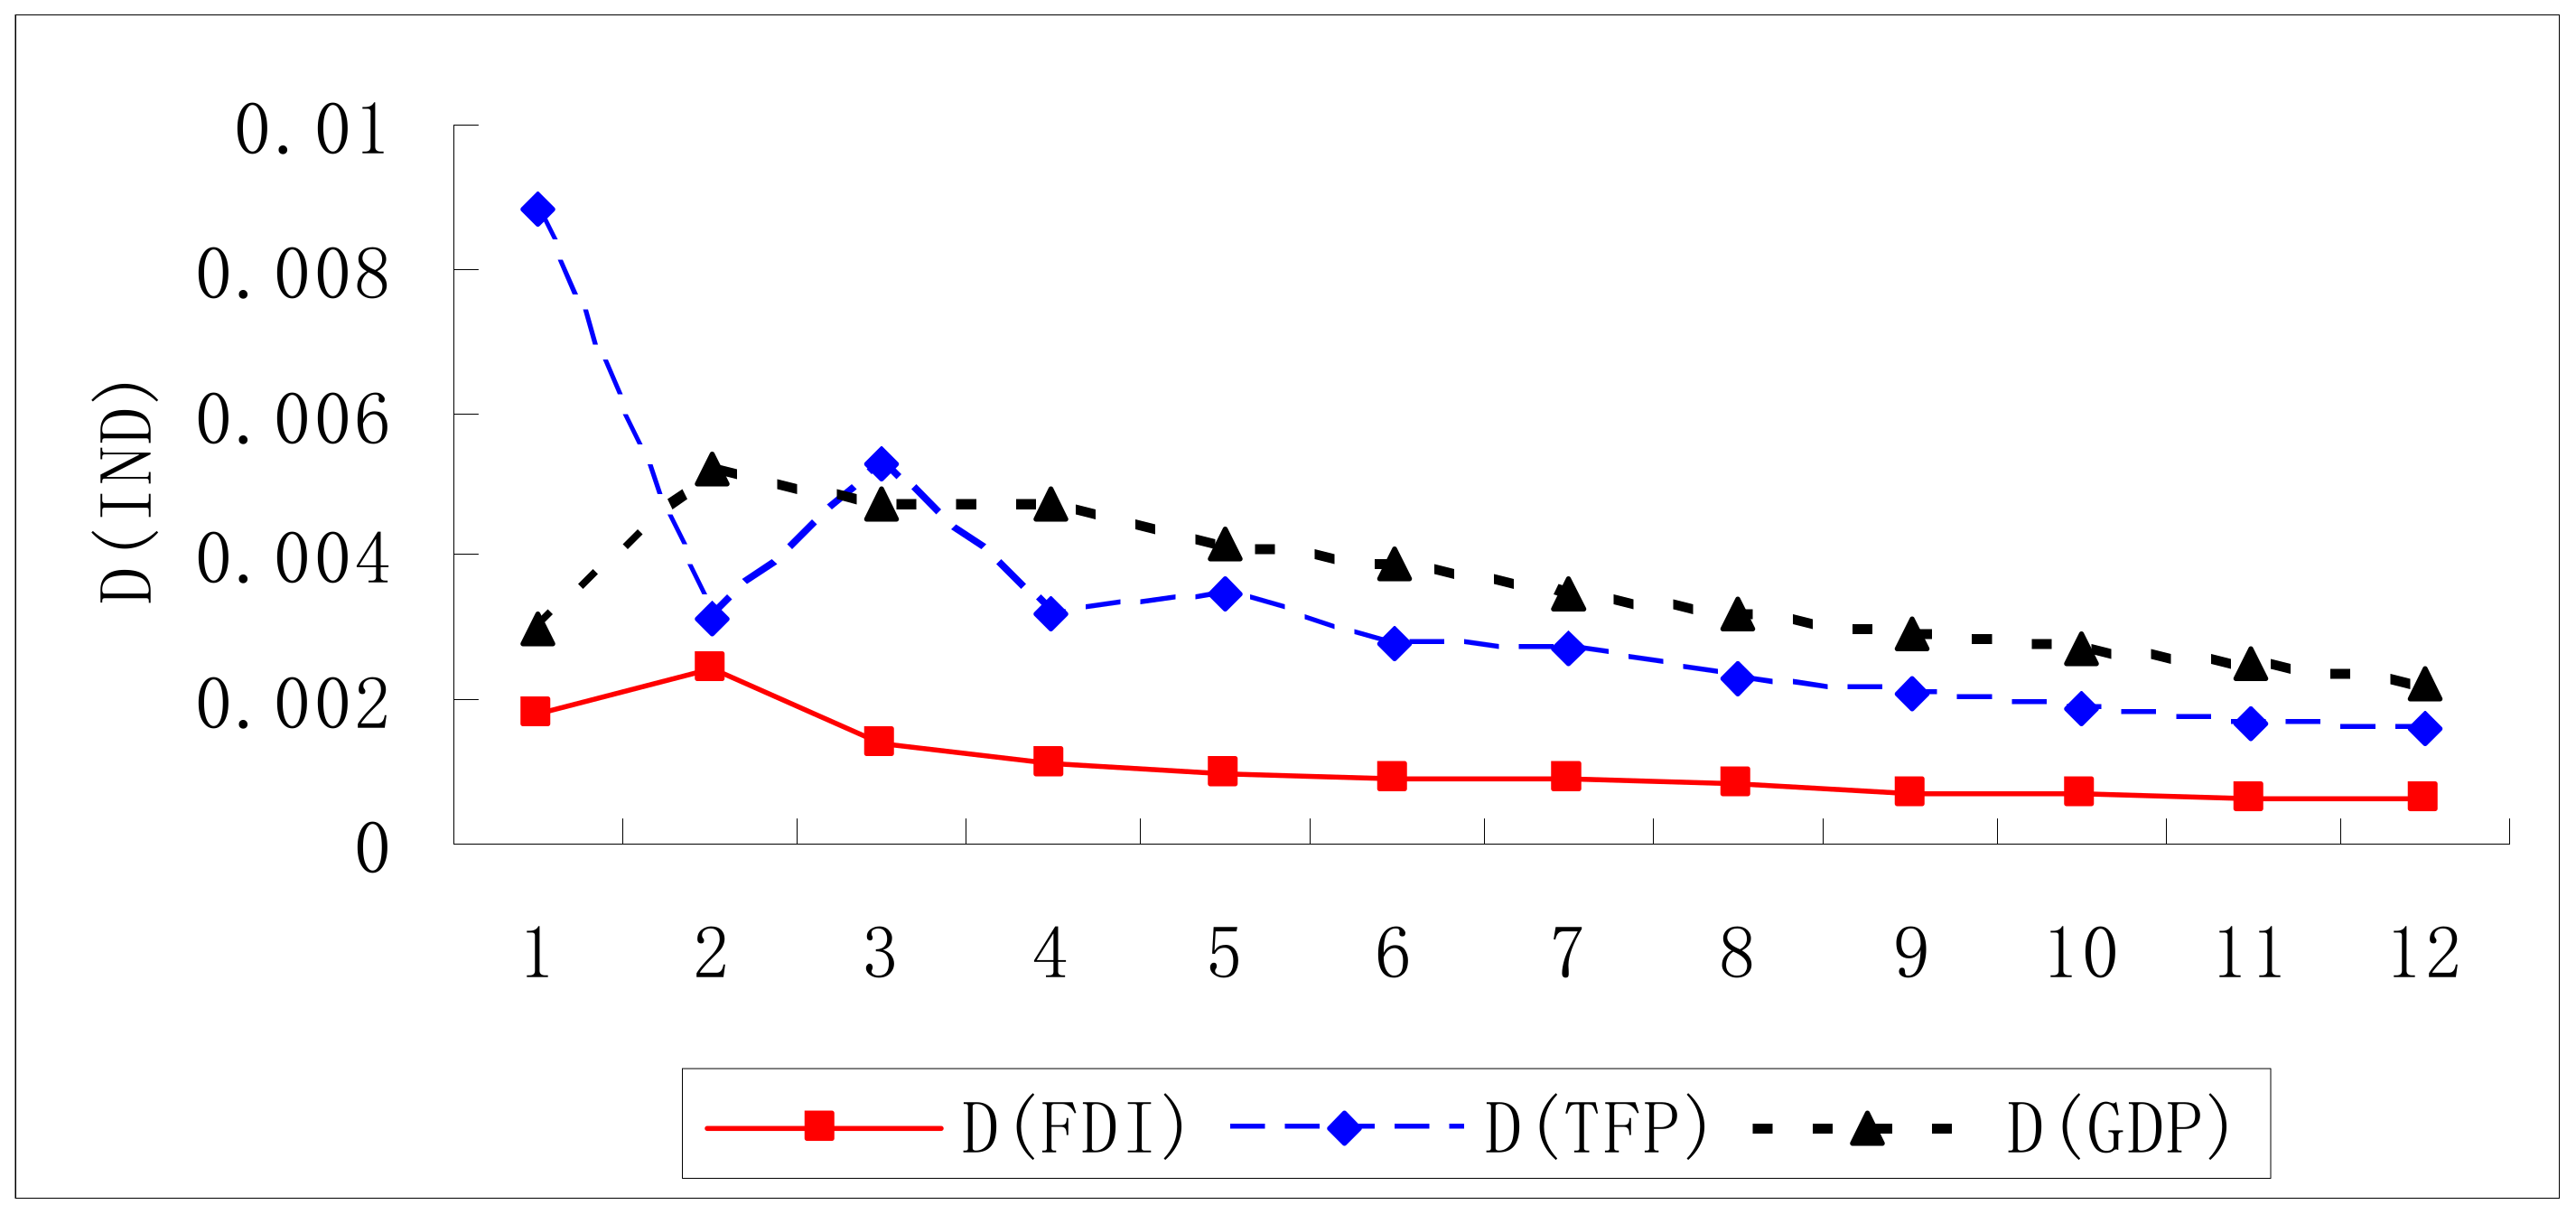
5.3. Analysis of Variance Decomposition
6. Conclusions
Author Contributions
Funding
Acknowledgments
Conflicts of Interest
References
- Andersen, Per, and Niels Christian Petersen. 1993. A Procedure for Ranking Units in Data Envelopment Analysis. Management Science 39: 1261–64. [Google Scholar] [CrossRef]
- Ari, Kokko, Ruben Tansini, and Mario C. Zejan. 1996. Local technological capability and productivity spillovers from FDI in the Uruguayan manufacturing sector. Journal of Development Studies 32: 602–11. [Google Scholar]
- Bouma, Jetske, and Ezra Berkhout. 2015. Inclusive Green Growth. Hague: PBL Netherlands Environmental Assessment Agency. [Google Scholar]
- Charnes, Abraham, W. W. Cooper, Boaz Golany, Lawrence M. Seiford, and J. Stutz. 1985. Foundations of data envelopment analysis for Pareto-Koopmans efficient empirical production functions. Journal of Econometrics 30: 91–107. [Google Scholar] [CrossRef]
- Chaudhuri, Sarbajit, and Dibyendu Banerjee. 2010. FDI in agricultural land, welfare and unemployment in a developing economy. Research in Economics 64: 229–39. [Google Scholar] [CrossRef]
- Chen, Shiyi. 2010. Green Industrial Revolution in China: A Perspective from the Change of Environmental Total Factor Productivity. Economic Research Journal 45: 21–34. [Google Scholar]
- Chen, Honglei, and Weifang Qin. 2014. Inclusive Growth in China: A Perspective from the Change of Inclusive Total Factor Productivity. China Industrial Economics 1: 18–30. [Google Scholar]
- Cheng, Liangzhu, Hongzhi Yue, and Ping Shi. 2011. Empirical Study on China’s Economic Growth Efficiency under the Binding of Environment. Journal of Quantitative & Technical Economics 28: 20–93. [Google Scholar]
- Damijan, Jože P., and Mark Knell. 2005. How Important Is Trade and Foreign Ownership in Closing the Technology Disparity? Evidence from Estonia and Slovenia. Review of World Economics 1412: 271–95. [Google Scholar] [CrossRef]
- Fay, Marianne. 2012. Inclusive Green Growth: The Pathway to Sustainable Development. Washington: World Bank. [Google Scholar]
- Holtz-Eakin, Douglas, Whitney Newey, and Harvey S. Rosen. 1988. Estimating Vector Autoregressions with Panel Data. Econometrica 56: 1371–95. [Google Scholar] [CrossRef]
- Hu, Yurong, and Jiebin Qi. 2016. Spillover Effects of Inclusive Growth in an Open Economy. Journal of International Trade 4: 3–14. [Google Scholar]
- Hu, Zongyi, Yi Li, and Yiwen Liu. 2017. Regional Differences and Convergence Analysis of Green Technology Efficiency in China. Soft Science 31: 1–4. [Google Scholar]
- Jin, Chunyu, and Weiqiang Wang. 2016. Does Pollution Haven Hypothesis Exist in China—An Empirical Test Based on Spatial Victor Autoregressive Model. Journal of International Trade 8: 108–18. [Google Scholar]
- Jing, Weimin, and Lu Zhang. 2014. Environmental Regulation, Economic Opening and China’s Industrial Green Technology Progress. Economic Research Journal 9: 34–47. [Google Scholar]
- Kim, Hyuk-Hwang, Hongshik Lee, and Joonhyung Lee. 2015. Technology diffusion and host–country productivity in South-South FDI flows. Japan & the World Economy 33: 1–10. [Google Scholar]
- Kuang, Yuanfeng, and Daiyan Peng. 2012. Analysis of Environmental Production Efficiency and Environmental Total Factor Productivity in China. Economic Research Journal 47: 62–74. [Google Scholar]
- Li, Jinping, and Meng Yu. 2011. The Research on Correlation between Host Country’s Location Advantage and China’s Outward FDI: A GMM Analysis based on Dynamic Panel Data with Intercross Variable. World Economy Study 6: 63–74. [Google Scholar]
- Li, Bin, Xing Peng, and Ming-ke Ouyang. 2013a. Environmental regulation, green total factor productivity and the transformation of China’s industrial development mode: Analysis based on data of China’s 36 industries. China Industrial Economics 4: 56–68. [Google Scholar]
- Li, Hong, Kuangnan Fang, Wei Yang, Di Wang, and Xiaoxin Hong. 2013b. Regional environmental efficiency evaluation in China: Analysis based on the Super-SBM model with undesirable outputs. Mathematical & Computer Modelling 58: 1018–31. [Google Scholar]
- Liu, Xiaming, Pamela Siler, and Chengqi Wang. 2000. Productivity Spillovers from Foreign Direct Investment: Evidence from UK Industry Level Panel Data. Journal of International Business Studies 31: 407–25. [Google Scholar] [CrossRef]
- Ma, Qiangwen. 2012. Inclusive Growth Measurement and Influencial Factors Analysis—Based on the Angle of Sustainability of Economic Growth. China Population Resources & Environment 22: 101–8. [Google Scholar]
- NBSC. 2010. China compendium of statistics 1949–2008. Beijing: China Statistical Press, National Bureau of Statistics of China. [Google Scholar]
- Ng, Linda, Fung Yee, and Chyau Tuan. 2005. Industry technology performance of manufacturing FDI: Micro-level evidence from joint ventures in China. International Journal of Technology Management 32: 246–63. [Google Scholar] [CrossRef]
- Pesaran, H. Hashem, and Yongcheol Shin. 1998. Generalized impulse response analysis in linear multivariate models. Economics Letters 58: 17–29. [Google Scholar] [CrossRef]
- Salim, Ruhul A., and Harry Bloch. 2009. Does Foreign Direct Investment Lead to Productivity Spillovers? Firm Level Evidence from Indonesia. World Development 37: 1861–76. [Google Scholar]
- Shan, Haojie. 2008. Reestimating the Capital Stock of China: 1952~2006. Journal of Quantitative & Technical Economics 25: 17–31. [Google Scholar]
- Spratt, Stephen, and Griffith-Jones Stephany. 2013. Mobilising Investment for Inclusive Green Growth in Low-income Countries. Eschborn: German International Cooperation Organization Press. [Google Scholar]
- Tan, Bee Wah, Soo Khoon Goh, and Koi Nyen Wong. 2016. The effects of inward and outward FDI on domestic investment: Evidence using panel data of ASEAN-8 countries. Journal of Business Economics & Management 17: 717–33. [Google Scholar]
- Tone, Kaoru. 2001. A slacks-based measure of efficiency in data envelopment analysis. European Journal of Operational Research 130: 498–509. [Google Scholar] [CrossRef]
- Tone, Kaoru. 2002. A slacks-based measure of super-efficiency in data envelopment analysis. European Journal of Operational Research 143: 32–41. [Google Scholar] [CrossRef]
- Tone, Kaoru. 2004. Dealing with undesirable outputs in DEA: A slacks-based measure (SBM) approach. Paper presented at NAPW III, Toronto, ON, Canada, June 22–25; pp. 44–45. [Google Scholar]
- Wan, Zhao, Guanghua Lu, and Ming Chen. 2005. Globalization and Regional Inequality: Chinese Evidence. Social Sciences in China 3: 17–26. [Google Scholar]
- Wang, Wei, Wang Feng, and Wangyi Zhang. 2007. Decomposing Analysis of Income Disparity Based on Population Characteristics: The Case of Chongqing Municipal. Statistical Research 3: 62–67. [Google Scholar]
- Wang, Hu, Shujing Zhu, and Mingyong Lai. 2012. Threshold of Technology Gap and Non-linearity of Technology Spillovers of FDI. Journal of Quantitative & Technical Economics 4: 3–18. [Google Scholar]
- Wolfgang, Keller, and Stephen R. Yeaple. 2009. Multinational Enterprises, International Trade, and Productivity Growth: Firm Level Evidence from the United States. The Review of Economics and Statistics 91: 821–31. [Google Scholar]
- Xu, Yingzhi, Shubin Wang, and Sha Wei. 2015. Efficiency of China’s Inclusiveness Growth under the Restriction of CO2 Emissions. Forum on Science & Technology in China 7: 100–5. [Google Scholar]
- Yang, Xuexing. 2014. Construction and Empirical Study of inclusive green economic growth index—Based on G20 national data. Fujian Tribune (The Humanities & Social Sciences Monthly) 6: 42–48. [Google Scholar]
- Yue, Shujing, Yang Yang, and Yaoyu Hu. 2016. Does Foreign Direct Investment Affect Green Growth? Evidence from China’s Experience. Sustainability 8: 158. [Google Scholar] [CrossRef]
- Zhang, Liang, Kailei Wei, Neng-Rui Xu, Yi Hu, Zhichao Ding, and Jiacheng Liu. 2016. Can Agricultural Fixed Investment and FDI Increase Chinese Farmers’ Income—The Panel Data Based on the Perspective of Regional Differences. Modern Economic Science 2: 61–68. [Google Scholar]
- Zhao, Wu, and Jiao-yue Wang. 2015. Under the New Normal “Precise Poverty Alleviation” Inclusive Innovation Mechanism Research. China Population Resources & Environment 25: 170–73. [Google Scholar]
- Zhong, Cangbiao, Yuanjian Huang, and Wei Liu. 2013. The Optimal Sectoral Level of Foreign Direct Investment—An Empirical Examination of Spillovers in the Chinese Manufacturing. Nankai Economic Studies 6: 19–36. [Google Scholar]
- Zhou, Xiaoliang, Wulin Wu, and Daying Liao. 2018. Research on the Measurement and Difference of Regional Inclusive Green Growth in China. Science & Technology Progress & Policy 35: 42–49. [Google Scholar]
| 1 | In order to distinguish all kinds of total factor productivity, the traditional total factor productivity (TFP) is generally described as the total factor productivity (TFP), that is, the total factor productivity calculated by the same input without considering the environmental pollution and the income disparity. |
| 2 | The data of FDI, three major industries, urban residents and rural residents’ income, energy consumption, GDP, fixed assets investment and price index can easily be found in EDB database of WIND (http://www.wind.com.cn/NewSite/edb.html) or collected from the statistical yearbook of China. Environmental pollution data originate from NBSC (2010) and Chinese data from National Bureau of Statistics website (http://www.stats.gov.cn/ztjc/ztsj/hjtjzl/). |
| 3 | The eastern region: Beijing, Tianjin, Hebei, Liaoning, Shanghai, Jiangsu, Zhejiang, Fujian, Shandong, Guangdong, Hainan. The central region: Shanxi, Jilin, Heilongjiang, Anhui, Jiangxi, Henan, Hubei, Hunan. Western Regions: Inner Mongolia, Guangxi, Sichuan, Guizhou, Yunnan, Shaanxi, Gansu, Ningxia, Qinghai, Xinjiang. |
| Variable Category | Variable Name | Total Factor Productivity | Green Total Factor Productivity | Inclusive Total Factor Productivity | Inclusive Green Total Factor Productivity |
|---|---|---|---|---|---|
| Inputs | Labor | √ | √ | √ | √ |
| Capital | √ | √ | √ | √ | |
| Energy | √ | √ | √ | √ | |
| Desirable outputs | Gross domestic product (GDP) | √ | √ | √ | √ |
| Undesirable outputs | income disparity | □ | □ | √ | √ |
| Environmental Pollution | □ | √ | □ | √ |
| Provinces | IGTFP | ITFP | GTFP | TFP | Provinces | IGTFP | ITFP | GTFP | TFP |
|---|---|---|---|---|---|---|---|---|---|
| Beijing | 0.9676 | 1.012 | 0.9804 | 1.0221 | Hubei | 0.4969 | 0.5327 | 0.5121 | 0.566 |
| Tianjin | 0.8471 | 0.8639 | 0.9053 | 0.9248 | Hunan | 0.4768 | 0.5454 | 0.5308 | 0.5978 |
| Hebei | 0.418 | 0.4946 | 0.4873 | 0.5793 | Guangdong | 0.9622 | 0.9915 | 0.9897 | 1.0277 |
| Shanxi | 0.3833 | 0.4571 | 0.4499 | 0.5303 | Guangxi | 0.3982 | 0.4801 | 0.4752 | 0.5941 |
| Inner Mongolia | 0.4677 | 0.5177 | 0.5065 | 0.5718 | Hainan | 0.4467 | 0.5642 | 0.5783 | 0.7205 |
| Liaoning | 0.6835 | 0.7046 | 0.6924 | 0.7285 | Sichuan | 0.4359 | 0.4893 | 0.4874 | 0.5349 |
| Jilin | 0.4204 | 0.5126 | 0.4917 | 0.5971 | Guizhou | 0.2729 | 0.3413 | 0.3233 | 0.3986 |
| Heilongjiang | 0.4752 | 0.5693 | 0.5532 | 0.6384 | Yunnan | 0.5214 | 0.5536 | 0.5367 | 0.5744 |
| Shanghai | 0.9509 | 1.0004 | 0.9862 | 1.0323 | Shaanxi | 0.5049 | 0.5249 | 0.5159 | 0.5294 |
| Jiangsu | 0.8868 | 0.8824 | 0.9 | 0.8947 | Gansu | 0.3666 | 0.3909 | 0.3729 | 0.3981 |
| Zhejiang | 0.6456 | 0.7289 | 0.7046 | 0.8121 | Qinghai | 0.2961 | 0.3672 | 0.3503 | 0.4202 |
| Anhui | 0.4506 | 0.5314 | 0.5017 | 0.6015 | Ningxia | 0.2964 | 0.3464 | 0.3309 | 0.3982 |
| Fujian | 0.6592 | 0.7376 | 0.7381 | 0.8416 | Xinjiang | 0.3709 | 0.4452 | 0.4226 | 0.5022 |
| Jiangxi | 0.3663 | 0.4636 | 0.442 | 0.5486 | Eastern Region | 0.7297 | 0.7788 | 0.7728 | 0.8356 |
| Shandong | 0.5196 | 0.5664 | 0.5587 | 0.6279 | Central region | 0.4411 | 0.5137 | 0.4961 | 0.5781 |
| Henan | 0.4592 | 0.4977 | 0.4873 | 0.5451 | Western Region | 0.3931 | 0.4457 | 0.4322 | 0.4922 |
| Variables | Methods | ||
|---|---|---|---|
| LLC | IPS | PPF | |
| Dln(FDI) | −14.4629 *** | −8.3044 *** | 237.058 *** |
| Dln(IGTFP) | −5.6802 *** | −6.9640 *** | 262.4440 *** |
| Dln(GDP) | −2.9218 *** | −1.5451 * | 72.4297 * |
| Dln(POL) | −6.0103 *** | −4.0040 *** | 97.1240 *** |
| Dln(IND) | −13.3920 *** | −9.5194 *** | 338.4216 *** |
| Dln(TFP) | −3.9361 *** | −4.5288 *** | 165.5121 *** |
| Methods | Panel v | Panel PP | Panel ADF | Group Rho | Group PP | Group ADF |
|---|---|---|---|---|---|---|
| Statistic | −2.9874 | −0.3621 *** | −2.8577 *** | 7.0712 | −5.4549 *** | −2.8200 *** |
| p value | 1.0000 | 0.0000 | 0.0021 | 1.0000 | 0.0000 | 0.0024 |
| Variables | Horizon | IGTFP | FDI | TFP | GDP | POL | IND |
|---|---|---|---|---|---|---|---|
| IGTFP | 5 | 0.968 | 0.007 | 0.011 | 0.002 | 0.010 | 0.002 |
| FDI | 5 | 0.006 | 0.934 | 0.005 | 0.020 | 0.007 | 0.028 |
| TFP | 5 | 0.044 | 0.002 | 0.938 | 0.009 | 0.003 | 0.004 |
| GDP | 5 | 0.011 | 0.027 | 0.066 | 0.644 | 0.007 | 0.245 |
| POL | 5 | 0.005 | 0.052 | 0.015 | 0.003 | 0.924 | 0.001 |
| IND | 5 | 0.010 | 0.006 | 0.068 | 0.052 | 0.004 | 0.860 |
| IGTFP | 10 | 0.966 | 0.007 | 0.011 | 0.003 | 0.010 | 0.003 |
| FDI | 10 | 0.006 | 0.913 | 0.006 | 0.027 | 0.007 | 0.040 |
| TFP | 10 | 0.044 | 0.002 | 0.934 | 0.011 | 0.003 | 0.007 |
| GDP | 10 | 0.011 | 0.026 | 0.079 | 0.566 | 0.006 | 0.311 |
| POL | 10 | 0.005 | 0.052 | 0.015 | 0.003 | 0.924 | 0.001 |
| IND | 10 | 0.010 | 0.008 | 0.079 | 0.078 | 0.003 | 0.821 |
| IGTFP | 15 | 0.966 | 0.007 | 0.011 | 0.003 | 0.010 | 0.003 |
| FDI | 15 | 0.006 | 0.904 | 0.007 | 0.030 | 0.007 | 0.045 |
| TFP | 15 | 0.043 | 0.002 | 0.931 | 0.012 | 0.003 | 0.008 |
| GDP | 15 | 0.011 | 0.026 | 0.086 | 0.544 | 0.006 | 0.328 |
| POL | 15 | 0.005 | 0.052 | 0.015 | 0.003 | 0.924 | 0.001 |
| IND | 15 | 0.010 | 0.008 | 0.083 | 0.088 | 0.003 | 0.809 |
© 2018 by the authors. Licensee MDPI, Basel, Switzerland. This article is an open access article distributed under the terms and conditions of the Creative Commons Attribution (CC BY) license (http://creativecommons.org/licenses/by/4.0/).
Share and Cite
Zhu, S.; Ye, A. Does Foreign Direct Investment Improve Inclusive Green Growth? Empirical Evidence from China. Economies 2018, 6, 44. https://doi.org/10.3390/economies6030044
Zhu S, Ye A. Does Foreign Direct Investment Improve Inclusive Green Growth? Empirical Evidence from China. Economies. 2018; 6(3):44. https://doi.org/10.3390/economies6030044
Chicago/Turabian StyleZhu, Songping, and Azhong Ye. 2018. "Does Foreign Direct Investment Improve Inclusive Green Growth? Empirical Evidence from China" Economies 6, no. 3: 44. https://doi.org/10.3390/economies6030044
APA StyleZhu, S., & Ye, A. (2018). Does Foreign Direct Investment Improve Inclusive Green Growth? Empirical Evidence from China. Economies, 6(3), 44. https://doi.org/10.3390/economies6030044


