1. Introduction
Politicians and intellectuals alike have blamed the financial failures in Greece, Portugal, Spain, and Ireland largely on fiscal profligacy and government indebtedness. As commonly known, one contributing factor to this debacle is substantial reduction in real borrowing costs following harmonization of nominal interest rates across low and high inflation states. Many economists, including Paul Krugman and Nouriel Roubini, have in some ways criticized the single currency as the Achilles’ heel and advocated that without currency unification cheaper national monies would have stimulate exports, cut imports, and an export-led growth can be orchestrated. Yet others have argued that a combination of lower living standards and higher productivity must be attained, particularly in the tradable sector.
Undoubtedly, the critical question of sustainability lies in the degree of economic convergence amongst its members, not only nominal convergence as stipulated by the Maastricht criteria but more importantly real convergence, so that adjustments in relative prices and wages across the states, which may be painful and difficult in both social and political terms, can be avoided or minimized. As put it by Martin Feldstein (2008) [
1]
1, the primary problem in the Eurozone is that conditions in individual euro members may develop in such different ways that some national political leaders could be tempted to conclude that their countries would be better served by adopting a mix of policies different from that of the other members. Empirically, recently Wihlborg, Willett, and Zhang (2010) [
2] find that lack of price and cost convergence in the Eurozone since 1999 is one important factor to current account deficits in the distressed states. In particular, it was also discovered that surplus countries have carried out more of the adjustment process pointed by the endogenous optimum currency area (OCA) theory than the deficit countries
2.
In accordance, the objective of the present work is twofold. First, it looks at more dimensions, also inspired by the OCA framework, inspecting if there is greater convergence amongst the Eurozone founding members with the
de facto core country Germany and if their relations with Germany have been more parallel after euroization. In some ways, it will also suggest if the endogenous nature of convergence has been significant (see Frankel and Rose, 1998 [
4]). To assess the dominance of Germany, the features against Germany are compared to those against US. In addition, this paper also appraises some common measures of economic performance to check whether economic conditions across the states have improved and converged after euroization. The findings should be timely and helpful as another piece of information to policymakers amidst the tensions within Eurozone.
The approach used is a simple spatial analysis, namely, by depicting the relevant dimensions in two-dimensional scatter plots, so that the relative distances between the objects or countries can be easily observed. One advantage of this approach is that it reveals information from all countries as a whole down to individual countries, a feature essential to detect patterns and idiosyncratic countries amongst the euro founders. To complement, a non-parametric technique, the Wilcoxon Signed Ranks Test is used to determine the statistical significance of the differences before and after euroization
3.
The remainder of this paper contains four sections. The second section introduces the OCA dimensions and explores the dimensions of the euro founding members with reference to Germany and to US. The third section appraises a number of economic performance measures. The fourth section presents the non-parametric analysis. Finally, in the fifth section, a conclusion is provided.
2. Optimum Currency Area Criteria
The foundations of the OCA theory were laid out by Mundell (1961) [
5] and McKinnon (1963) [
6] with important elaborations by Kenen (1969) [
7] and Krugman (1990) [
8]. In essence, the OCA theory outlines the criteria under which a country or economic zone can reap large benefits and/or substantially reduce the cost of joining a currency area. As summarized by Boreiko (2003 [
9], p. 315):
The OCA theory is concerned with certain benefits and costs associated with adopting a single currency which depend on the degree of convergence of the economies. The benefits are associated with economizing on exchange costs and importing the credibility of the union’s central bank, thus reducing the inflationary expectations and level of inflation. As for the associated costs, they are essentially the opposite of the benefits of having an independent monetary policy and exchange rate, which are useful as a means of coping with shocks that are asymmetric between the potential monetary union partners.
In accordance with Quah and Crowley (2010 [
10], 2012 [
11]) and Quah (2012 [
12,
13,
14], 2013 [
15], 2014 [
16,
17,
18], 2015 [
19]) the OCA criteria investigated in this paper are trade openness, business cycle synchronization, real exchange rate variability, inflation convergence, and real interest rate symmetry. Similar metrics have been used by Artis and Zhang (2001 [
20], 2002 [
21]), of which the efficacy of the criteria was evidenced when Portugal, Italy, Greece, and Spain were selected as the group that possesses the least parallel OCA features against Germany. Infamously, these states are among the most distressed euro members today.
To ascertain if there has been greater convergence with Germany and if their relationships with Germany have been more symmetrical across the states after euroization, the OCA-related features of the countries are measured relative to Germany and compared over pre- and post-euro periods. To gauge the relative dominance of Germany, their relations with Germany are contrasted to those with US.
The pre-euro period is defined as 1988–1998, the period before the inception of euro but after the implementation of the Single European Act in 1987, which has contributed tremendously towards the Single European Market. The post-euro period is set to be 1999–2010, the interval between the onset of euroization and the most recent year of which adequate data are available across the countries under review. Certainly this period also encompasses part of the episode of the recent global crisis. The data sampled for each variable are constrained by data availability over states. For data descriptions, see
Appendix A.
2.1. Trade Openness
The OCA theory suggests that countries that trade a great deal with each other are good candidates for monetary integration as the benefits in terms of transaction cost savings and exchange rate certainty would be greatly enhanced (McKinnon, 1963 [
6]). Accordingly, Bayoumi and Eichengreen (1997) [
22] have detected that European member states that achieved the greatest levels of bilateral trade also experienced the greatest increase in their readiness for monetary unification. The more open economies are to each other, the less asynchronous would be their output fluctuations arising from demand shocks (Frankel and Rose, 1998 [
4]). To quantify this dimension, for each country denoted by
, trade openness with the reference country, namely Germany or US is measured by bilateral trade intensity (e.g., see Artis and Zhang 2001 [
20], 2002 [
21]; Boreiko [
9], 2003),
where
and
are the dollar values of exports and imports of an Eurozone member and subscript
r indicates destination to or source from the reference country.
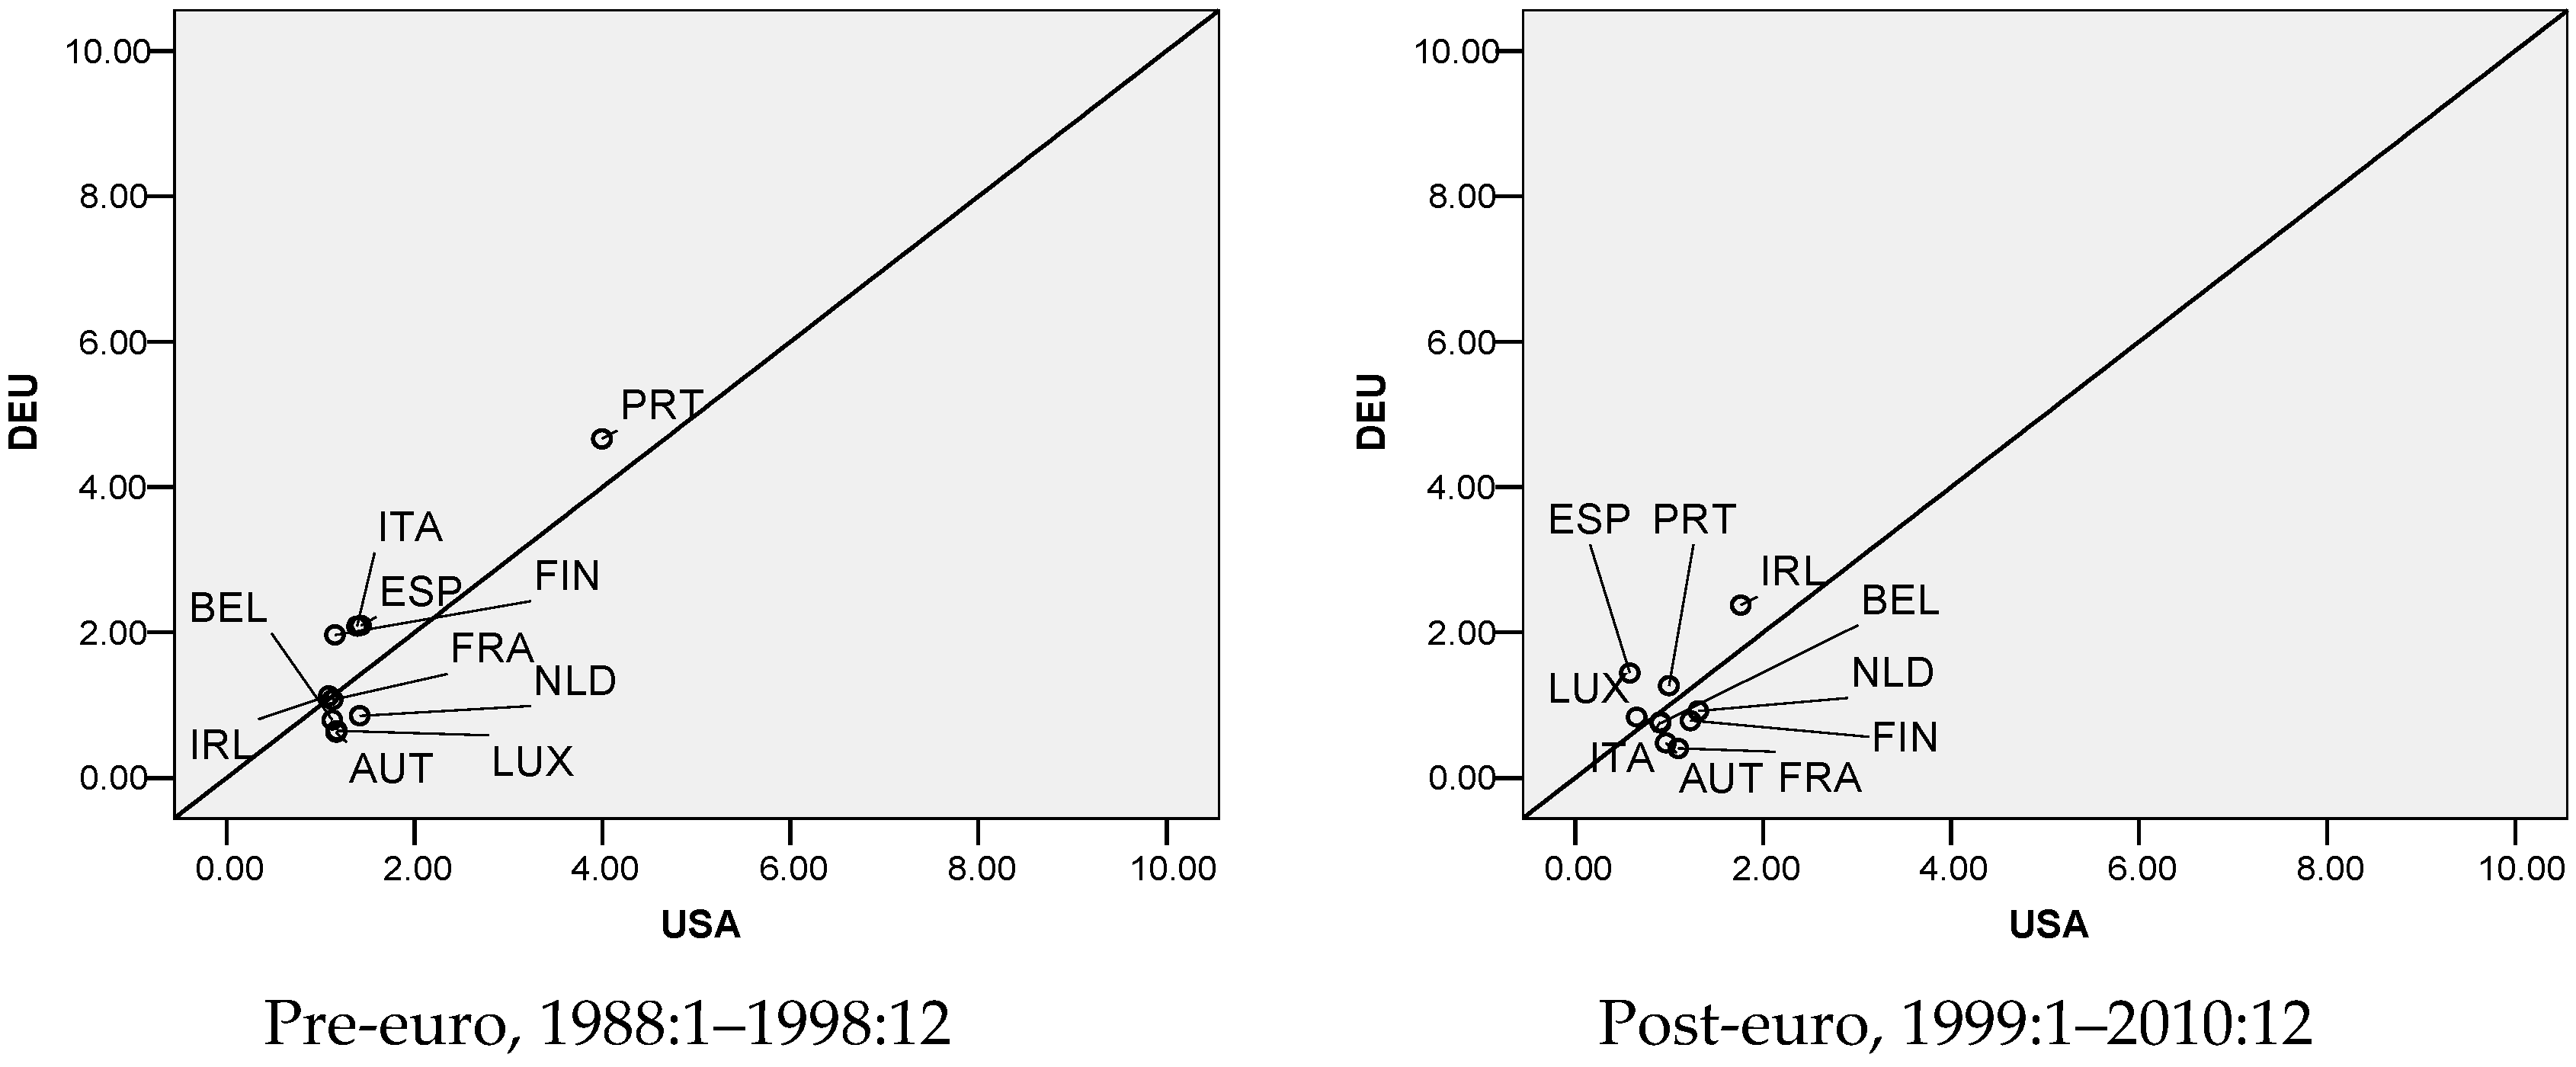
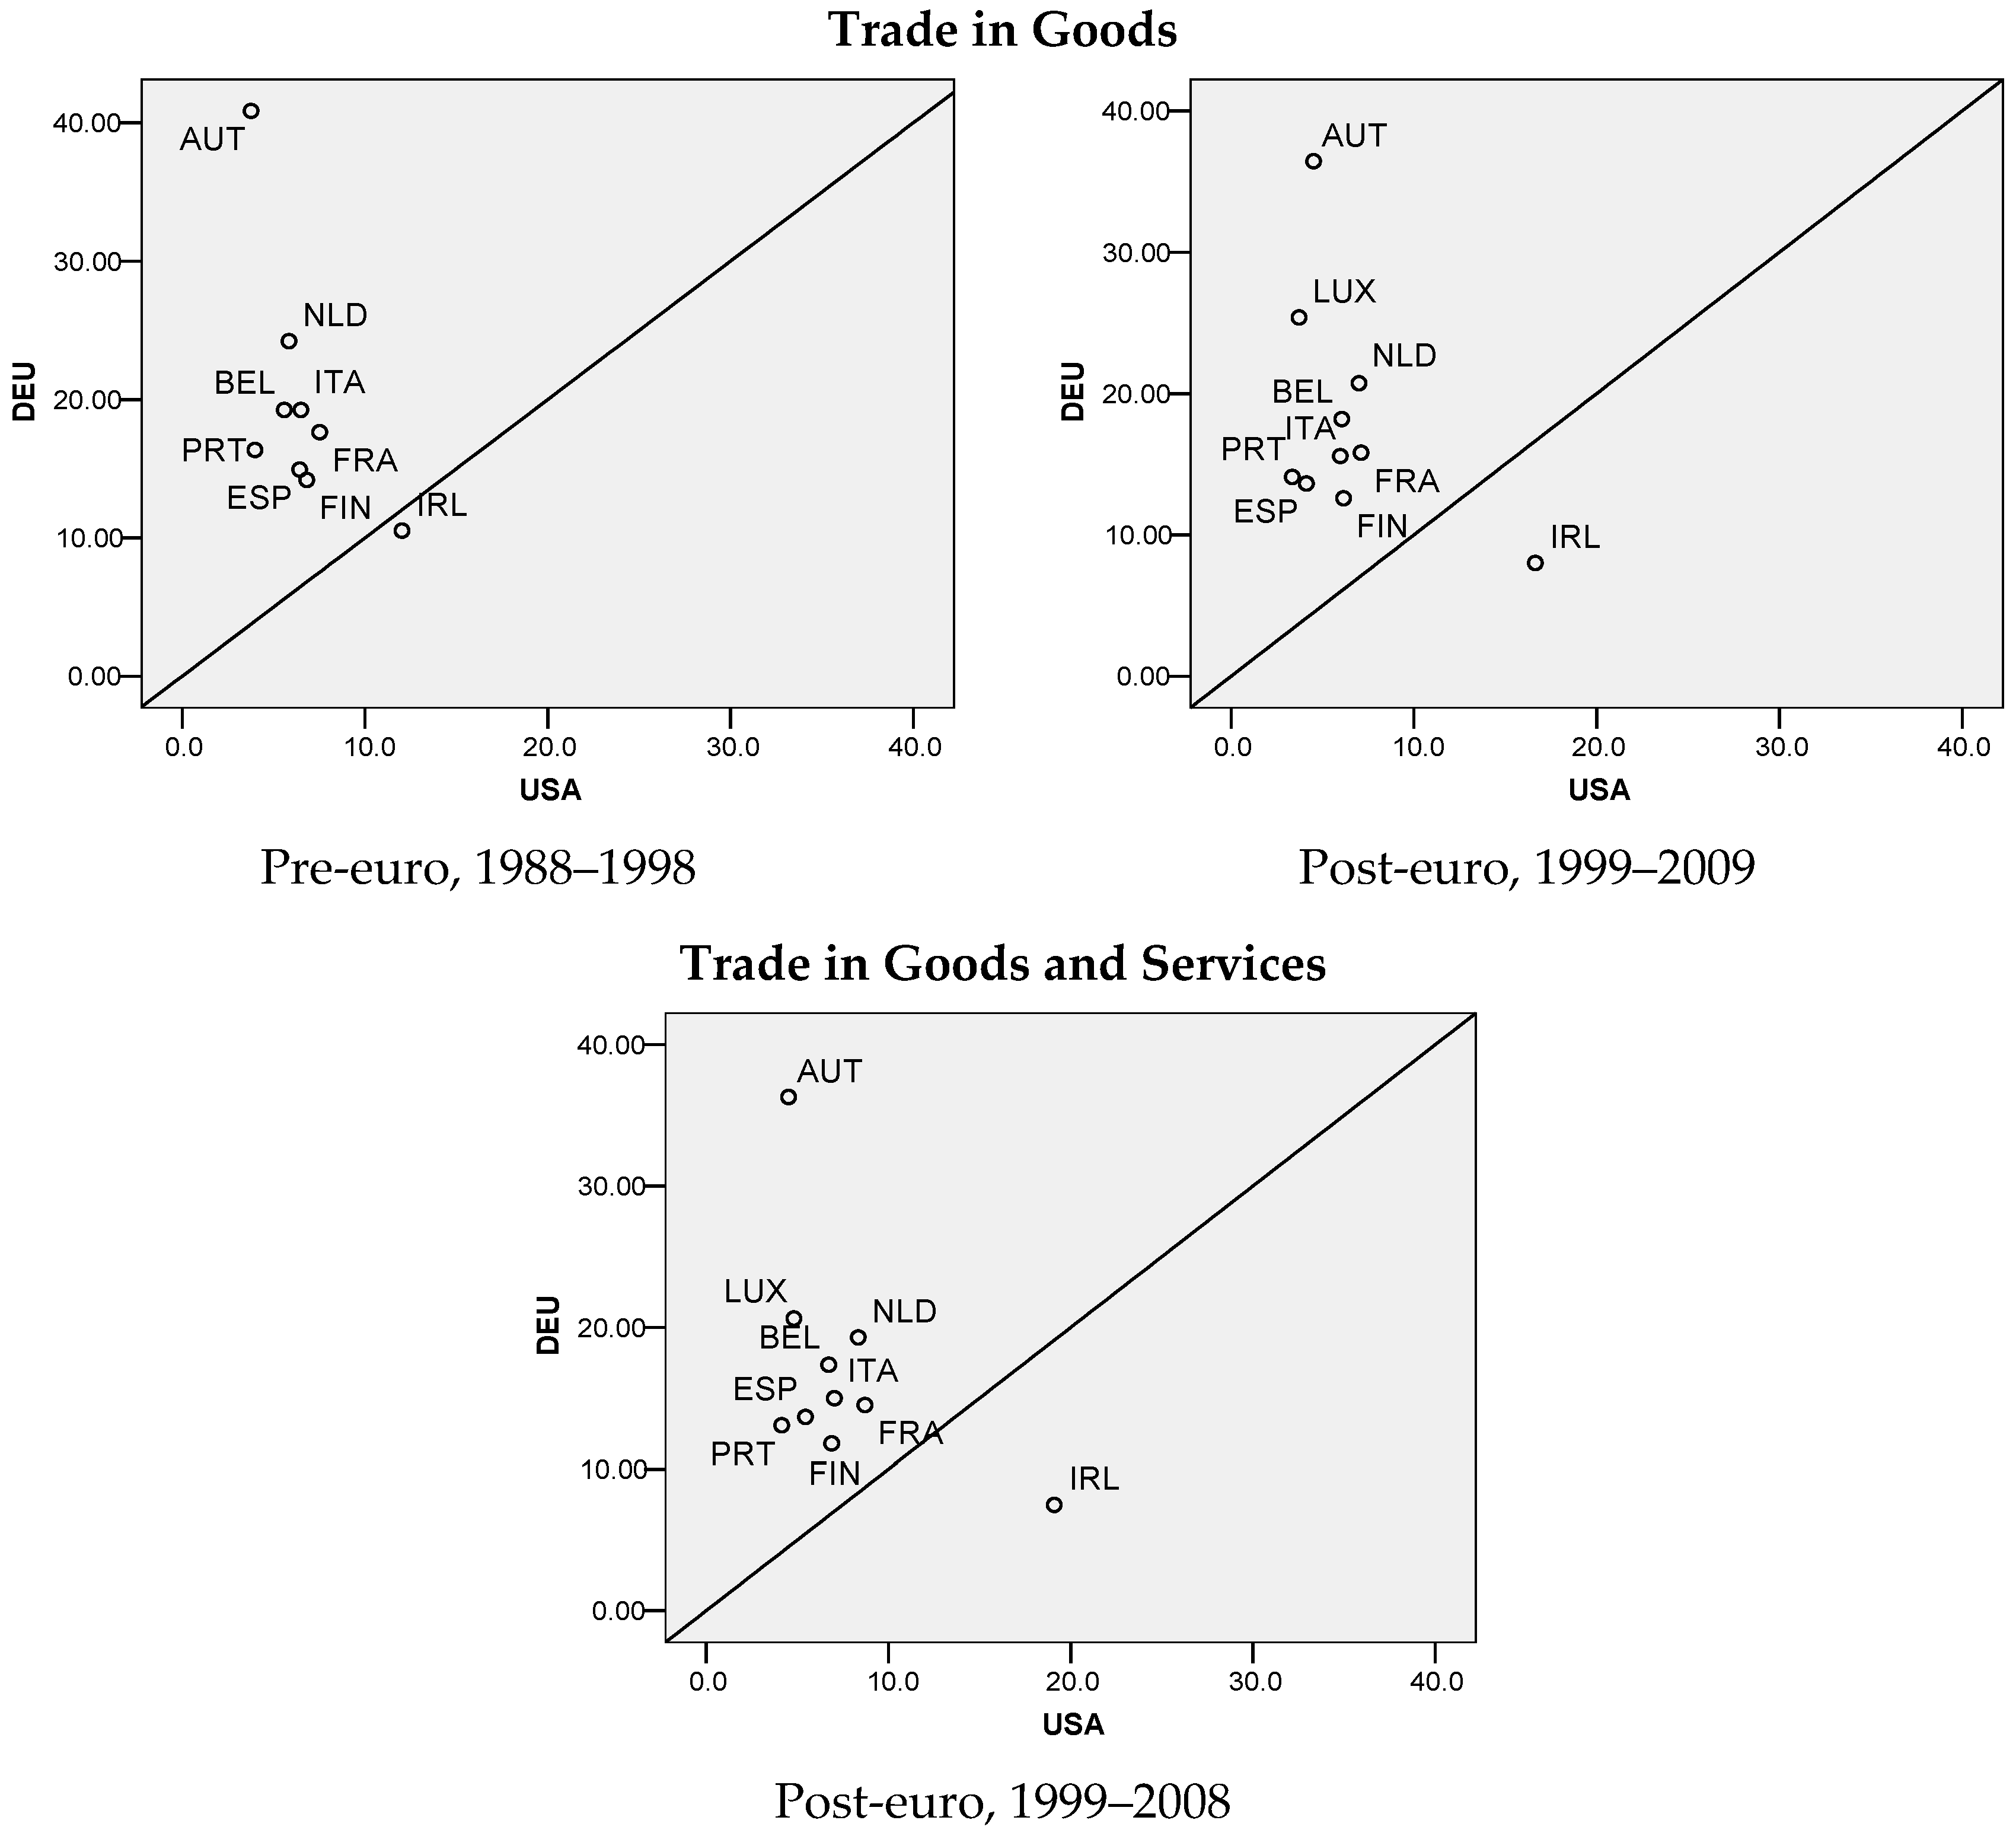
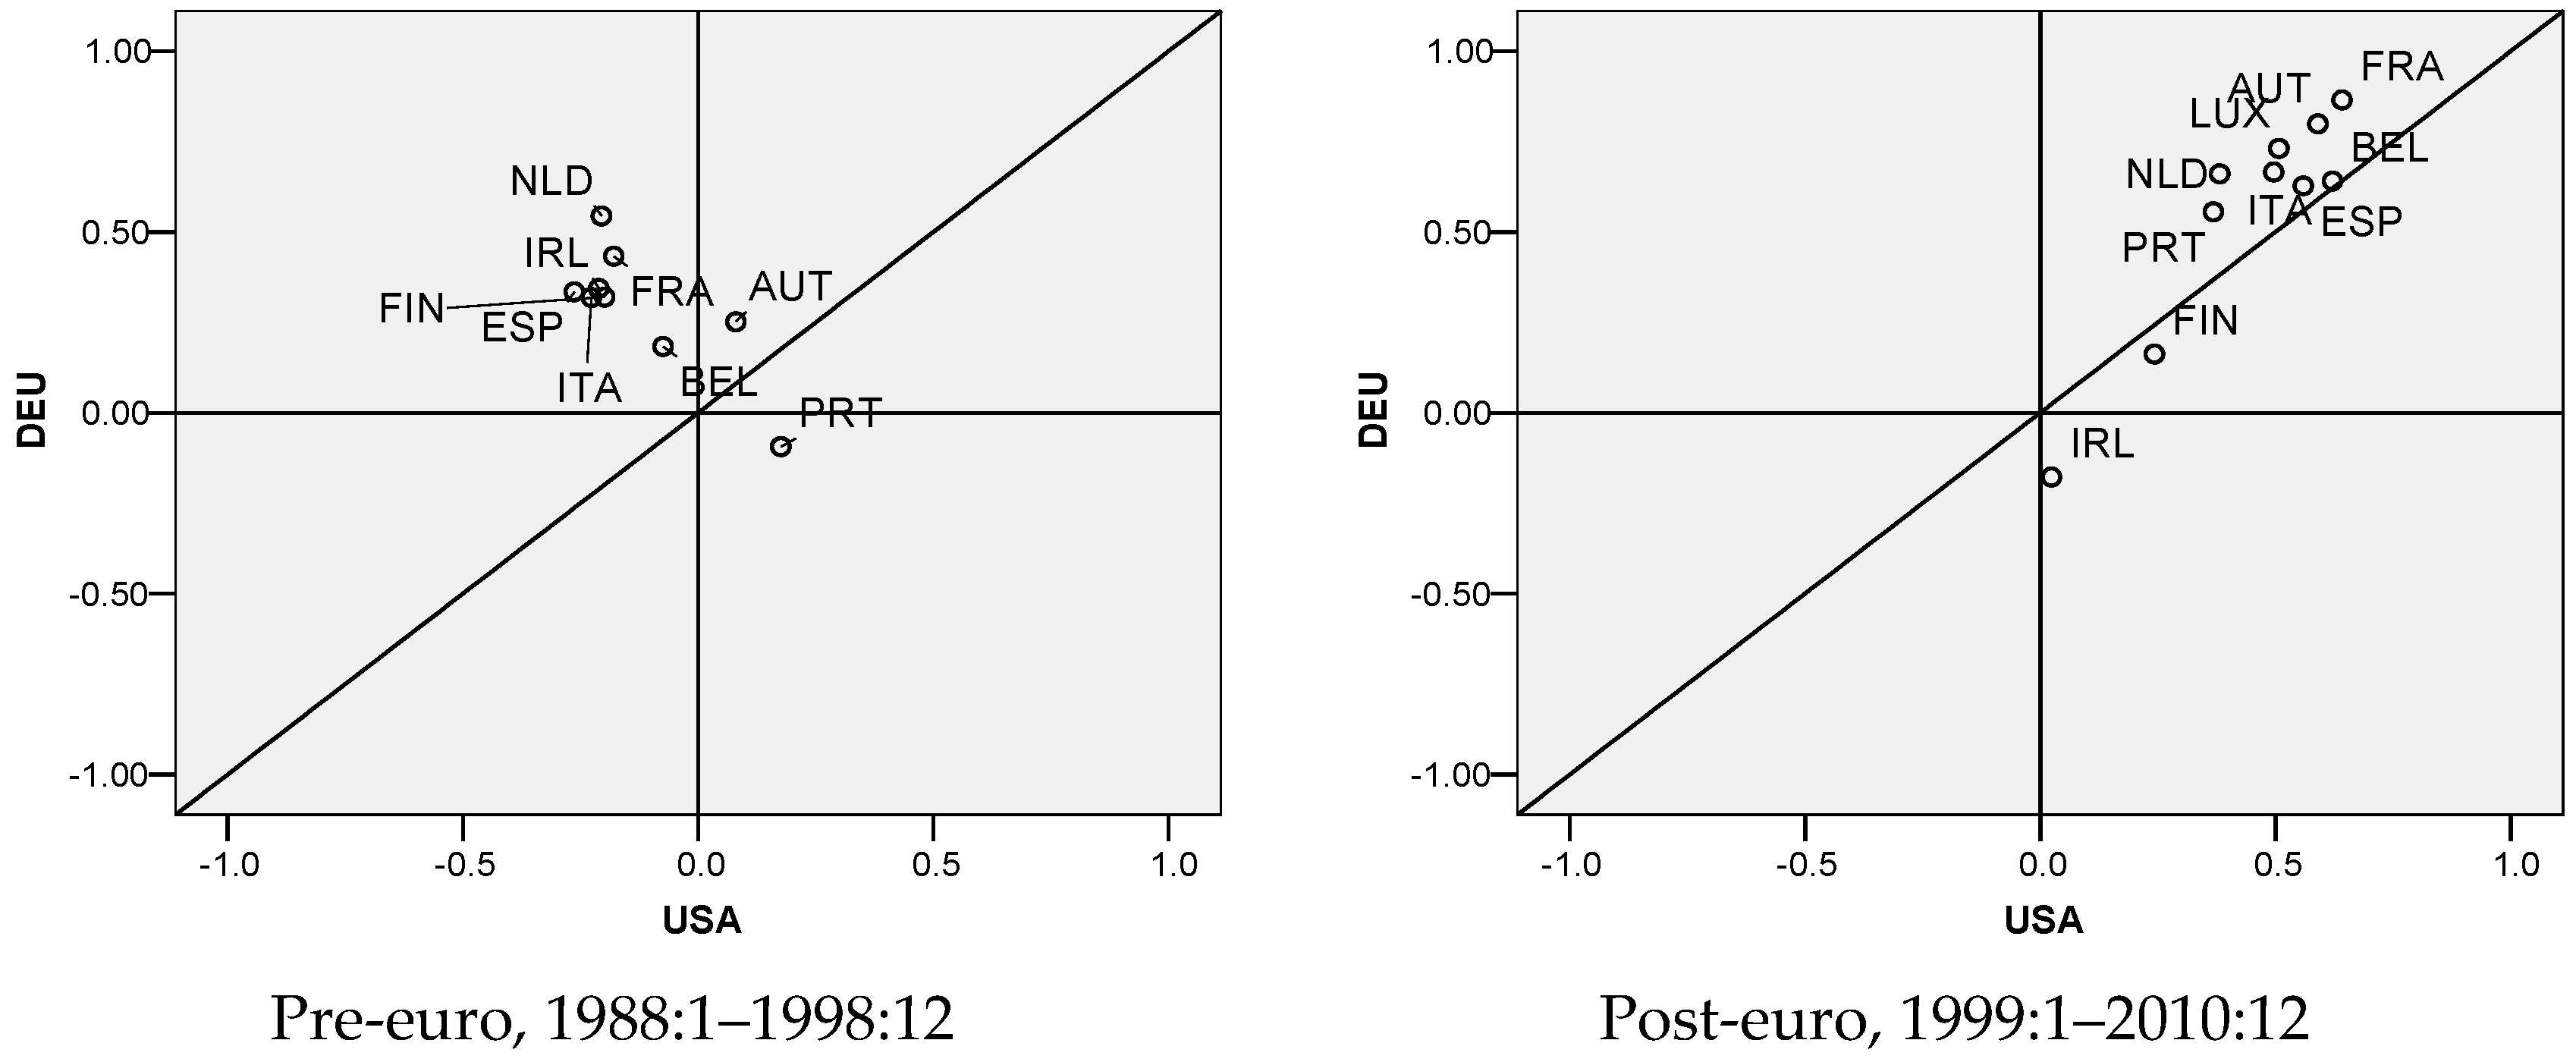
To compare the openness with Germany and with US amongst the countries, the trade intensity values with Germany and with US are plotted against each other as shown in
Figure 1 for pre- and post-euro periods. Countries located on the upper-left from the diagonal line are more intensely related to Germany, whereas those located on the lower-right are more closely linked with US. The first two plots pertain to trade in goods only while the third plot pertains to trade in goods and services whose data are available only for post-euro period.
For pre-euro period, Germany is obviously much more dominant than US as a trading partner. Specifically, located farthest away on the upper-left, Austria deals most intensely with Germany, whilst, uniquely, Ireland trades slightly more heavily with US than with Germany. For post-euro period, a similar picture can be seen. Luxembourg, whose data are available now, is the second largest trading partner to Germany after Austria. Peculiarly, Ireland deals even more strongly with US than with Germany. When services are also considered, similar arrangement is found, except only that there is a much clearer constellation of the majority and the more distinctive Austria and Ireland located off the pack.
Hitherto, it seems clear that as far as trade relations are concerned, Germany is predominant over US.
2.2. Business Cycle Synchronization
When business cycles across currency areas are highly synchronized, the role of flexible exchange rates as a shock absorber against transitory asymmetric pressures is less needed, and hence the stronger will be the case for unified monetary policies and exchange rates. In terms of measurement, it has become popular to implement this criterion according to synchronicity of business cycles by evaluating the correlation coefficients of cyclical component of output at business cycle frequencies, of which a correlation of 1 indicates complete synchronicity, whilst a correlation of 0 signifies complete asynchronicity. The method of Gerlach (1988) [
23] and Baxter and Stockman (1989) [
24] is adopted where cyclical components of industrial production index (IIP) series are detrended using Hodrick-Prescott (H-P) filter. To complement, the exercise is repeated using quarterly GDP volume to represent real production of the whole economy.
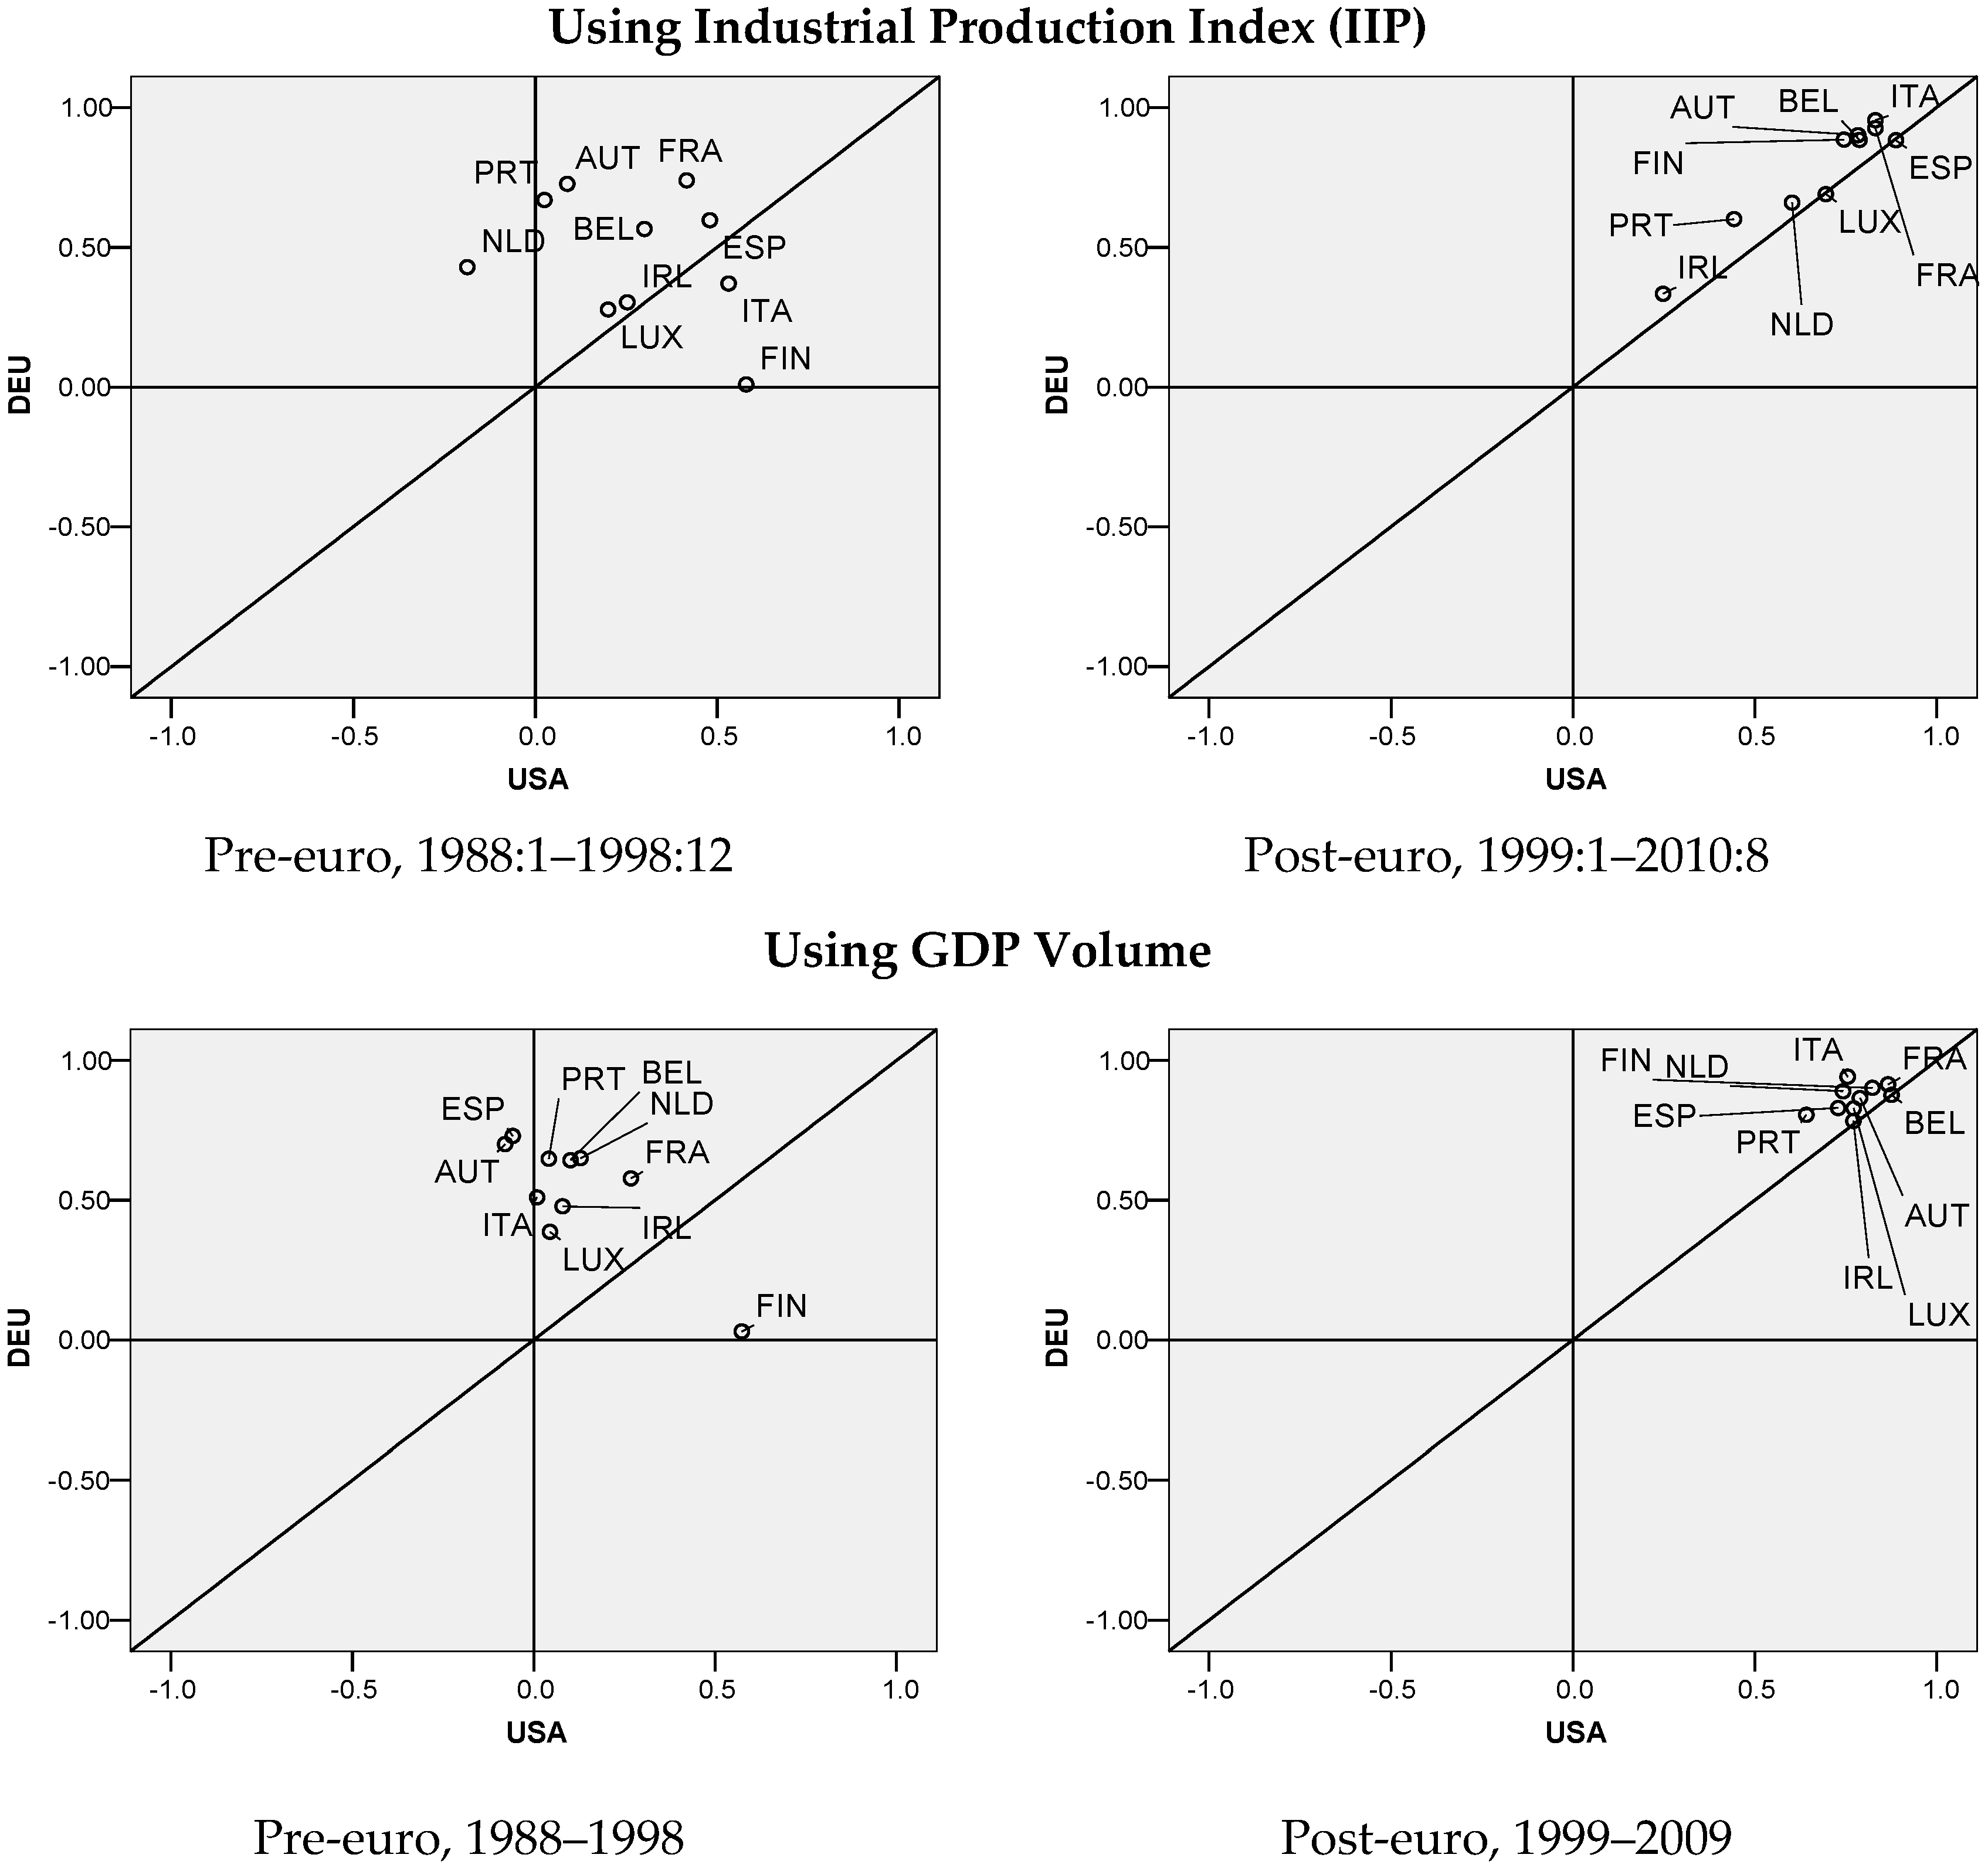
Figure 2 displays the scatterplots of which the vertical and horizontal axes depict the degrees of business cycle symmetry with Germany and with US respectively.
From the pre-euro findings using IIP, it is evident that synchronicity with Germany is predominant in which eight of the 10 states are much closer to Germany than to US, and a rather scattered configuration can be seen
4. A starkly different picture is seen for the post-euro period. Whilst symmetry with Germany still dominates, with most correlations around 0.8, this time however, symmetry with US is equally strong. There appears to be a concentrated cluster comprising of six countries highly closely related to Germany and to US, while Luxembourg, Netherlands, Portugal, and Ireland are to different extents distanced from that cluster.
Using GDP volume, for pre-euro period, once again symmetry with Germany overshadows that with US but this time to a much greater extent in which almost all are fairly synchronous with Germany but effectively asynchronous with US. It seems that when the production of the whole economy is taken into account, the states are much more parallel to Germany than when only production of manufactures is concerned. In addition, majority of the states are located closer to each other, signifying greater symmetry between them. As before, Finland is uniquely associated with US but unrelated with Germany. In the post-euro plot, the states have virtually converged, even more convergent than when IIP is used, exhibiting a slight tilt toward Germany. Portugal is still isolated but to a much smaller extent than that by IIP.
In summary, the euro members including Finland, which had been extremely idiosyncratic before euroization, have not only significantly converged with Germany but also with each other. Immediately, this seems to reinforce the role of Germany as the pivotal country for Eurozone but the fact that synchronicity with US has grown to be as great as Germany’s indeed implies a relative decline in the domination of Germany.
2.3. Real Exchange Rate Volatility
The level of a country’s need for real exchange rate changes is an important determining factor for joining a monetary union because real exchange rate changes are clearly measurable and automatically give the appropriate weights to the economic forces of which they are the result (Vaubel, 1978 [
25]). These economic forces pertain to inflation rates, openness, economy size, prices, wage flexibility, factor mobility, commodity diversification, goods market integration, and fiscal integration (Tavlas, 1993 [
26]). Hence, low real exchange rate volatility might indicate absence of asymmetric shocks and presence of business cycle conformity (Artis and Zhang, 1997 [
27]). We measure volatility in real exchange rates as the standard deviation of the log-difference of monthly real exchange rates where nominal exchange rates are deflated using relative consumer prices.
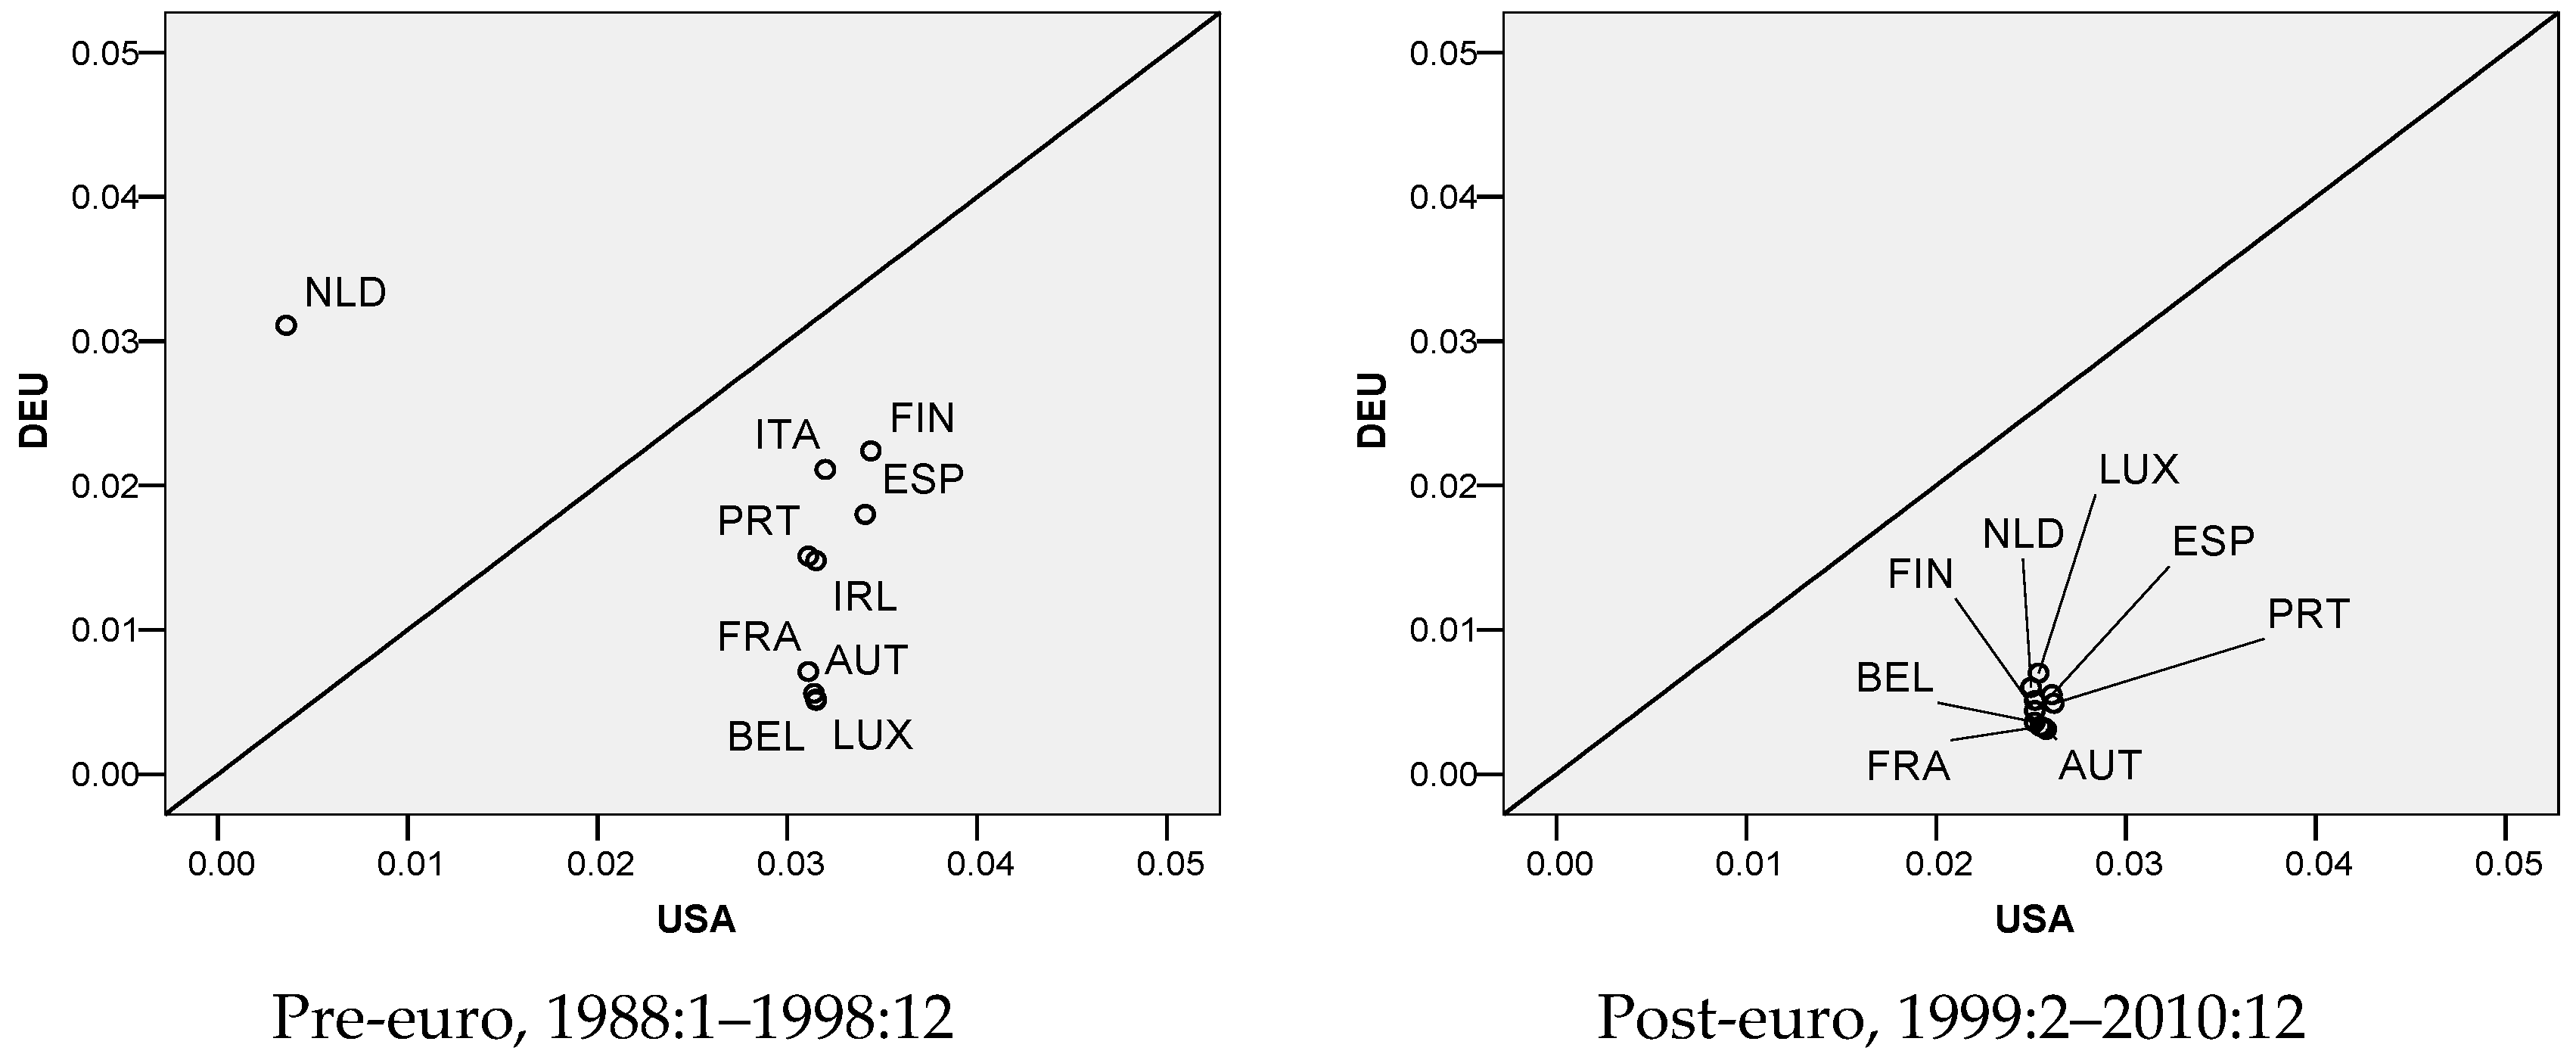
Figure 3 displays the plots where real exchange rate variabilities with Germany are plotted against those with US. There are about three clusters in the pre-euro setting. First is the Netherlands, which is uniquely a lot more variable against Germany than against US. Amongst those that are more variable with US, there seems to be a tight cluster consisting of France, Austria, Belgium, and Luxembourg, which is more stable against Germany, and a loose collection of Italy, Finland, Spain, Ireland, and Portugal.
For post-euro period, since their nominal exchange rates are unified, the variability of real exchange rates depends only on changes in relative price levels and since price levels are generally stable; the levels of variability are not only very small but also highly homogenous. While they are greatly stable against Germany, as should be the case, they are also somewhat more stable against US.
All told, the real exchange rates have not only converged and stabilized against Germany but also stabilized albeit in smaller degrees against US. Also noteworthy, the states have always been highly symmetrical against US compared to that against Germany, which is only attained in the post-euro period.
2.4. Inflation Convergence
According to Artis and Zhang (2001) [
20], the traditional OCA literature originated during the era of “fix-price” economics, so introducing inflation convergence as a criterion could be regarded simply as an appropriate normalization. The cost of joining a currency area is presumably low when inflation rates are similar because similar inflation rates result from similarities in monetary and fiscal policy stances and economic structure (Nguyen, 2007 [
28]). In addition, convergence in inflation also reflects similarity in trade union aggressiveness and labor costs between countries, implying lesser need for flexibility in nominal exchange rates in adjusting current account imbalances (Fleming, 1971 [
29]). For quantification, inflation differential,
where
and
are the rates of inflation in a euro state
and the reference country, respectively, is used. Greater differential indicates lesser convergence and
vice versa. The plots are presented in
Figure 4.
For pre-euro period, there are roughly three clusters of countries: the majority group comprising of Belgium, Ireland, France, Netherlands, Luxembourg, and Austria, which is more convergent with Germany; the smaller group of Italy, Spain, and Finland, which is more convergent with US; and Portugal, which is distinctively least convergent with Germany and with US and hence distanced from the pack. For post-euro period, the countries are obviously more symmetrical with each other and convergent with Germany but four countries are somewhat more parallel with US, namely Ireland, which maintains notably greater inflation divergence than the rest, Spain, Portugal, and Luxembourg.
To conclude, in terms of inflation convergence, a slim majority of the states are highly more convergent toward Germany and the rest are slightly more convergent with US.
2.5. Synchronization in Real Interest Rate
Though not formally listed as one traditional OCA criterion, this factor is indicated by a “revealed preference” argument (Artis and Zhang, 2001 [
20]). If the monetary policy of a candidate country historically has differed little from that of the reference country, the cost of relinquishing monetary independence should be accordingly low, so that synchronization in real interest rates may be interpreted as an indicator of coordination in monetary policy. To operationalize this dimension, money market rates and CPI inflation are used to compute real interest rates and as demonstrated by Artis and Zhang (2001 [
20], 2002 [
21]), detrending of the series is accomplished by applying H-P filter. Correlation coefficients are computed from the detrended series to quantify interest rate cycle symmetry with Germany and with US.
Figure 5 shows the scatterplots. For pre-euro period, it is apparent that virtually all states are quite synchronous with Germany but asynchronous with US. Austria and Portugal are fairly unique because Austria is relatively convergent with both Germany and US, whilst Portugal is a little parallel with US but virtually unrelated with Germany.
In the post-euro period, virtually all states have increased their degrees of symmetry with Germany, maintaining correlations of 0.5 and above, but symmetries with US are comparably high too. Distinctively Finland and Ireland are distanced away. Finland is somewhat related to both US and Germany with a slight tilt toward US while Ireland is practically not associated with any of them.
In a nutshell, in respect of real interest rate synchronicity, from virtually no associations at all, synchronicities with US have grown to be as nearly as substantial as those with Germany. In the meantime, whilst the rest have congregated with each other, Finland and Ireland have diverged considerably from the pack.
3. Performance Evaluation
The preceding section has looked into some OCA-related convergence criteria, comparing the relations of the states with Germany and with US. This section in turn inspects some common economic performance measures pertinent to national objectives, namely real growth, inflation, trade balances with Germany and with euro area, and unemployment. For each, we will examine the average level over period calculated by simple mean and its variability over period measured by standard deviation for pre- and post-euro periods.
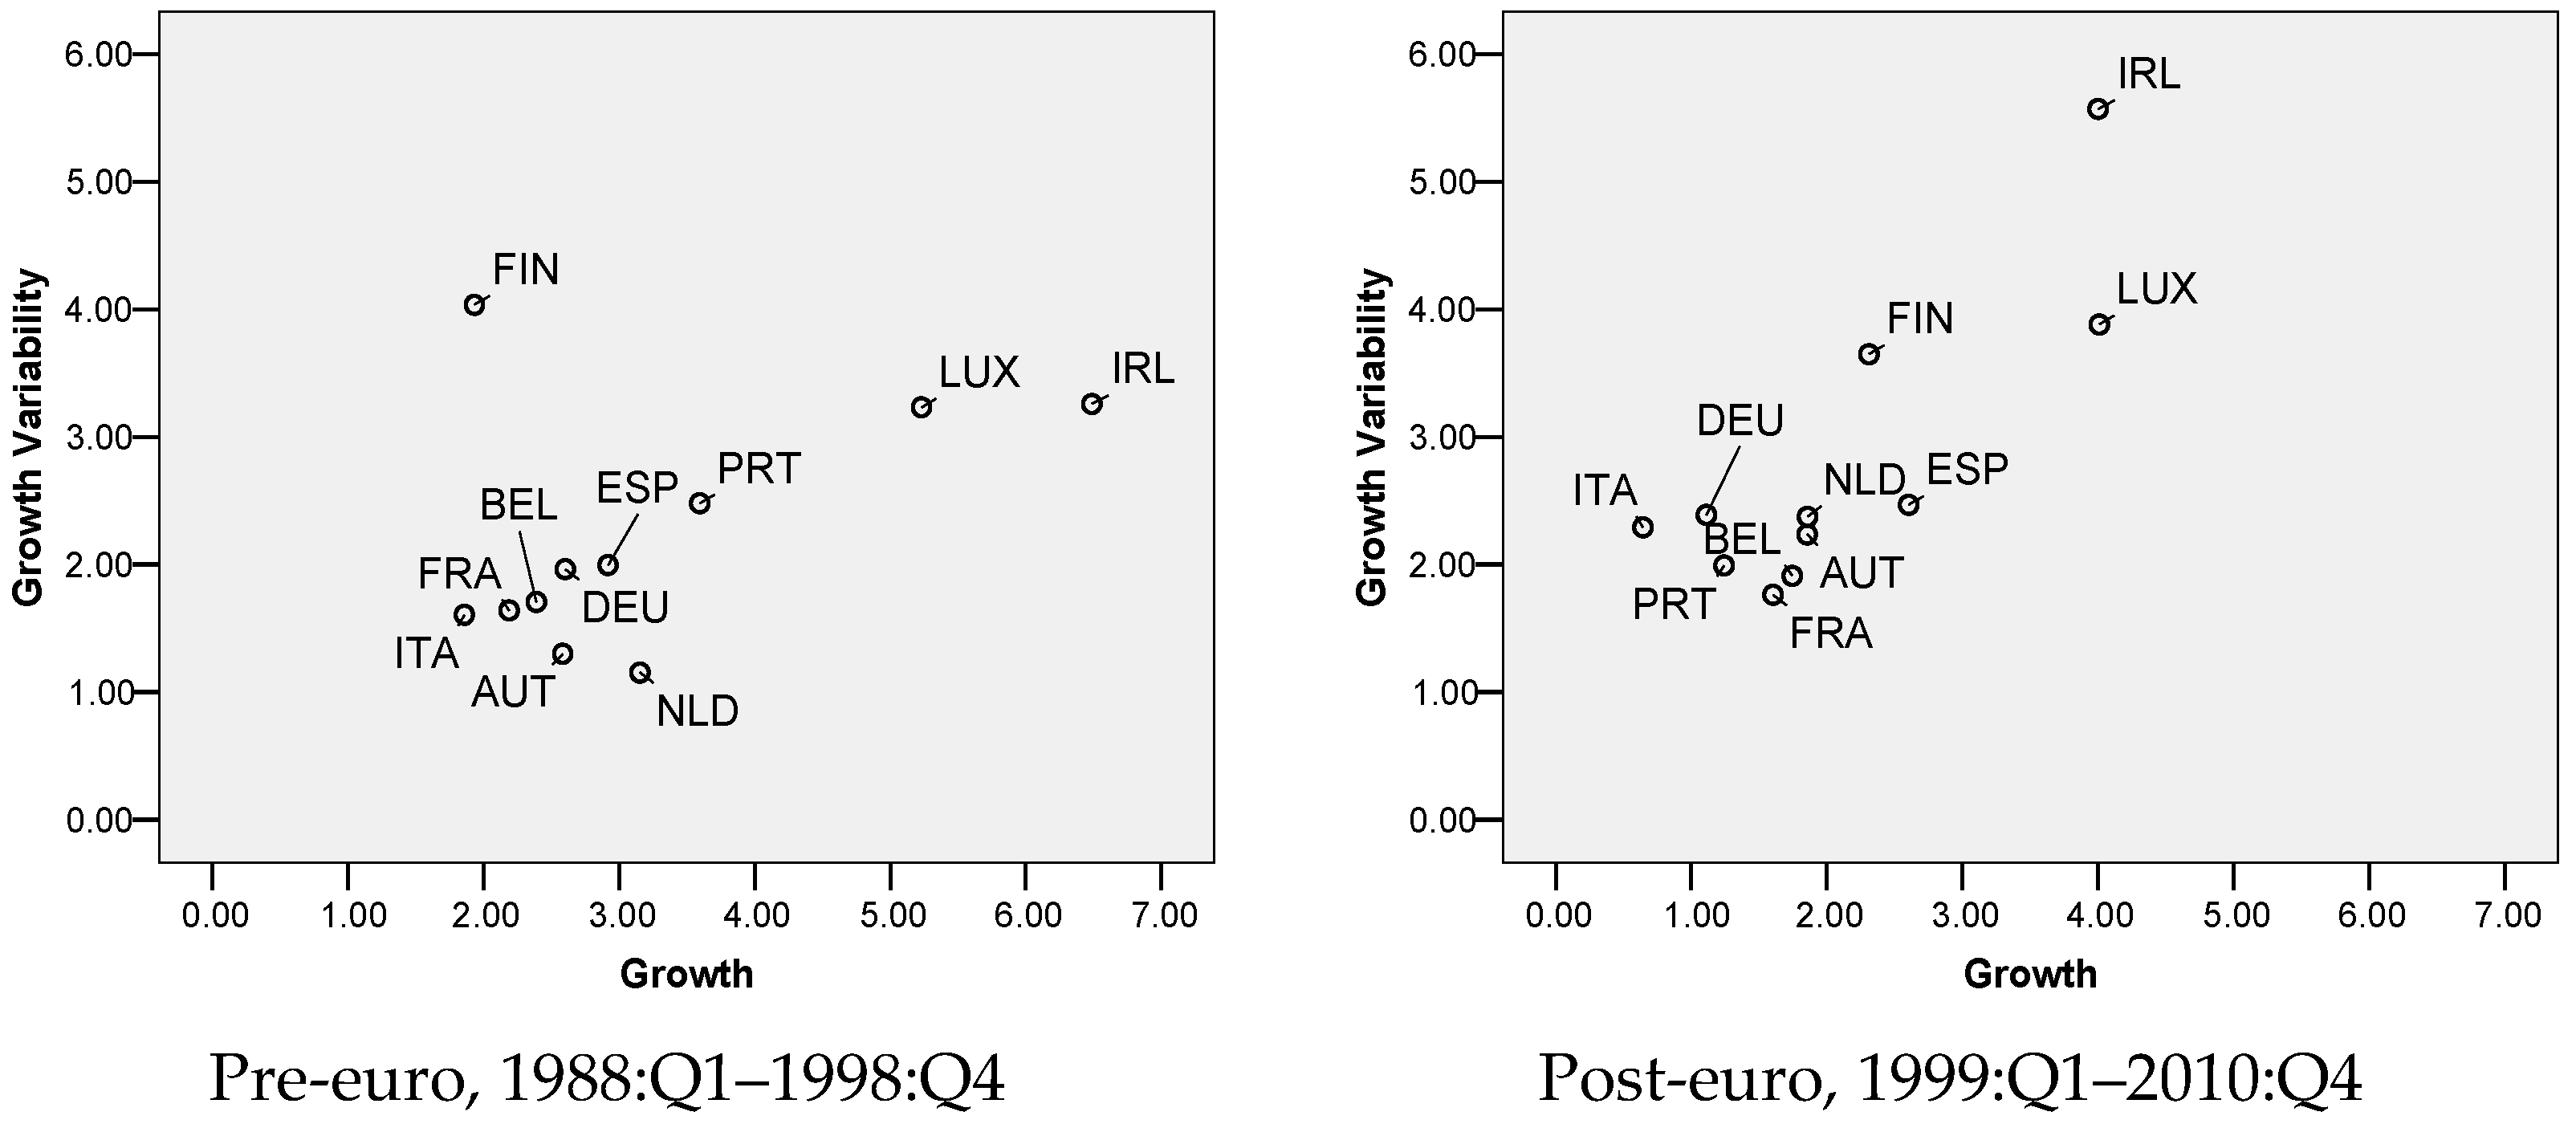
Figure 6 plots the real growth against its variability. Growth is calculated as percentage change of real GDP from the same quarter of previous year. In the pre-euro setting, it is obvious that Portugal, Luxembourg, and Ireland are rather distanced from the rest, exhibiting much greater levels of growth and variability. Quite differently, Finland is also quite separated from the pack but it displays growth as high as the majority but substantially greater variability. In the post-euro configuration, generally lower growth, about 1%–2% on average compared to 2%–3% previously, and greater variability, about 1.5–2.5 SD on average from previously 1–2 SD can be seen. Finland, Luxembourg, and Ireland are visibly still divergent from the rest, showing greater degrees of growth and variability.
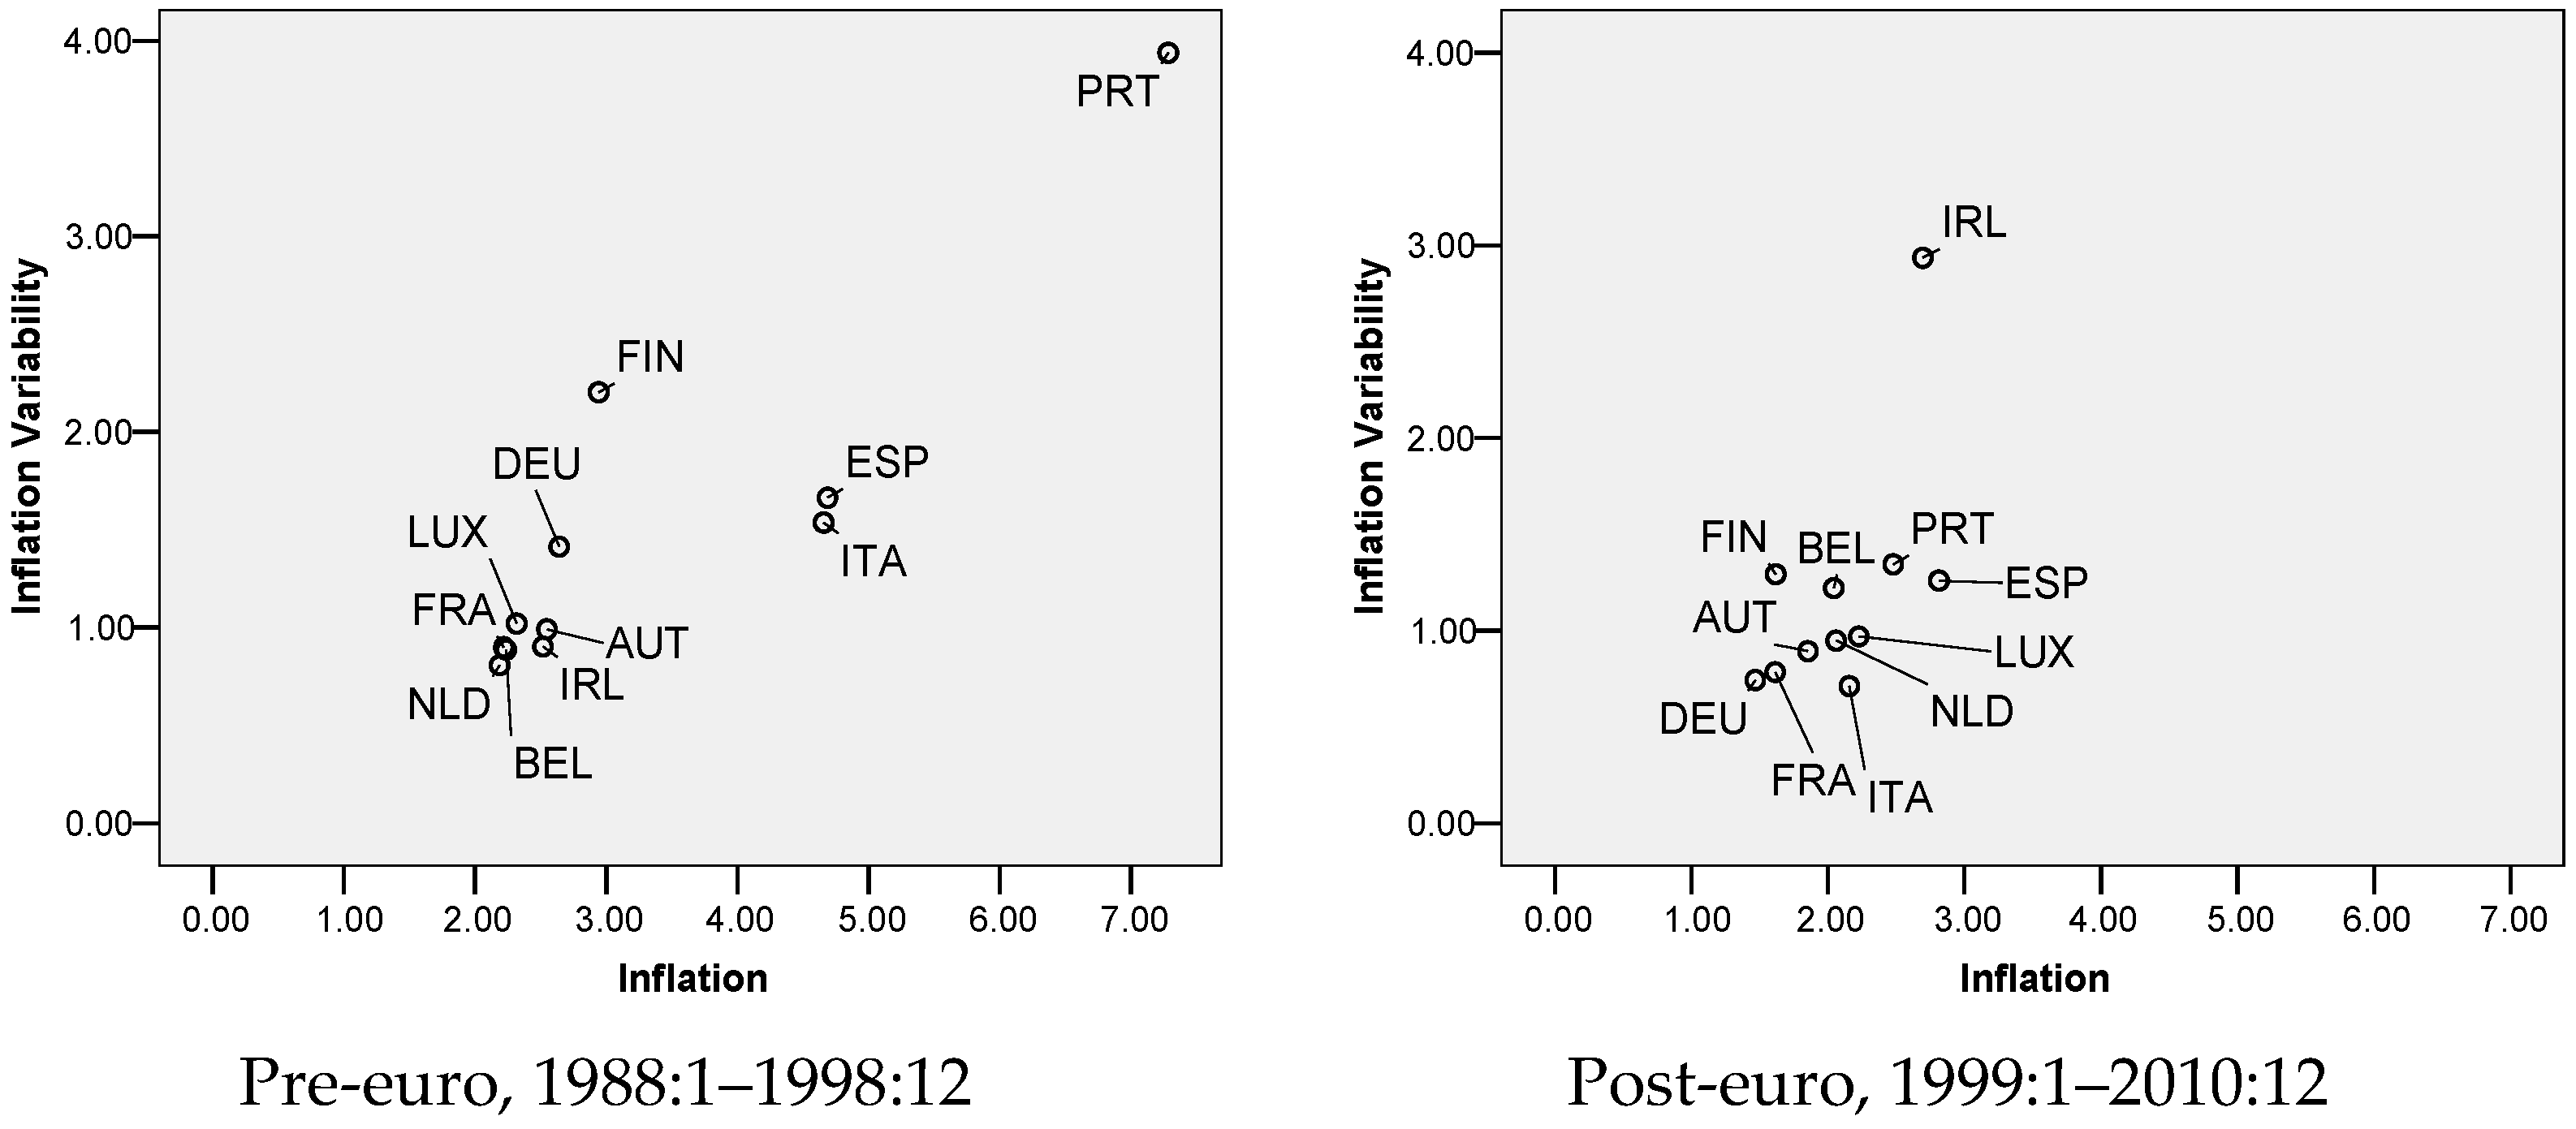
Figure 7 plots the inflation against its variability. Inflation is computed as percent change of CPI from the same month of previous year. For pre-euro period, Portugal, Spain, Italy, and Finland are remarkably distanced from the rest. They maintain greater inflation and variability. In the post-euro period, quite the opposite, the countries are significantly more convergent and show slightly lower inflation, around 1.5%–2.5% on average from previously 2%–2.5%. Only Ireland is idiosyncratic, with high inflation and exceptional variability.
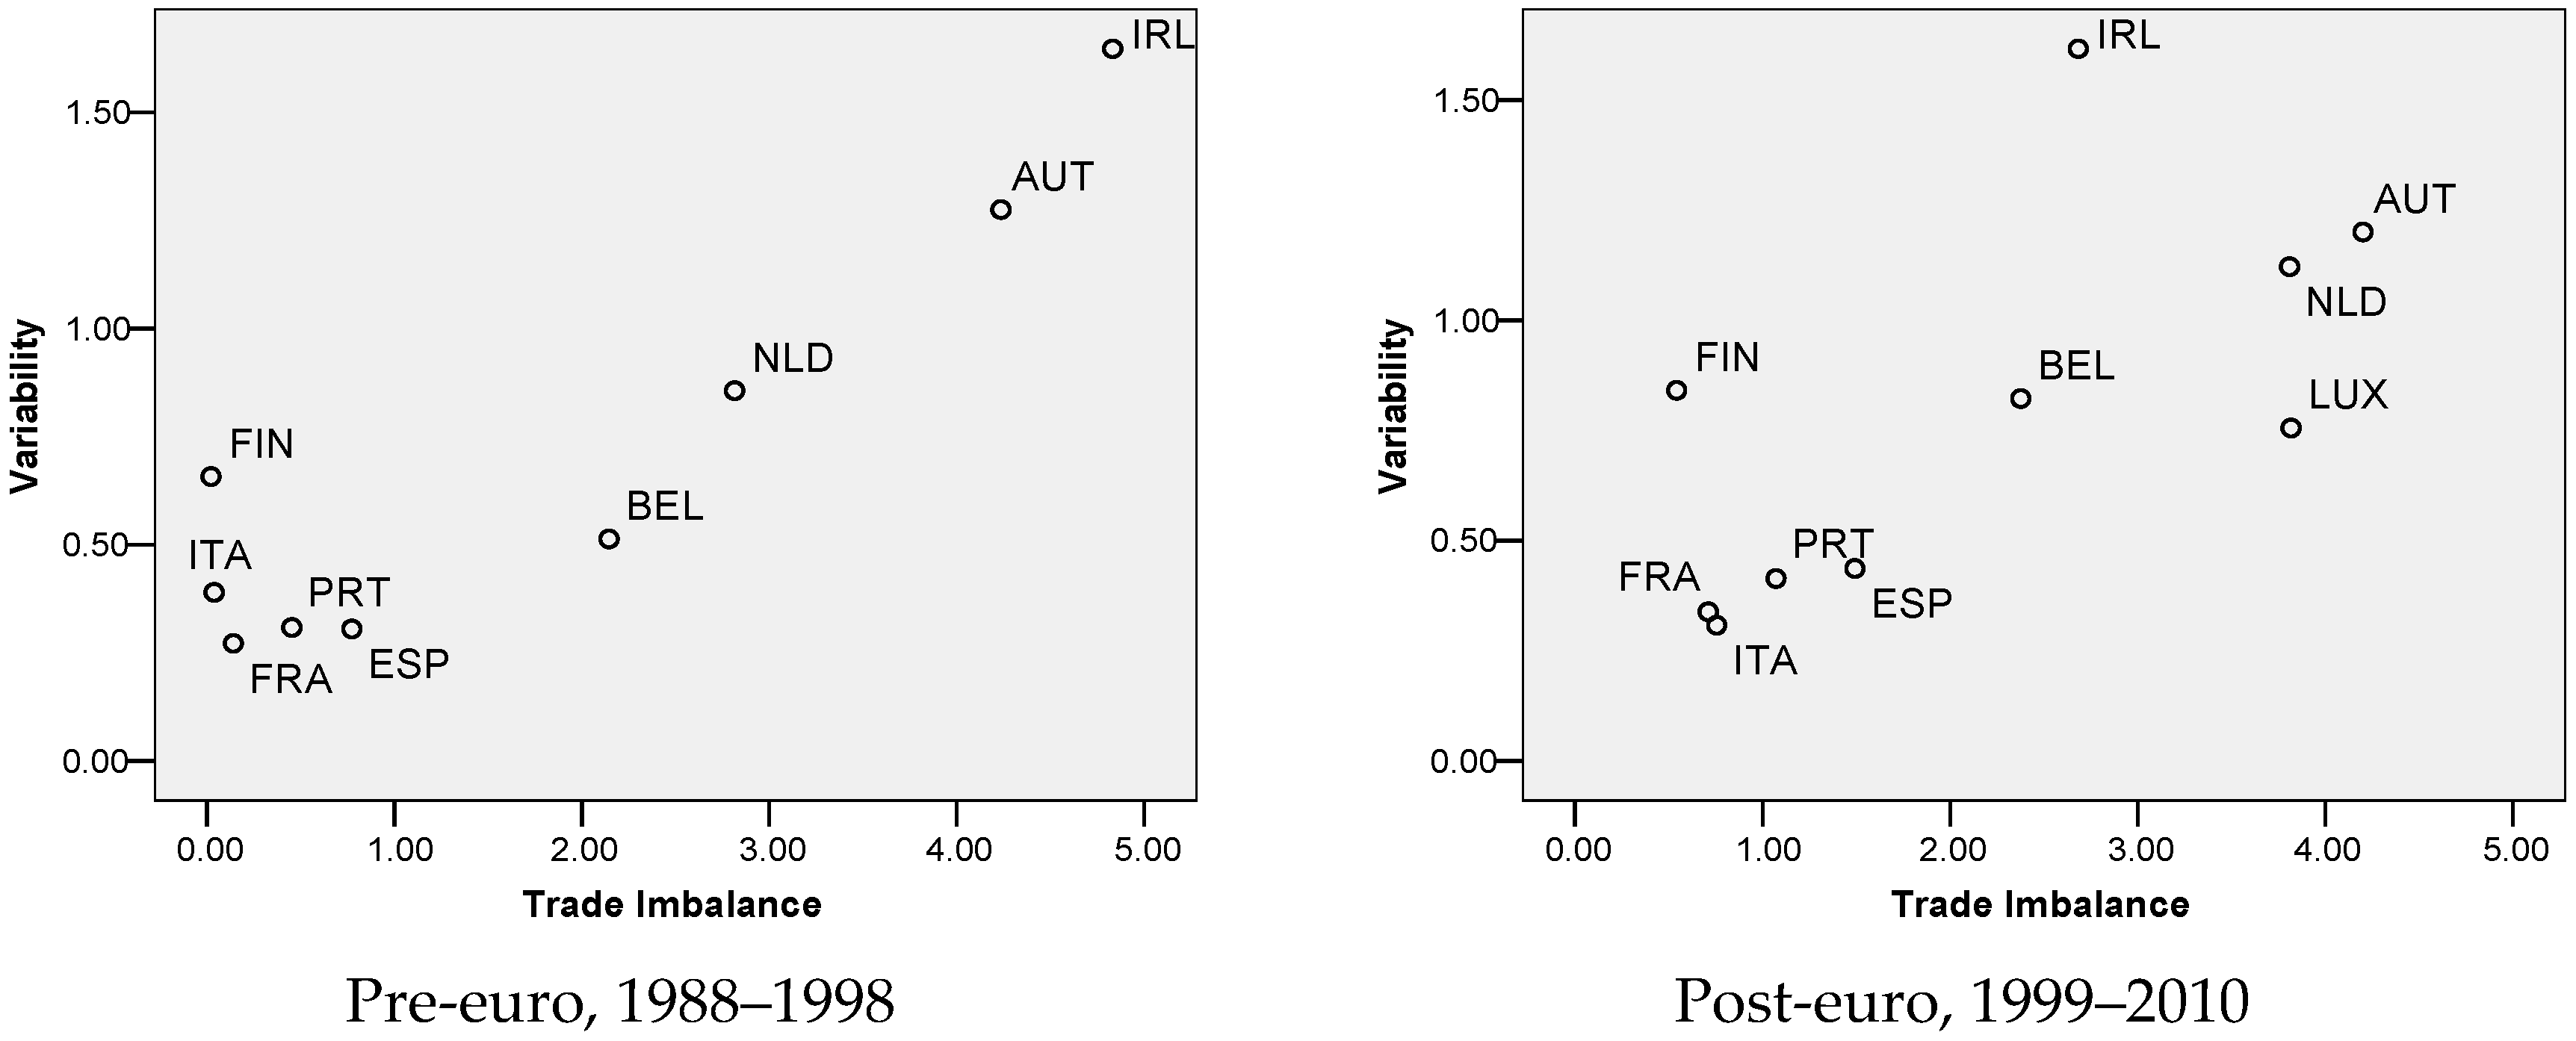
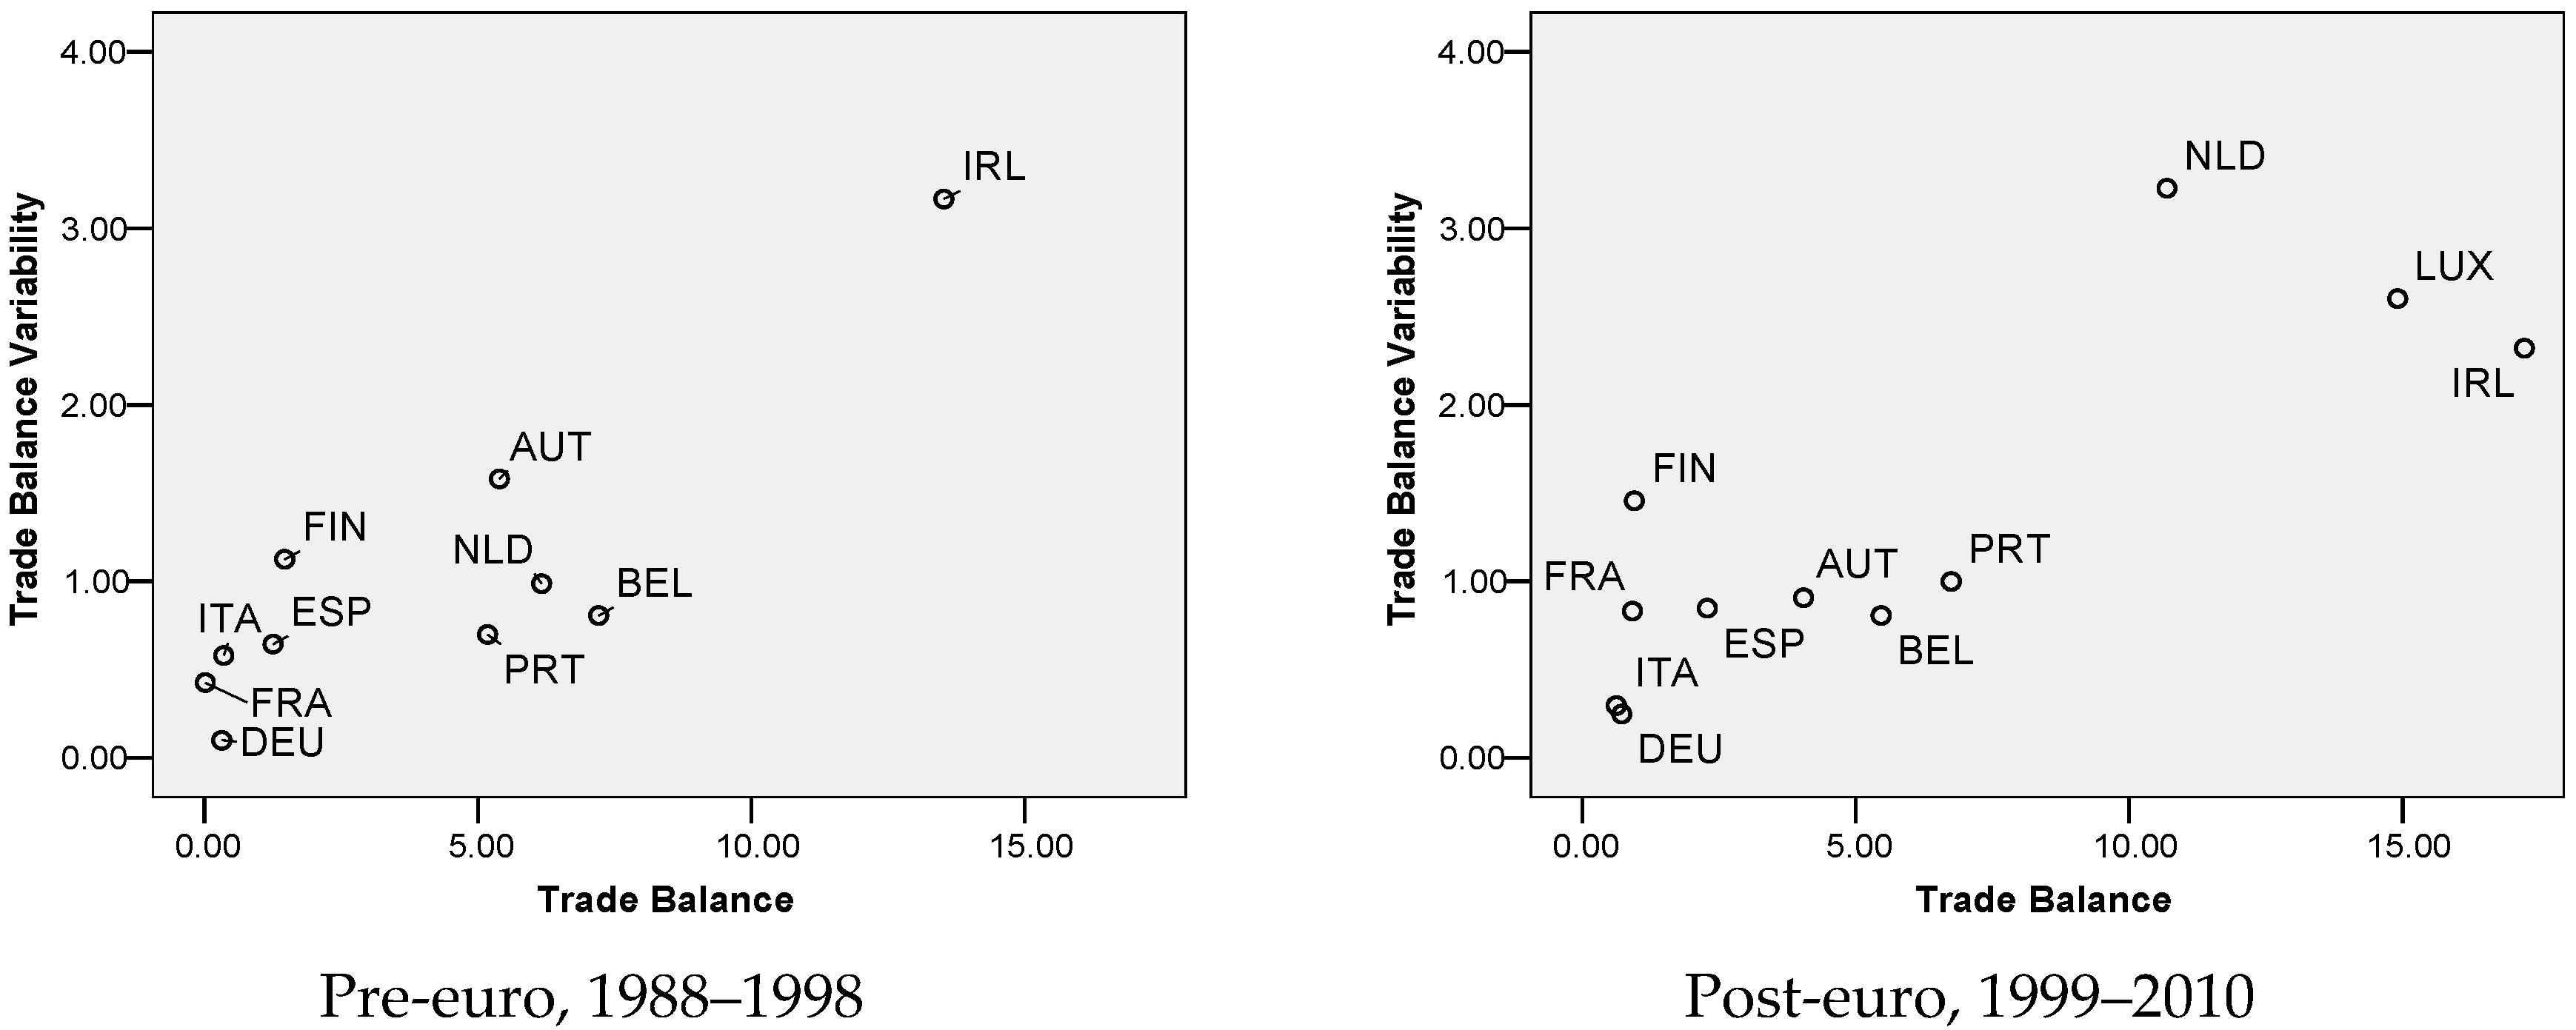
Figure 8 plots the trade balances with Germany against its variability. Movements in real exchange rates are said to be able to reduce trade imbalances between surplus and deficit countries. Since euroization, given that nominal exchange rates are unified, relative price levels would have to adjust to correct trade imbalances, and to see if reduction in trade imbalances has been achieved, trade balances in goods with Germany, in percent of GDP are examined. Since the magnitude is of concern, absolute values of the ratios are used of which the greater the values the larger the trade imbalances. For pre-euro period, it is obvious that Belgium, the Netherlands, Austria, and Ireland are distinguished, exhibiting higher levels of trade imbalance and variability. For post-euro period, whilst a similar pattern can be seen, there seems to be greater imbalance and variability on the whole. Luxembourg whose data are available now demonstrates high imbalance and moderate variability.
Figure 9 shows the trade balances with euro area findings. Broadly, compared to that with Germany, as indicated by the larger scales on the axes, there appears to be greater imbalance and variability in general. For pre-euro period, Ireland is exceptionally unique, exhibiting the highest imbalance and variability. For post-euro period, while the general configuration is similar, in addition to Ireland, Luxembourg and Netherlands too are distinctive from the rest, showing larger imbalances and variabilities.
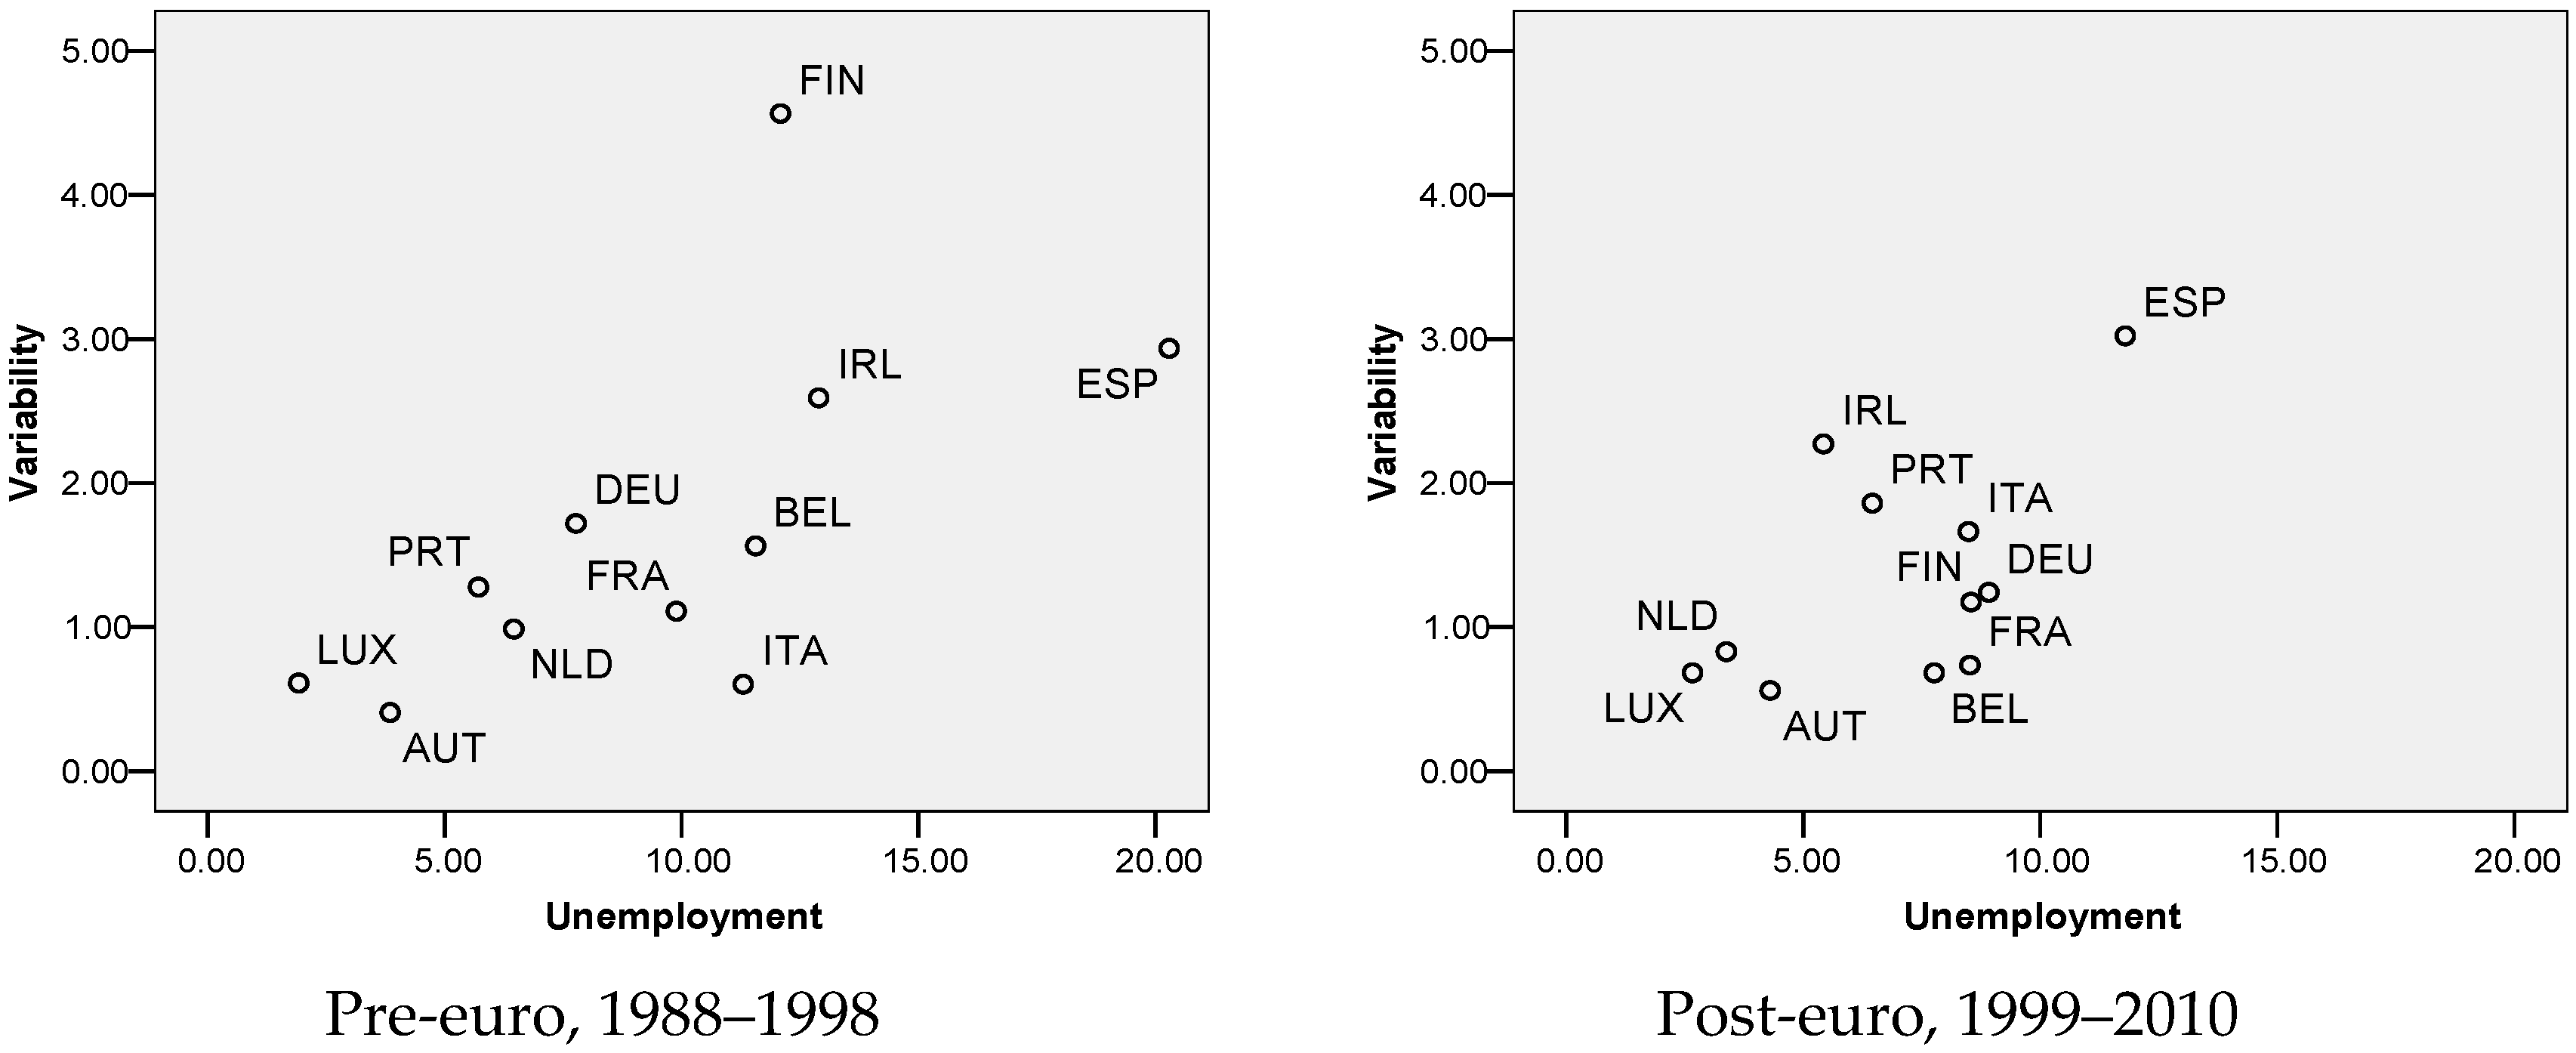
Figure 10 presents the unemployment findings. For pre-euro period, Finland, Ireland, and Spain are quite separated from the pack, showing higher unemployment rates and variabilities. For the post-euro period, the unemployment levels are on the whole lower and closer to each other, on average around 2.5%–10% from previously 2.5%–15%. Besides, roughly three distinct clusters can be seen in this period and amongst the clusters, there are Spain, which stands out as in the pre-euro period, and the low unemployment cluster of Luxembourg, Netherlands, and Austria.
To summarize, based on the assessment above, it appears that only inflation and unemployment have been better in which the levels and variabilities have somewhat decreased, and at the same time there is greater convergence between the countries.
4. A Statistical Analysis
In preceding discussions, we have graphically explored the OCA and economic performance dimensions, inspecting the configurations before and after euroization. In this section, we shall look at a commonly used nonparametric technique called Wilcoxon Signed Ranks Test to ascertain if the changes over the periods are significant statistically
5. The test is a non-parametric statistical hypothesis test for the case of repeated measurements on a single sample, for example, before and after data, in which case it tests for a median difference of zero (e.g., see Wilcoxon, 1945 [
30]). It can be used as an alternative to the paired Student's t-test when the population cannot be assumed to be normally distributed. Though no inferences about the population are involved in our case, the test can nevertheless indicate if the changes in the variables are “significant”.
Table 1 displays the results. To illustrate the interpretation, take for instance trade openness with US, there are five cases with negative differences whose absolute values are ranked among all differences with a mean rank of 4.2 and sum of ranks of 21. The other cases have positive differences, whose ranks sum to 24 with mean rank 6.0. The mean rank values suggest that the magnitude of the increases is larger than that of the decreases.
The sums of ranks are used to compute the Z-score, a standardized measure of the distance between the rank sum of the negative group and its expected value, 22.5, half the sum of all ranks. The two-tailed asymptotic significance estimates the probability of obtaining a Z statistic that is as extreme or more extreme in absolute value as the one displayed, if there truly is no difference between the group ranks. In this case, since the observed probability level of 0.859 is not significant, trade openness with US does not change significantly from pre- to post-euro period.
Along this line of interpretation, on the real convergence aspects, there has been a significant reduction in trade intensity with Germany; increase in business cycle synchronicity with Germany and with US, in both IIP and GDP terms; decrease in real exchange rate volatility with Germany; and rise in interest rate symmetry with US. These results corroborate the earlier findings, which suggest a rise in the role of US in relation to Germany in business cycle and interest rate synchronicities of the states.
On economic performance, there are significant decrease in level of growth and increase in variability of growth. On the positive side, inflation and unemployment have fallen significantly. The near significant increase in trade imbalance with Germany and its variability is also worth mentioning
6.
5. Conclusions
The first part of analysis attempts to find out in respect of the convergence criteria, if the states have converged more with Germany or with US and if they have been more parallel to each other. From the plots, we have noticed a remarkable convergence with Germany and between the states in terms of business cycle symmetry, real exchange rate volatility, and inflation convergence. Nonetheless, there has been a relative divergence from Germany or relative convergence toward US most noticeably in the business cycle and interest rate synchronicities. In addition, based on the significance test, while there is a significant decrease in real exchange rate volatility with Germany, which is not surprising, there has also been a significant reduction in trade intensity with the core state.
Specifically, Ireland has markedly increased its divergence from Germany and from the rest of euro states in respect of trade relation. Besides, it has also diverged considerably from others in the business cycle measured by IIP, inflation, and interest rate criteria. The latter divergences of Ireland with Germany can be explained by closer trade relations in goods and services, including financial services, with the US. In addition, Ireland is regarded as market-based country, while other countries in the euro area are seen as bank-based economies. Meanwhile, Portugal has visibly deviated from the rest in business cycle symmetry by IIP and GDP, whereas Finland has noticeably distanced from others in interest rate synchronization. Findings here do corroborate that of Andrade and Duarte (2015) [
31] that conclude that a process of real divergence and nominal convergence does exist in the European integration, and that suggest that this is a source of genuine imbalance that can destroy the harmonious development of the European Monetary Union.
Certainly, various regional and global forces come into play and undoubtedly much of the divergence can be explained by the extraordinary swings in the US business cycles in the first decade of the 21st century; but then again, it nonetheless demonstrates the still substantial vulnerability or even an increase in the degree of vulnerability, of the euro participants to shocks originated from abroad, in this case the US. Along these lines, this discovery poses an important question to policymakers, that is, amongst all the challenges faced within Eurozone, is Germany still as fitting to serve as the de facto monetary anchor country for the euro founders?
The second part of analysis on economic performance intends to see if there is any improvement in the economic well-being of the states and to identify if any member has been distinctive from others. By and large, inflation and unemployment have respectively reduced and converged between the states whereas real growth, trade balance with Germany, and trade balance with euro area have respectively deteriorated and been more variable.
These specific findings may be worth mentioning. Ireland has always been remarkably divergent from others in growth-and-variability and trade-balance-with-Germany-and-variability. It has also deviated somewhat in inflation variability and trade balance with euro area. Meantime, Luxembourg has always been quite divergent in growth-and-variability and for the post-euro period markedly divergent in trade-balance-with-euro-area-and-variability. Finland has always been fairly divergent in growth variability and Spain has increased its divergence in unemployment-and-variability.
In another aspect, it appears that the extent of endogeneity of convergence with Germany and with each other depends on the dimension being looked at. In particular, whilst the cross-country study by Frankel and Rose (1998) [
4] suggested that trade and business cycle symmetry are highly correlated, the cross-period analysis shown here does not seem to suggest that.
In conclusion, while it is far from conclusive that lack of conformity in the convergence criteria can be associated with divergences in the economic performance variables, it nevertheless can be seen that Ireland, probably the most distressed euro member today, has shown considerably serious divergences in both the convergence and the performance dimensions. In one way or another, states such as Finland, Portugal, and Spain have also become fairly idiosyncratic. Differences between individual states as found here are not unusual as they could be manifestation of fundamental differences in the composition of languages, cultures, natural endowments, and preferences and the resulting political economy within each state (e.g., see Furruter, 2012 [
32]). This lack of homogeneity could of course pose significant hindrances to coordination of economic policies across the member states, which is so warranted in times of distress. It is hoped that the specific divergences detected in this paper could be another piece of reference for the EMU authorities.


