Article

Nexus Between Artificial Intelligence, Renewable Energy, and Economic Development: A Multi-Method Approach

by
Laura Vasilescu
,
Mirela Sichigea
,
Cătălina Sitnikov
and
Laurențiu-Stelian Mihai
*
Faculty of Economics and Business Administration, University of Craiova, 200585 Craiova, Romania
*
Author to whom correspondence should be addressed.
Economies 2025, 13(9), 271; https://doi.org/10.3390/economies13090271
Submission received: 30 June 2025 / Revised: 2 September 2025 / Accepted: 3 September 2025 / Published: 11 September 2025
(This article belongs to the Special Issue Artificial Intelligence Technologies and Economic Development)

Abstract

Artificial intelligence (AI) is a key driver of the energy transition and sustainable economic development. However, the specific mechanisms through which AI adoption impacts renewable energy production versus consumption remain poorly understood. This study addresses this research gap by empirically analyzing how three AI dimensions (investments, readiness, and projects) differently influenced renewable energy production and consumption across 30 countries (EU-27, USA, China, and UK) during 2020–2023. Additionally, the AI–energy transition nexus is analyzed in relation to economic development (GDP per capita) and carbon emissions (CO2). Employing robust regression, Gaussian graphical modeling, and cluster analysis, the study provides robust multidimensional validation. Empirical findings reveal that AI investments predominantly stimulate renewable energy production, while AI readiness and institutional ecosystems primarily drive renewable energy consumption. The following two country clusters emerge: advanced economies (USA, China, Germany, UK, and France) characterized by higher AI readiness and superior green-energy integration, and developing economies with significant catch-up potential. The study demonstrates AI’s dual role as both direct determinant and systemic mediator in the energy transition. Moreover, CO2 emissions show an asymmetric role, being positively correlated with renewable energy production but negatively linked with renewable energy consumption. These insights highlight the need for targeted policies that bridge economic and technological divides, thereby accelerating the renewable energy transition and enriching academic debates on technology-driven sustainability.

1. Introduction

The transition to a sustainable energy system represents a major challenge for global economies, requiring the integration of advanced technologies and efficient use of renewable resources. Energy generation from clean sources has evolved from being a solution to the climate crisis to becoming a criterion for global competitiveness, with direct effects on the level of economic development, energy security, and environmental sustainability (EP, 2024).
The energy sector is at a critical turning point, shifting from fossil-based exploitation toward a data-driven, technology-intensive industry (Ahmad et al., 2021). The adoption of renewable energy is strongly associated with reductions in carbon emissions (Mirziyoyeva & Salahodjaev, 2023). At the same time, economic capacity influences policy adoption, as countries with a higher GDP per capita tend to implement more sustainable energy policies (Caldera et al., 2024).
Artificial intelligence represents a paradigm shift for energy systems, offering advanced solutions for market forecasting, risk management, and operations optimization, according to the recently adopted European AI Act (European Union, 2024). Also, artificial intelligence plays an essential role in achieving the United Nations Sustainable Development Goals (UN, 2015a), offering innovative solutions in various fields. But the results of studies are not convergent, indicating both positive and negative effects on sustainable development (Nasir et al., 2023; Lampropoulos et al., 2024; Singh et al., 2024). Although the use of AI involves some challenges, the benefits often outweigh the risks, making this technology an indispensable tool for modern traders. National governments and private investors increasingly view AI-based solutions as key instruments for enhancing energy efficiency (Bennagi et al., 2024). Therefore, the rapid development of artificial intelligence must be supported by the necessary information and regulatory oversight for AI-based technologies to enable sustainable development (Vinuesa et al., 2020).
Empirical evidence suggests that AI can accelerate the energy transition (Q. Zhao et al., 2024). Specifically, studies highlight its ability to improve the efficiency of smart grids (Rashid et al., 2024), enhance demand forecasting (Biswas et al., 2024), and facilitate renewable-energy integration (Bennagi et al., 2024). The role of artificial intelligence in the energy sector is multifaceted, encompassing technological, operational, and policy dimensions. AI facilitates the integration of renewable sources by improving forecasting, optimizing storage, and balancing supply and demand within energy systems (Oukaira et al., 2024; Rusilowati et al., 2024; Q. Wang et al., 2025b). Additionally, AI enhances energy efficiency across buildings, transport, and industry through predictive analytics, automation, and smart management solutions, thereby reducing losses and optimizing consumption (Olatunde et al., 2024; Menai et al., 2024). Furthermore, AI strengthens the management and security of smart grids, enabling anomaly detection, congestion control, and protection against cyber threats (Noorman et al., 2023). Finally, AI supports the development of sustainable-energy policies by analyzing large datasets, promoting green technologies, and proposing optimal pathways to reduce carbon emissions and improve energy management (Danish & Senjyu, 2023; Q. Wang et al., 2024, 2025b).
Despite growing research interest in AI-energy applications, three critical gaps persist in the current understanding that limit both theoretical advancement and practical policy formulation. First, existing studies predominantly employ single-method approaches (Q. Zhao et al., 2024; Mirziyoyeva & Salahodjaev, 2023; Caldera et al., 2024), which cannot capture the multifaceted relationships between AI dimensions and energy outcomes, potentially leading to incomplete or misleading conclusions about causality and mediation effects. Second, most research (Bennagi et al., 2024; Chishti et al., 2024; Q. Wang et al., 2024) treats AI as a monolithic factor, obscuring how different AI components—investments, institutional readiness, and project implementation—may influence distinct aspects of energy transition through differentiated pathways. Third, limited cross-national comparative analysis exists (Ahmad et al., 2021; Nasir et al., 2023) regarding how AI adoption patterns vary across different economic and institutional contexts, particularly in differentiating production versus consumption impacts, which restricts the generalizability of findings and policy recommendations.
These research gaps highlight the need for a comprehensive analytical framework that can disentangle the complex, differentiated pathways through which AI influences energy-transition components. Such an understanding is crucial for designing evidence-based policies that leverage AI’s potential while accounting for varying national capacities and institutional contexts, especially given the current economic uncertainties and geopolitical tensions affecting technology transfer and international cooperation.
To address these gaps, the scientific objective of this research is to empirically examine the differentiated pathways through which three distinct AI dimensions (investments, readiness, and projects) influence renewable energy production versus consumption across 30 countries. To achieve this objective and test the formulated hypotheses (H1, H2, and H3), we employ a triangulated methodological approach that mitigates individual analytical biases while generating comprehensive insights about both direct effects and systemic mediations (indirect influences).
This research provides four distinct contributions that advance both theoretical understanding and methodological rigor. Conceptually, it differentiates the impact of AI on renewable energy production versus consumption while also considering the mediating roles of GDP per capita and CO2 emissions—a distinction that has been largely overlooked in previous studies despite its critical importance for policy design. Methodologically, it employs a complementary multi-method design combining robust regression, Gaussian graphical modeling, and cluster analysis to provide comprehensive validation and uncover hidden interdependencies that single-method approaches cannot detect. Empirically, it offers a cross-country analysis of 30 major economies (27 EU Member States, the United States, China, and the United Kingdom) during 2020–2023, a period of accelerated AI development and renewable-energy policy implementation, identifying country clusters that illustrate distinct AI–energy transition dynamics. Theoretically, the study provides evidence that AI serves not merely as a technological input but as a systemic mediator that reshapes the relationship between economic development and environmental outcomes, offering a more nuanced understanding of technology-driven sustainability transitions.
The empirical investigation reveals that AI’s impact on energy transition operates through differentiated pathways: investments primarily drive renewable-energy production capacity, while institutional readiness predominantly influences consumption optimization. Our findings demonstrate that successful energy transitions require aligned but distinct AI strategies—targeted investments for production scaling and systemic readiness for consumption optimization—challenging the common assumption that uniform AI development approaches are optimal across all energy transition dimensions.
The paper is organized into distinct sections addressing the following: literature review (Section 2); methodology, detailing the statistical population, variables, and three statistical methods applied (Section 3); results and discussions (Section 4); and conclusions (Section 5).

2. Literature Review

In the current context of climate change and digital transformation, understanding the relationships between renewable energy consumption, artificial intelligence development, and economic growth becomes crucial for developing sustainable development policies. Recent academic literature highlights the complexity of interrelationships between renewable energy production and consumption, AI investments, and the implementation of artificial intelligence projects, in the context of emission reduction and sustainable development objectives.

2.1. Correlation Between Renewable Energy (Production and Consumption) and AI

The interaction between renewable energy and artificial intelligence is a topic of growing interest, with the potential to contribute significantly to the transition toward a sustainable economy.
In the context of the global energy transition, the correlation between renewable energy production and consumption gains fundamental importance, being supported by multiple convergent factors, from technological innovations to behavioral changes of consumers (EP, 2024). An increase in renewable energy production and consumption usually contributes to reducing CO2 emissions, as it replaces fossil-fuel-based energy sources (Iqbal et al., 2022), but the effect depends on the share of renewable sources and the efficiency of the distribution infrastructure for renewable energy (IPCC, 2023).
Another global study (targeting the interaction between GDP, renewable energy, and CO2 emissions) demonstrates a bidirectional relationship between renewable energy consumption and CO2 emissions (Caldera et al., 2024). A detailed analysis conducted on 45 countries in Europe and Central Asia during 2000–2019 demonstrated that countries with greater integration of renewable energy managed to reduce emissions more efficiently (Parmová et al., 2024).
Certain studies reveal that renewable energy production has a limited impact on economic growth and emphasize the importance of energy-efficiency policies for sustainable development within the European Union (Mecu et al., 2023). But as CO2 emissions regulations become stricter, there is a preference for integrating a larger amount of renewable-energy-based equipment with greater capacities, thus contributing to reducing carbon emissions (Tatar & Aydin, 2023).
The European Union is spearheading the fight against climate change caused by greenhouse-gas emissions (Vîrjan et al., 2023). Based on the European Green Deal, the European Union has committed to finding solutions to energy, climate, and environmental issues and to achieve climate neutrality by 2050 (EC, 2019), in accordance with the Paris Agreement (UN, 2015b). The transformation of the EU’s energy system plays a fundamental role in this regard, as energy production and use account for over 75% of its greenhouse-gas emissions (EP, 2024).
To combat climate change, the European Union has adopted the European Climate Law (European Union, 2021) (part of the European Green Deal) which sets the objective of reducing net greenhouse-gas emissions from 40% currently to at least 55% by 2030 and achieving climate neutrality by 2050. To achieve its climate goal, the European Union has developed an ambitious package of measures known as “Fit for 55 in 2030” (EP, 2018).
Renewable energy production is often influenced by variable factors, such as weather conditions (Chen et al., 2023; Pimenow et al., 2024), and AI plays an essential role in modeling and forecasting these factors. Machine learning technologies, including neural networks and regression algorithms, can predict solar and wind energy generation (Dellosa & Palconit, 2021; Bishaw, 2024; Onwusinkwue et al., 2024).
Efficient management of renewable energy consumption is another area where AI brings major contributions. Optimization algorithms, such as those used in smart electrical grids, allow for consumption adjustment according to fluctuations in renewable energy production (Rashid et al., 2024). Energy consumption optimization and integration of artificial intelligence systems are essential elements of how energy is produced, used, and consumed (Biswas et al., 2024), considering the relationship between AI and, especially, the IoT and big data (Pasqualetto et al., 2024).
Although AI offers multiple benefits, its implementation in the energy sector faces various challenges, such as high costs, technological unemployment, economic inequalities generated by automation (Nature Energy, 2024), lack of transparency and governance in applying AI in smart energy systems (Alsaigh et al., 2022), data security concerns (Tudora et al., 2021), and the need for more energy-efficient algorithms to reduce the environmental impact (Rashid et al., 2024).
Against the background of growing global concerns related to climate change, numerous countries and organizations have adopted initiatives that promote an energy transition toward renewable sources and advanced technological solutions, but their success depends on economic and political factors, which emphasizes the importance of an integrated approach within environmental policies.
Despite extensive research on AI and energy systems, there is limited understanding of how AI interacts simultaneously with economic development and environmental outcomes across multiple countries. This study addresses this gap by providing a comprehensive analysis of AI’s role in the energy transition

2.2. AI Investments and CO2 Emissions

2.2.1. The Role of AI in Reducing CO2 Emissions

Accurate assessment of CO2 emissions and their redistribution between the atmosphere, ocean, and terrestrial biosphere in a changing climate is essential for a better understanding of the global carbon cycle and can support the development of climate policies and the design of future climate changes (Friedlingstein et al., 2023).
Artificial intelligence can be a catalyst for reducing CO2 emissions through optimizing energy consumption in key industries (World Economic Forum, 2024) and implementing energy management systems that reduce losses, as well as the predictability of renewable energy demand and supply (McKinsey, 2024).
Investments in AI play a significant role in reducing CO2 emissions, optimizing energy use and developing energy-efficient models. As AI models become more complex, the energy consumption also increases (Garric & Piquard, 2024), highlighting the importance of “green AI”. An important aspect is monitoring the carbon footprint of AI models for improving their sustainability (Verdecchia et al., 2023) and developing more energy-efficient AI architectures (Budennyy et al., 2022). Accelerating decarbonization requires adopting advanced technologies, demanding significant energy and financial investment (Jamison et al., 2024; Doğan et al., 2025).
The impact of AI on carbon emissions varies from country to country, depending on the industrial and demographic structure of each country—with significant effects in countries with high carbon emissions and high incomes, its marginal effect decreasing in the case of secondary industrial structures (Zhong et al., 2024).

2.2.2. AI Readiness Index and Development of AI-Related Projects

Readiness for implementing artificial intelligence is essential for identifying factors that influence the adoption of advanced technologies and for the success of organizations in the digital era. The AI Readiness Score reflects the capacity of a country or organization to adopt advanced technologies and helps organizations understand the challenges and opportunities of AI adoption (Issa et al., 2021) and is used as an indicator of innovation capacity and economic competitiveness (Budiraharjo et al., 2024). This factor, combined with investments in AI and the development of dedicated projects, is crucial for implementing innovative solutions in sectors such as energy (smart grid systems) (Rinchi et al., 2024), transportation (autonomous electric vehicles), and environment (Yan et al., 2023).
Governments and companies must assess AI readiness and align digital strategies to optimize operations (Shonhe, 2024), while workforce training and continuous skill development remain essential (Chiekezie et al., 2024).
Research results indicate that AI can stimulate innovation in renewable energy by increasing investments in research and development, improving labor productivity, and institutional quality. The impact varies depending on the level and type of innovation, the type of AI, the level of national income, and the degree of development of digital infrastructure (H.-J. Wang et al., 2025a).
Various organizations have developed indices to assess the level of readiness of governments and companies in adopting AI, such as the Oxford Insights’ Government AI Readiness Index 2024 (the index analyzes 40 indicators in the following three areas: government, technology sector, and data & infrastructure) (Oxford Insights, 2024) and the Cisco AI Readiness Index (measures the global readiness of companies for implementing AI solutions on the following six pillars: strategy, infrastructure, data, governance, talents, and culture) (Cisco, n.d.). The IMF’s AI Preparedness Index (AIPI) evaluates countries’ level of preparedness for AI based on an extended set of macro-structural indicators (IMF, n.d.). High scores indicate greater capacity to adopt AI, helping organizations and countries identify gaps and integrate AI effectively.

2.3. Correlation Between GDP per Capita, AI Investments, and Energy Transition

There is a complex relationship between GDP per capita and the adoption of renewable energy sources, considering that the level of GDP per capita directly influences investments in AI and the transition to renewable energy sources. Studies demonstrate that countries with high GDP have access to advanced financial and technological resources, which facilitates increased investments in green technologies (OECD, 2024) and rapid adoption of AI-based solutions (McKinsey, 2024), and tend to have more sustainable energy policies (Caldera et al., 2024). Economic studies indicate a positive correlation between AI investments and GDP per capita; for a 1% increase in GDP, investments in AI must increase by 23.9% (Gondauri et al., 2024).
Globally, many developed states (China, the United States, and European Union countries) are competing to gain a global innovation advantage in artificial intelligence, as a basic factor that can increase competitiveness, productivity, and strengthen national security (Castro et al., 2019), and this directly influences energy efficiency and the transition to renewable energy sources (Pata et al., 2024).
The increase in GDP per capita facilitates investments in renewable energy sources and carbon-reduction technologies. In the European Union, investments in clean energy have contributed to almost a third of GDP growth, and it accounted for 50% of total investments growth in China and 20% in the United State, in 2023 (Cozzi et al., 2024).
In middle-income states, the positive impact of renewable energy on the environment is more visible. Thus, at low levels of GDP, growth in GDP per capita does not immediately lead to an increase in the level of renewable-energy use (Ergun & Rivas, 2023). At high levels of GDP, growth in GDP per capita leads, instead, to a higher level of adoption of renewable energy.
On the other hand, countries with lower GDP struggle to adopt AI due to limited digital infrastructure and an insufficiently skilled workforce, potentially deepening economic inequalities (Acemoglu & Restrepo, 2019). Studies indicate that renewable energy significantly reduces CO2 emissions, while GDP’s effect varies—from an inverted U-shaped relationship (Mirziyoyeva & Salahodjaev, 2023; Zheng et al., 2025) to a negligible impact (Afjal, 2023).
The transition to green energy has accelerated in recent years, supported by government initiatives, policies, and industrial strategies, but the complexity of processes and influencing factors such as involved costs and intense competition in clean energy sectors, which are major sources of innovation, economic growth, and employment, must be taken into account (Furman & Seamans, 2018; Acemoglu & Restrepo, 2019; IEA, 2024a). It is estimated that global renewable-energy capacity will increase 2.7 times by 2030 (IEA, 2024b).
Another aspect revealed by specialized studies indicates that the relationship between renewable and non-renewable energy consumption and economic growth is sometimes inconsistent, depending on a country’s development level (Dissanayake et al., 2023). Similar country-specific analyses are also required for analyzing renewable energy’s impact on climate change (Attanayake et al., 2024) and AI’s role in the energy transition, where economic policy uncertainty can have a positive moderating effect (Fang et al., 2025).
Another approach to analyzing correlations between production and consumption of renewable resources, economic development, and carbon emissions in certain states (China) assumes a differentiation according to the time period, as follows: long-term (a bidirectional causal relationship) and short-term (a direct or indirect unidirectional causal relationship between export, CO2 emissions, and renewable energy consumption) (Hao, 2022).
Some researchers propose an archetype-based method (using a clustering approach, they identified 12 archetypes of energy systems from 187 United Nation member countries) to design effective transition strategies toward low-carbon energy in the energy sector (Alotaiq, 2024).
Although AI offers multiple benefits, its implementation in the energy sector faces various challenges. Thus, AI faces two main contradictory trends in the future considering the following two key dimensions: diffusion and consequences (Agrawal et al., 2019). Technologies continue to improve and will be widely used, having effects on productivity and employment in both positive and negative ways. Thus, high costs, the risk of technological unemployment, and economic inequalities generated by automation must be taken into account (Nature Energy, 2024).
AI has the potential to enhance energy-system stability, cybersecurity, and sustainability, but challenges remain, including data quality and accessibility, system interoperability, privacy, ethics, security, and governance in smart-energy systems (Tudora et al., 2021; Alsaigh et al., 2022; H.-J. Wang et al., 2025a). Decision making must also consider uncertainties in environmental policies, costs, demand, data, and business models (Agterberg et al., 2021).
It should also be noted that AI adoption is constrained by technological limitations. In this context, governments adopt initiatives to stimulate funding for research in artificial intelligence, as well as stimulating private investments, but also to manage potential disadvantages, such as the impact on the workforce, concerns related to privacy, and intellectual property rights (HAI, 2018).
Decisionmakers should align energy policies with economic growth in order to stimulate sustainable development (Tran et al., 2022) while advancing technology without compromising equity and ecological integrity (Kyriakarakos, 2025), including developing energy-efficient AI algorithms (Rashid et al., 2024).
Against the background of growing global concerns related to climate change, numerous countries and organizations have adopted initiatives that promote energy transition toward renewable sources and advanced technological solutions, but their success depends on economic and political factors, which emphasizes the importance of an integrated approach within environmental policies.
Despite the growing number of studies linking AI and the energy transition, its specific impact on renewable energy production versus consumption remains limited and contradictory. Going forward, prior research has often focused either on single technologies or on isolated case studies, leaving cross-national comparative analyses underexplored. Also, there is limited understanding of how AI interacts simultaneously with economic development and environmental outcomes across multiple countries. This study addresses this gap by analyzing the multidimensional impact of AI on the energy transition across 27 EU Member States, the United States, China, and Great Britain during 2020–2023. By applying robust regression, Gaussian graphical models, and cluster analysis, the research provides strong empirical validation and a comprehensive perspective on how AI influences the energy transition.
Beyond the empirical findings, several theoretical perspectives provide a strong foundation for analyzing the nexus between AI, renewable energy, and economic development. The Technological Innovation Systems (TIS) framework (Lundvall, 1992; Carlsson & Stankiewicz, 1991) conceptualizes AI as a general-purpose technology capable of generating complementary innovations and accelerating systemic transitions. From the lens of institutional theory (North, 1990; Scott, 2014), the effectiveness of AI adoption depends on the readiness of regulatory frameworks, digital infrastructure, and human capital ecosystems. Theories of sustainable development and the triple-bottom line (Elkington, 1997; WCED, 1987) emphasize the need to balance economic growth, social equity, and environmental integrity, framing AI as both an enabler of decoupling and a potential source of new inequalities. Finally, the diffusion of innovation theory (Rojek et al., 2023) provides a rationale for the differentiated impact of AI on renewable energy production versus consumption, as adoption curves and behavioral responses follow distinct dynamics.
By integrating these theoretical perspectives, the present study situates AI not only as a technological tool but also as a systemic driver embedded in institutional, economic, and social contexts. This theoretical grounding strengthens the interpretation of the empirical results and clarifies the mechanisms through which AI may act as both catalyst and mediator of the energy transition.
Addressing the complex relationship between artificial intelligence (AI investments, AI Readiness Score, and AI-related projects) and renewable energy (renewable energy production and renewable energy consumption) using the control variables CO2 emissions and GDP per capita is based on the following research hypotheses, which add a new dimension to the analyses already conducted in the field:
H1. 
The implementation of artificial intelligence in the energy sector leads to increased efficiency of the energy transition.
H2. 
The development of artificial intelligence influences with the same intensity both renewable energy production and renewable energy consumption.
H3. 
The specific indicators of AI and those of energy transition mediate their indirect relationships in order to achieve climate neutrality objectives.
The first two hypotheses are tested through robust regression, while the third hypothesis is tested through the Gaussian graphical model. The investigation is deepened through a cluster analysis aimed at identifying patterns in the dataset by grouping countries according to similar characteristics and highlighting successful models in energy transition.

3. Materials and Methods

To address the research objective and test the formulated hypotheses, this study employs an integrated methodological framework that combines three complementary statistical approaches (Figure 1).
Figure 1 illustrates our integrated methodological approach. Robust regression was employed to capture direct causal relationships while addressing outliers (Maronna et al., 2018). This represents an improvement over traditional ordinary least squares regressions commonly applied in earlier studies of the AI–energy nexus (e.g., Q. Zhao et al., 2024), which are highly sensitive to influential observations and heterogeneous country contexts. The Gaussian graphical model was applied to identify conditional dependencies and mediating effects (Hevey, 2018), extending beyond the simple correlation and regression analyses often reported in the literature (Mirziyoyeva & Salahodjaev, 2023) by revealing not only direct but also indirect relationships among variables. Finally, cluster analysis was used to detect convergence patterns across countries (Kassambara, 2017), a methodological choice that contrasts with prior cross-country studies employing panel regressions without accounting for heterogeneity in development levels (Caldera et al., 2024). Combining these methods mitigates individual methodological biases and generates comprehensive insights that would not emerge from a single econometric approach.

3.1. Dataset

To support the empirical analysis, we selected data from 30 countries with clear commitments to energy transition and declared ambitions in artificial intelligence (Statista, 2023). The statistical population includes the 27 EU Member States, the United Kingdom, China, and the United States. The selection reflects both the common EU approach to climate and digital policy, as well as the need to benchmark against global AI leaders. The dataset covers the period 2020–2023. While the group is heterogeneous, the inclusion of the USA and China ensures analytical coherence by capturing the influence of the most advanced digital economies and their global climate commitments, thereby allowing meaningful contrasts with the EU bloc. Beyond these structural considerations, the context of strategic competition between the USA and China, fragmented investment models, restrictions in technology transfer, and competition for critical resources (such as advanced semiconductors) is acknowledged as a background to interpreting the results, although not formally modeled as variables.
For this purpose, we investigate the interdependencies between the following three categories of variables: (i) renewable energy—explained variables (renewable energy production and renewable energy consumption); (ii) artificial intelligence—explanatory variables (AI investments, AI Readiness Score, and AI-related projects); and (iii) control variables (CO2 emissions and GDP per capita in USD). This selection captures the main channels through which AI can support the energy transition. Variable definitions and data sources are described in the following subsections.

3.1.1. Renewable Energy—Explained Variables

At the global level, it is necessary for the energy industry to reduce carbon emissions while maintaining the internal balance between energy supply and demand (Ahmad et al., 2021). In the face of such a challenge, energy transition has become a dominant trend (Dong et al., 2024), whose evolution is strongly influenced by technological advancement, especially in the fields of machine learning and artificial intelligence (Chishti et al., 2024). In this context, the present research considers the increase in renewable energy production capacity along with the optimization of its consumption as vital metrics in monitoring progress toward a clean energy mix. The amount of renewable energy reflects directly the technological capacity and green infrastructure of a country but also the potential for integrating AI systems to increase it (Bennagi et al., 2024), while the expansion of renewable energy consumption is considered “the right path” to energy transition (Dong et al., 2024, p. 4). In accordance with the information from Energy Institute—Statistical Review of World Energy (KPMG, n.d.), made available by the Our World in Data organization (2024), the following were selected as dependent variables: (i) renewable energy production and (ii) share of renewable energy consumption. These two complementary indicators provide a comprehensive perspective on the national capacity for greening the energy system while also being highly susceptible to optimization through AI technology (Bennagi et al., 2024; Chishti et al., 2024; Dong et al., 2024). The total renewable energy generated was obtained by aggregating the energy levels generated from each renewable source, including solar, wind, and geothermal (C. Zhao et al., 2024), and was used in the research as the natural logarithm of this aggregated quantity (Q. Zhao et al., 2024).

3.1.2. Artificial Intelligence—Explanatory Variables

Artificial intelligence, through its specific components of either automated learning machines or generative systems (Fraisl et al., 2025), represents the technological innovation capable of innovating all domains of human activity. This new and catalyzing technology is already engaged in various actions for the sustainable transformation of our world (UN, 2024), implicitly in “climate change mitigation through increased energy efficiency” (Fraisl et al., 2025, p. 5). The advanced capabilities of AI and machine learning (ML) algorithms in estimating, forecasting, and assisting the electrical grid (Ahmad et al., 2021) make important contributions to the energy transition and achieving sustainable development goals (Vinuesa et al., 2020), but the evidence is far from clear and generally accepted (Q. Zhao et al., 2024). The potential role played by AI in accelerating the energy transition is evaluated technically through various techniques, algorithms, and deep learning models (Bennagi et al., 2024; Rane et al., 2024) and can be grouped, in the opinion of Chishti, into the following two categories: assisting renewable energy production and optimizing consumption (Chishti et al., 2024, p. 6). Being an emergent technology, AI is measured by most researchers through indicators that reflect the level of technological innovations and funding (C. Zhao et al., 2024). In this study, the following were used as explanatory variables: (i) AI investment, as a measure of the financial commitment assumed for AI development, determined based on the OECD, and AI information as a proportion of each country’s GDP (OECD, n.d.); (ii) AI Readiness Score, as a measure of the level of AI preparedness at the national level, an index published by Oxford Insights Government AI Readiness Index (Oxford Insights, 2024); and (iii) AI-related projects, as a proxy for AI technological progress, obtained from OECD (n.d.).

3.1.3. Control Variables

Economic development and air pollution are indicators with significant impacts on energy-transition policies and, implicitly, on artificial intelligence (Q. Zhao et al., 2024; Dong et al., 2024). Consequently, CO2 emissions and GDP level were used in the research as control variables. GDP per capita controls for economic development’s effects on energy-adoption capacity and CO2 emissions capture environmental pressure, motivating renewable transition. These variables address potential confounding effects while maintaining model parsimony given our sample size constraints.
These variables were included in the empirical research of the inter-linkages between artificial intelligence development and energy-transition progress, and, implicitly, how they facilitate the reduction of CO2 emissions.

3.2. Methodology

3.2.1. Robust Regression Analysis

Robust regression is an advanced statistical technique that allows for the analysis of causal dependencies between variables in a superior way to classical linear regression methods (based on the ordinary least squares method—OLS) (Maronna et al., 2018). The method integrates the calculation of Cook’s distance and Hubert and biweight iterations with the purpose of detecting and properly treating outliers. According to Andersen’s (2008) opinion, robust regression uses information from all observations but places less importance on extreme observations. In this way, the method limits the impact of unusual observations on the value of its estimates.
The fundamental statistical model can be expressed by Equation (1), as follows:
Y i = β 0 + β 1 x i 1 + β 2 x i 2 + + β n x i n + ε i
where the following definitions apply:
  • Yi = vector of the explained (dependent) variable for observation i;
  • β0 = intercept;
  • β1, β2, … β2 = regression coefficients;
  • Xi1, Xi2, …Xin = explanatory (independent) variables for observation i;
  • ε = errors;
  • βXi = matrix of independent variables and regression coefficients.
The main difference from classical regression is given by how errors are treated. Using the M-estimator (generalization of maximum-likelihood estimation), observations with large residuals receive a reduced weight in the estimation because these potential outliers contain less information about the location of the regression surface (Fox & Weisberg, 2018). In principle, the M-estimator minimizes an objective function of the form in Equation (2), as follows:
β ^ = arg m i n β i = 1 n p y i x i T β
where the following definitions apply:
  • yi = dependent variable observed for the data point (observation) i;
  • xTi = transpose of the vector of the explanatory variables for observation i;
  • β = vector of the regression coefficients for which the estimation is made;
  • p(ri) = loss function applied to residuals for observation i (ri = yi − xTi).
Since the function p(ri) does not take the simple form of squared residuals (as in the traditional method) but rather a more complex form sensitive to extreme values for minimizing i = 1 n p r i , an iterative solution is used (most often iteratively reweighted least-squares, or IRLS) (Fox & Weisberg, 2018) based on intensive calculations of the following: (1) estimation of initial values for β(0) (usually OLS); (2) calculating residuals for each iteration r i t 1 and the corresponding weights, ω i t 1 = r i t 1 , based on iterations from the previous step; (3) solving the associated system of equations; and (4) steps 2 and 3 are iteratively updated until convergence.
Through proper detection and appropriate treatment of extreme values, robust regression estimates provide a strong and elegant summary of relationships among variables (Andersen, 2008) but are highly dependent on computerized calculations, the most commonly used specialized software being R (Maronna et al., 2018) and Stata.
In the present research, the estimation of robust regression models was performed in R 4.4.2, using the robustbase package, the lmrob() function, and following the general model in Equation (3) (Maechler et al., 2024) (Cran R) below:
l i b r a r y r o b u s t b a s e m o d e l < l m r o b y ~ x , d a t a = d a t a s e t   s u m m a r y m o d e l
The robustbase package uses maximum likelihood estimation (MM-estimator), which is an extension of the M-estimator (Maronna et al., 2018), practically implemented within the lmrob() function to obtain stable and efficient estimators by calculating weights for each observation and minimizing the role of outliers. This means that it is a robust estimation method that improves the performance of the regression model.
The specificity of the run models corresponds to the previously described categories of variables, but it is necessary to mention that each model was double quantified by taking into analysis the following: (i) the original values of the indicators and (ii) their standardized values. From a statistical point of view, standardization is recommended in the case of the analyzed dataset, as it contains variables with large scales (AI.Inv: 0.3–2.2; AI.RS: 58–88; AI.RP: 15–104; GDP: 10,000–134,000). The standardized value of each variable was determined in accordance with relation (4), as follows:
X _ s t d = X μ x σ x
where the following definitions apply:
  • X_std = standardization of variable X;
  • μx = mean of variable X;
  • σx = standard deviation of variable X.
The following are regression models with an Ln.RP-dependent variable:
Variables with original values
L n . R P . m o d e l . o r i g < l m r o b ( L n . R P . o r i g ~ A I . I n v . o r i g + A I . R S . o r i g + A I . R P . o r i g   + L n . C O . o r i g + G D P . o r i g ,   d a t a = d a t a _ c o m p l e t e )
Variables with standardized values
L n . R P . m o d e l . s t d < l m r o b ( L n . R P . s t d ~ A I . I n v . s t d + A I . R S . s t d + A I . R P . s t d   + L n . C O . s t d + G D P . s t d ,   d a t a = d a t a _ c o m p l e t e )
The following are regression models with an RC-dependent variable:
Variables with original values
R C . m o d e l . o r i g < l m r o b ( R C . o r i g ~ A I . I n v . o r i g + A I . R S . o r i g + A I . R P . o r i g   + L n . C O . o r i g + G D P . o r i g ,   d a t a = d a t a _ c o m p l e t e )
Variables with standardized values
R C . m o d e l . s t d l m r o b ( R C . s t d ~ A I . I n v . s t d + A I . R S . s t d + A I . R P . s t d + L n . C O . s t d +   G D P . s t d ,   d a t a = d a t a _ c o m p l e t e )
Standardization does not produce fundamental changes in the analysis (statistical significance and the direction of relationships (+ or −) remain unchanged, as well as R-squared remains the same); however, by reducing numerical problems in the dataset, it improves the stability of calculations and allows for identification of the relative importance of variables.
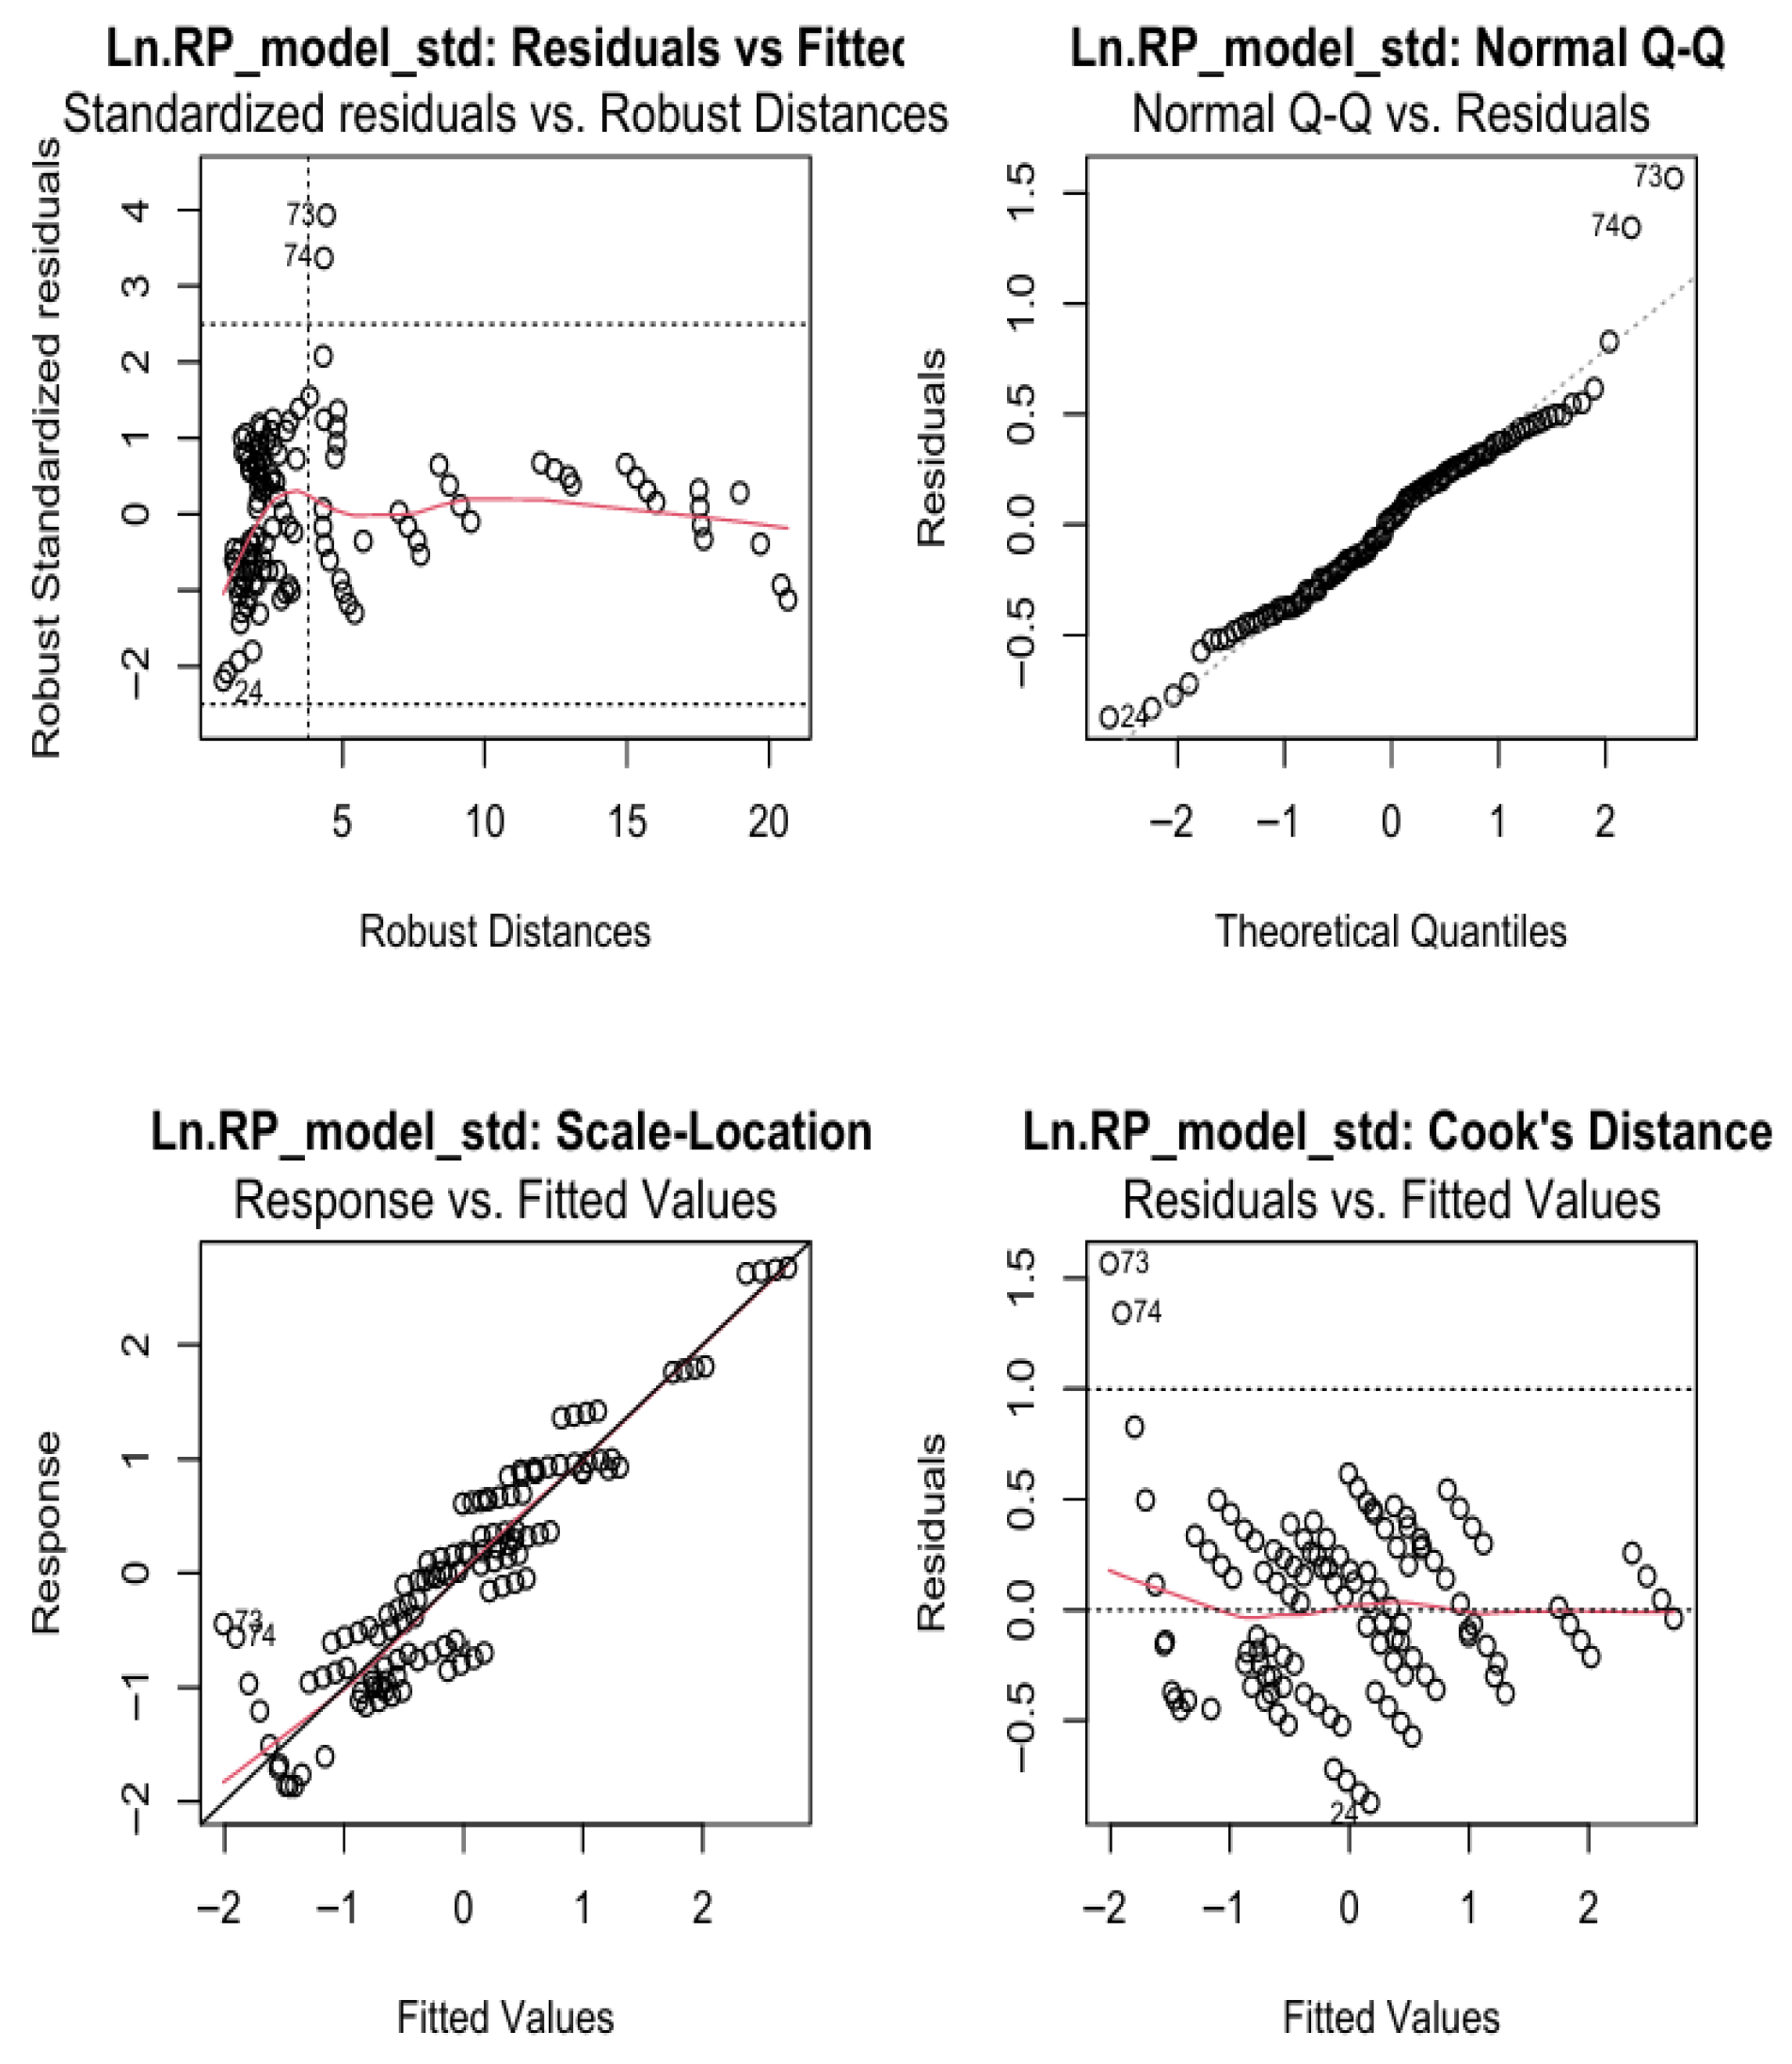
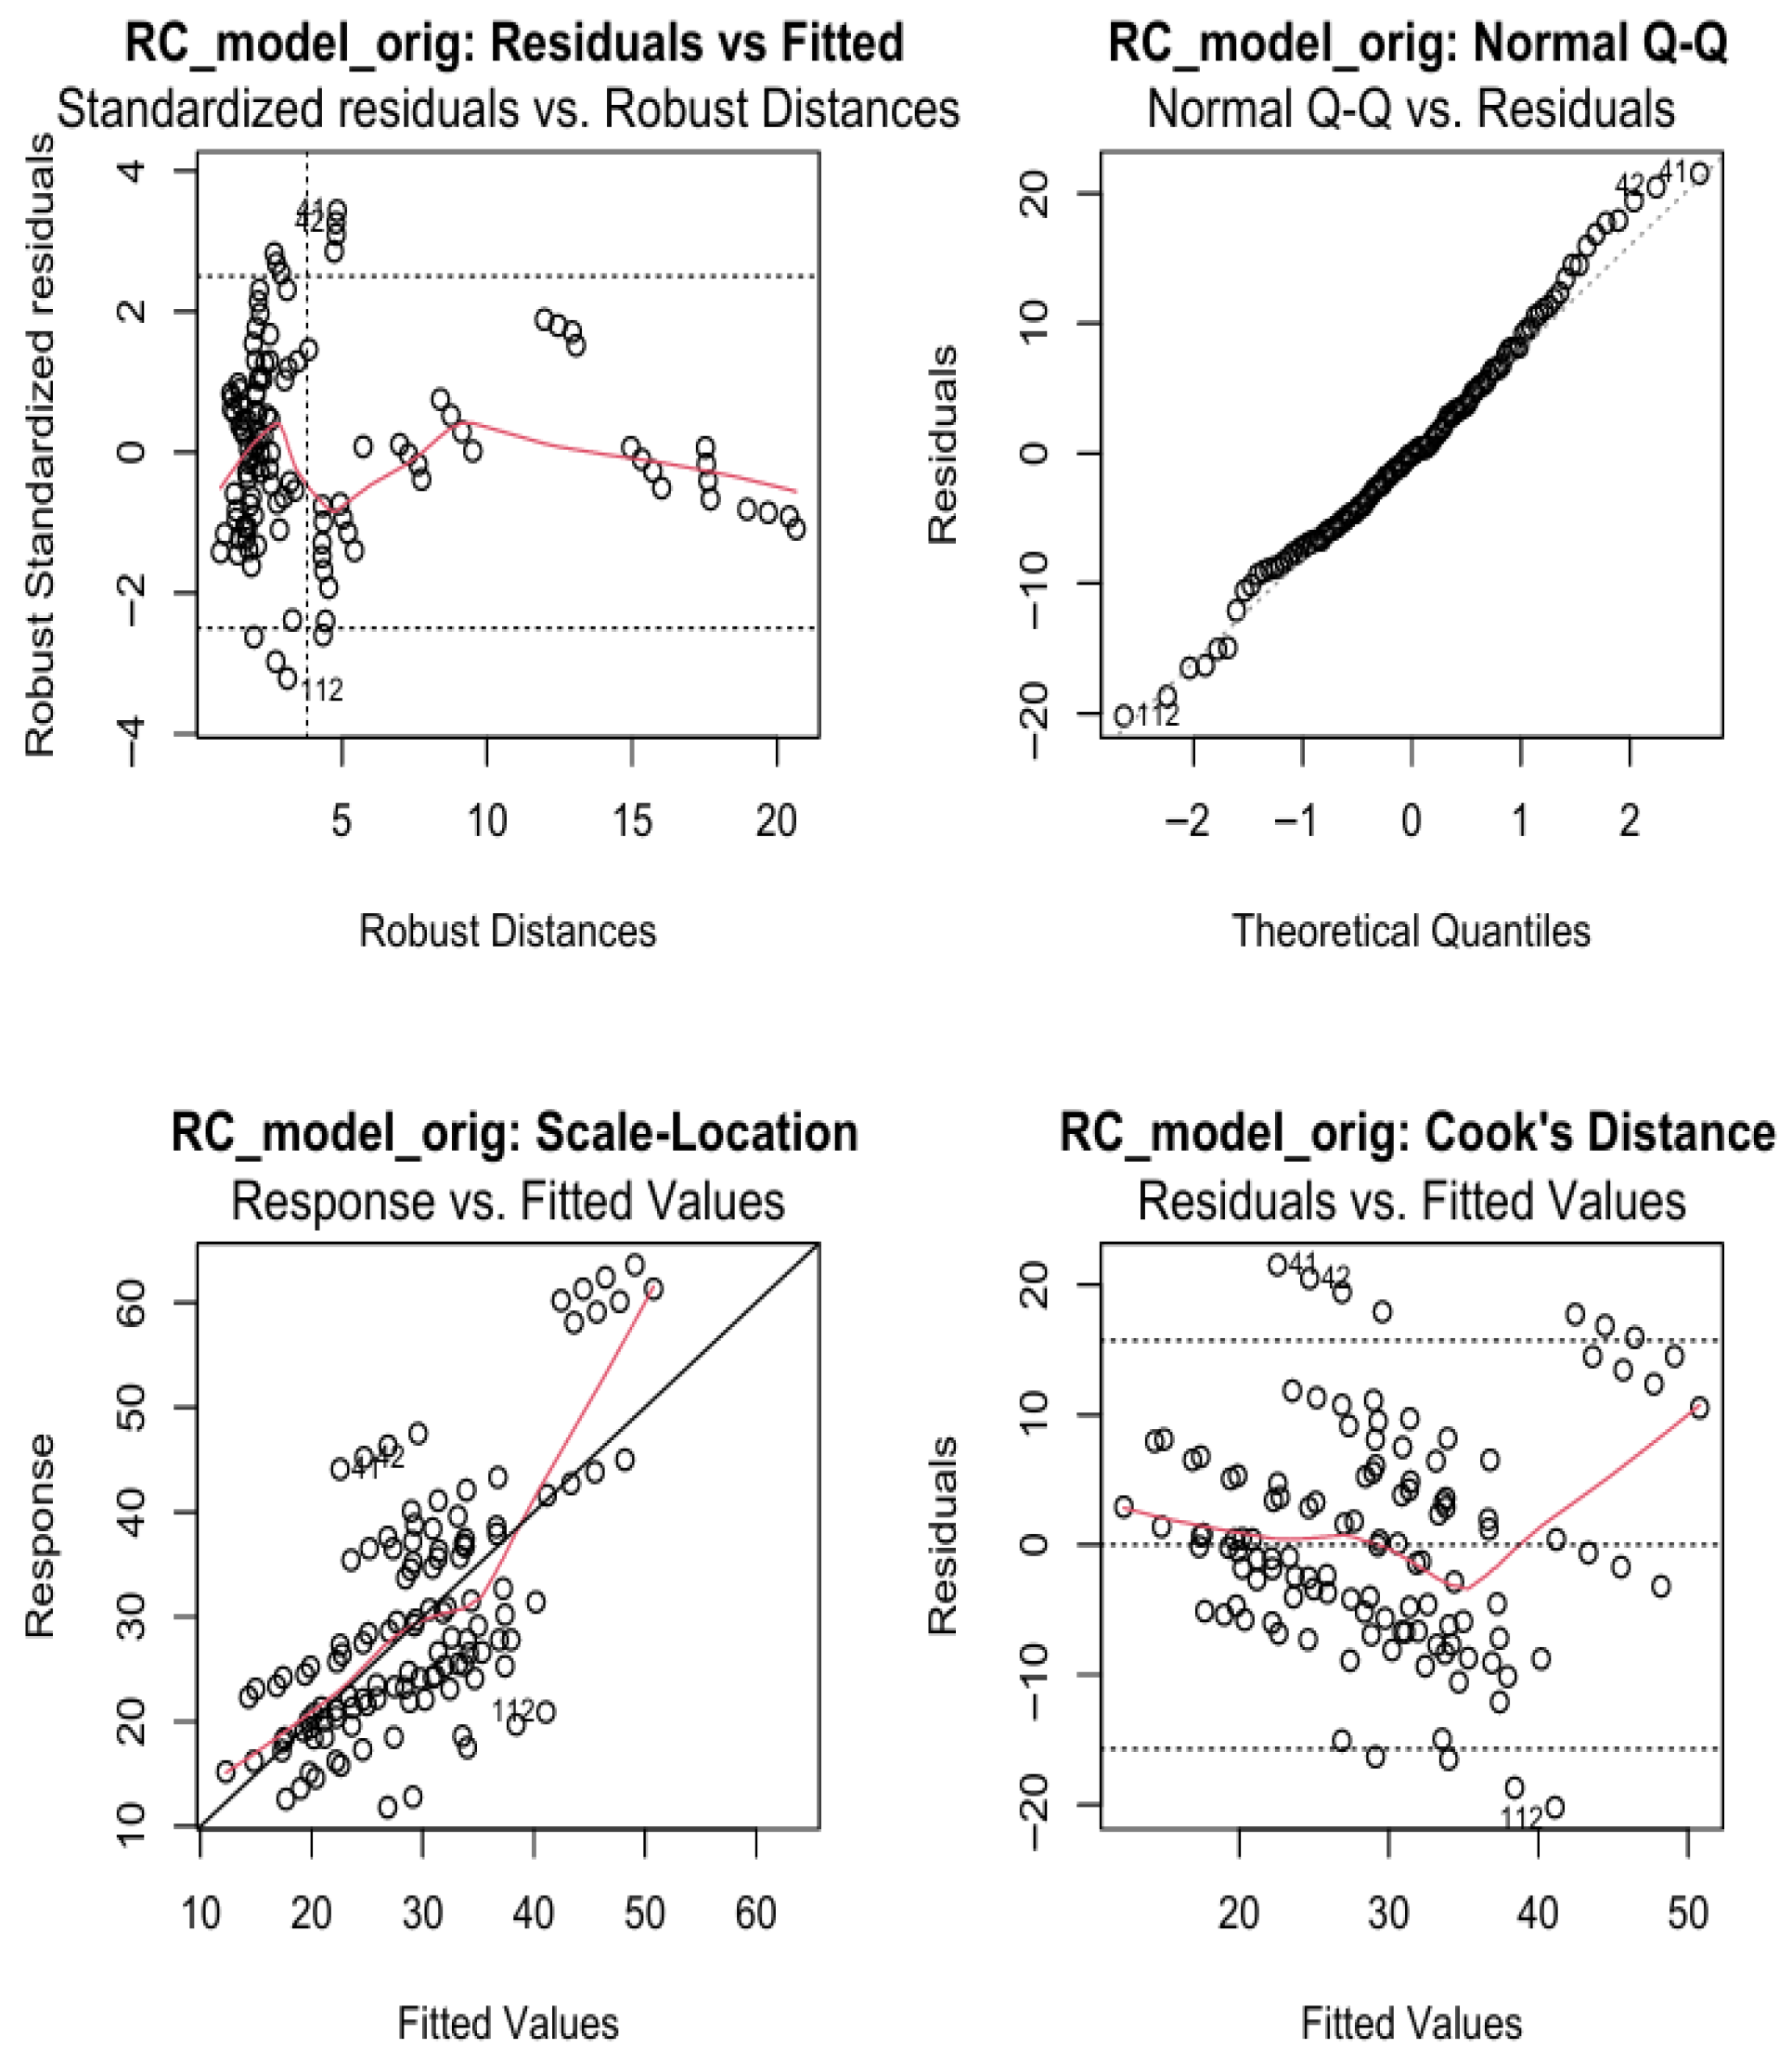
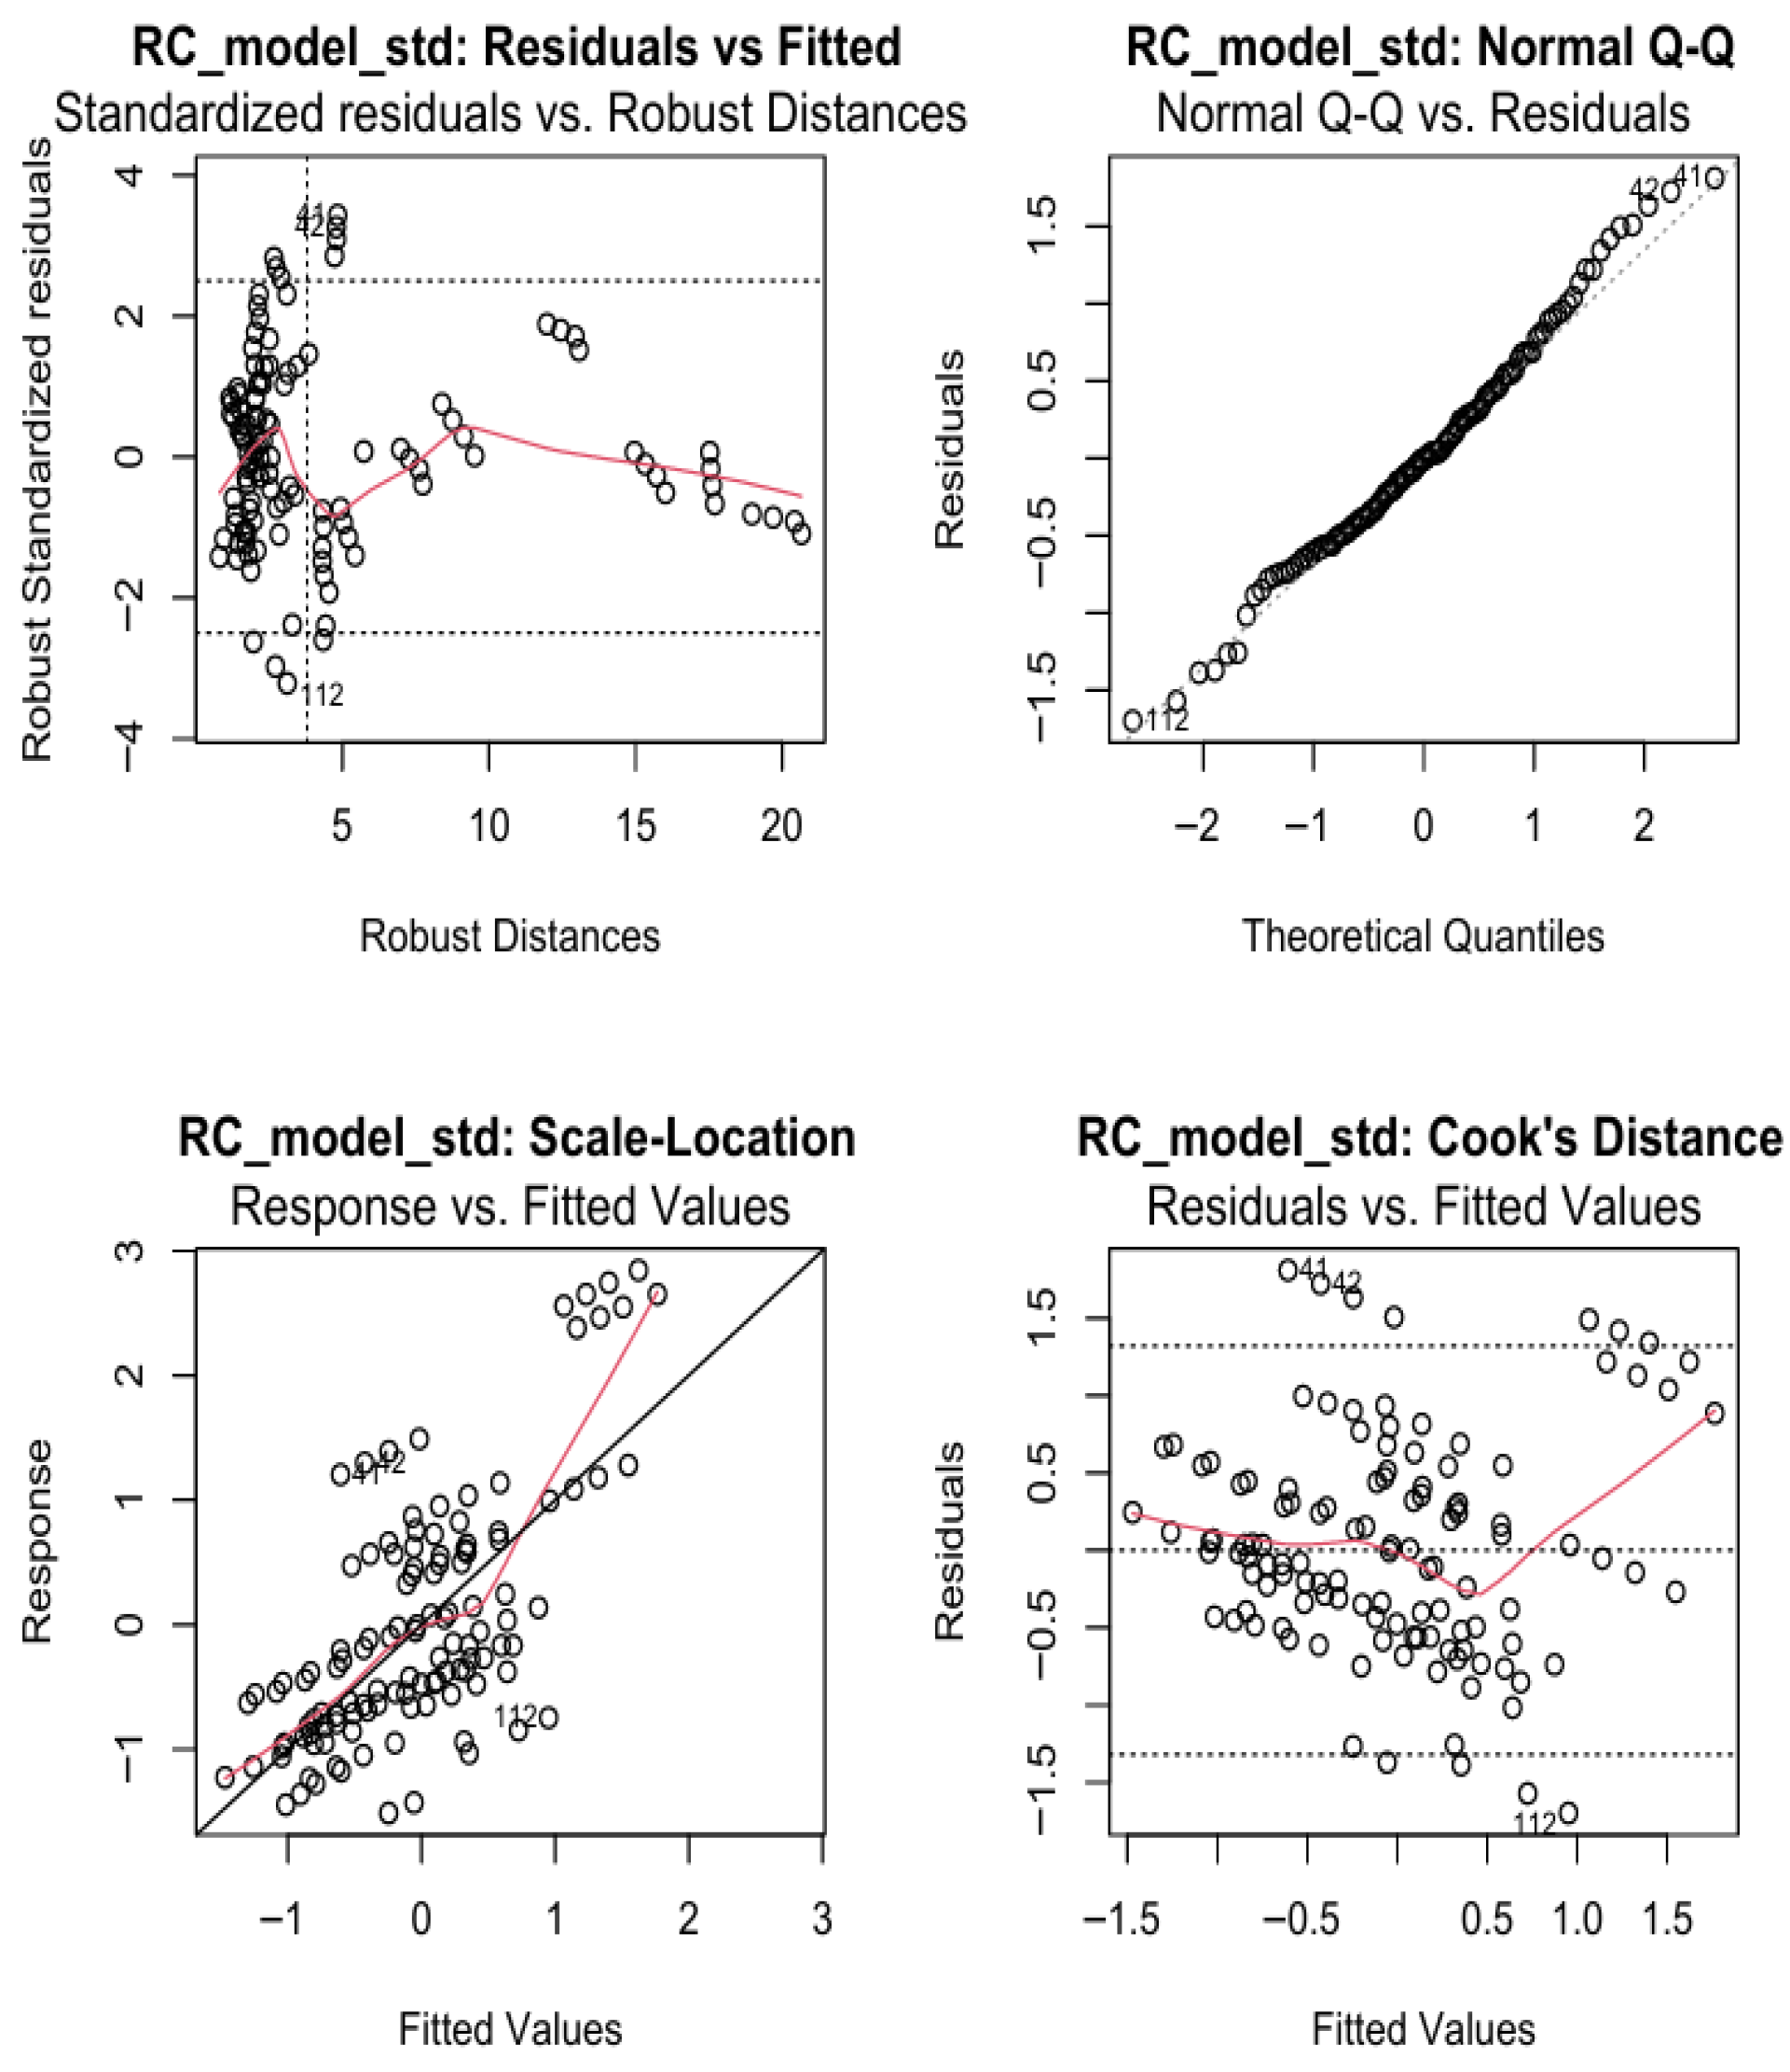
The robustness of the estimated models and conclusions drawn is validated through linearity tests (residuals versus fitted), normality of residuals (Q–Q plot and Shapiro–Wilk test), homoscedasticity (scale–location), influential observations (Cook’s distance), and multicollinearity (VIF).

3.2.2. Gaussian Graphical Model

The Gaussian graphical model (GGM) represents an important tool for modeling interdependent relationships between continuous variables, under the assumption of multidimensional normality (Tsai et al., 2022). As a statistical technique specific to network analysis, GGM is suitable for investigating relationships among the different domains (Zoccolotti et al., 2021) being used in the present study due to its ability to capture complex patterns of direct and mediated relationships (Hevey, 2018) among variables. Thus, we consider that the GGM technique complements and extends the robust regression analysis, as it is capable of leading to valuable observations about the inter-linkages between variables specific to artificial intelligence and those regarding energy transition in the context of decoupling economic development from carbon emissions.
GGM uses graph theory for a visual representation of all conditional dependency relationships, contributing to a deepening of empirical knowledge as a result of the simultaneous visualization of the network structure of links formed among scientific variables. GGM is defined as a graph, G = (V,E), formed from a set of nodes, V = {1, …, p}, and a set of edges, E ⊆ V × V, as links established among nodes (Tsai et al., 2022; Sheng et al., 2023). Given the fact that the set of nodes, V, corresponds to a random vector, X(x1, …, xₙ)ᵀ, that follows a multivariate normal distribution, the following is given:
X ~ N μ , Ω 1
where the following definitions apply:
  • μ = mean vector;
  • Ω = covariance matrix;
  • ʘ = Ω-1 is the precision matrix, with Ɵi,j as an element, also known as the inverse of the covariance matrix.
Then, the set of edges, E = {(i,j): 1 ≤ i < j < p}, describes the relationships between the components of the vector (x1, …, xp) based on the non-zero entries, Ɵi,j. There is an edge between nodes i and j if and only if Ɵi,j ≠ 0, indicating conditional dependence and covariance between xi and xj, which cannot be explained by any other variable in the network. There is no edge between nodes i and j if and only if xi and xj are conditionally independent with respect to all other components of X.
The edges between nodes indicate not only the strength of direct links but also have the capacity to capture mediation paths (Hevey, 2018) or indirect links between nodes (variables). Thus, if there is no direct edge between nodes i and k, but there is a link (edge) between i and j, and node j is also connected to node k, then j mediates the indirect relationship between i and k.
To avoid obtaining edges that contain weak correlations (spurious edges) or potentially false ones between nodes, a lasso regularization technique is used, specifically glasso (graphical lasso), one of the most used and implemented techniques in opensource software (R 4.4.2 and JASP 0.19.1.0) (Epskamp & Fried, 2018). Essentially, this technique involves inverting the sample variance–covariance matrix and using a control parameter λ to adjust the level of sparsity.
In the present research, JASP software (version 0.19.1.0, which integrates the following R packages: ggraph, glasso, and bootnet) was used for GGM estimation, by applying the glasso technique, and the value of the adjustment parameter for minimizing the extended Bayesian information criterion (EBIC) was set to 0.5 (default). In addition to analyzing the network structure (rendered in the classic version using blue lines for positive links and red lines for negative links), the accuracy and stability of the network were also taken into account.

3.2.3. Cluster Analysis Methodology

Cluster analysis is a multivariate research method that allows for homogeneous organization into clusters of a dataset in relation to common characteristics. By using a similarity criterion, the method allows for maximizing the similarity among observations within a group, which is why clustering is a crucial step in identifying patterns (Zhang et al., 2015) within a dataset.
Segmenting the collection of initial variables into a structure consisting of n clusters requires determining the distance or similarity between each pair of observations in the form of a distance matrix (Euclidean, most often) (Kassambara, 2017), as follows:
d e u c x , y = i = 1 n x i y i 2
where the following definitions apply:
  • deuc = Euclidean distance;
  • x, y = vectors of a pair of two observations (the 30 countries included in the analysis);
  • i = values for variable i;
  • n = number of variables considered (the seven scientific variables described in Table 1).
A particularly important aspect before calculating the distance between pairs of observations is the standardization of data, as the degree of “closeness” or “distance” is influenced by the scale of measurement of the variables. Standardization ensures that each variable contributes equally to the analysis.
Further, the hierarchical classification methodology is based on a dendrogram, determined by the Ward algorithm (Ward & Hook, 1963; im Walde, 2006), which aims to minimize the variation within a cluster according to Equations (11) and (12) and on the K-means algorithm (13), to identify the optimal number of clusters.
K = s g r y r s g 2 g 1 n g r y r s g 2
where the following definitions apply:
  • k = minimization function;
  • s = number of variables;
  • g = number of groups;
  • r = object;
  • yrsg = value of variable s, for object r, from group g;
  • ng = number of objects in group g.
d C i , C j = d w a r d C i , C j = x C i , C j d x , c e n i j x C i d x , c e n i + x c j d x , c e n j
where the following definitions apply:
  • d = distance between clusters;
  • Ci,Cj = two distinct clusters;
  • cen = center of a cluster, or centroid.
The basic principle of the K-means algorithm (13) is to minimize the sum of squared distances between each point and its center (Kassambara, 2017):
W C j = x i C j x i c e n j 2
where the following definitions apply:
  • xi = a point of cluster j (Cj);
  • cenj = center of cluster j (Cj).
The generated clusters allow for the identification of specific characteristics of each created group (of countries) and the interpretation of quantitative differences among clusters. In the present research, the entire cluster analysis methodology was implemented in R.

4. Results and Discussions

This section of the paper begins with a presentation of the descriptive statistics of the variables included in the empirical analysis. Table 2 presents the scientific variables in terms of the mean values, median values, standard deviation, and their normal distribution tests (skewness and kurtosis).
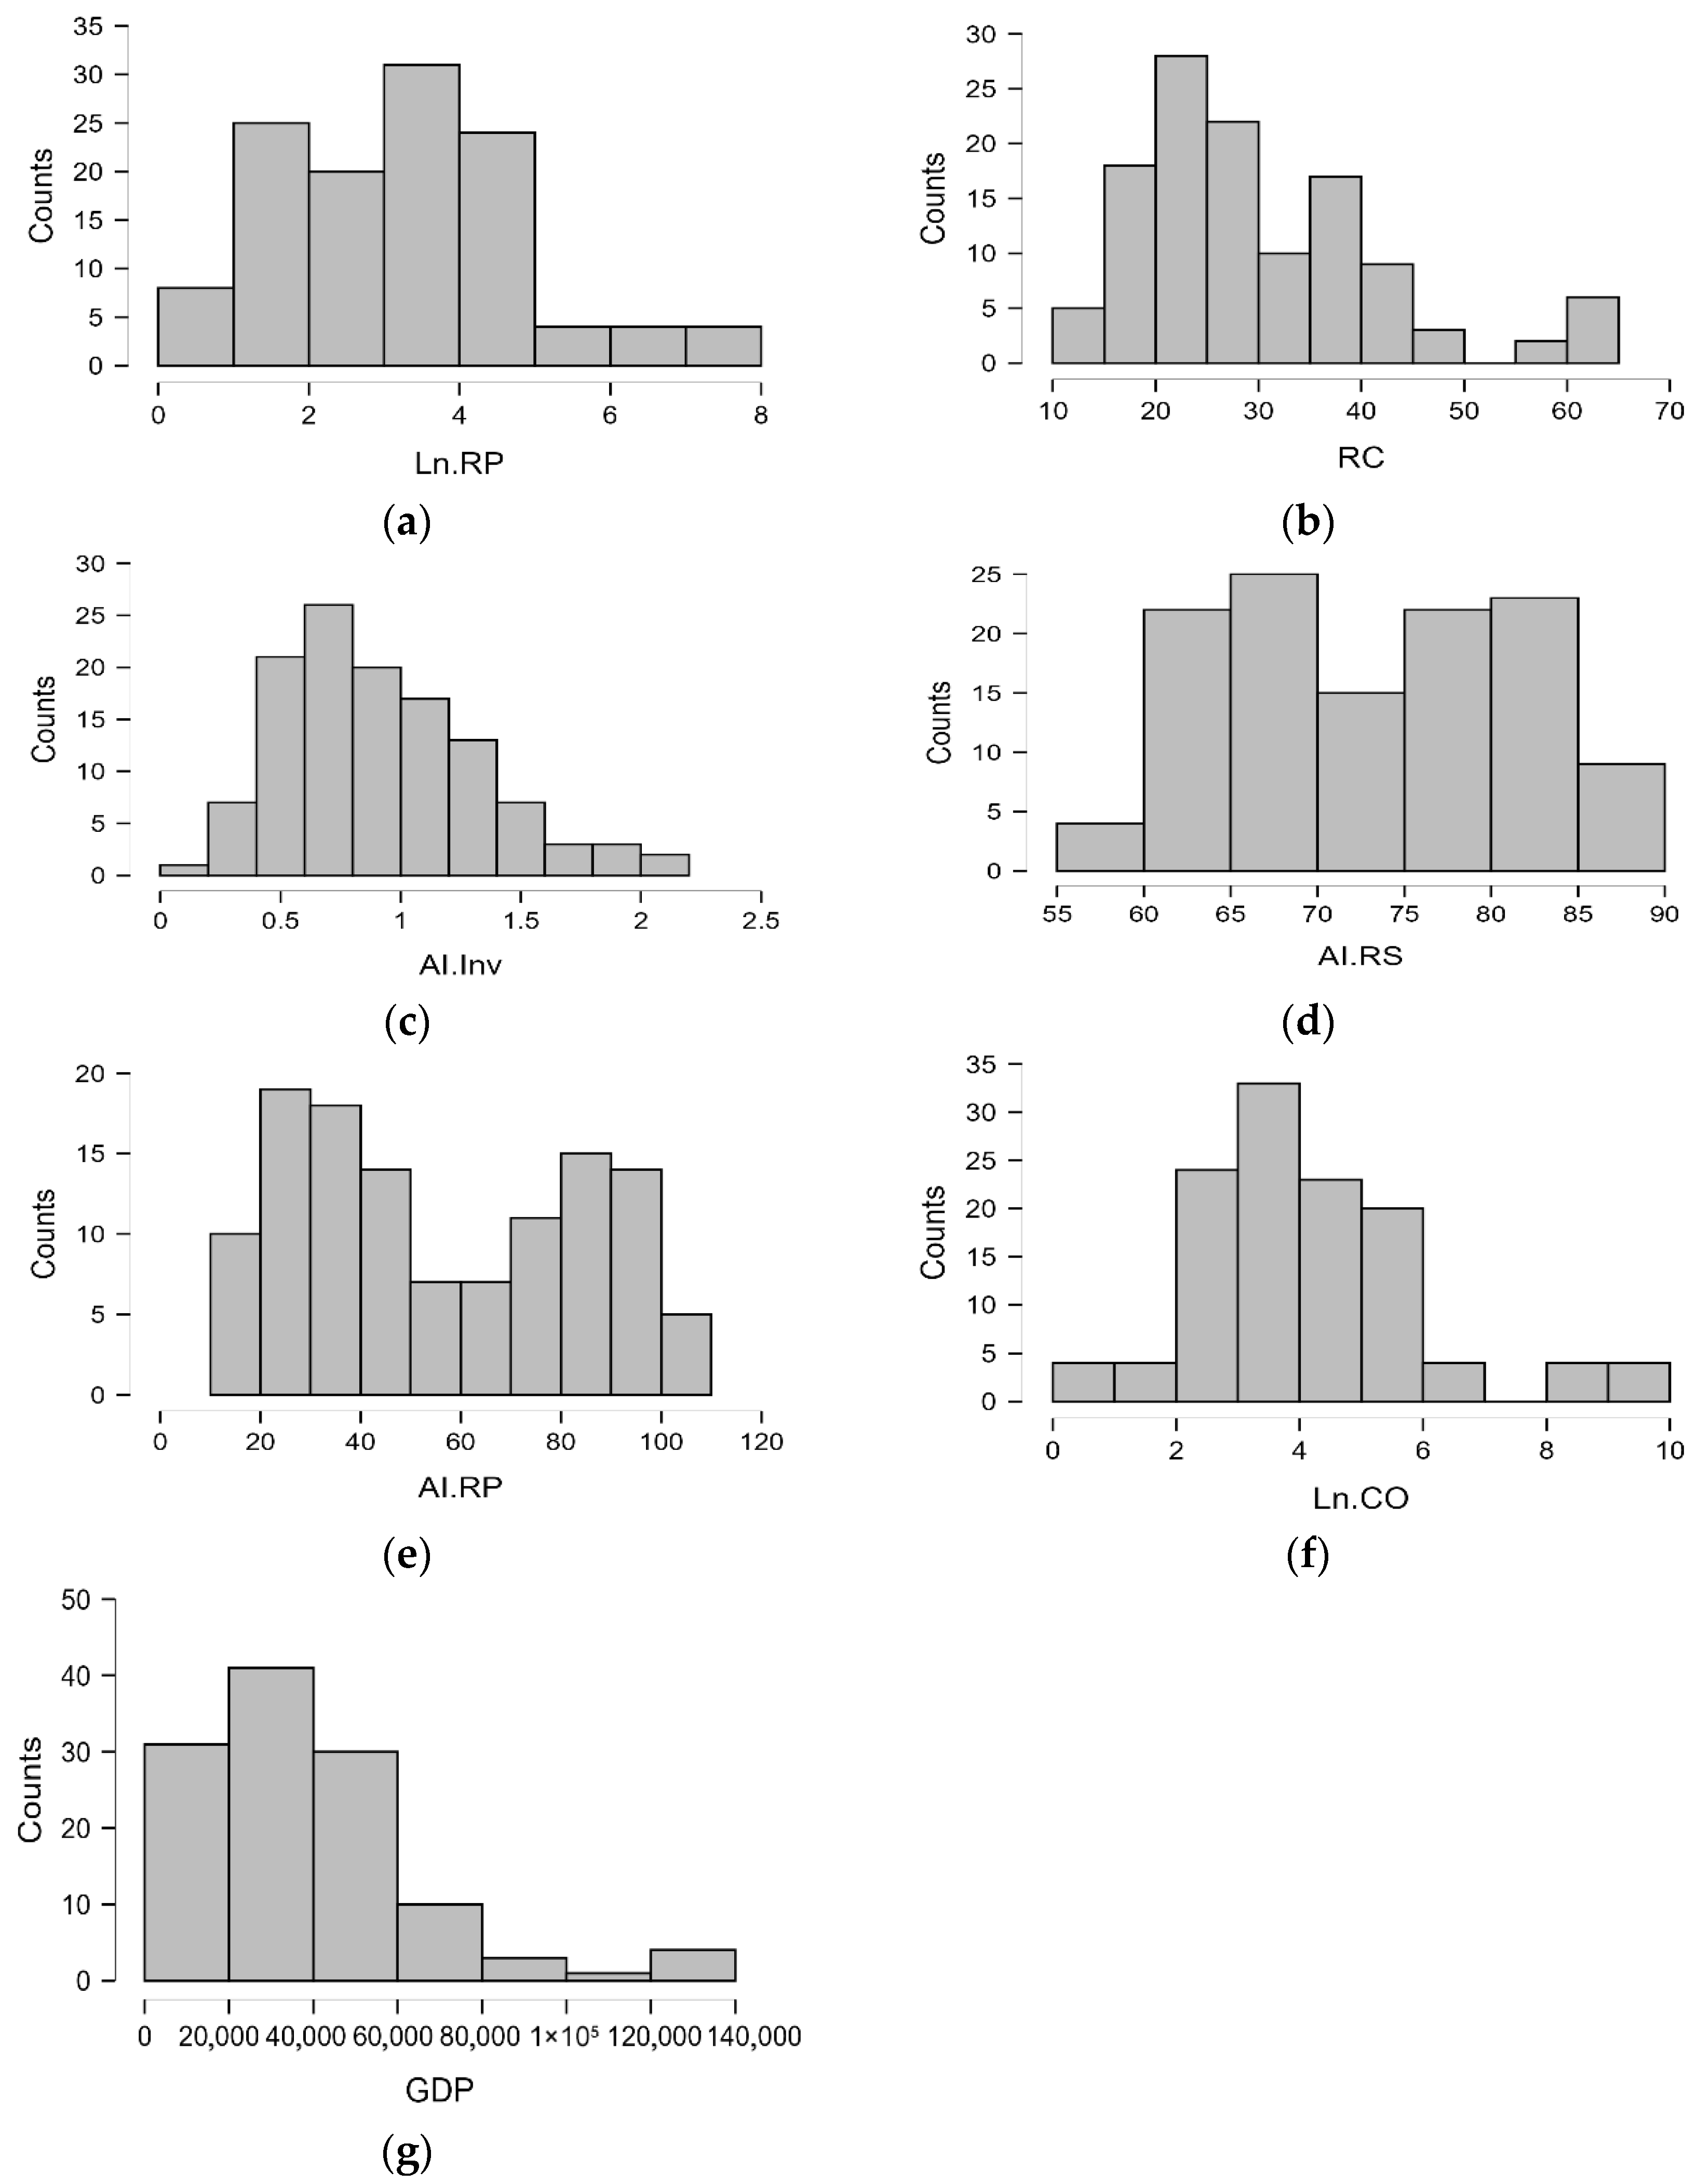
It is observed for each variable that the mean values are close to the median values, but they are higher than the standard deviation, which indicates, along with the values of the skewness and kurtosis tests, a normal statistical distribution of the data. Figure 2 shows the distribution plots, providing additional details about the distribution of each variable included in the dataset (renewable energy production as a natural logarithm—Ln.RP (a); renewable energy consumption—RC (b); AI investments—AI.Inv (c); AI Readiness Score—AI.RS (d); AI-related projects—AI.RP (e); CO2 emissions as natural logarithm—Ln.CO (f); GDP per capita—GDP (g)).

4.1. Robust Regression Models

The results obtained for the robust regression models estimated through the lmrob function, in R, include residual statistics (Table 3), estimated coefficients (Table 4), robust standard errors (Table 5), and t and p values (Table 6). All of these are detailed below.
Robust residuals (Table 3) measure and display the differences between the observed values and those predicted by each individual model. These values are summarized at the minimum, maximum, and median points. It is observed that for models with standardized values, the ranges between the Min. and Max. values are smaller compared to the models based on the original levels of the variables. Being within the range [−0.8714 and 1.5674] for Ln.RP_model_std and, respectively, the range [−1.6987 and 1.8114] for RC_model_std, these values suggest a good fit of the two models. Although the ranges are slightly higher in the case of the model with original values, which may suggest the existence of potential influential observations, these differences are not considered significant deviations (the significant presence of outliers is not estimated), which is why both Ln.RP_model_orig and RC_model_orig are assessed as robust models.
For all four models, regression coefficients (Table 4) were estimated to capture the effects of predictors on the explained variables renewable energy production (Ln.RP) and renewable energy consumption (RC), adjusted for robustness.
The interpretation of coefficients involves taking into account the following aspects: (i) The original models provide direct interpretations in the initial units of the variables, which is useful for immediate practical predictions for decisionmakers. However, there is a slight difficulty in interpreting the estimated coefficients for the original variables since, due to the different scales among the values of the statistical variables, the coefficients are displayed in exponential form (as an R solution for uniform representation). (ii) Standardized models are easier to interpret because all variables are brought to the same scale, but the effects of coefficients must be assessed in standard deviations. The practical utility of standardized models is determined by their ability to allow for direct comparison among coefficients, which leads to identifying the relative importance of each predictor.
Since the significance and direction of the relationships are the same (both in the original version and in the standardized version of the models), in interpreting the empirical results obtained (Table 4), we use the coefficients of the original models to show the intensity of the direct impact that each predictor has on renewable energy production (Ln.RP) compared to the impact generated on renewable energy consumption (RC). The relative importance of the variables (based on standardized coefficients) are detailed in order to identify the practical solutions that are required in order to streamline both production and consumption of renewable energy.
It is observed (from the data centralized in Table 4) that the explanatory and control variables influence renewable energy production (Ln.RP) differently from consumption (RC), as follows:
  • AI investments (AI_Inv) have a positive impact on both production and consumption of renewable energy but with different intensities.
    The Ln.RP–AI.Inv relationship is positive and highly statistically significant (p = 0.0006), where the coef. orig. = 1.102 shows that a one-unit increase in AI investments leads to a 110.2% increase in renewable energy production. The standardized coefficient = 0.269 confirms the substantial positive effect, suggesting that AI can facilitate the transition to renewable energy by offering solutions for the development of renewable energy production, along the same lines with Bennagi et al. (2024).
    The RC–AI.Inv relationship is positive, moderately statistically significant (p = 0.0114), and shows, through the coef. orig. = 12.84, that a one-unit increase in AI.Inv leads to an increase of 12.84 units in renewable energy consumption. The standardized coefficient = 0.448 confirms the moderate positive effect of AI.Inv on the RC (the fourth variable in terms of relative influence).
    From a practical perspective, these direct links suggest that AI investments are more effective in optimizing renewable energy production capacity than consumption. This differentiated impact is supported by Ahmad et al. (2021), who argued that AI’s role in energy transition operates through multiple technological channels. This aspect is normal in the initial stages of the energy transition process, as it is absolutely necessary to first expand production capacity, but, subsequently, AI investments are also required for the development and implementation of smart solutions for consumers.
  • AI Readiness Score (AI_RS) generates a positive impact that is more significant on renewable energy consumption than on production.
    The relationship between the variables Ln.RP and AI.RS is positive but with very low statistical significance (p = 0.0525). The coef. orig. = 0.02838 shows that a one-unit increase in AI.RS can lead to a modest increase of 2.84% in renewable energy production.
    The standardized coefficient = 0.1418 shows that AI.RS is the variable with the least influence on Ln.RP, suggesting that it is not just a general commitment to AI that matters but rather concrete investments and specific projects for developing new solutions for obtaining energy from different renewable sources.
    The RC–AI.RS relationship is positive and highly statistically significant (p = 0.0001), showing an important effect of AI on renewable energy consumption (coef. orig. = +1.196 increase in the RC for one unit of AI.RS). The standardized coefficient = 0.8417 confirms the strong positive effect of AI.RS on RC (the second variable in terms of relative influence).
    From a practical perspective, the causal links demonstrate that the general commitment to AI has a greater potential to influence consumption behavior, possibly through optimizing energy distribution and increasing energy efficiency at the consumer level. This aligns with Oxford Insights’ (2024) Government AI Readiness Index framework and validates H.-J. Wang et al.’s (2025a) emphasis on institutional quality in renewable energy innovation.
  • AI-related projects (AI.RP) generate a significant positive impact on renewable energy production, while the impact on renewable energy consumption is insignificant.
    The Ln.RP–AI.RP relationship is positive and highly statistically significant (p < 0.0001), showing that each AI project is important, leading to a 1.49% increase in renewable energy production (coef. orig. = 0.01485)—an aspect also confirmed by the std. coeff. = 0.2424.
    The RC–AI.RP relationship is negative (coef. orig. = −0.00391) but statistically insignificant (p = 0.956). The standardized coefficient = −0.0092 confirms that AI.RP is the variable with the least relative influence on RC.
    From a practical perspective, these statistical connections indicate that AI projects are more relevant for optimizing production than for managing renewable energy consumption, also suggesting that the impact on consumption may be indirect.
  • CO2 emissions (Ln.CO) develop a complex relationship in the empirical analysis based on a positive link with renewable energy production and a negative link with renewable energy consumption:
    The relationship between Ln.RP and Ln.CO is positive and highly statistically significant (p < 0.0001), indicating contrary to expectations that renewable energy would result in zero emissions, a direct impact of increasing CO2 as a result of increasing green-energy production (+0.49%). This finding supports the temporal lag hypothesis discussed in Mirziyoyeva and Salahodjaev (2023) and extends Hao’s (2022) observations from China to our broader international context. Ln.CO is the variable with the highest relative importance in explaining renewable energy production (std. coef. = 0.542), an effect generated by the situation where countries with higher emissions are those with a high energy need and, although they tend to invest more in renewable energy, in the short term, the share in the energy mix remains dominant in favor of fossil fuels.
    The RC–Ln.CO relationship is negative (coef. orig. = −5.789), highly statistically significant (p < 0.001) and shows an inverse impact, important to be achieved, in the form of decreasing CO2 emissions as a result of increasing renewable energy consumption. This validates the consumption–emissions reduction pathway documented by Parmová et al. (2024) in Europe and Central Asia. The substantial relative RC-Ln.CO link (confirmed by the std. coef. of −0.9086, the highest level) corresponds to the energy transition process being implemented.
    From a practical perspective, the fact that CO2 emissions have opposite links with the production and consumption of renewable energy suggests more than a temporary gap between the development of effective renewable energy generation capacity and the greening of the energy system, corroborating the complex dynamics identified by Tatar and Aydin (2023) regarding CO2 regulations driving renewable capacity expansion. At the same time, it highlights that without a strategy to eliminate and not just complement fossil energy through renewables, along with measures to improve energy-consumption efficiency, the transition to climate neutrality will not be achieved.
  • Gross domestic product per capita (GDP) develops negative relationships with both renewable energy production and renewable energy consumption but with different intensities.
    The Ln.RP–GDP relationship is negative and highly statistically significant (p < 0.0001), and it indicates an interesting inverse effect between the level of economic development of countries (GDP) and their ability to increase energy production from renewable sources. This finding challenges the linear positive relationship assumed in the economic development literature (OECD, 2024; Cozzi et al., 2024) and supports the “mature system constraints” hypothesis suggested by Ergun and Rivas (2023). Even if the size of this effect is small (coef. orig. = −0.00002141), GDP is a variable with high relative importance in the evolution of Ln.RP (std. coef. = −0.335). From a practical perspective, the negative relationship suggests that developed countries either already have mature and less flexible energy systems or have other dominant energy sources (nuclear and natural gas).
    The RC–GDP relationship is negative and statistically significant (p < 0.0001), and it indicates an inverse effect of a slightly higher intensity (coef. orig. = −0.0002932) between the level of economic development of countries (GDP) and the consumption of energy from renewable sources. These results align with Dissanayake et al.’s (2023) findings of inconsistent relationships between economic growth and renewable energy adoption across various development levels. The standardized coefficient = −0.6517 shows a medium relative importance of GDP in influencing the evolution of the RC. From a practical perspective, developed countries seem to be more resilient to energy transition, most likely due to their mature energy systems and infrastructure adapted to high consumption needs, coupled with the high costs involved in energy transition (especially in the industrial area).
The general quality of all models (Table 5 and Table 6) is good. The Ln.RP model is, however, more performant in terms of explanatory power compared to the RC model, indicating a greater cumulative influence of artificial intelligence on renewable energy production than on green-energy consumption.
The Ln.RP model (with original and standardized values) has a very good adjusted R-squared value of 0.863, indicating that approximately 86.3% of the variation in renewable energy production is explained by the model, while the RC model (original and standardized) has a moderate adjusted R-squared of 0.503, explaining approximately 50.27% of the variation in renewable energy consumption.
Both models have converged after a reasonable number of iterations (14 for Ln_RP and 40 for RC), and the distribution of residuals is relatively symmetrical. The robustness weights (Table 6) show that most observations (114 and 109) have weights close to 1. The presence of outliers in the data is indicated, but the regression models have treated them appropriately.
The similarity in key statistical values confirms that each pair of models (with original and standardized values) are, in fact, the same analysis expressed in two different ways, offering complementary perspectives on the relationships among variables.
Statistical tests have validated the robustness of these models. From the graphs centralized in Figure 3, Figure 4, Figure 5 and Figure 6, the following aspects emerge:
  • For the Ln_RP model (both original and standardized) (Figure 3 and Figure 4), the residuals vs. fitted graph shows the existence of a few (3) potentially influential observations, an aspect also confirmed by Cook’s distance; the normal Q–Q plot suggests a slight deviation from normality at the tails, while the scale–location plot indicates some heteroscedasticity;
  • For the RC model (both original and standardized) (Figure 5 and Figure 6), the residuals vs. fitted graph indicates three observations as potentially problematic, with their presence also being confirmed by the scale–location and Cook’s distance, and the normal Q–Q plot shows a better alignment with the normal distribution compared to the Ln_RP model.
The empirical results obtained through robust regression are in line with the specialized literature (Bishaw, 2024; Onwusinkwue et al., 2024; Rashid et al., 2024), indicating that there is a positive link between the development of artificial intelligence and energy transition indicators. Moreover, they contribute to deepening knowledge through additional information regarding a substantially greater statistical influence of AI on green-energy production capacity compared to clean-energy consumption. These differentiated pathways confirm our theoretical framework and demonstrate robustness across multiple diagnostic tests, including Cook’s distance outlier detection and VIF multicollinearity assessments, as presented in Table 7, supporting Hypotheses H1 and H2.
The role played by AI in accelerating the energy transition was further investigated by including in the analysis the entire contribution (both direct and as a facilitator, mediator) of all variables.

4.2. Gaussian Graphical Model

The Gaussian graphical model (GGM) estimated at the level of the dataset (Figure 7) reflects a dense network among the seven nodes (variables) that contains 18 non-zero edges out of a possible 21 (a sparsity of 0.143). In other words, the GGM network confirms the close dependency between the analyzed variables, bringing additional clarifications by simultaneously highlighting the direct and indirect conditioning among them. This network density exceeds the typical sparsity levels reported in energy system studies (Hevey, 2018), suggesting stronger interdependencies than previously documented. As expected, there are both positive links (represented by blue arcs) and negative ones (represented by red arcs) among variables, with the control variables (GDP and Ln.CO) being those that predominantly develop negative links. The intensity of the causal relationships is highlighted by the thickness of the arcs.
It is noted that the AI variables tend to group into a cluster, with strong connections among them. This aspect suggests that AI investments, AI Readiness Score, and AI-related projects influence each other; however, the degree of the development of AI infrastructure and capabilities (as measured by AI.RS) seems to be a key factor (a bridge) that facilitates the relationship between AI investments and the practical implementation of projects (AI.Inv–AI.RS–AI.RP).
Furthermore, the more central position of AI.RS (compared to AI.Inv and AI.RP), determined by the larger number of connections formed with other variables in the network, strengthens the importance and also the necessity of improving the AI Readiness Score (through education, infrastructure, and regulations) in order to increase the influence on the energy and economic sectors. Another important aspect to mention is that in the structure of the GGM network, the direct links between AI indicators and those of energy transition are polarized: only AI.RS develops direct links with RC (mediating the links for AI.Inv and AI.RP), while renewable energy production (Ln.RP) is directly influenced only by AI.Inv and AI.RP (mediating the influence of AI.RS).
The contribution of AI to energy transition and, implicitly, to decoupling economic growth from CO2 emissions is highlighted by the following direct and indirect (mediated) links: The positive links RC, AI.RS, and GDP, which highlight the fact that by developing systemic AI capacity (rendered by AI.RS), renewable energy consumption can be made more efficient and economic growth can be achieved. This mediation pathway provides empirical support for the theoretical frameworks proposed by Danish and Senjyu (2023) regarding AI-enabled energy policy. In the absence of this AI infrastructure, the increase in renewable energy consumption puts great financial pressure on GDP, causing its reduction (the direct relationship between RC and GDP is negative).
The links between RC–AI.RS–AI.Inv and RC–AI.RS–AI.RP are positive and emphasize the fundamental importance of the level of AI readiness (AI.RS) in the successful implementation of this new technology through investments (AI.Inv) and concrete projects (AI.RP) designed to contribute to increasing the share of renewable energy in total consumption (note that there is no direct link between RC and AI.RP, and between RC and AI.Inv the link is extremely weak, almost non-existent). The mediating role of AI.RS among these variables suggests that the mere existence of investments or projects is not sufficient without a well-prepared and regulated ecosystem in the AI field.
The mixed links between Ln.RP and RC and Ln.CO indicate, through the mediating role of RC, that the reduction in carbon emissions is determined by increasing the share of green-energy consumption (RC–Ln.CO negative link) under the prior conditions of increasing the amount of energy produced from renewable sources (Ln.RP–RC positive link). The activities of increasing clean-energy production capacities are not identified as being completely climate neutral (Ln.RP–Ln.CO positive link), with the achievement of climate neutrality being conditioned also by consumption.
The complex direct and indirect links between the variables regarding AI and renewable energy confirm the recent literature’s findings on the contribution of AI to increasing green-energy production (Rashid et al., 2024; Rinchi et al., 2024), as well as to optimizing its consumption (Biswas et al., 2024; Pasqualetto et al., 2024) and minimizing the impact of economic growth on the environment (Rashid et al., 2024; Garric & Piquard, 2024). Moreover, the Gaussian graphical model identifies AI readiness (AI.RS) as the critical mediating variable with the highest betweenness centrality, bridging investments and projects with energy outcomes through complex network interactions, which is consistent with Hevey (2018) and extends beyond the simple correlations reported in prior studies (Mirziyoyeva & Salahodjaev, 2023). The network structure reveals 18 non-zero edges out of 21 possible connections, with validation through EBIC optimization and stability assessments confirming hypothesis H3 regarding AI’s systemic mediating role.
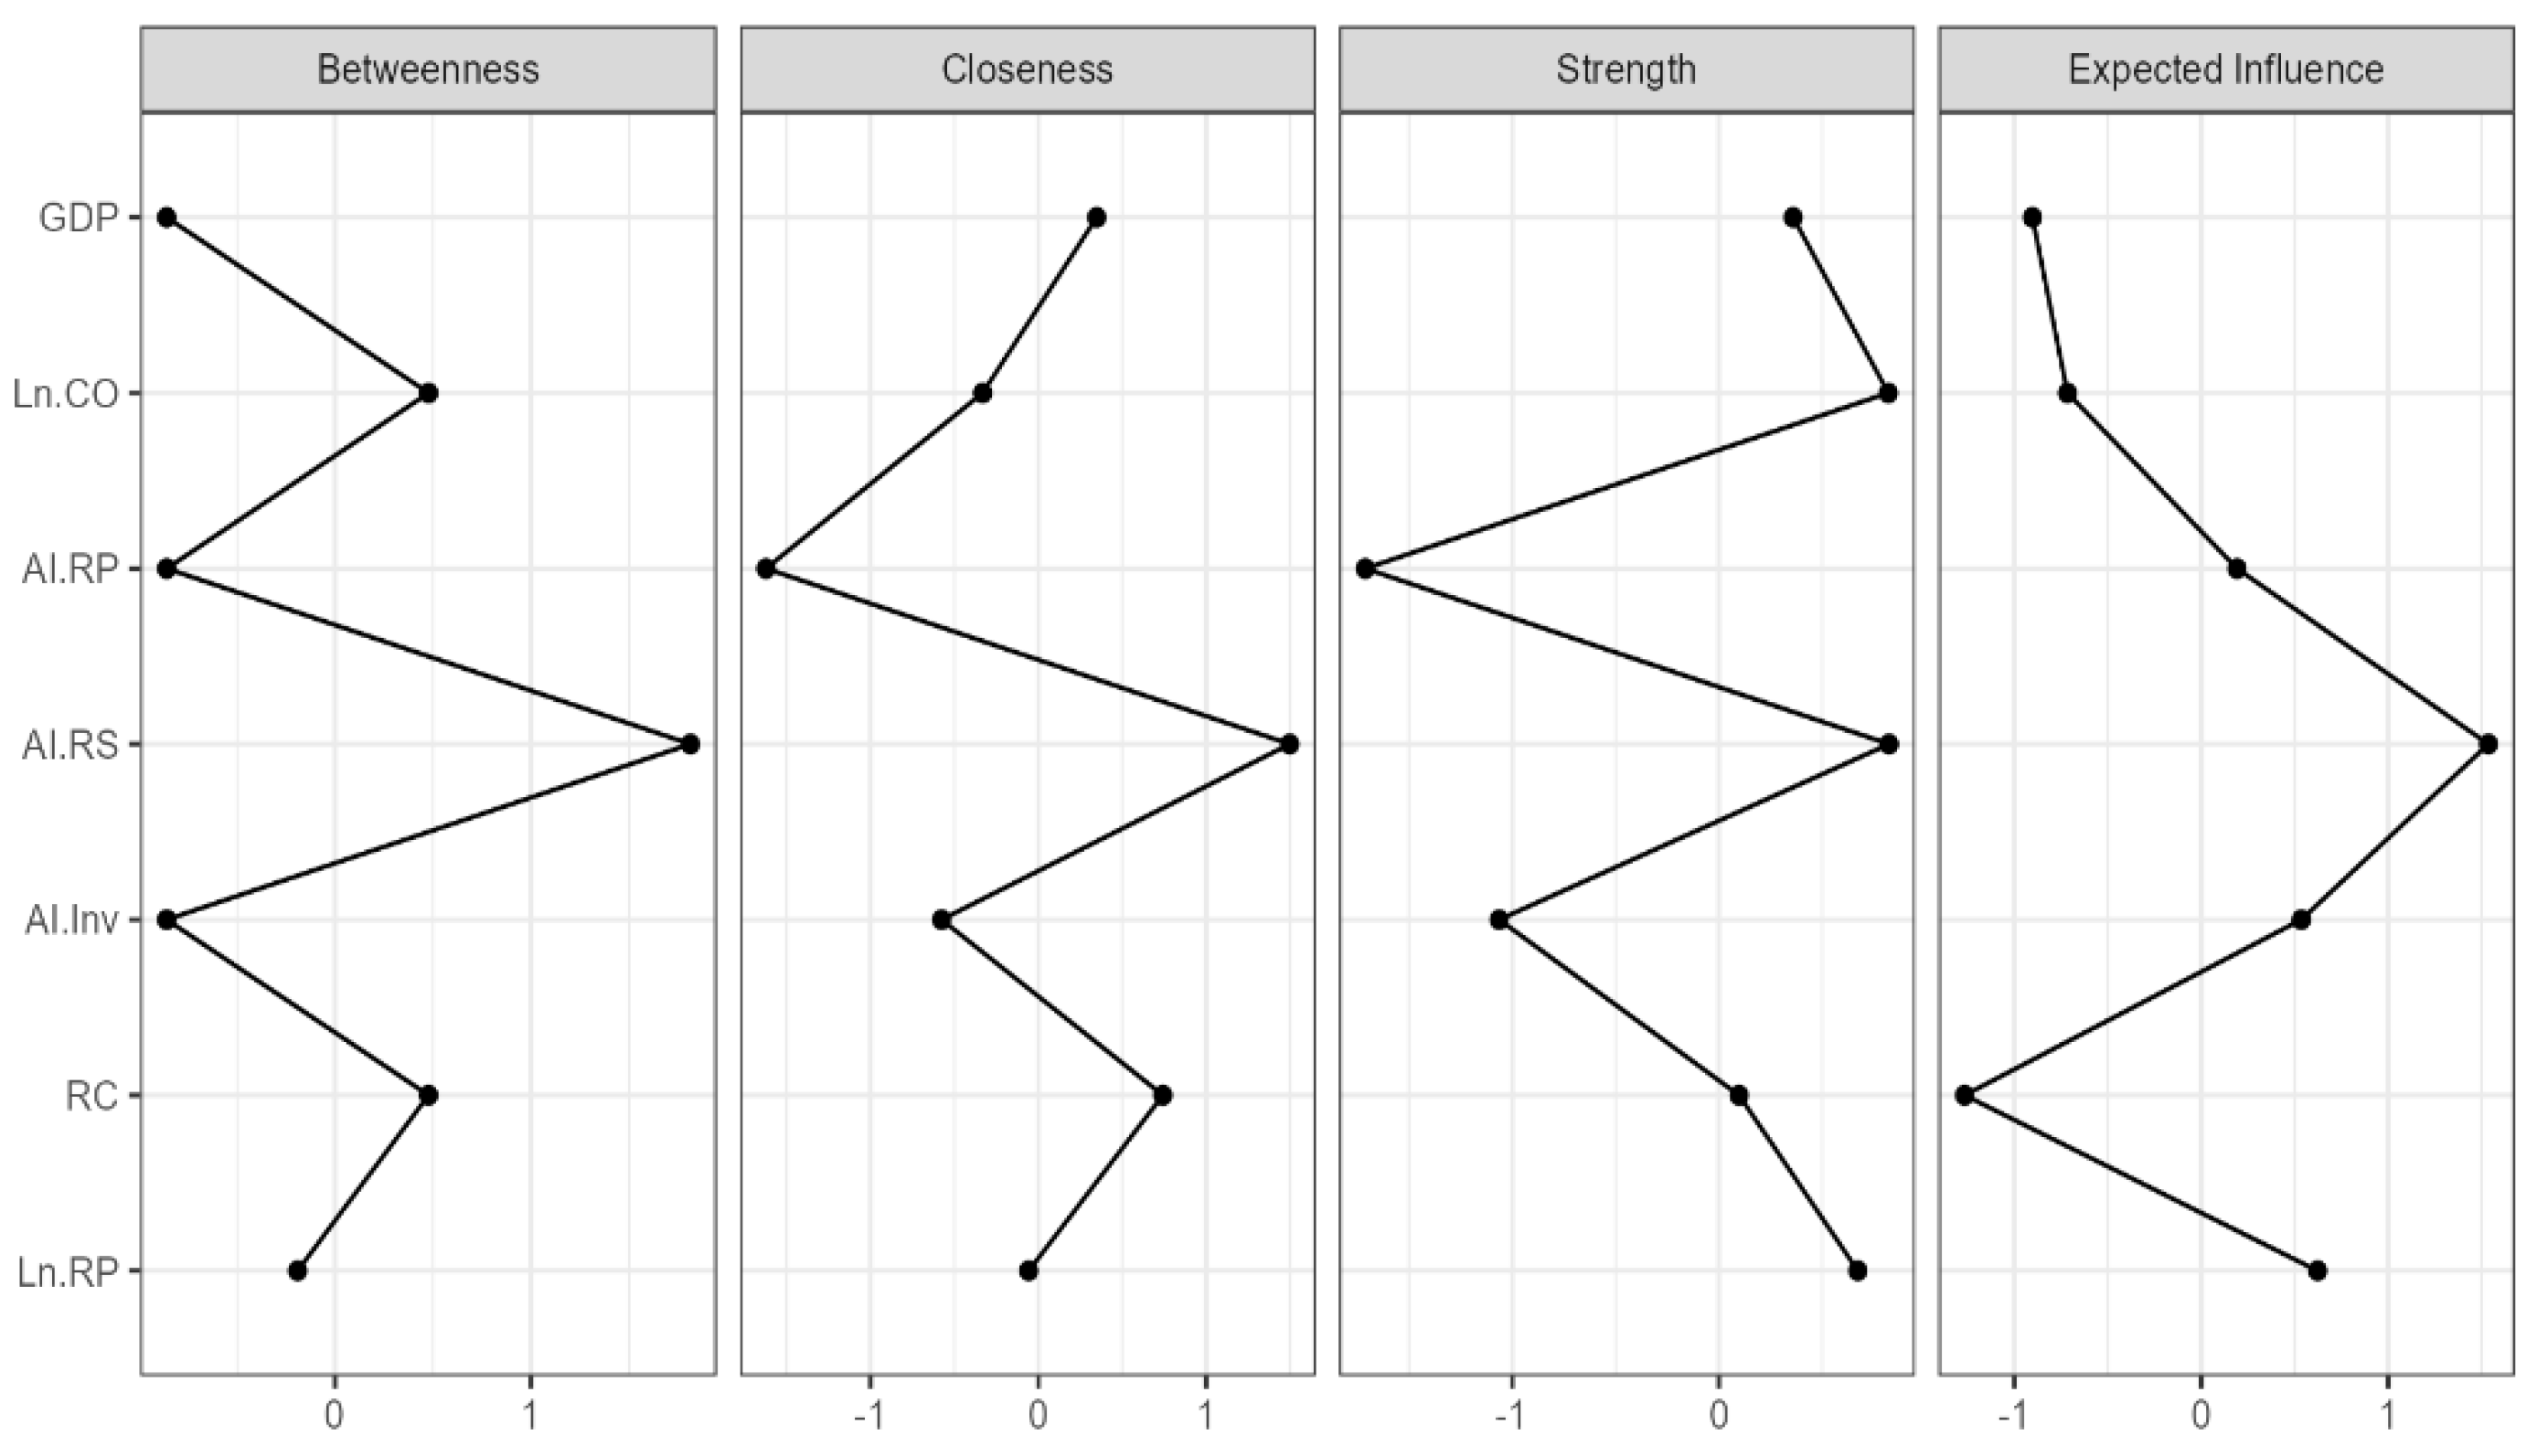
The measures centralized in Figure 8 confirm the important mediating role (highest betweenness value) but also the high capacity to influence the system (highest closeness value) of AI.RS and suggest that improving AI readiness could have the most significant positive impact (expected influence) on decoupling economic growth from carbon emissions by making the energy transition more efficient. Also, the lowest (negative) value recorded by the expected influence for the RC confirms the quality of being “strongly influenced” and not “influencing” of this variable, with practical implications for policymakers regarding energy transition.
The results of the GGM analysis validate hypothesis H3, the model providing valuable empirical evidence for understanding the complex inter-linkages between AI, renewable energy, and economic factors. At the same time, it contributes to enriching the emerging literature on the role of technologies in the transition toward a sustainable future and supports the activity of developing integrated and effective policies in the field.

4.3. Cluster Analysis

Cluster analysis provides us with valuable information regarding the degree of convergence in the field of artificial intelligence development and energy transition at the level of EU states, Great Britain, China, and the USA. This approach aligns with the archetype-based methodology suggested by Alotaiq (2024) for identifying distinct energy transition patterns across countries. All scientific variables (Table 1) were included in the investigation, using standardized values in the analysis and clustering stage (identifying similarity patterns through a balanced contribution of each variable) and original values in characterizing the formed clusters (interpreting patterns).
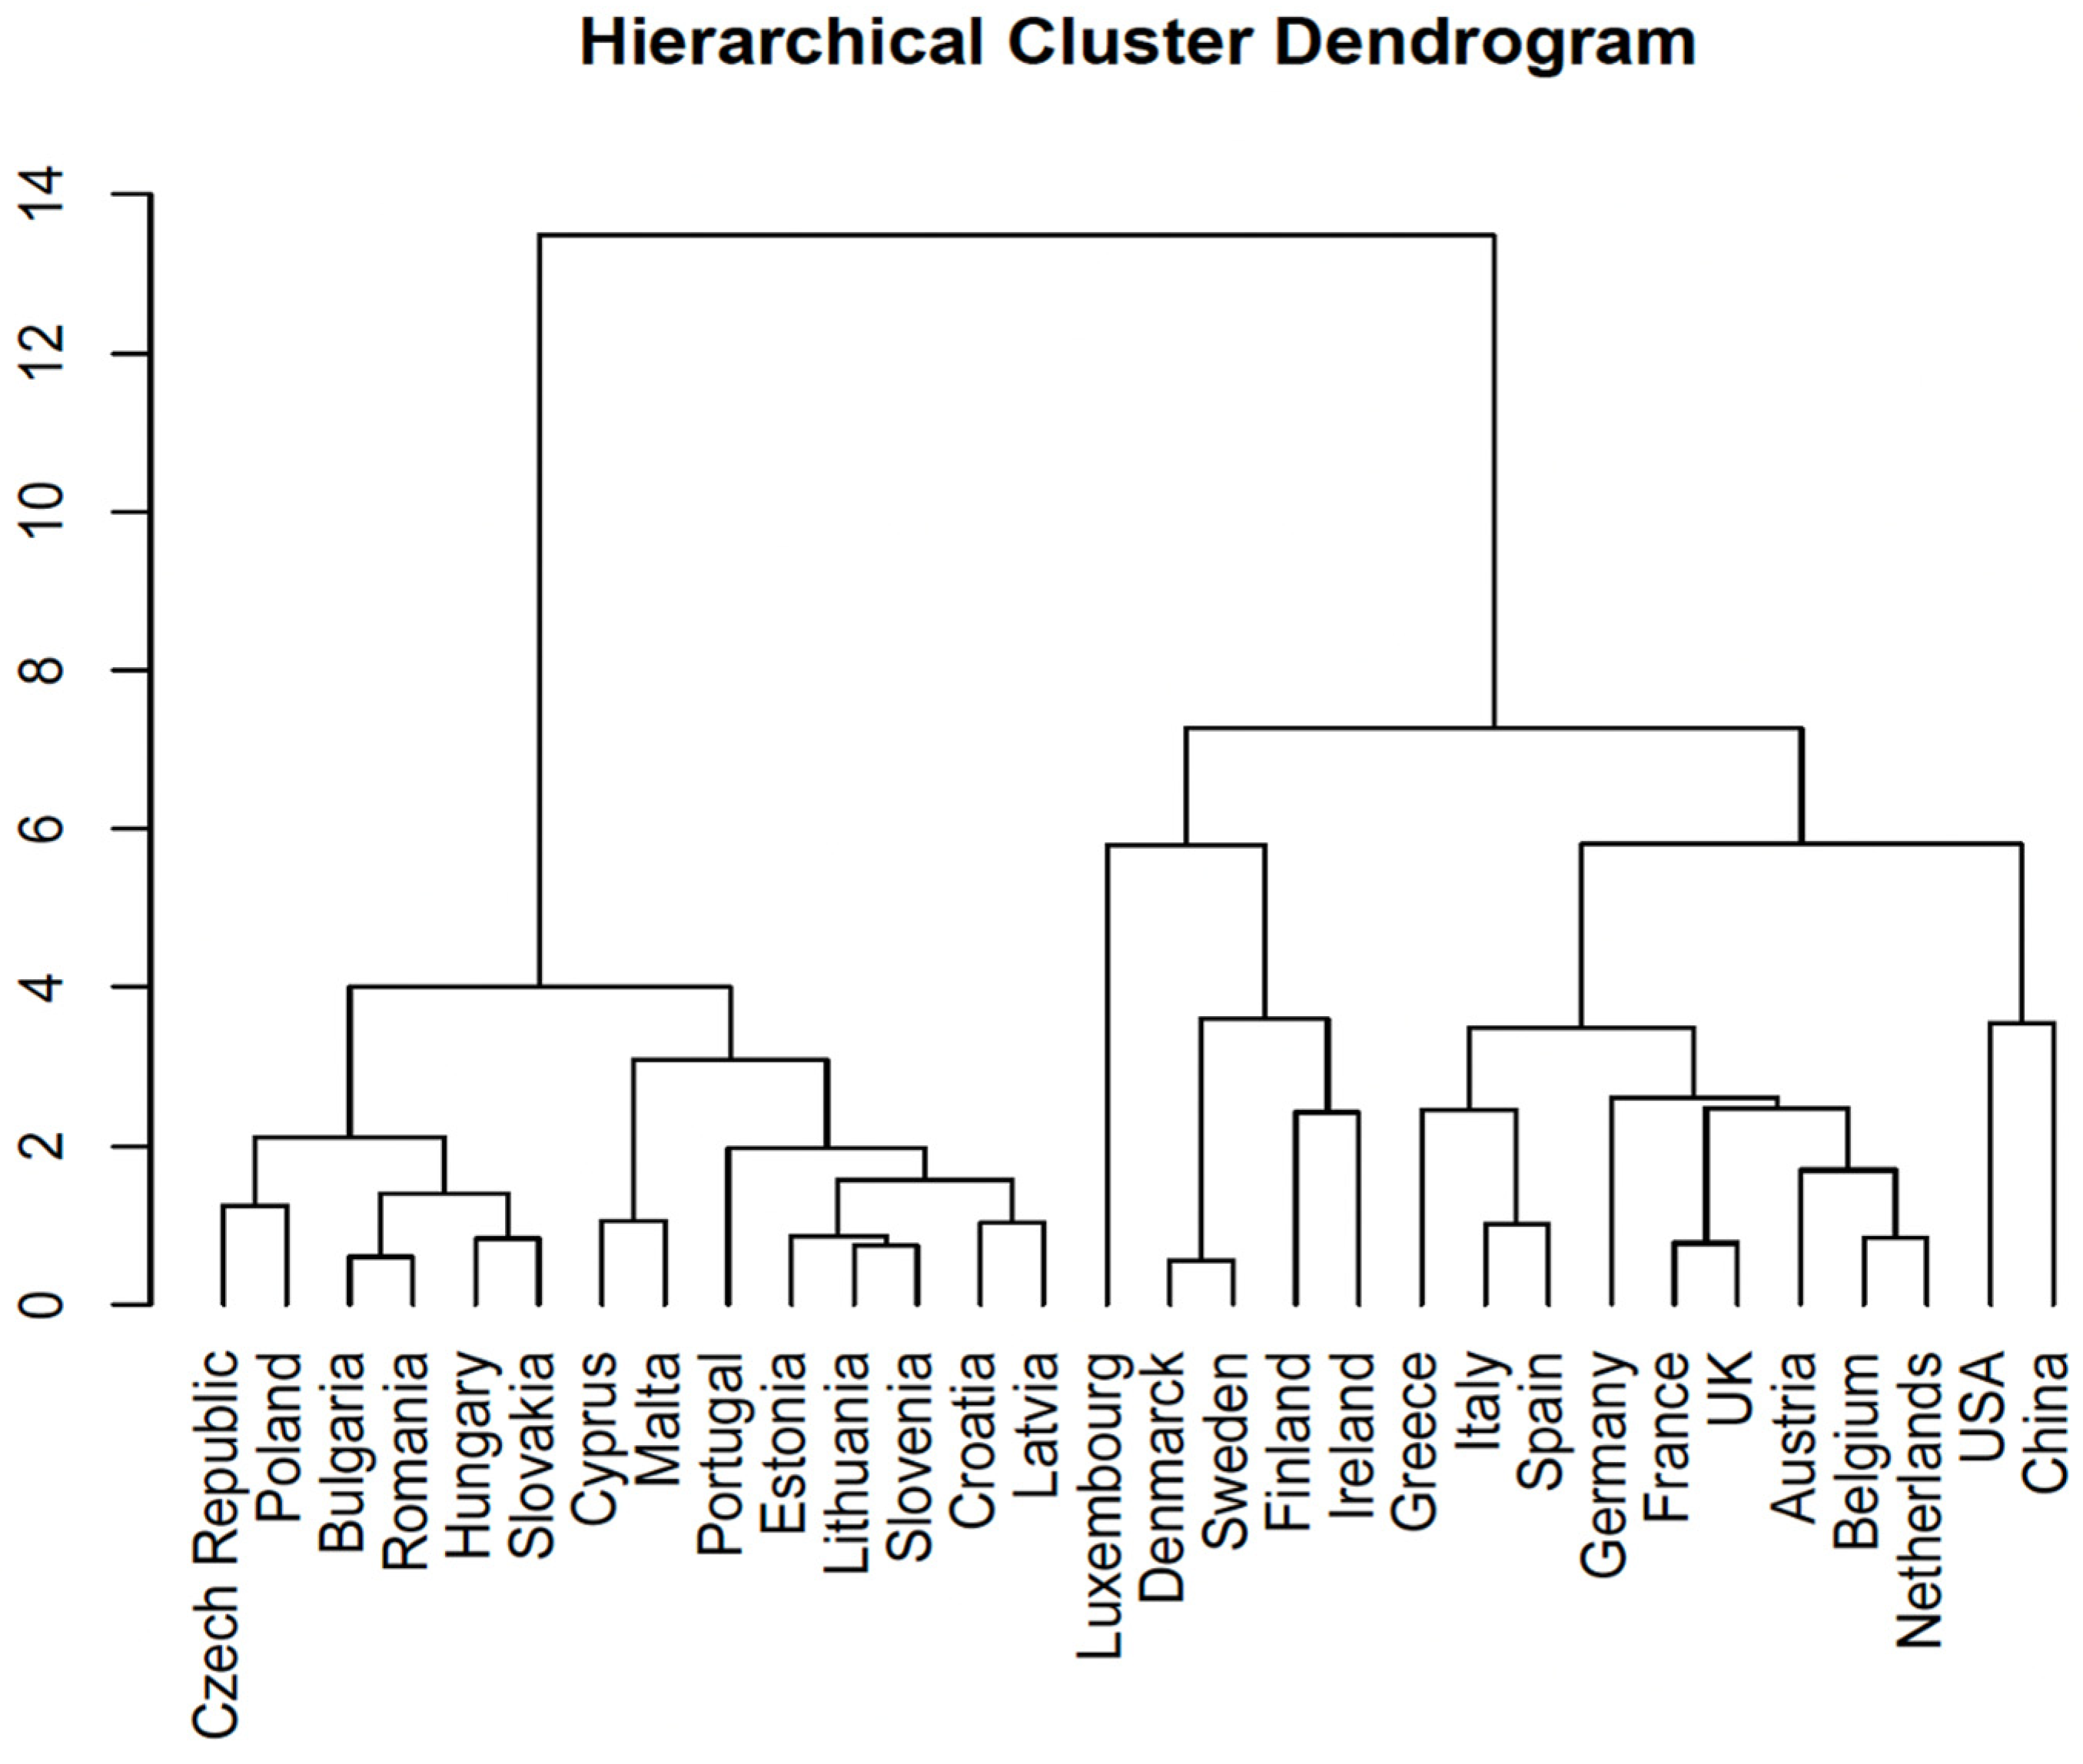
Cross-sectional cluster analysis was performed for the most recent year (2023) with the aim of identifying the current structure of the data in relation to existing similarities and implicitly, the grouping mode of countries. The dendrogram (Figure 9) provides a first visualization of the possible natural groupings of the data and hierarchical relationships among countries in relation to the common features. The height of the vertical lines highlights that the greatest dissimilarity between clusters is obtained in the situation of organizing countries into two large groups.
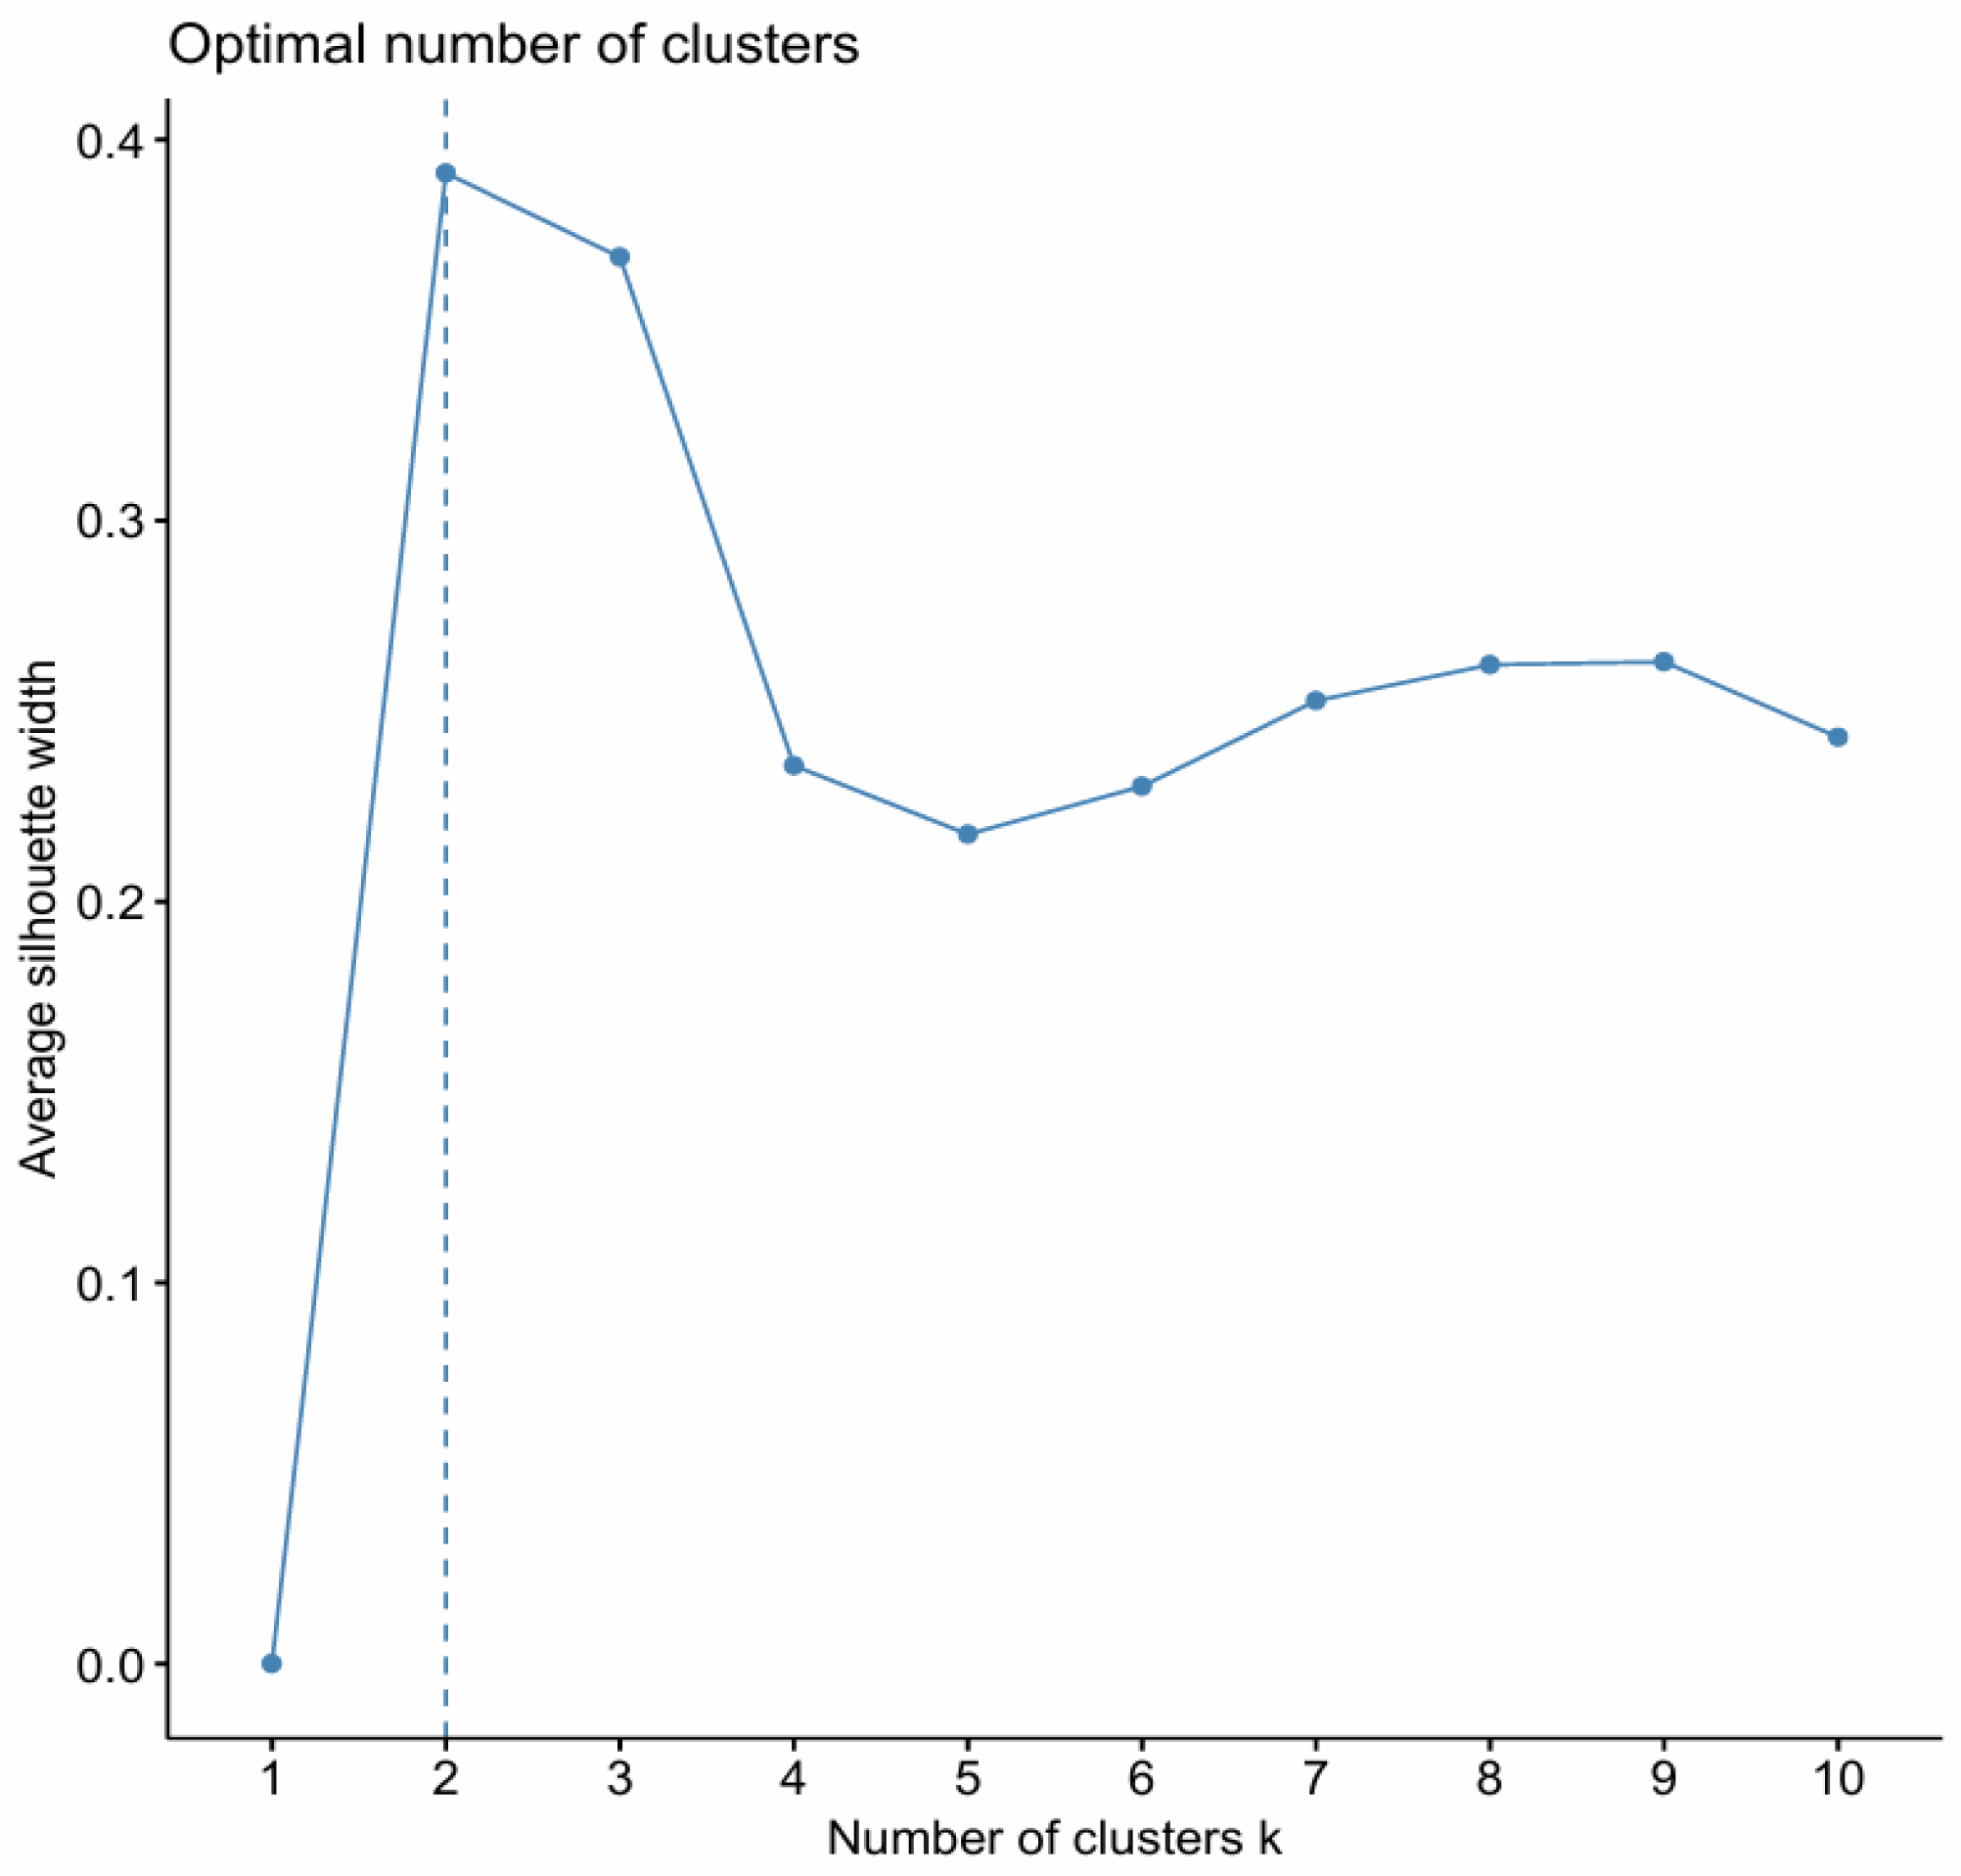
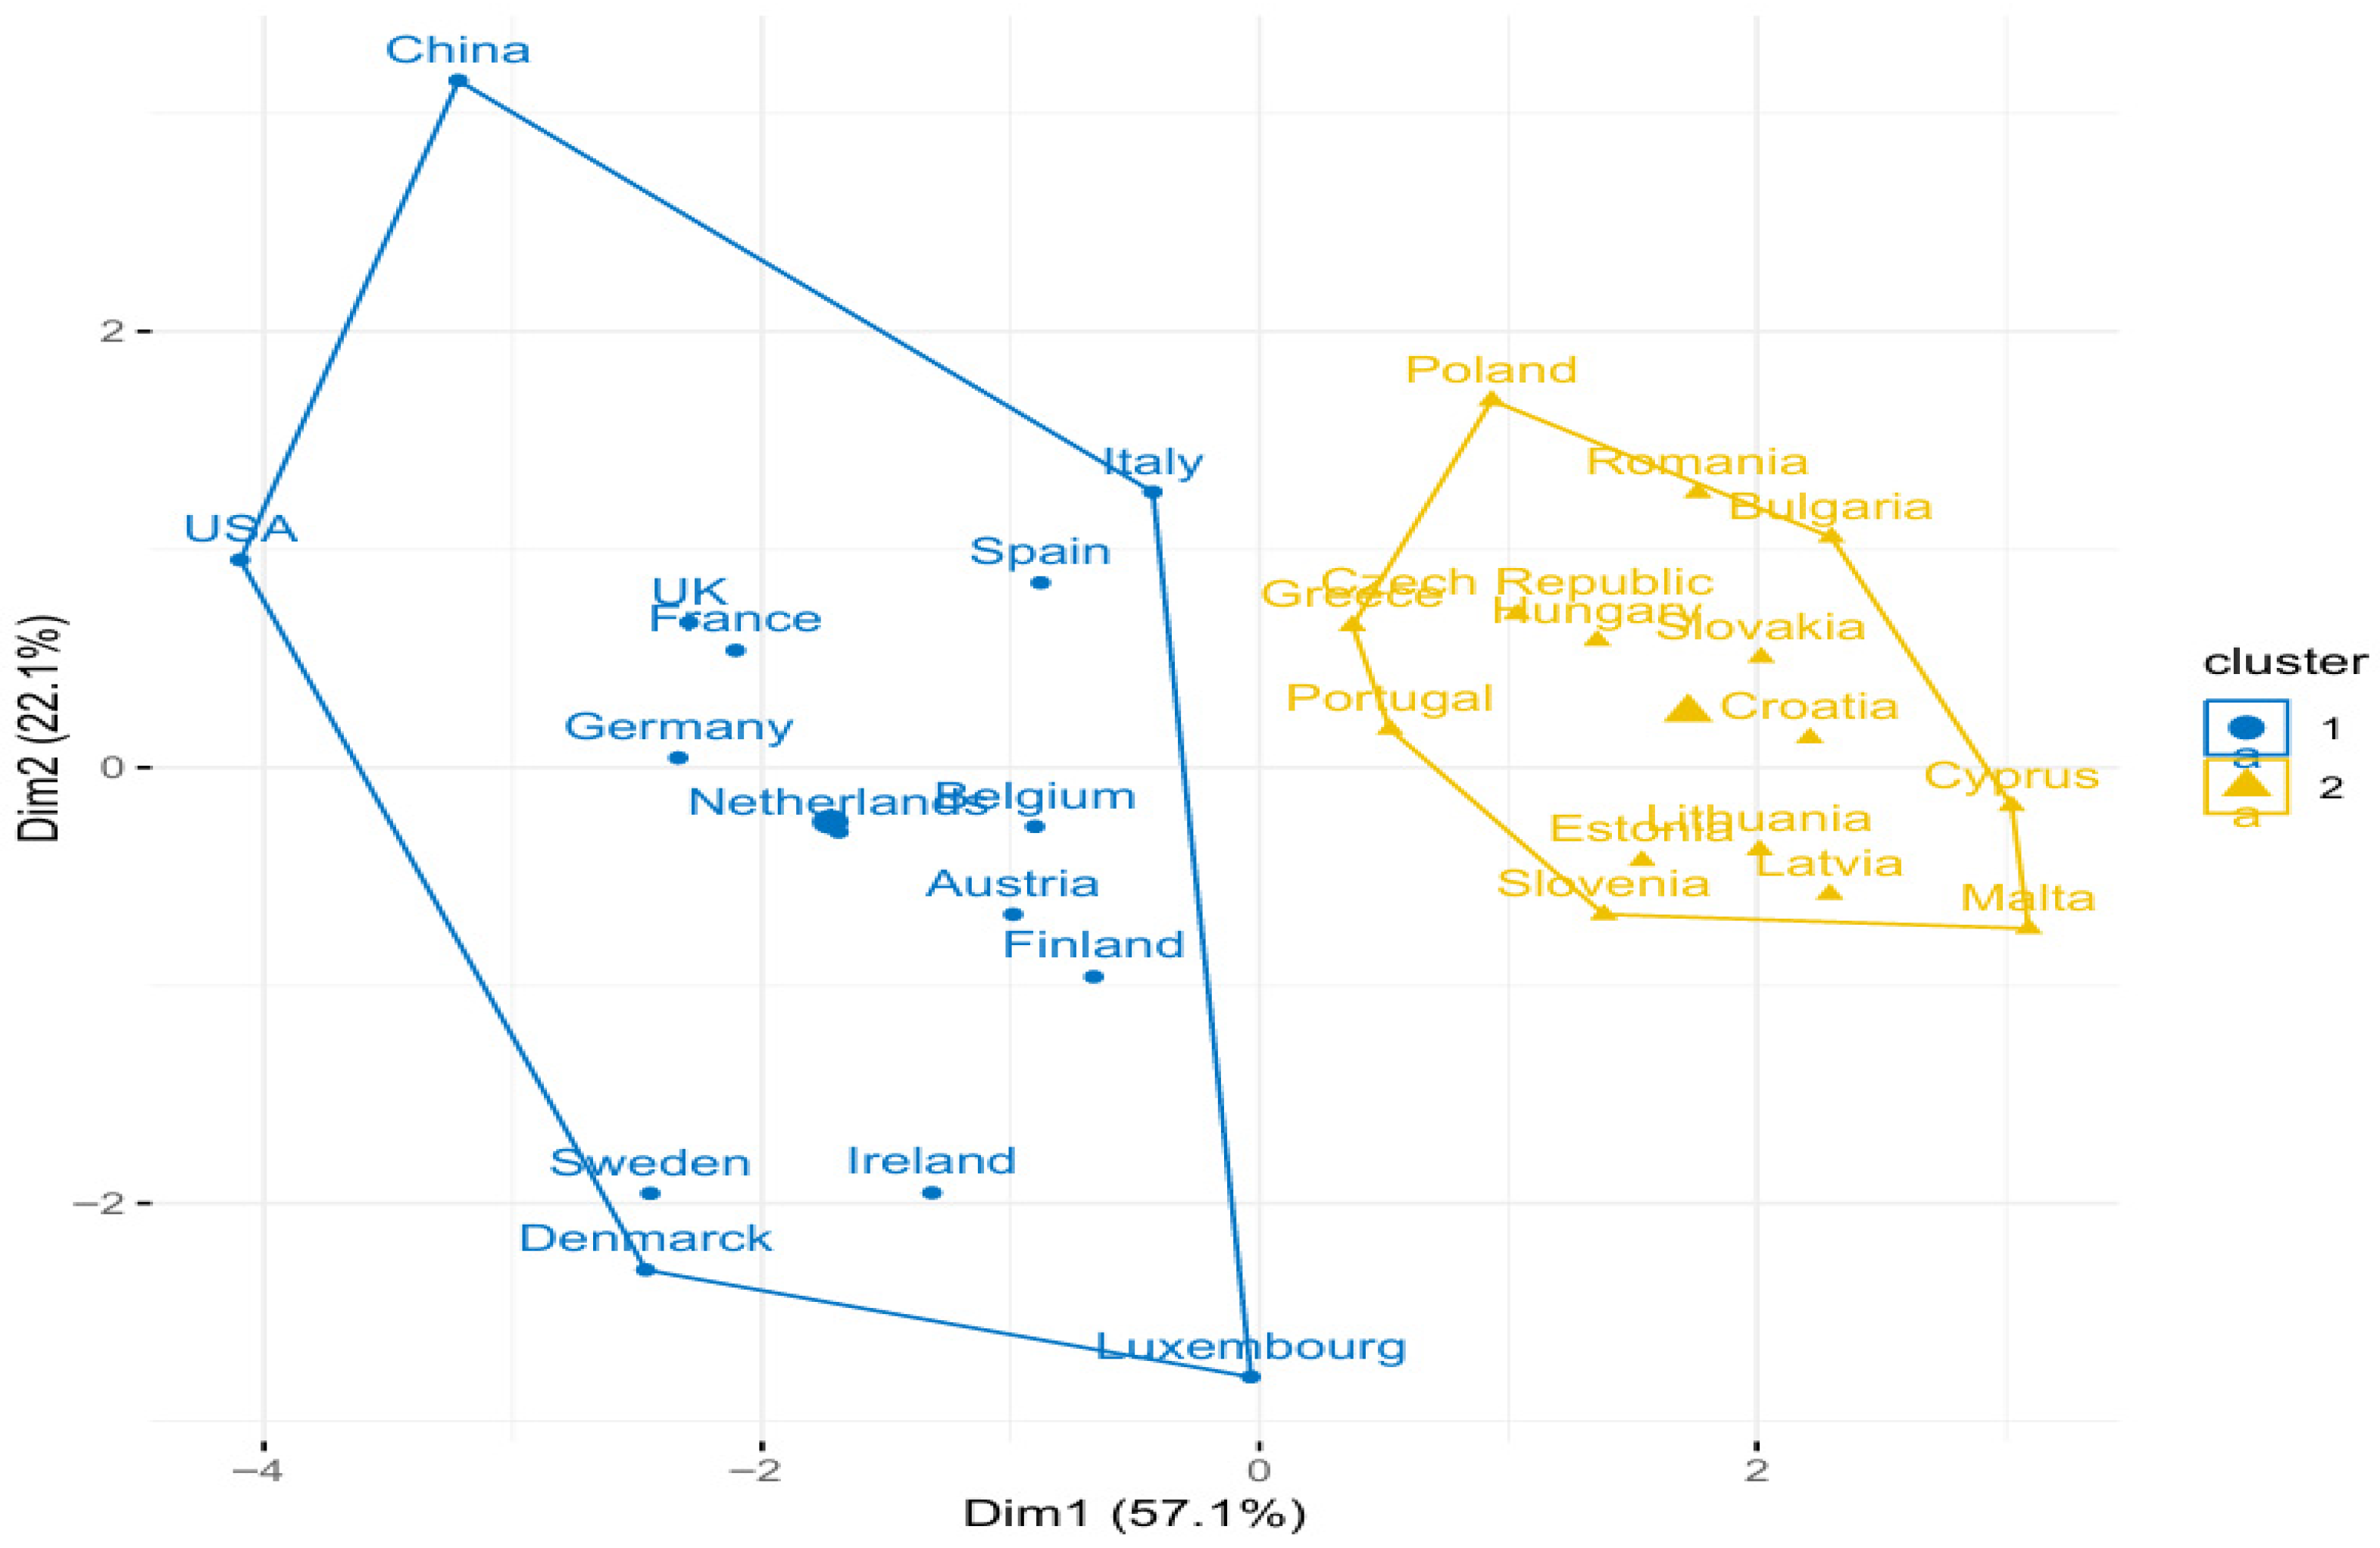
The Silhouette plot (Figure 10) confirms that the optimal number of clusters is two (it has the highest value of the average silhouette width, approximately 0.4). Applying the K-means algorithm (k = 2) led to the effective grouping of countries into two clusters (Figure 11), with an equal numerical component (15 countries each), in the following structure:
Cluster 1 (blue dots) contains economically advanced and medium-sized economies that are innovative in terms of AI, as follows: China, USA, Germany, Great Britain, France, Italy, Spain, Austria, Belgium, Finland, Ireland, Netherlands, Sweden, Denmark, and Luxembourg.
Cluster 2 (yellow triangles) contains smaller, developing economies and also aspirants to recover the economic and technological (AI) gap: Czech Republic, Hungary, Slovenia, Portugal, Greece, Cyprus, Malta, Estonia, Latvia, Lithuania, Poland, Romania, Bulgaria, Slovakia, and Croatia.
To better understand the composition of clusters and their distinctive characteristics, as well as the criteria that underpinned their grouping, we next calculated the means for each cluster and the difference among the standardized means (Table 8).
To identify which of the variables had the greatest influence on forming the clusters, we proceeded to analyze the differences between the cluster means for each standardized 2023 variable (used in the clustering stage). Based on the results obtained (Table 8), it is observed that AI indicators had the greatest influence in separating the clusters (1—AI.RS; 2—AI.RP; and 3—AI.Inv), followed by the level of economic development of each country (4—GDP). At the opposite end was renewable energy consumption, with the least influence.
Knowledge of the homogeneity criteria and their importance in grouping countries at the level of each cluster allowed us to highlight the key differences between the two formed groups (clusters).
Artificial intelligence, through specific indicators, demonstrates the existence of a higher average AI engagement score for Cluster 1 (82.57) compared to Cluster 2 (67.91); an almost double average number of AI projects in Cluster 1 (81) compared to Cluster 2 (38); and average AI investments almost double in Cluster 1 (1.43) compared to Cluster 2 (0.79).
From a practical perspective, it can be said that there is a significant technological gap between the two groups of countries. Countries in Cluster 1 have a high degree of development and adoption of AI technologies, with the USA and China being detached leaders, followed by Germany and France with values above the cluster mean.
In terms of the level of economic development, Cluster 1 records an average GDP/capita (59,062 USD) 2.58 times higher compared to the average GDP/capita of Cluster 2 (22,881 USD). These data confirm the existence of a direct correlation between the economic development of countries and investments in AI. In other words, the major economic powers also share digital supremacy.
Renewable energy and CO2 emissions are the last clustering criteria and indicate a significantly higher average renewable energy production in Cluster 1 (4.3353) compared to Cluster 2 (2.2550) and an average renewable energy consumption has a share 5.49% higher in Cluster 1 (34.53%) compared to Cluster 2 (28.86%), while CO2 emissions are, on average, 1.8798 higher in Cluster 1 (5.1221) compared to Cluster 2 (3.2423), reflecting the more pronounced impact of developed economies on the environment.
Cluster analysis highlights a substantial difference between the two groups of countries, in terms of economic development, interest given to artificial intelligence, and progress obtained in energy transition. At the same time, it confirms AI’s ability to facilitate energy transition and, implicitly, to contribute to the climate neutrality of economic growth. Moreover, cluster analysis offers a relevant perspective on the global landscape but requires careful and nuanced interpretation, especially from the perspective of division into two groups, innovators and aspirants, as a result of specific economic and technological realities.
Within the innovator group there are significant differences that deserve analysis. On the one hand, the digital giants, the USA and China, which dominate global AI development, are notable but with fundamentally different approaches. This divergence reflects the competitive dynamics documented by Castro et al. (2019) in their analysis of global AI leadership. The American model is centered on innovation led by the private sector, with tech giants in leadership roles, while the Chinese model involves strategic orchestration at the state level, with massively centrally coordinated investments. Both models generate impressive results but with distinct compromises in terms of innovation, accessibility, and governance. In contrast, European countries in this cluster (Germany, France, and Great Britain) present a more complex and less optimistic reality than their simple inclusion in the innovator group suggests. These do not have mature AI ecosystems but rather fragments of ecosystems under development, with significant gaps compared to global leaders. Although these countries have ambitious energy policies, the effective integration of AI in their energy transition is still in the incipient phase. The challenges faced by these countries are multiple, represented by the fragmentation of research and innovation efforts, venture capital deficit compared to the USA, talent migration to technology hubs outside Europe, regulatory barriers that slow adoption in the energy sector, and a persistent gap between academic research and industrial implementation.
The recently adopted European AI Act (European Union, 2024) illustrates this tension between the desire to prudently regulate and ambitions to stimulate innovation, with still unknown implications for energy transition. Nordic countries deserve a separate mention. Thus, Sweden, Finland, and Denmark have developed specific niches in AI applications for energy efficiency, leveraging the advantages of digitalized societies and energy systems already advanced in transition.
The aspirant group, predominantly formed of countries from Eastern and Southern Europe, presents its own important nuances. Countries such as Estonia, Slovenia, and the Czech Republic demonstrate a potential for accelerated convergence and could leverage the latecomer advantage, directly adopting cutting-edge technologies and practices, without the burden of legislative and regulatory systems that slow transformation in more developed economies.
Even though AI development is the main differentiating factor between countries (the main criteria for forming the two clusters), a “Geographic–Economic” pattern can also be highlighted, in which Cluster 1 can be considered the “Giant-Innovators Group” bringing together the USA and China, alongside Western and Nordic European countries, and Cluster 2 can be marked as the “Catch-Up Group” predominantly bringing together countries from Eastern and Southern Europe. In the perspective of this pattern, the conclusion emerges that the “digital divide” largely follows the traditional lines of economic development.
Cluster analysis identifies two distinct country groups—AI innovators versus aspirants—with AI indicators serving as primary differentiating factors (AI.RS difference: 1.75 standard deviations), supporting the archetype-based approach suggested by Alotaiq (2024) while extending beyond traditional panel regression studies that ignore development heterogeneity (Caldera et al., 2024). The optimal two-cluster solution (Silhouette width: 0.4) demonstrates robustness through dendrogram visualization and K-means validation, revealing systematic patterns in AI-energy transition convergence. The clustering also allowed us to highlight key aspects that will shape the economic, technological, and social future of states. While the study focuses on specific countries, these perspectives provide insights that can be relevant for other countries with similar economic structures, energy systems, and geopolitical contexts. However, differences in national policies, technological adoption, and energy infrastructure may limit direct generalization, and these factors should be considered when applying the results to other contexts.

5. Conclusions

The energy transition from fossil fuels to renewable sources requires innovative solutions, with AI emerging as a key enabler for optimizing consumption, integrating renewables, and managing smart grids (EC, 2018; IEA, 2021). Despite challenges posed by inflation, rising financing costs, and political uncertainties, AI holds significant potential for advancing sustainable energy systems and economic development. Ongoing global competition and the pursuit of energy security further reinforce the importance of analyzing AI’s role in the energy transition.
Based on a robust and advanced methodology, the research provides valuable empirical and practical contributions. From a theoretical perspective, this study makes significant contributions to the field of knowledge regarding the AI contribution, both direct and indirect to the decoupling of economic growth from carbon emissions.
A notable methodological contribution is the complementary approach combining the rigor of robust regression with the mediation analysis capabilities of Gaussian graphical modeling and the analytical power of clustering to identify convergence patterns. The findings from this methodological triangulation extend beyond simple input–output relationships to reveal complex network impact in energy transition.
Based on the robust regression results, it was concluded that AI affects renewable energy production and consumption through distinct pathways, with investments and concrete projects directly driving production capacity (coefficient: 1.102, p < 0.001) while AI readiness infrastructure primarily influences consumption optimization (coefficient: 0.842, p < 0.001). The Gaussian graphical model analysis reveals AI readiness as the critical mediating variable, bridging investments, projects, and energy outcomes in a complex network structure that validates institutional theory predictions about technology adoption pathways. The clustering analysis confirms that successful energy transitions require coordinated action, with countries needing differentiated strategies based on their AI-energy transition position—investments and projects for production enhancement and systemic readiness for consumption optimization.
Robustness checks using alternative AI indicators, subsample analysis excluding major powers, and bootstrap confidence intervals confirm our main results across different specifications. Second, although the empirical evidence focuses on the EU, the USA, the UK, and China, the findings can offer insights for other economies. In particular, the differentiated role of AI—where capital investment primarily drives production while readiness and institutional capacity shape consumption—can inform policy design in emerging economies or regions with different levels of digital maturity. Such transferability, however, should be applied cautiously, taking into account local institutional, economic, and infrastructural contexts.
For policymakers, the empirical evidence suggests that allocating resources to AI investment is not sufficient without parallel development of skills, infrastructure, and regulatory frameworks that enable effective energy consumption management. For countries at different stages of digital development, the analysis also underscores the importance of tailoring policies to local contexts rather than applying one-size-fits-all strategies.
Every scientific study must acknowledge its limitations, and this one is no exception. The main constraints lie in the four-year timeframe and the methodological challenges of measuring AI development at the national level. Recognizing these limitations does not diminish the research’s value but instead supports proper contextualization and identification of future research directions. Aggregated national data may obscure regional and sectoral disparities, such as urban–rural gaps and differences across economic sectors in AI adoption and energy efficiency. Establishing causality remains an open challenge for future research, as unobserved factors—like innovation culture or governance quality—may influence both AI development and energy transition progress. Despite these constraints, emerging data and evolving AI technologies offer opportunities for future research, with expanded indicators, time horizons, and more detailed analyses.
Future research directions include expanding the temporal and geographic scope with longitudinal studies over 10–15 years and incorporating emerging economies from Africa, Asia, and Latin America. Refining indicators to measure AI implementation and differentiating between AI types (machine learning, expert systems) can clarify their impacts on the energy transition. Advanced modeling, including spatial econometrics and network analysis, can capture dynamic and non-linear effects, while causal inference methods (e.g., difference-in-differences, instrumental variables) can strengthen causal claims. Finally, investigating socio-economic dimensions—such as labor market effects, equitable distribution of benefits, and ethical implications—using microsimulation techniques can provide a more comprehensive understanding of AI’s role in energy transitions.
Maximizing AI’s potential for the energy transition requires coordinated action from all relevant actors. Based on the research findings, the following differentiated recommendations are proposed for governments, energy companies, research institutions and universities, and international organizations.
For governments and public authorities, actions to leverage AI’s potential for the energy transition should include the following: integration of AI into national energy transition strategies; creation of dedicated R&D funds; introducing tax incentives for AI investments; development of national training programs in digital skills; and new regulations to facilitate AI adoption in the energy sector.
For energy sector companies, measures to capitalize on AI potential should address the following aspects: a sequential approach starting with pilot projects; investments in digital infrastructure; partnerships with AI startups; AI training programs; and applying comprehensive cost–benefit evaluation methods.
Research institutions and universities also play a crucial role in harnessing AI’s potential for an efficient energy transition which involves the following: developing interdisciplinary education programs; establishing applied research labs/centers dedicated to AI applications in energy transition; impact-oriented research; and independent technology assessments.
International organizations can support AI adoption in energy transition through the following: developing common standards for AI assessment and implementation; facilitating knowledge and best-practice exchange among countries; promoting context-specific approaches that respect national and regional priorities; and providing flexible financing mechanisms adapted to current economic realities.
As AI technologies continue to evolve and energy transition urgency intensifies, this research demonstrates that successful energy transitions require strategic alignment of technological investments with institutional capabilities, providing policymakers with an empirically grounded framework for navigating the complex intersection of digital innovation and climate neutrality objectives across diverse economic contexts.

Author Contributions

Conceptualization, L.V., M.S. and C.S.; Data curation, L.V. and M.S.; Formal analysis, L.V. and M.S.; Investigation, L.V. and M.S.; Methodology, M.S. and C.S.; Resources, M.S. and C.S.; Supervision, L.V. and C.S.; Writing—original draft, L.V., M.S., C.S. and L.-S.M.; Writing—review & editing, L.V. and L.-S.M. All authors have read and agreed to the published version of the manuscript.

Funding

This research received no external funding.

Institutional Review Board Statement

Not applicable.

Informed Consent Statement

Not applicable.

Data Availability Statement

The raw data supporting the conclusions of this article will be made available by the authors on request.

Acknowledgments

The research within this paper was conducted within and with the support of the Interdisciplinary Research Center for Economics and Social Sciences, INCESA (Research Infrastructure in Applied Sciences), University of Craiova, a part of the project “HUB-UCv—Support Center for International CD Projects for the Oltenia” project code POC/80/1/2/107885, cofinanced by the European Social Fund within the Sectorial Operational Program COMPETITIVENESS 2014–2020.

Conflicts of Interest

The authors declare no conflicts of interest.

References

  1. Acemoglu, D., & Restrepo, P. (2019). Automation and new tasks: How technology displaces and reinstates labor. Journal of Economic Perspectives, 33(2), 3–30. [Google Scholar] [CrossRef]
  2. Afjal, M. (2023). The tapestry of green economics: Mapping the nexus of CO2 emissions, economic growth, and renewable energy. International Journal of Sustainable Energy, 42(1), 1364–1390. [Google Scholar] [CrossRef]
  3. Agrawal, A., Gans, J., & Goldfarb, A. (2019). Economic policy for artificial intelligence. Innovation Policy and the Economy, 19(1), 139–159. [Google Scholar] [CrossRef]
  4. Agterberg, P., Hurink, J., La Poutré, H., Van de Vreede, G., de Weerdt, M., & Wilbrink, T. (2021). AI as an accelerator of the energy transition. Opportunities for a carbon-free energy system. Working Group Energy and Sustainability. Available online: https://nlaic.com/wp-content/uploads/2021/09/Position_paper_AI_as_an_accelerator_for_the_energy_transition.pdf (accessed on 15 March 2025).
  5. Ahmad, T., Zhang, D., Huang, C., Zhang, H., Dai, N., Song, Y., & Chen, H. (2021). Artificial intelligence in sustainable energy industry: Status Quo, challenges and opportunities. Journal of Cleaner Production, 289, 125834. [Google Scholar] [CrossRef]
  6. Alotaiq, A. (2024). Global low carbon transitions in the power sector: A machine learning clustering approach using archetypes. Journal of Economy and Technology, 2, 95–127. [Google Scholar] [CrossRef]
  7. Alsaigh, R., Mehmood, R., & Katib, I. (2022). AI explainability and governance in smart energy systems: A review. arXiv, arXiv:2211.00069. [Google Scholar] [CrossRef]
  8. Andersen, R. (2008). Modern methods for robust regression. SAGE Publications, Inc. [Google Scholar] [CrossRef]
  9. Attanayake, K., Wickramage, I., Samarasinghe, U., Ranmini, Y., Ehalapitiya, S., Jayathilaka, R., & Yapa, S. (2024). Renewable energy as a solution to climate change: Insights from a comprehensive study across nations. PLoS ONE, 19(6), e0299807. [Google Scholar] [CrossRef]
  10. Bennagi, A., AlHousrya, O., Cotfas, D. T., & Cotfas, P. A. (2024). Comprehensive study of the artificial intelligence applied in renewable energy. Energy Strategy Reviews, 54, 101446. [Google Scholar] [CrossRef]
  11. Bishaw, F. G. (2024). Review artificial intelligence applications in renewable energy systems integration. Journal of Electrical Systems, 20(3), 3. [Google Scholar] [CrossRef]
  12. Biswas, P., Rashid, A., Biswas, A., Nasim, M. A. A., Gupta, K. D., & George, R. (2024). AI-driven approaches for optimizing power consumption: A comprehensive survey. arXiv, arXiv:2406.15732. [Google Scholar] [CrossRef]
  13. Budennyy, S., Lazarev, V., Zakharenko, N., Korovin, A., Plosskaya, O., Dimitrov, D., Arkhipkin, V., Oseledets, I., Barsola, I., Egorov, I., Kosterina, A., & Zhukov, L. (2022). ECO2AI: Carbon emissions tracking of machine learning models as the first step towards sustainable AI. arXiv, arXiv:2208.00406. [Google Scholar] [CrossRef]
  14. Budiraharjo, M. H., Muhammad, A. H., & Kusnawi. (2024). MSME AI readiness analysis using the AIRI framework. Jurnal Teknologi Informasi Universitas Lambung Mangkurat (JTIULM), 9(2), 2. [Google Scholar] [CrossRef]
  15. Caldera, Y., Ranthilake, T., Gunawardana, H., Senevirathna, D., Jayathilaka, R., Rathnayake, N., & Peter, S. (2024). Understanding the interplay of GDP, renewable, and non-renewable energy on carbon emissions: Global wavelet coherence and Granger causality analysis. PLoS ONE, 19(9), e0308780. [Google Scholar] [CrossRef] [PubMed]
  16. Carlsson, B., & Stankiewicz, R. (1991). On the nature, function and composition of technological systems. Journal of Evolutionary Economics, 1, 93–11. [Google Scholar] [CrossRef]
  17. Castro, D., McLaughlin, M., & Chivot, E. (2019, August 19). Who is winning the AI race: China, the EU or the United States? Center for Data Innovation. Available online: https://datainnovation.org/2019/08/who-is-winning-the-ai-race-china-the-eu-or-the-united-states/ (accessed on 15 February 2025).
  18. Chen, L., Chen, Z., Zhang, Y., Liu, Y., Osman, A. I., Farghali, M., Hua, J., Al-Fatesh, A., Ihara, I., Rooney, D. W., & Yap, P.-S. (2023). Artificial intelligence-based solutions for climate change: A review. Environmental Chemistry Letters, 21(5), 2525–2557. [Google Scholar] [CrossRef]
  19. Chiekezie, N. R., Obiki-Osafiele, A. N., & Agu, E. E. (2024). Preparing the workforce for AI technologies through training and professional development for future readiness. World Journal of Engineering and Technology Research, 3(1), 001–018. [Google Scholar] [CrossRef]
  20. Chishti, M. Z., Xia, X., & Dogan, E. (2024). Understanding the effects of artificial intelligence on energy transition: The moderating role of Paris Agreement. Energy Economics, 131, 107388. [Google Scholar] [CrossRef]
  21. Cisco. (n.d.). Cisco AI readiness index—Cisco. Available online: https://www.cisco.com/c/m/en_us/solutions/ai/readiness-index.html (accessed on 4 February 2025).
  22. Cozzi, L., Gul, T., Spencer, T., & Lever, P. (2024, April 18). Clean energy is boosting economic growth—Analysis. IEA. Available online: https://www.iea.org/commentaries/clean-energy-is-boosting-economic-growth (accessed on 16 March 2025).
  23. Danish, M. S. S., & Senjyu, T. (2023). AI-enabled energy policy for a sustainable future. Sustainability, 15(9), 7643. [Google Scholar] [CrossRef]
  24. Dellosa, J. T., & Palconit, E. C. (2021, September 7–10). Artificial Intelligence (AI) in renewable energy systems: A condensed review of its applications and techniques. 2021 IEEE International Conference on Environment and Electrical Engineering and 2021 IEEE Industrial and Commercial Power Systems Europe (EEEIC/I&CPS Europe) (pp. 1–6), Bari, Italy. [Google Scholar] [CrossRef]
  25. Dissanayake, H., Perera, N., Abeykoon, S., Samson, D., Jayathilaka, R., Jayasinghe, M., & Yapa, S. (2023). Nexus between carbon emissions, energy consumption, and economic growth: Evidence from global economies. PLoS ONE, 18(6), e0287579. [Google Scholar] [CrossRef]
  26. Doğan, B., Tiwari, S., Bergougui, B., Ghosh, S., & Balsalobre-Lorente, D. (2025). Green innovation and fiscal spending: Decoding the path to sustainable development. Sustainable Development, 33(4), 6307–6327. [Google Scholar] [CrossRef]
  27. Dong, Z., Tan, C., Ma, B., & Ning, Z. (2024). The impact of artificial intelligence on the energy transition: The role of regulatory quality as a guardrail, not a wall. Energy Economics, 140, 107988. [Google Scholar] [CrossRef]
  28. Elkington, J. (1997). Cannibals with forks: The triple bottom line of 21st century business. Capstone. [Google Scholar]
  29. Epskamp, S., & Fried, E. I. (2018). A tutorial on regularized partial correlation networks. Psychological Methods, 23(4), 617–634. [Google Scholar] [CrossRef]
  30. Ergun, S. J., & Rivas, M. F. (2023). Does higher income lead to more renewable energy consumption? Evidence from emerging-Asian countries. Heliyon, 9(1), e13049. [Google Scholar] [CrossRef]
  31. European Commission (EC). (2018). Artificial intelligence for Europe. European Commission (EC). Available online: https://eur-lex.europa.eu/legal-content/EN/TXT/PDF/?uri=CELEX:52018DC0237 (accessed on 10 March 2025).
  32. European Commission (EC). (2019). The European green deal. Communication from the Commission to the European Parliament, the European Council, the Council, the European Economic and Social Committee and the Committee of the Regions. European Commission (EC). Available online: https://eur-lex.europa.eu/resource.html?uri=cellar:b828d165-1c22-11ea-8c1f-01aa75ed71a1.0002.02/DOC_1&format=PDF (accessed on 20 March 2025).
  33. European Parliament (EP). (2018, August 3). Reducing carbon emissions: EU targets and policies. European Parliament. Available online: https://www.europarl.europa.eu/topics/en/article/20180305STO99003/reducing-carbon-emissions-eu-targets-and-policies (accessed on 21 March 2025).
  34. European Parliament (EP). (2024, February 29). Renewable energy|Fact Sheets on the European Union|European Parliament. Available online: https://www.europarl.europa.eu/factsheets/en/sheet/70/energia-din-surse-regenerabile (accessed on 15 March 2025).
  35. European Union. (2021). Regulation (EU) 2021/1119 of the European parliament and of the council of 30 June 2021 establishing the framework for achieving climate neutrality and amending regulations (EC) No 401/2009 and (EU) 2018/1999 (‘European climate law’). 243 OJ L. Available online: http://data.europa.eu/eli/reg/2021/1119/oj/eng (accessed on 2 February 2025).
  36. European Union. (2024). Regulation (EU) 2024/1689 of the European parliament and of the council of 13 June 2024 laying down harmonised rules on artificial intelligence and amending regulations (EC) No 300/2008, (EU) No 167/2013, (EU) No 168/2013, (EU) 2018/858, (EU) 2018/1139 and (EU) 2019/2144 and directives 2014/90/EU, (EU) 2016/797 and (EU) 2020/1828 (artificial intelligence act) text with EEA relevance. Pub. L. No. 2024/1689. Available online: https://eur-lex.europa.eu/legal-content/EN/TXT/PDF/?uri=OJ:L_202401689 (accessed on 4 February 2025).
  37. Fang, Y., Lee, C.-C., & Li, X. (2025). Assessing the impact of artificial intelligence on the transition to renewable energy? Analysis of U.S. states under policy uncertainty. Renewable Energy, 246, 122969. [Google Scholar] [CrossRef]
  38. Fox, J., & Weisberg, S. (2018). Robust regression in R, an appendix to an R companion to applied regression. In An R companion to applied regression (3rd ed.). SAGE Publications. [Google Scholar]
  39. Fraisl, D., See, L., Fritz, S., Haklay, M., & McCallum, I. (2025). Leveraging the collaborative power of AI and citizen science for sustainable development. Nature Sustainability, 8(2), 125–132. [Google Scholar] [CrossRef]
  40. Friedlingstein, P., O’Sullivan, M., Jones, M. W., Andrew, R. M., Bakker, D. C. E., Hauck, J., Landschützer, P., Le Quéré, C., Luijkx, I. T., Peters, G. P., Peters, W., Pongratz, J., Schwingshackl, C., Sitch, S., Canadell, J. G., Ciais, P., Jackson, R. B., Alin, S. R., Anthoni, P., … Zheng, B. (2023). Global carbon budget 2023. Earth System Science Data, 15(12), 5301–5369. [Google Scholar] [CrossRef]
  41. Furman, J., & Seamans, R. (2018). AI and the economy (SSRN scholarly paper No. 3186591). Social Science Research Network. [Google Scholar] [CrossRef]
  42. Garric, A., & Piquard, A. (2024, August 4). Les promesses de l’IA grevées par un lourd bilan carbone. Le Monde. Available online: https://www.lemonde.fr/planete/article/2024/08/04/climat-les-promesses-de-l-ia-grevees-par-un-lourd-bilan-carbone_6266586_3244.html (accessed on 5 March 2025).
  43. Gondauri, D., Batiashvili, M., & Enukidze, N. (2024). Deciphering the AI economy: A mathematical model perspective. International Journal of Business and Management, 19(3), 3. [Google Scholar] [CrossRef]
  44. HAI. (2018). Artificial intelligence index report 2024. Available online: https://hai.stanford.edu/ai-index (accessed on 25 February 2025).
  45. Hao, Y. (2022). The relationship between renewable energy consumption, carbon emissions, output, and export in industrial and agricultural sectors: Evidence from China. Environmental Science and Pollution Research, 29(42), 63081–63098. [Google Scholar] [CrossRef]
  46. Hevey, D. (2018). Network analysis: A brief overview and tutorial. Health Psychology and Behavioral Medicine, 6(1), 301–328. [Google Scholar] [CrossRef]
  47. im Walde, S. S. (2006). Experiments on the automatic induction of German semantic verb classes. Computational Linguistics, 32(2), 159–194. [Google Scholar] [CrossRef]
  48. Intergovernmental Panel on Climate Change (IPCC). (2023). Climate change 2023: Synthesis report (Core Writing Team, H. Lee, & J. Romero, Eds.; pp. 35–115). Contribution of Working Groups I, II and III to the Sixth Assessment Report of the Intergovernmental Panel on Climate Change. IPCC. [Google Scholar]
  49. International Energy Agency (IEA). (2021, August 6). Better energy efficiency policy with digital tools—Analysis. Available online: https://www.iea.org/articles/better-energy-efficiency-policy-with-digital-tools (accessed on 11 March 2025).
  50. International Energy Agency (IEA). (2024a). Renewables 2024—Analysis—IEA. Available online: https://www.iea.org/reports/renewables-2024 (accessed on 10 March 2025).
  51. International Energy Agency (IEA). (2024b, October 16). World energy outlook 2024—Analysis. Available online: https://www.iea.org/reports/world-energy-outlook-2024 (accessed on 12 March 2025).
  52. International Monetary Fund (IMF). (n.d.). AI preparedness index (AIPI). Available online: https://www.imf.org/external/datamapper/datasets/AIPI (accessed on 6 February 2025).
  53. Iqbal, S., Wang, Y., Shaikh, P. A., Maqbool, A., & Hayat, K. (2022). Exploring the asymmetric effects of renewable energy production, natural resources, and economic progress on CO2 emissions: Fresh evidence from Pakistan. Environmental Science and Pollution Research, 29(5), 7067–7078. [Google Scholar] [CrossRef]
  54. Issa, D. H., Jabbouri, D. R., & Palmer, M. (2021). An artificial intelligence (AI)-readiness and adoption framework for agritech firms (SSRN scholarly paper No. 3971188). Social Science Research Network. [Google Scholar] [CrossRef]
  55. Jamison, S., Moussavi, B., Macchi, M., & Bermudez, M. (2024). Companies are decarbonizing. But how can they go faster? (Destination net zero). Accenture. Available online: https://www.accenture.com/content/dam/accenture/final/accenture-com/document-3/Accenture-Destination-Net-Zero-Final-Report.pdf (accessed on 12 March 2025).
  56. Kassambara, A. (2017). Practical guide to cluster analysis in R. STHDA. Available online: https://xsliulab.github.io/Workshop/2021/week10/r-cluster-book.pdf (accessed on 7 February 2025).
  57. KPMG. (n.d.). Energy institute statistical review of world energy 2024. Available online: https://assets.kpmg.com/content/dam/kpmg/nl/pdf/2023/services/statistical-review-of-world-energy-kleiner.pdf (accessed on 16 February 2025).
  58. Kyriakarakos, G. (2025). Artificial intelligence and the energy transition. Sustainability, 17(3), 1140. [Google Scholar] [CrossRef]
  59. Lampropoulos, G., Garzón, J., Misra, S., & Siakas, K. (2024). The role of artificial intelligence of things in achieving sustainable development goals: State of the art. Sensors, 24(4), 1091. [Google Scholar] [CrossRef]
  60. Lundvall, B.-Å. (Ed.). (1992). National systems of innovation: Toward a theory of innovation and interactive learning. Anthem Press. Available online: http://www.jstor.org/stable/j.ctt1gxp7cs (accessed on 16 February 2025).
  61. Maechler, M., Rousseeuw, P., Croux, C., Todorov, V., Ruckstuhl, A., Salibian-Barrera, M., Verbeke, T., Koller, M., Conceicao, E. L. T., & di Palma, M. A. (2024). robustbase: Basic robust statistics (Version 0.99-4-1) [Computer software]. Available online: https://cran.r-project.org/web/packages/robustbase/index.html (accessed on 20 February 2025).
  62. Maronna, R. A., Martin, R. D., Yohai, V. J., & Salibián-Barrera, M. (2018). Robust statistics: Theory and methods (with R). John Wiley & Sons Ltd. [Google Scholar]
  63. McKinsey. (2024). Global energy perspective. Available online: https://www.mckinsey.com/industries/energy-and-materials/our-insights/global-energy-perspective (accessed on 17 February 2025).
  64. Mecu, A.-N., Chitu, F., Marin, G.-I., & Hurduzeu, G. (2023). Analysis of the Impact of Energy Efficiency and Renewable Energy on Greenho use Gas Emissions and Economic Growth in EU Member States. Amfiteatru Economic, 25(Special 17), 1149. [Google Scholar] [CrossRef]
  65. Menai, I., Salah, H. S., Khelil, S., Aidaoui, A., & Djouad, F. Z. (2024, May 23–24). The transition to artificial intelligence-based solutions for improving energy efficiency in urban environments. International Conference of Contemporary Affairs in Architecture and Urbanism-ICCAUA (Vol. 7, p. 1), Alanya, Turkey. [Google Scholar] [CrossRef]
  66. Mirziyoyeva, Z., & Salahodjaev, R. (2023). Renewable energy, GDP and CO2 emissions in high-globalized countries. Frontiers in Energy Research, 11, 1123269. [Google Scholar] [CrossRef]
  67. Nasir, O., Javed, R. T., Gupta, S., Vinuesa, R., & Qadir, J. (2023). Artificial intelligence and sustainable development goals nexus via four vantage points. Technology in Society, 72, 102171. [Google Scholar] [CrossRef]
  68. Nature Energy. (2024, January 29). Folosirea inteligentei artificiale în domeniul energiilor verzi. Available online: https://www.naturenergy.ro/2024/01/29/folosirea-inteligentei-artificiale-in-domeniul-energiilor-verzi/ (accessed on 9 March 2025).
  69. Noorman, M., Espinosa Apráez, B., & Lavrijssen, S. (2023). AI and energy justice. Energies, 16(5), 2110. [Google Scholar] [CrossRef]
  70. North, D. C. (1990). Institutions, institutional change and economic performance. Cambridge University Press. [Google Scholar]
  71. OECD. (n.d.). Live data from OECD.AI. Available online: https://oecd.ai/en/data (accessed on 10 February 2025).
  72. OECD. (2024). Nominal gross domestic product (GDP). OECD. Available online: https://www.oecd.org/en/data/indicators/nominal-gross-domestic-product-gdp.html (accessed on 9 March 2025).
  73. Olatunde, T. M., Okwandu, A. C., Akande, D. O., & Sikhakhane, Z. Q. (2024). Reviewing the role of artificial intelligence in energy efficiency optimization. Engineering Science & Technology Journal, 5(4), 1243–1256. [Google Scholar] [CrossRef]
  74. Onwusinkwue, S., Osasona, F., Ahmad, I. A. I., Anyanwu, A. C., Dawodu, S. O., Obi, O. C., & Hamdan, A. (2024). Artificial intelligence (AI) in renewable energy: A review of predictive maintenance and energy optimization. World Journal of Advanced Research and Reviews, 21(1), 2487–2499. [Google Scholar] [CrossRef]
  75. Oukaira, A., Karime, A., Roberge, V., & Tarbouchi, M. (2024, July 29–31). Toward increased energy efficiency and proactive management of electrical grids based on AI. 2024 International Conference on Computing, Internet of Things and Microwave Systems (ICCIMS) (pp. 1–4), Gatineau, QC, Canada. [Google Scholar] [CrossRef]
  76. Oxford Insights. (2024). 2024 government AI readiness index. Oxford Insights. Available online: https://oxfordinsights.com/ai-readiness/ai-readiness-index/ (accessed on 13 March 2025).
  77. Parmová, D. S., Teshabaev, T., Kasimova, N., & Salahodjaev, R. (2024). Mitigating CO2 emissions: The synergy of foreign direct investment and renewable energy in Europe and central Asia. International Journal of Energy Economics and Policy, 14(1), 620–627. [Google Scholar] [CrossRef]
  78. Pasqualetto, A., Serafini, L., & Sprocatti, M. (2024). Artificial intelligence approaches for energy efficiency: A review. arXiv, arXiv:2407.21726. [Google Scholar] [CrossRef]
  79. Pata, U. K., Kartal, M. T., & Kılıç Depren, S. (2024). The role of information and communication technologies and energy-related research and development investments in energy transition: Evidence from the united states of America by machine learning algorithm. Energy Technology, 12(5), 2301199. [Google Scholar] [CrossRef]
  80. Pimenow, S., Pimenowa, O., & Prus, P. (2024). Challenges of artificial intelligence development in the context of energy consumption and impact on climate change. Energies, 17(23), 5965. [Google Scholar] [CrossRef]
  81. Rane, N. L., Choudhary, S. P., & Rane, J. (2024). Artificial intelligence and machine learning in renewable and sustainable energy strategies: A critical review and future perspectives. Partners Universal International Innovation Journal, 2(3), 80–102. [Google Scholar] [CrossRef]
  82. Rashid, A., Biswas, P., Biswas, A., Nasim, M. A. A., Gupta, K. D., & George, R. (2024). Present and future of AI in renewable energy domain: A comprehensive survey. arXiv, arXiv:2406.16965. [Google Scholar] [CrossRef]
  83. Rinchi, O., Alsharoa, A., Shatnawi, I., & Arora, A. (2024). The role of intelligent transportation systems and artificial intelligence in energy efficiency and emission reduction. arXiv, arXiv:2401.14560. [Google Scholar] [CrossRef]
  84. Rojek, I., Mroziński, A., Kotlarz, P., Macko, M., & Mikołajewski, D. (2023). AI-based computational model in sustainable transformation of energy markets. Energies, 16(24), 8059. [Google Scholar] [CrossRef]
  85. Rusilowati, U., Ngemba, H. R., Anugrah, R. W., Fitriani, A., & Astuti, E. D. (2024). Leveraging AI for superior efficiency in energy use and development of renewable resources such as solar energy, wind, and bioenergy. International Transactions on Artificial Intelligence, 2(2), 114–120. [Google Scholar] [CrossRef]
  86. Scott, W. R. (2014). Institutions and organizations: Ideas, interests, and identities (4th ed.). Sage Publishing. [Google Scholar]
  87. Sheng, T., Li, B., & Solea, E. (2023). On skewed Gaussian graphical models. Journal of Multivariate Analysis, 194, 105129. [Google Scholar] [CrossRef]
  88. Shonhe, L. (2024). Conceptual framework to explore artificial intelligence technology (AIT) readiness and adoption intention in records and information management (RIM) practices: A proposal. Records Management Journal, 35(1), 18–34. [Google Scholar] [CrossRef]
  89. Singh, A., Kanaujia, A., Singh, V. K., & Vinuesa, R. (2024). Artificial intelligence for Sustainable Development Goals: Bibliometric patterns and concept evolution trajectories. Sustainable Development, 32(1), 724–754. [Google Scholar] [CrossRef]
  90. Statista. (2023). Global AI market size 2030. Statista. Available online: https://www.statista.com/statistics/1365145/artificial-intelligence-market-size/#:~:text=Global%20artificial%20intelligence%20market%20size%202021%2D2030&text=Its%20value%20of%20nearly%20100,a%20vast%20number%20of%20industries (accessed on 6 February 2025).
  91. Tatar, S. M., & Aydin, E. (2023). Design and operation of renewable energy microgrids under uncertainty towards green deal and minimum carbon emissions. arXiv, arXiv:2304.14709. [Google Scholar] [CrossRef]
  92. Tran, B.-L., Chen, C.-C., & Tseng, W.-C. (2022). Causality between energy consumption and economic growth in the presence of GDP threshold effect: Evidence from OECD countries. Energy, 251, 123902. [Google Scholar] [CrossRef]
  93. Tsai, K., Koyejo, O., & Kolar, M. (2022). Joint Gaussian graphical model estimation: A survey. WIREs Computational Statistics, 14(6), e1582. [Google Scholar] [CrossRef]
  94. Tudora, E., Tîrziu, E., & Gheorghe-Moisii, M. (2021). Internet of things în energie: Tehnologii, aplicații, provocări și tendințe viitoare. Revista Română de Informatică și Automatică, 31(2), 45–58. [Google Scholar] [CrossRef]
  95. United Nations (UN). (2015a). Paris agreement. Available online: https://unfccc.int/sites/default/files/english_paris_agreement.pdf (accessed on 5 March 2025).
  96. United Nations (UN). (2015b). Take action for the sustainable development goals. Available online: https://www.un.org/sustainabledevelopment/sustainable-development-goals/ (accessed on 9 March 2025).
  97. United Nations (UN). (2024). Govering AI for humanity: Final report. United Nations. Available online: https://www.un.org/sites/un2.un.org/files/governing_ai_for_humanity_final_report_en.pdf (accessed on 12 March 2025).
  98. Verdecchia, R., Sallou, J., & Cruz, L. (2023). A systematic review of green AI. arXiv, arXiv:2301.11047. [Google Scholar] [CrossRef]
  99. Vinuesa, R., Azizpour, H., Leite, I., Balaam, M., Dignum, V., Domisch, S., Felländer, A., Langhans, S. D., Tegmark, M., & Fuso Nerini, F. (2020). The role of artificial intelligence in achieving the Sustainable Development Goals. Nature Communications, 11(1), 233. [Google Scholar] [CrossRef]
  100. Vîrjan, D., Popescu, C. R., Pop, I., & Popescu. (2023). Energy transition and sustainable development at the level of the European Union. Amfiteatru Economic, 25(63), 429. [Google Scholar] [CrossRef]
  101. Wang, H.-J., Jin, S.-L., & Chang, C.-P. (2025a). Does artificial intelligence bring to renewable energy innovation? Yes, empirical investigation for 51 countries? International Journal of Green Energy, 22(2), 375–390. [Google Scholar] [CrossRef]
  102. Wang, Q., Li, Y., & Li, R. (2024). Ecological footprints, carbon emissions, and energy transitions: The impact of artificial intelligence (AI). Humanities and Social Sciences Communications, 11(1), 1–18. [Google Scholar] [CrossRef]
  103. Wang, Q., Sun, T., & Li, R. (2025b). Does artificial intelligence (AI) enhance green economy efficiency? The role of green finance, trade openness, and R&D investment. Humanities and Social Sciences Communications, 12(1), 1–22. [Google Scholar] [CrossRef]
  104. Ward, J. H., & Hook, M. E. (1963). Application of an hierarchical grouping procedure to a problem of grouping profiles. Educational and Psychological Measurement, 23(1), 69–81. [Google Scholar] [CrossRef]
  105. World Commission on Environment and Development. (1987). Report of the world commission on environment and development: Our common future. United Nations. Available online: https://sustainabledevelopment.un.org/content/documents/5987our-common-future.pdf (accessed on 20 August 2025).
  106. World Economic Forum. (2024, July 22). AI and energy: Will AI reduce emissions or increase power demand? World Economic Forum. Available online: https://www.weforum.org/stories/2024/07/generative-ai-energy-emissions/ (accessed on 14 March 2025).
  107. Yan, S., Shah, M. H., Li, J., O’Connor, N., & Liu, M. (2023, October 27–29). A review on AI algorithms for energy management in e-mobility services. 7th CAA International Conference on Vehicular Control and Intelligence (CVCI) (pp. 1–8), Changsha, China. [Google Scholar] [CrossRef]
  108. Zhang, C., Xia, Q., & Yang, G. (2015, June 15–17). Reconsideration about clustering analysis. IEEE 10th Conference on Industrial Electronics and Applications (ICIEA) (pp. 1517–1524), Auckland, New Zealand. [Google Scholar] [CrossRef]
  109. Zhao, C., Dong, K., Wang, K., & Nepal, R. (2024). How does artificial intelligence promote renewable energy development? The role of climate finance. Energy Economics, 133, 107493. [Google Scholar] [CrossRef]
  110. Zhao, Q., Wang, L., Stan, S.-E., & Mirza, N. (2024). Can artificial intelligence help accelerate the transition to renewable energy? Energy Economics, 134, 107584. [Google Scholar] [CrossRef]
  111. Zheng, H., Wu, J., Li, R., & Song, Y. (2025). The role of artificial intelligence in renewable energy development: Insights from less developed economies. Energy Economics 146, 108551. [Google Scholar] [CrossRef]
  112. Zhong, J., Zhong, Y., Han, M., Yang, T., & Zhang, Q. (2024). The impact of AI on carbon emissions: Evidence from 66 countries. Applied Economics, 56(25), 2975–2989. [Google Scholar] [CrossRef]
  113. Zoccolotti, P., Angelelli, P., Marinelli, C. V., & Romano, D. L. (2021). A Network Analysis of the Relationship among Reading, Spelling and Maths Skills. Brain Sciences, 11(5), 656. [Google Scholar] [CrossRef]
Figure 1. The research design. Source: authors’ contribution.
Economies 13 00271 g001
Figure 2. Distribution plots. (a) renewable energy production as a natural logarithm Ln.RP; (b) renewable energy consumption—RC; (c) AI investments—AI.Inv; (d) AI Readiness Score—AI.RS; (e) AI-related projects—AI.RP; (f) CO2 emissions as natural logarithm—Ln.CO; (g) GDP per capita—GDP.
Economies 13 00271 g002
Figure 3. Regression diagnostic plots: Ln.RP.orig.
Economies 13 00271 g003
Figure 4. Regression diagnostic plots: Ln.RP.std.
Economies 13 00271 g004
Figure 5. Regression diagnostic plots: RC.orig.
Economies 13 00271 g005
Figure 6. Regression diagnostic plots: RC.std.
Economies 13 00271 g006
Figure 7. Gaussian graphical model.
Economies 13 00271 g007
Figure 8. Centrality plot.
Economies 13 00271 g008
Figure 9. Dendrogram.
Economies 13 00271 g009
Figure 10. Silhouette.
Economies 13 00271 g010
Figure 11. Clusters identified through K-means.
Economies 13 00271 g011
Table 1. Variables.
Table 1. Variables.
CategoryVariableSymbolDefinition
Renewable energy—explained variablesRenewable energy productionLn.RPTerawatt-hours of energy generated from renewable sources. Used as natural logarithm of renewable energy production
Renewable energy consumptionRCShare of renewable energy consumption
Artificial intelligence—explanatory variablesAI investments AI.InvAI investments as percent of GDP
AI Readiness ScoreAI.RSAn index for AI engagement
AI-related projectsAI.RPNumber of AI-related projects
Control variablesCO2 emissionsLn.COMillion tons of carbon dioxide emissions, used as a natural logarithm
GDP per capita (USD)GDPGross domestic product per capita
Source: authors’ contribution.
Table 2. Descriptive statistics.
Ln.RPRCAI.InvAI.RSAI.RPLn.COGDP
Valid120120120120120120120
Median3.19926.6000.90072.85048.5003.81630,486
Mean3.24929.7800.96573.12555.7004.16339,171
Std. Deviation1.69211.8910.4158.36627.6351.86626,435
Skewness0.4731.0770.6820.0410.2050.7881.632
Kurtosis0.1420.8850.250−1.271−1.4080.8742.943
Minim0.09511.8000.05058.30015.0000.53110,123
Maxim7.77563.6002.20088.700104.0009.366134,560
Source: authors’ contribution.
Table 3. Residuals.
Table 3. Residuals.
ModelMin1st Qu.Median3rd Qu.Max
Ln.RP_model_orig−1.4746−0.43670.04970.45812.6465
Ln.RP_model_std−0.8714−0.25760.02950.27161.5674
RC_model_orig−20.200−5.4560−0.09475.376421.5399
RC_model_std−1.6987−0.4588−0.00790.45211.8114
Source: authors’ contribution.
Table 4. Coefficients.
(Intercept)AI.InvAI.RSAI.RPLn.COGDP
Ln.RP_model_origEstimate−1.9441.1022.838 × 10−21.485 × 10−24.901 × 10−1−2.141 × 10⁻⁵
Std. Error8.609 × 10−13.149 × 10−11.449 × 10−22.135 × 10−34.875 × 10−22.788 × 10⁻⁶
t value−2.2583.5011.9596.95210.054−7.681
Pr(>|t|)0.0258 *0.0006 ***0.05252.38 × 10−10 ***<2 × 10⁻¹⁶ ***5.96 × 10⁻¹² ***
Ln.RP_model_stdEstimate−0.01490.26900.14180.24240.5418−0.3348
Std. Error0.06320.08820.08550.03490.06130.0446
t value−0.4123.5011.6596.95210.054−7.681
Pr(>|t|)0.0258 *0.0006 ***0.05252.38 × 10−10 ***<2 × 10⁻¹⁶ ***5.96 × 10⁻¹² ***
RC_model_origEstimate−3.470 × 1011.284 × 1011.196−3.991 × 10⁻³−5.789−2.932 × 10⁻⁴
Std. Error1.829 × 1014.9963.054 × 10−17.221 × 10−21.2886.883 × 10−5
t value−1.8972.5703.918−0.055−4.495−4.260
Pr(>|t|)0.06030.0114 *0.0001 ***0.95601.68 × 10−5 ***4.23 × 10⁻⁵ ***
RC_model_stdEstimate−0.03380.44800.8417−0.0092−0.9086−0.6517
Std. Error0.14880.17430.21480.16780.20210.1530
t value−0.2272.5703.918−0.055−4.495−4.260
Pr(>|t|)0.82060.0114 *0.0001 ***0.95601.68 × 10−5 ***4.23 × 10⁻⁵ ***
Significance codes: *** indicate p < 0.001, * indicate p < 0.05, and no symbol indicates p ≥ 0.1. Source: authors’ contribution.
Table 5. Models’ performance.
ModelRobust Residual Standard ErrorMultiple R-SquaredAdjusted R-SquaredConvergence
Ln.RP_model_orig0.6860.8680.86313 IRWLS iterations
Ln.RP_model_std0.399
RC_model_orig6.2850.5240.50340 IRWLS iterations
RC_model_std0.528
Source: authors’ contribution.
Table 6. Robustness weights.
ModelMin1st Qu.MedianMean3rd Qu.Max
Ln.RP_model_orig0.10410.90570.95360.92070.98420.9987
Ln.RP_model_std
RC_model_orig0.21600.80910.91660.84280.97370.9989
RC_model_std
For the Ln.RP models: 6 weights are ~=1. The remaining 114 are summarized as above.
For the RC models: 11 weights are ~=1. The remaining 109 are summarized as above.
Source: authors’ contribution.
Table 7. Robustness tests.
ModelShapiro–WilkVIFBreusch–Pagan
Wp-ValueAI.InvAI.RSAI.RPLn.COGDPBPdfp-Value
Ln.RP_model_orig0.9610.0015.5656.8233.4112.6892.40611.4150.043
Ln.RP_model_std
RC_model_orig0.9880.4015.5656.8233.4112.6892.40626.6856.581 × 10−5
RC_model_std
Source: authors’ contribution.
Table 8. Quantitative characterization of clusters.
Variables Influence
(2 = Rank of 3)
Difference
(3 = 5–7)
Cluster 1 MeanCluster 2 Mean
Orig.StdOrig.Std
12 34567
Ln.RP51.22934.33530.64192.2550−0.5874
RC70.476534.52660.399228.860−0.0774
AI.Inv31.53451.43001.11980.7933−0.4148
AI.RS11.753282.57331.129467.9067−0.6238
AI.RP21.543980.53330.898637.8666−0.6453
Ln.CO61.00715.12210.51363.2423−0.4935
GDP41.3687590620.752422881−0.6163
Disclaimer/Publisher’s Note: The statements, opinions and data contained in all publications are solely those of the individual author(s) and contributor(s) and not of MDPI and/or the editor(s). MDPI and/or the editor(s) disclaim responsibility for any injury to people or property resulting from any ideas, methods, instructions or products referred to in the content.