Abstract
The digital economy is a key driver of industrial upgrading and regional growth. Focusing on Gansu Province—an under-represented, less-developed region in northwest China—this study constructs a multidimensional digital economy index (DEI) for 2009–2023 under a unified normalisation and weighting scheme. Two complementary MCDA approaches—entropy-weighted TOPSIS and SESP-SPOTIS—are implemented on the same 0–1 normalised indicators. Robustness is assessed using COMSAM sensitivity analysis and is benchmarked against a PCA reference. The empirical analysis then estimates log-elasticity models linking modern logistics production (MLP) and the DEI to the provincial GDP and sectoral value added, with inferences based on White heteroskedasticity–robust standard errors and bootstrap confidence intervals. Results show a steady rise in the DEI with a temporary dip in 2021 and recovery thereafter. MLP is positively and significantly associated with GDP and value added in the primary, secondary, and tertiary sectors. The DEI is positively and significantly associated with GDP, the primary sector, and the tertiary sector, but its effect is not statistically significant for the secondary sector, indicating a manufacturing digitalisation gap relative to services. Cross-method agreement and narrow sensitivity bands support the stability of these findings. Policy implications include continued investment in digital infrastructure and accessibility, targeted acceleration of manufacturing digitalisation, and the development of a “digital agriculture–smart logistics–green development” pathway to foster high-quality, sustainable regional growth.
1. Introduction
Gansu Province is located in the inland northwest of China, covering an area of approximately 425,900 square kilometres (Wei et al., 2024). In 2023, its regional gross domestic product (GDP) was around CNY 1.23 trillion, with a per capita GDP of about CNY 47,900 (Liao et al., 2024). The province continues to face constraints, such as relatively weak infrastructure, outflows of skilled labour and a narrow industrial structure (G. Wang et al., 2022). In recent years, as China’s modernisation has progressed, digital technologies (e.g., big data, cloud computing and artificial intelligence) have been increasingly integrated into traditional industries, injecting new vitality into conventional sectors and becoming an important driver of high-quality regional development (Y. Lu, 2022). As a key province in western China, Gansu has maintained steady economic growth; the provincial government has emphasised digitalisation and the integration of industries with digital technologies to improve product and service quality. In 2023, regional GDP reached CNY 1.23 trillion, representing 6.4% growth over 2022; however, there remains substantial room for improvement relative to many other provinces.
The logistics capacity and capability of a region strongly influence its economic development level (Sheffi, 2012; C. Wang & Zhang, 2015). Gansu has prioritised modern logistics: the provincial “14th Five-Year Plan” for logistics was issued in 2022; in 2023, projects such as the Gansu (Lanzhou) International Land Port multimodal information system and warehouse logistics construction commenced; in 2024, the high-speed railway from Lanzhou to Wuwei opened, further strengthening the rail network. These initiatives are important for regional economic and social development and for integration into national strategies. In the digital era, the transformation of traditional logistics towards intelligent, data-driven systems has become a key lever for promoting regional development (Y. Li et al., 2018).
At the same time, several frictions remain. Although the number of logistics firms is large, most are small-scale; overall services remain insufficiently professional and intelligent, with service homogenisation, low operational efficiency and weak effectiveness commonly observed (Zhao, 2015). These issues restrict the economic driving force of Gansu’s logistics industry (Wen & Yuan, 2024). How to overcome these limitations, seize opportunities brought by the digital economy and transform traditional logistics into a modern, high-quality logistics system is, therefore, a pertinent question. Existing studies primarily describe Gansu’s digital economy or the status of its logistics industry; few examine their interaction within a unified framework. Addressing this gap, the present study combines theoretical analysis and empirical evidence to examine the development of Gansu’s logistics industry in the era of the digital economy.
International and domestic evidence suggests that the digital economy is a crucial driver of the transformation and upgrading of traditional industries, including logistics. Conceptually, the integration of digital technologies enhances logistics efficiency and supports the rise of intelligent logistics (Xu et al., 2021). With the advancement of the digital economy, conventional logistics is increasingly evolving towards intelligent and digital systems (Huang & Li, 2023), leading not only to higher efficiency, but also to significant cost reductions (Rashidi, 2019). Gansu Province is currently building a national hub node for the integrated computing network and promoting big-data centres to facilitate digital economy development; however, empirical evidence on how the digital economy relates to logistics development in Gansu remains limited (Y. Guo & Ding, 2022). In this study, “modern logistics production” (MLP) is measured by the official value added of transportation, warehousing, and postal services, which provides a consistent provincial-year indicator, but does not capture all logistics frictions (e.g., firm counts or freight intensity). Accordingly, the empirical results are interpreted as associations in log levels rather than causal effects; formal causal identification is beyond the scope of this paper and is left to future research using instrumental variables or panel designs.
This study contributes to the literature in three ways. First, it provides a province-level, long-horizon assessment (2009–2023) of the digital economy and logistics development in an under-represented western region, complementing studies that focus on coastal or more advanced provinces. Second, it implements a dual multi-criteria framework—entropy-weighted TOPSIS and a modified SPOTIS—under a unified normalisation and entropy-weighting scheme so that indices are computed on the same 0–1 scale, improving comparability and interpretability. Third, it complements index construction with sensitivity and robustness analyses (COMSAM perturbations, a PCA benchmark, and a SPOTIS-based alternative DEI) and with log–log elasticity regressions linking the digital economy to logistics and to macro/sectoral outcomes. For inference, Eicker–White heteroskedasticity-consistent standard errors (HC0) and percentile bootstrap intervals are employed. A single macro control—fixed-asset investment per capita—is used to balance parsimony and multicollinearity in the short annual sample, with variance-inflation factors reported to assess collinearity.
The digital economy index (DEI) is constructed using entropy-weighted TOPSIS and, in parallel, a modified SPOTIS index based on the same normalised input matrix and entropy-weight vector. Using annual data for 2009–2023, the analysis quantifies the association between the DEI, MLP and economy-wide outcomes through log–log specifications, aligned with the most recent comparable official statistics for Gansu. Figure 1 sketches the research pathway from digital economy development to logistics upgrading and, subsequently, to sectoral value added and GDP.
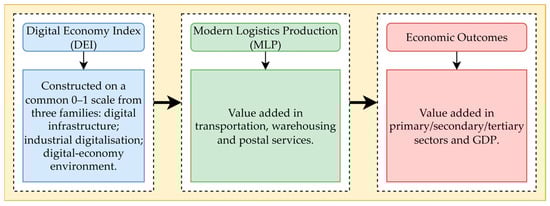
Figure 1.
Conceptual framework linking digital economy development (DEI), modern logistics production (MLP), and economic outcomes.
2. Literature Review
Digital economy represents a new stage of economic development driven by advances in digital technologies (Hungerland et al., 2015). It has transformed traditional economic models, influenced the quality and efficiency of business operations, and contributed to overall economic growth (Teece, 2018; B. Zhou, 2024). From multiple perspectives, the digital economy can be defined via the resource view (technological foundations), the content view (information and data management), and the human-capital view (creativity, skills and knowledge enhanced by information technology) (Strohmeier, 2020; Williams, 2021; X. Chen & Ling, 2023; J. Zhang & Chen, 2024; Y. Li et al., 2020). Complementary lenses include the process/flow view, which examines how technology supports organisational operations; the structural view, which discusses economic transformation and internet-based architectures; and the organisational-framework view, which addresses e-commerce, e-business, and platform ecosystems (Williams, 2021). To synthesise these strands, Y. Li et al. (2020) argue that the digital economy is not merely a simple integration of technologies but achieves interconnection across industries through intelligent systems. In logistics specifically, digital transformation has markedly improved efficiency and competitiveness (Le Viet & Dang Quoc, 2023; Z. Liu et al., 2024). In parallel, research on Logistics 4.0 has deepened: cyber-physical systems, the Internet of Things, analytics, and artificial intelligence are reshaping processes, capabilities and operating models, providing a conceptual foundation for indicator selection and mechanism analysis (Winkelhaus & Grosse, 2020).
The rapid development of digital economy has accelerated the digital transformation process in the logistics industry (Cichosz et al., 2020). Research indicates that China’s digital economy has fundamentally transformed the logistics industry by promoting more intelligent operations, improving efficiency, and driving new business models including third-party and fourth-party logistics (F. Zhou & Gao, 2023; Zhuang et al., 2023). As digitalisation deepens, platform-based models and new circulation technologies diffuse into the real economy, and the logistics market has expanded rapidly despite shocks such as COVID-19. Leading regions such as Guangdong, Beijing and Jiangsu have integrated digital economy and logistics more effectively, whereas relatively underdeveloped regions have lagged behind; as core digital industries grow and logistics modernisation advances, this integration is expected to diffuse nationwide (W. Zhang et al., 2022). These regional patterns not only highlight the uneven pace of integration but also point to the need for systematic assessment. Recent reviews have mapped the main logistics research areas and KPIs under e-commerce, offering a framework for linking logistics outcomes more directly with digital enablement (Zennaro et al., 2022).
In recent years, a growing body of research has examined regional disparities in the integration of the digital economy with the logistics industry. The findings suggest that the eastern coastal regions exhibit comparatively advanced technological infrastructure and stronger capacity in talent acquisition, whereas the western provinces—particularly Gansu—continue to struggle with delayed technological upgrading and limited capital investment (X. Xie & Wang, 2023; Y. Zhou & Lin, 2024; Xue et al., 2024). Although the integration process in these regions started relatively late, policy support and public investment have been increasingly directed to accelerate catch-up in these regions. The digital economy plays a crucial role in the integration and enhancement of the logistics industry: technological advances have given rise to innovative solutions that improve the efficiency of transportation, warehousing, and overall supply chain management. Through digital platforms, the digital economy can effectively reduce enterprises’ transaction, information, search, and fulfilment costs (Feng, 2023).
The transformative role of the digital economy in logistics is significant, enhancing operational efficiency and reducing costs through digital technologies (Trushkina et al., 2020). This transformation has promoted real-time tracking, automation, and improved data-driven decision-making, which are essential elements of modern logistics systems (Odimarha et al., 2024). The rapid expansion of e-commerce and last-mile delivery services has largely benefited from the integration of digital platforms, which optimise operational efficiency and enhance customer experience (Bergmann et al., 2020; Lim et al., 2018). Quantitative studies, such as regression analysis and entropy-weighted TOPSIS frameworks, have demonstrated the positive impact of digital transformation on logistics performance in regions with advanced infrastructure (Jiang et al., 2023; Sen et al., 2021). Furthermore, Luo and Wang (2022) reported that the logistics industry plays an important role in economic growth in western China; J. Lu and Chuah (2023) reached a similar conclusion for Qinghai Province The digital economy is pivotal for optimising logistics efficiency and promoting regional growth in the west (J. Yang & Wang, 2024). At a broader level, systematic reviews of Industry 4.0 and supply chain performance underscore the benefits, challenges, and success factors of adopting core digital technologies in logistics-intensive contexts (Rad et al., 2022), while resilience-oriented reviews further highlight their role in mitigating risks during disruptions (Spieske & Birkel, 2021).
It is widely recognised that digital technologies enhance transportation efficiency, optimise supply chain coordination, improve resource allocation and accelerate the transformation of traditional logistics towards more intelligent and platform-based models (Achkasova, 2024). Most research focusing on China uses data from more developed eastern coastal regions, systematically revealing positive relationships between digital infrastructure development, digital industry agglomeration and logistics performance (X. Fan et al., 2024; W. Zhang et al., 2022). By contrast, quantitative analyses of underdeveloped north-western regions, such as Gansu, remain relatively limited. These regions tend to suffer inherent disadvantages in geographic location, financial support, and human-capital capacity, which constrain industrial upgrading (C. Li et al., 2024). Their distinctive geography, industrial structures, and resource endowments also raise the open question of whether the digital economy–logistics coupling observed in developed regions can be generalised to the north-west. Recent coupling–coordination studies provide empirical frameworks for jointly assessing the development of digital economy and logistics subsystems at the provincial level, including evidence of positive interaction effects in less-developed or rural settings (Y. Guo & Ding, 2022; Y. Guo et al., 2022; Shu et al., 2023). At the same time, methodological cautions regarding widely used logistics indicators, such as the Logistics Performance Index, underscore the need for careful metric design and robustness checks when extending such analyses (Beysenbaev & Dus, 2020). In this regard, the value added of transportation, warehousing and postal services is frequently employed in official statistics as a consistent province-year proxy for logistics activity (Achkasova, 2024; Z. Fan et al., 2024; J. Lu & Chuah, 2023; Rad et al., 2022; Spieske & Birkel, 2021; J. Yang & Wang, 2024); while convenient and closely tied to macro accounts, this measure cannot fully capture micro-level frictions such as firm structure, freight intensity or service heterogeneity, so empirical interpretations should be circumspect and complemented by robustness exercises (Fugate et al., 2010).
In addition, many existing studies rely on static cross-sectional data or short-term panel models. These approaches highlight correlations, but they are limited in addressing regional variation and evaluating robustness (Beysenbaev & Dus, 2020; Fugate et al., 2010; Ge et al., 2023; Shu et al., 2023; C. Wang et al., 2023). For example, digital economy performance is often evaluated using subjectively assigned weights, which may not reflect genuine differences in indicator importance across regions. Similarly, research on the response mechanisms of logistics output tends to lack cross-model and cross-method validation (C. Guo et al., 2024; Y. Guo et al., 2022). Closing these gaps calls for expanded regional representation, standardized and transparent weighting/normalization processes, and robust supplementary strategies such as alternative MCDA formulations, sensitivity testing, and benchmarking.
This study extends the literature by focusing on a western province with limited coverage, employing harmonised multi-criteria evaluation methods, and validating results through robustness checks to enhance methodological transparency and empirical credibility. In light of the above, the present study concentrates on an under-represented western province over 2009–2023, integrates two multi-criteria decision-making methods—entropy-weighted TOPSIS and SESP-SPOTIS—under a unified normalisation-and-weighting scheme to construct a digital economy index, and employs log-elasticity regressions with multiple robustness checks to examine impact pathways and regional differences. For a structured summary of representative studies underpinning the measurement choices and mechanisms discussed here, see Table A1.
3. Methodology
3.1. Evaluation of Digital Economy Index in Gansu Province
Following the framework proposed by J. Li and Wang (2022) and further developed by Lin et al. (2023), the DEI is organized into three key dimensions: digital infrastructure, industrial digitalization, and the digital economy environment. The tertiary indicators, together with their units and statistical definitions, are drawn from the China Statistical Yearbook, the China Science and Technology Statistical Yearbook, the China Information Yearbook, and the Gansu Statistical Yearbook; the sample covers 2009–2023. Monetary indicators (e.g., software business revenue, total telecommunications business, and e-commerce sales) are reported at current prices in line with the yearbooks. Because all indicators are min–max normalised to a common 0–1 scale before index construction, comparability across heterogeneous measures is preserved. All tertiary indicators are benefit-type; thus, no sign reversal was required during normalisation. For transparency and comparability, each indicator is cross-walked to widely used international constructs (DESI, OECD digital indicators, ITU’s Measuring Digital Development, and the Network Readiness Index); the cross-walk and the logistics-relevance notes are provided in Appendix B.
The measurement items for the three dimensions are presented in Table 1.

Table 1.
Evaluation index system of digital economy.
The variable “proportion of information-related employment to total employment” is calculated as the number of information-related employees divided by total employment in the same year. Missing observations, when internal to a series, were imputed via series-wise linear interpolation (no extrapolation at the ends). All computations were implemented in MATLAB R2024b (He et al., 2023; J. Yang & Wang, 2024).
To assess digital economy development in Gansu—an underdeveloped province in northwest China—this study constructs annual composite indices. The evaluation employs two widely applied MCDA methods: entropy-weighted TOPSIS and SESP-SPOTIS (He et al., 2023; Kizielewicz et al., 2024; Sun & Pang, 2025). Both approaches use the same normalised input matrix and the same entropy-derived weight vector, so the resulting indices lie on a common 0–1 scale and are directly comparable at the tertiary, secondary and primary levels (C. Guo et al., 2024; Y. Liu, 2024). For reference benchmarking against a standard dimensionality-reduction approach, a PCA-based index is also computed on the same normalised indicators; methodological details are provided in Appendix C, and Section 4.2 reports the comparison.
3.1.1. Entropy-Weighted TOPSIS
The entropy weight-TOPSIS method was utilised to evaluate the development level of the digital economy in Gansu Province. The raw data for each indicator were first normalised. Let denote the original value of the -th sample on the -th indicator. Entropy-weighted TOPSIS is adopted as a compensatory MCDA benchmark that balances heterogeneous indicators on a common 0–1 scale and is widely used in regional digital development assessment. To maintain strict comparability with SESP-SPOTIS, both methods share the same min–max normalised input matrix and the same entropy-derived weight vector across years.
Indicators are min–max normalised across years for each indicator using:
In the above formulae, denotes the corresponding normalised value, which removes the influence of differing measurement units. Where and denote, respectively, the yearly minima and maxima of indicato over 2009–2023.
Subsequently, construct the proportion matrix and calculate, for each indicator, its entropy and redundancy . The redundancy values are then normalised to yield the entropy weights :
In the above expressions, denotes the proportional contribution of the -th indicator in year -th; is the number of sample years (2009–2023, hence n = 15); is the number of tertiary indicators (in this study, m = 21); and is the information entropy of the indicator, reflecting dispersion over all years.
Define the weighted-normalised matrix . Because all indicators are benefit-type, the positive and negative ideal solutions are column-wise maxima and minima of , respectively.
After weighting, the Euclidean distances from the positive ideal solution and from the negative ideal solution are computed on as in Equation (5).
Finally, calculate the comprehensive score, where The larger the value of Ki, the higher the level of digital economy development in the region:
By construction, . Larger values indicate closer proximity to the positive ideal and thus a higher level of digital economy development.
3.1.2. SESP-SPOTIS
To provide a complementary perspective alongside TOPSIS, this study re-evaluates Gansu Province’s digital development level using the SESP-SPOTIS method implemented in MATLAB R2024b (Bánhidi & Dobos, 2023). Unlike TOPSIS, which identifies positive and negative ideal solutions and computes Euclidean distances, SPOTIS uses a fixed reference point with linear aggregation (Bánhidi & Dobos, 2023; Ciardiello & Genovese, 2023; Susmaga et al., 2023). Given that all indicators are benefit-type, the reference vector is , and the componentwise distance is . Minimising is equivalent to maximising , which is the score used below. To maintain score comparability, the entropy-derived weight vector obtained from the TOPSIS procedure is reused here, and the weighted-normalised values are summed across indicators (S. Liu, 2023; Y. Liu, 2024). This distance-based design is less compensatory than Euclidean-distance schemes and is therefore less sensitive to isolated extremes, while remaining on the same 0–1 scale.
Upon completing the min–max normalisation and entropy-weight calculations specified by Equation (1) in Section 3.1.1, the elements of the weighted-normalised matrix are obtained, forming the matrix .
In the above equation, denotes the normalised value of the -th indicator in year , and is the entropy weight assigned to that indicator. Here, m = 21 is the total number of tertiary indicators, and n represents the number of sample years.
The SESP-SPOTIS composite score is obtained by summing the weighted-normalised values for each row .
Because and , it follows that , placing SESP-SPOTIS on the same 0–1 scale as TOPSIS.
To ensure comparability across different methods at each hierarchical level, the study modifies all secondary and primary indicator calculations in SPOTIS to simple cumulative aggregation based on the weighted normalisation matrix V. Specifically, tertiary indicators directly take the column values of matrix V, secondary indicators equal the sum of their constituent tertiary indicators, and primary indicators equal the sum of corresponding secondary indicators. This approach ensures that both entropy weight TOPSIS and the modified SPOTIS maintain identical input matrices and aggregation logic across tertiary, secondary, and primary levels, keeping scores on a common 0–1 scale and ensuring strict cross-method comparability at the tertiary, secondary, and primary levels, while avoiding biases caused by differences in inputs or aggregation rules (Bánhidi & Dobos, 2023; Ciardiello & Genovese, 2023; Susmaga et al., 2023).
3.2. Log-Elasticity Regression Models
The study uses annual data from the Gansu Statistical Yearbook for 2009–2023, covering provincial GDP and the value added of the primary, secondary and tertiary industries (all measured in billion yuan) (Bland & Altman, 1986; X. Fan, 2011; J. Lu & Chuah, 2023). Modern logistics production (MLP) is defined as the value added of transportation, warehousing, and postal services (X. Fan, 2011; Kumar & Agarwal, 2024; J. Lu & Chuah, 2023). The digital economy composite index (DEI) is the entropy-weighted TOPSIS measure constructed in Section 3.1. All logarithms are natural, and no non-positive observations occur in the sample.
Given the relatively short annual window (T = 15), to mitigate omitted-variable bias while avoiding over-parameterisation, the models incorporate one macro control variable , calculated as total fixed-asset investment divided by resident population. The specification adheres to the general-to-specific modelling principle while addressing small-sample risks of multicollinearity and specification error (Hendry, 2024; Krolzig & Hendry, 2001; Lovell, 1983).
Here indexes years (2009–2023); and denote, respectively, GDP and the value added of the three industries (billion yuan). is modern logistics production (value added of transportation, warehousing and postal services), is the digital economy index, and is per capita fixed-asset investment. Coefficients and are interpreted as elasticities—the average percentage change in output associated with a 1% change in or , conditional on . Estimates capture associations in levels rather than causal effects. Models are estimated using OLS. Inference relies on White’s (HC0) heteroskedasticity-robust standard errors (Section 3.3.2), with percentile bootstrap confidence intervals (B = 2000) reported for the preferred specification as a small-sample cross-check (Section 3.3.3). To guard against multicollinearity, variance-inflation factors (VIFs) are computed and reported with the regression tables. Given the short annual sample (T = 15) and the paper’s focus on comparative elasticities in log levels, formal unit-root or cointegration testing is not pursued. To verify that conclusions are not driven by the MCDA choice, the preferred models are re-estimated replacing with the SPOTIS-based index ; results and a brief comparison are provided in Appendix D.
3.3. Robustness Checks
3.3.1. Composite Sensitivity Analysis Methodology
To emulate plausible measurement noise in yearbook statistics while preserving units and signs, the shocks are modelled as multiplicative and bounded at ±10%, a common bandwidth in COMSAM (Composite Sensitivity Analysis Methodology) applications (Hendry, 2024; Klongboonjit & Kiatcharoenpol, 2024; Więckowski & Sałabun, 2024). Each of the 21 indicators is multiplicatively perturbed by an independent random factor with for every indicator and year . This specification preserves units and signs, mimics bounded revisions of about ±10%, and keeps the scale of indicators unchanged across years.
For each year, the 95% sensitivity band is obtained from the empirical 2.5th and 97.5th percentiles of the B simulated index values. For every perturbed dataset, the full pipeline is re-run times—min–max normalisation, entropy-weight calculation, TOPSIS scoring, and weighted-cumulative SPOTIS scoring—using a fixed random seed for reproducibility. Two variants are considered: (i) recomputing entropy weights in each replication to assess weight sensitivity; and (ii) holding the baseline weights fixed to isolate the robustness of the scoring models. Unless otherwise stated, figures report the fixed-weight variant. The chosen B yields stable percentile estimates; larger values produced indistinguishable bands in practice. Because and in all replications, each composite index remains within , ensuring strict comparability with the baseline series. COMSAM thus evaluates robustness to local perturbations in measured indicators and complements the inferential checks in Section 3.3.2 and Section 3.3.3.
3.3.2. White Heteroscedasticity-Robust Standard Errors
In linear regressions, unknown heteroskedasticity may bias conventional OLS standard errors and invalidate inference. To obtain consistent variance estimates, this study reports heteroskedasticity-robust standard errors using the Eicker–White (HC0) covariance estimator proposed by White (1980). Let the model be:
Here denotes the design matrix (including an intercept), the dependent variable, and the vector of OLS residuals. The White (HC0) “sandwich” covariance estimator is:
where stacks the squared residuals on the diagonal. Two-sided t-tests are conducted using these White-robust standard errors with finite-sample degrees of freedom . The results tables report robust standard errors and significance markers.
3.3.3. Bootstrap Resampling
To assess sampling variability of the elasticity estimates, a nonparametric bootstrap is applied to the annual observations for each of the four log–log models. Specifically, a pairs bootstrap is used: for each replication with , the yearly observations are resampled with replacement, the model is re-estimated, and the coefficients and are stored. A fixed random seed is used for reproducibility; in practice, intervals based on and were indistinguishable, so is adopted.
Percentile 95% confidence intervals are obtained from the empirical distributions of . Statistical significance is judged by whether the interval excludes zero, providing a cross-check to the White-robust inference.
4. Data Analysis and Discussion
4.1. Digital Economy Development Index in Gansu Province
Table 2 reports the annual scores of the three primary dimensions and the composite digital economy index (DEI) for 2009–2023; Figure 2 plots the composite DEI together with the three dimension scores on a common 0–1 scale. Entropy-derived weights at the primary dimension level (constant over years) are summarised in Table 3.
Table 2.
Digital Economy Development Index in Gansu Province Based on the Entropy-weighted TOPSIS Method.
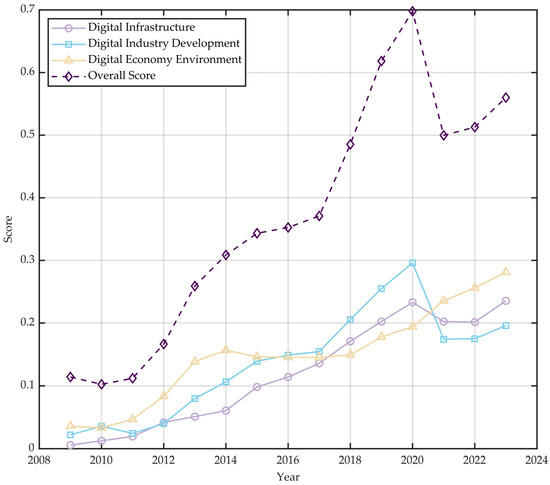
Figure 2.
Digital economy index (DEI) and primary dimension scores for Gansu, 2009–2023, constructed using entropy-weighted TOPSIS (0–1 scale).
Table 3.
Entropy-derived weights by primary dimension (share, %).
Table 2 reports the digital economy development index (DEI) and the three primary dimension scores for Gansu Province based on the entropy-weighted TOPSIS method for 2009–2023; Figure 2 plots the composite DEI (0–1 scale). Overall, the index shows a clear upward trajectory over the sample period, rising from 0.1141 in 2009 to 0.5599 in 2023—an increase of 0.4458, roughly 4.9 times the initial level. Growth accelerated in 2013 (from 0.1665 to 0.2590; +55.6%), consistent with stepped-up progress in digital industrialisation, industrial digitalisation and related application-environment building in that phase. In 2021, the index experienced a temporary setback (0.6979 in 2020 to 0.4997; −28.4%), coinciding with pandemic disruptions, followed by a modest recovery in 2022 (0.5128; +2.6%) and further improvement in 2023 (0.5599; +9.2%).
At the primary dimension level, entropy-derived weights (constant over the sample and summing to one) indicate that digital infrastructure carries the largest share (39.55%), followed by industrial digitalisation (35.78%) and the digital economy environment (24.67%). These patterns indicate that infrastructure remains the main driver, while environment-related weaknesses merit policy attention (He et al., 2023).
For cross-method comparability, all indices are normalised to and constructed under the same weighting scheme. A side-by-side comparison with the SESP-SPOTIS results is presented.
4.2. Comparative Analysis of Entropy-Weighted TOPSIS and SESP-SPOTIS Results
Table 4 reports the annual scores of the three primary dimensions and the composite digital economy index (DEI) for 2009–2023 under the SESP-SPOTIS framework; Figure 3 plots the composite DEI together with the three dimension scores on the common 0–1 scale used throughout.
Table 4.
Digital Economy Development Index in Gansu Province based on the SESP-SPOTIS method.
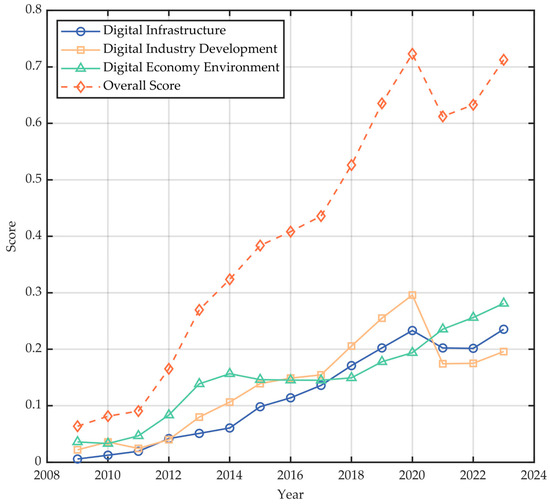
Figure 3.
Temporal trend of the Digital Economy Development Index in Gansu Province using the SESP-SPOTIS method.
Table 4 and Figure 3 are computed using the identical weighted normalisation matrix V and the same level-by-level cumulative aggregation as in entropy-weighted TOPSIS. Because the tertiary/secondary/primary calculations are aligned, the three primary dimension values are identical to those in Table 2; only the final composite-index synthesis differs (TOPSIS uses distances to ideal solutions, whereas SESP-SPOTIS linearly cumulates weighted indicators). In levels, SESP-SPOTIS spans a wider range: in early years it is lower than TOPSIS (e.g., 2009: 0.0637 vs. 0.1141), while in later years it is higher (e.g., 2023: 0.7125 vs. 0.5599). Nevertheless, both methods display the same temporal pattern—steady gains over 2009–2020, a pandemic-related dip in 2021, and recovery in 2022–2023—indicating strong cross-method consistency under a unified aggregation framework. As an additional reference, a PCA-based index constructed on the same normalised indicators (Appendix C) shows a similar trajectory, reinforcing the comparative conclusions.
To summarise the concordance at the composite level, Figure 4 plots SESP-SPOTIS against entropy-weighted TOPSIS for the 2009–2023 annual observations, along with a fitted line.
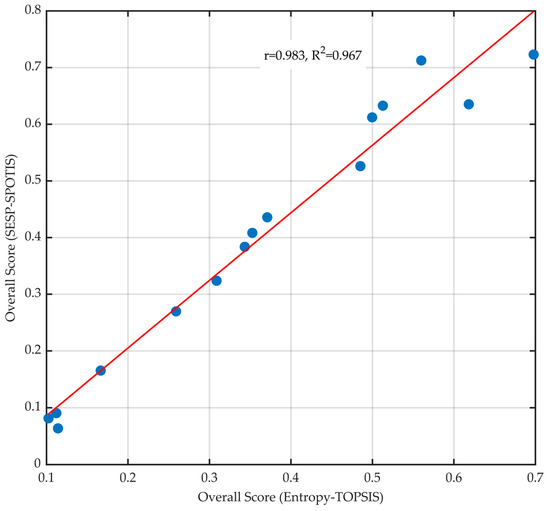
Figure 4.
Scatter plot of SESP-SPOTIS (blue dots) versus entropy-weighted TOPSIS (DEI), 2009–2023, with fitted regression line (red).
As shown in Figure 4, the association is very strong: the Pearson correlation is r = 0.983 and the coefficient of determination R2 = 0.967, implying that more than 96% of the variance in SESP-SPOTIS values is linearly explained by TOPSIS. This high concordance indicates that, given identical inputs and weighting, the two MCDA approaches deliver consistent assessments of Gansu’s digital economy development.
To compare year-to-year dynamics, Figure 5 overlays the two composite indices. The turning points coincide: moderate gains in 2009–2013, faster increases after 2014, a peak around 2020, a 2021 setback, and a recovery in 2022–2023. Although the SESP-SPOTIS series lies above or below TOPSIS in different periods due to its linear aggregation, the directions and timing of movements are nearly identical. Taken together with Figure 4, these results show that entropy-weighted TOPSIS and SESP-SPOTIS are highly consistent when applied under a unified weighting/normalisation scheme, supporting the robustness of the measurement strategy and enabling cross-method interpretation of the DEI.
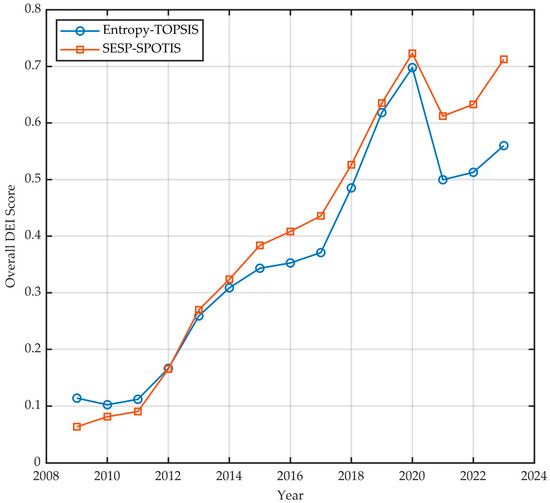
Figure 5.
Overlaid annual composite indices: Entropy-weighted TOPSIS vs. SESP-SPOTIS (DEI), 2009–2023.
As observed from Figure 5, the two methods yield highly similar trajectories. During 2009–2013, the index rose moderately and then accelerated after 2014, reaching a local peak around 2020. Under the impact of COVID-19, a marked decline occurred in 2021, followed by a recovery in 2022–2023. The SESP-SPOTIS series starts below TOPSIS in earlier years (e.g., 2009) and ends above it in more recent ones (e.g., 2023), a pattern driven by its linear aggregation. Still, the two methods produce nearly identical turning points, directions of change, and cycles. These common patterns—rapid improvement, temporary shocks, and subsequent recovery—characterise the evolution of Gansu’s digital economy over the last decade and support the reasonableness of the indicator system and scoring approaches.
Figure 3 and Figure 4 further illustrate that, despite level differences, the entropy-weighted TOPSIS and SESP-SPOTIS results remain closely aligned—demonstrating strong methodological consistency under a shared normalization and weighting framework. For benchmarking against a standard dimensionality-reduction approach, a PCA-based index is computed on the same normalised indicators. The PCA series moves closely with both DEIs (r ≈ 0.95 with entropy-weighted TOPSIS; r ≈ 0.99 with SESP-SPOTIS), as detailed in Appendix C (Figure A1 and Figure A2 and Table A3).
4.3. Sensitivity Analysis of Evaluation Methods Using COMSAM
In the composite-index stage, robustness to plausible measurement noise is assessed using COMSAM (Hendry, 2024; Klongboonjit & Kiatcharoenpol, 2024). Each of the 21 indicators is multiplicatively perturbed by an independent random factor δ drawn from the uniform interval . For each perturbed dataset, the full pipeline is rerun for simulations (min–max normalisation, entropy-weight calculation, TOPSIS scoring, and weighted-cumulative SPOTIS scoring). For each year, the 95% sensitivity band is constructed from the 2.5th and 97.5th percentiles of the simulated index values. Unless otherwise noted, figures report the fixed-weight variant to focus on the stability of the scoring models; re-estimating entropy weights in every replication yields similar conclusions.
As shown by the pink band in Figure 6, the 95% sensitivity band remains narrow relative to the level of the index in all years. Even under ±10% indicator perturbations the entropy-weighted TOPSIS DEI shows high stability; the band widens modestly around 2020–2021, but the magnitude is limited, and the time profile is smooth. This indicates that the TOPSIS-based index is tolerant to small input variations and is suitable for subsequent empirical analysis. The same procedure is applied to the SESP-SPOTIS index to examine cross-method robustness. Figure 7 shows the original SESP-SPOTIS series together with its 95% sensitivity band.
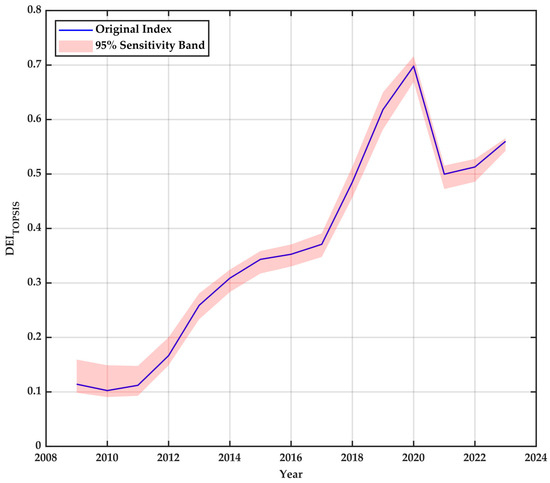
Figure 6.
Evaluation of the TOPSIS-based digital economy index and COMSAM 95% sensitivity band.
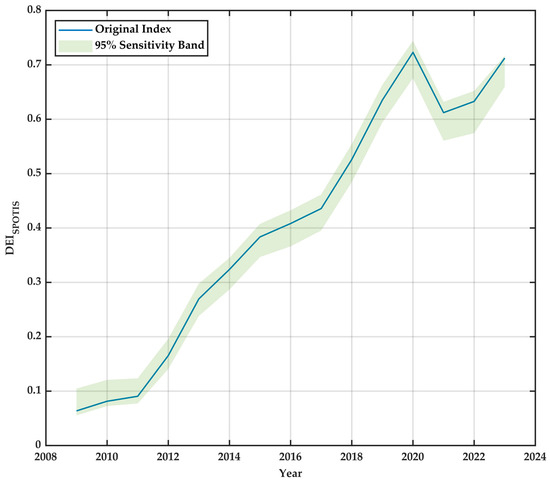
Figure 7.
Evaluation of the SESP-SPOTIS-Based Digital Economy Index and COMSAM Sensitivity Intervals.
The green band in Figure 7 is likewise narrow, with a slight widening in 2020–2021, confirming robustness of the SESP-SPOTIS index to modest input perturbations. Compared with TOPSIS, SESP-SPOTIS displays a somewhat wider band—consistent with its linear, less-compensatory aggregation—yet the qualitative dynamics and the year-by-year rankings are unchanged. Overall, the COMSAM evidence supports the stability and reliability of both indices and provides a sound basis for the log-elasticity regressions that follow.
4.4. Analysis of the Relationship Between Modern Logistics Industry and Economic Development in Gansu Province
Table 5 reports descriptive Pearson correlations among modern logistics production (MLP), the digital economy index (DEI), provincial GDP and sectoral value added (2009–2023). MLP is strongly correlated with GDP (r = 0.947, p < 0.01) and with the primary (0.954), secondary (0.950) and tertiary (0.908) sectors, suggesting broad co-movement between logistics modernisation and macro- and sectoral outcomes. DEI is positively correlated with GDP (0.875, p < 0.01) and shows stronger association with the tertiary sector (0.922) than with the secondary sector (0.711), consistent with faster digital uptake in services relative to manufacturing. These bivariate associations are descriptive and are used to motivate the elasticity models.
Table 5.
Correlation analysis between output value of modern logistics industry and primary indicators; total score of digital economy development in Gansu Province.
Table 6 reports log–log elasticity estimates with a single macro control, ln(FAI_pc) (fixed-asset investment per capita). Across all four equations, the elasticity of ln(Logistics) is positive and statistically significant—0.773 for GDP, 1.029 for the primary sector, 0.809 for the secondary sector, and 0.677 for the tertiary sector (HC0 t-values in parentheses). The digital economy index (ln(DEI)) is positive and significant for GDP (0.210), the primary sector (0.261), and the tertiary sector (0.423), while it is statistically indistinguishable from zero in the secondary model (−0.071). Estimates are obtained using OLS, and inference is based on Eicker–White (HC0) heteroskedasticity-consistent standard errors. Variance-inflation factors indicate no problematic multicollinearity (MaxVIF ≈ 3.90 < 5).
Table 6.
Estimated log-elasticities of logistics development and the digital economy on GDP and sectoral value-added in Gansu Province.
Sampling variability over the short annual window is addressed by running 2000 pairs-bootstrap replications (B = 2000) on the preferred model specifications. The 95% percentile intervals reported in Table 7 corroborate the inference based on HC0 standard errors: the elasticity of ln(Logistics) is consistently positive across all models, while the intervals for ln(DEI) exclude zero in the GDP, primary, and tertiary models but span zero in the secondary model. The results are also robust to replacing DEI with the SPOTIS-based index (see Appendix D).
Table 7.
Bootstrap 95% confidence intervals for log-elasticity coefficients.
The bootstrap results corroborate the White-robust inference. For ln(Logistics), the 95% intervals exclude zero in all four models, confirming a robust positive association with GDP and sectoral value added. For ln(DEI), the intervals exclude zero in the GDP, primary and tertiary models but include zero in the secondary model, indicating that the manufacturing-sector effect is not statistically different from zero at the 5% level. Taken together, White-robust standard errors and bootstrap percentile intervals provide consistent evidence that the main findings are stable with respect to heteroskedasticity and finite-sample uncertainty. These checks address variance robustness; causal identification is beyond the scope of the present analysis. Results are also stable to replacing DEI with the SPOTIS-based index; see Appendix D, where signs and significance patterns remain qualitatively unchanged.
5. Conclusions and Recommendations
5.1. Conclusions
Gansu Province lies in China’s northwest inland region, bordering the less-developed provinces of Xinjiang, Qinghai, Ningxia, and Inner Mongolia (G. Wang & Chen, 2025). Despite its vast territory, fragile ecology and consistently low per capita GDP—about CNY 48,000 in 2023—identify it as a typical underdeveloped region (Z. Zhang et al., 2023). Against this background, the digital economy is at a critical development stage yet shows a steady upward trajectory over 2009–2023. Under a common 0–1 scale, both the entropy-weighted TOPSIS and the SESP-SPOTIS indices display similar dynamics with a temporary dip in 2021 and subsequent recovery, suggesting that the long-run improvement is not an artefact of a particular index construction. At the dimension level, entropy-derived weights point to digital infrastructure as the largest contributor, followed by industrial digitalisation and the digital economy environment, consistent with the central role of hardware and software facilities in enabling digital activity (He et al., 2023). Within the infrastructure family, the faster rise of software-related indicators has been a key driver; by contrast, negative growth episodes in digital industrialisation reveal bottlenecks in software service revenue and the number of electronics manufacturing firms that merit targeted attention. The application environment grows more slowly, implying scope for policies that expand internet services and e-commerce penetration, while the talent environment still lags and high-quality talent outflow—especially from higher education—remains pronounced (Pang, 2016; B. Yang, 2024; Yao & Zhang, 2024).
With respect to real-economy linkages, the log-elasticity regressions indicate a statistically significant and economically meaningful association between modern logistics production and provincial GDP, as well as between logistics and value added in the primary, secondary and tertiary sectors: the elasticity of logistics output is positive and statistically significant across all four models. These associations are estimated in log–log specifications with a single macro control—fixed-asset investment per capita—to preserve parsimony and limit multicollinearity given the short annual sample. The digital economy index (DEI) is positively associated with GDP and with value added in the primary and tertiary sectors, while its coefficient is not statistically significant in the secondary sector. This pattern is consistent with deeper digital integration on the services side and with a comparatively slower diffusion of digital technologies into manufacturing. In agriculture, logistics and digitalisation jointly support quality upgrading through cold-chain development, reduced transport losses and faster market access for speciality produce, which can raise farm incomes (Dani, 2015; Han et al., 2021; Y. Li & Liu, 2024; Lomotko et al., 2021; Shi & Chen, 2024; Yan et al., 2023).
Multiple robustness checks reinforce these findings. The two MCDA indices yield highly coherent levels and rankings; COMSAM sensitivity bands around both indices are narrow, indicating stability under plausible measurement noise; and inference based on Eicker–White (HC0) heteroskedasticity-consistent standard errors together with bootstrap percentile intervals confirms the significance profile of the elasticity estimates. These checks speak to statistical robustness rather than causal identification, which lies beyond the scope of this study.
Sustained investment in digital infrastructure, continued progress in industrial digitalisation and improvements in the digital economy environment would further strengthen the complementarity between the digital economy and modern logistics. Priorities include addressing software-service and electronics-manufacturing bottlenecks, enlarging e-commerce and internet-service coverage, and implementing talent-retention policies commensurate with Gansu’s development stage (Pang, 2016; B. Yang, 2024; Yao & Zhang, 2024). Such measures can raise logistics efficiency and service quality, and, through that channel, support coordinated upgrading across the primary, secondary and tertiary sectors—thereby contributing institutional and technological support to high-quality, sustainable regional growth in Gansu.
5.2. Recommendations for Promoting the Development of Logistics Industry in Gansu Province Under the Digital Economy
The evidence in Section 4 indicates that modern logistics production exhibits a robust, positive elasticity with provincial GDP and with value added in the primary, secondary and tertiary sectors, while the digital economy index (DEI) is positively associated with GDP and with the primary and tertiary sectors but is not statistically significant in the secondary sector. Building on these results, the following policy priorities aim to strengthen complementarities between the digital economy and logistics while addressing the observed manufacturing gap.
Continue upgrading digital infrastructure and service accessibility. Sustained investments in core digital infrastructure—big-data centres, industrial Internet of Things (IoT) platforms, high-speed broadband, and edge-computing nodes—remain foundational for smart logistics operations (Joshi et al., 2024; R. Li et al., 2023; Q. Song, 2024; X. Yang, 2024). Beyond visible assets (fibre networks, data centres), equal emphasis should be placed on service accessibility and quality, especially in rural and remote counties, through concurrent expansion of coverage and digital-skills training so that digitalisation benefits are broadly shared (Qiao & Lü, 2025; B. Yang, 2024). Leveraging the national integrated computing-power network and Gansu’s pilot role can support low-latency logistics monitoring and emergency response via multi-level edge coordination (Joshi et al., 2024; R. Li et al., 2023).
Deepen industrial digitalisation with a specific focus on manufacturing. Given the non-significant DEI coefficient in the secondary sector, targeted measures are warranted to accelerate digital adoption in manufacturing. Recommended actions include: promoting interoperability between enterprise production systems and logistics systems (e.g., manufacturing execution systems (MES) and enterprise resource planning (ERP) with warehouse management systems (WMS) and transportation management systems (TMS)), supporting cloud-based supply chain visibility, and piloting intelligent sorting centres and semi-automated warehouses in key parks (B. Cao, 2025; H. Liu et al., 2022; W. Zhang et al., 2022). Promoting integration across production, education, research, and application will help foster a virtuous cycle in which digital and logistics industry chains grow synergistically (Yuan & Yang, 2024).
Improve the institutional environment and build human capital for digital logistics integration. Drawing on practices in more developed regions, provincial authorities can refine digital economy regulations, streamline procedures for SME digital transformation and reduce compliance costs (Yu & Liu, 2022). Talent remains a binding constraint; targeted programmes (tax incentives, project-linked subsidies and industry funds) should be used to attract and retain professionals in software, data analytics and network engineering, coupled with university–industry pipelines to slow high-end talent outflow (X. Cao & Bao, 2023; S. Chen et al., 2025; J. Li, 2023). Routine, indicator-based monitoring and periodic policy reviews are advised to keep support measures targeted and adaptive to changing conditions (Jia et al., 2024; P.-J. Xie et al., 2023).
Advance a “digital agriculture–smart logistics–green development” pathway. Although the primary sector shows a smaller direct elasticity than services, cold-chain expansion, traceability, and rural e-commerce can raise agricultural efficiency and incomes while reinforcing logistics demand (Dong & Pu, 2025; X. Fan et al., 2024). Priority projects include precision agriculture, agricultural IoT and big-data platforms, unmanned aerial vehicle (UAV)–enabled field monitoring, and joint traceability/warehouse hubs developed by producers, processors and cold-chain firms (Gansu Provincial People’s Congress Standing Committee, 2024; J. Y. Lu et al., 2025; Qiao & Lü, 2025; Saini et al., 2025; C. Song et al., 2022; Z. Wang et al., 2025; X. Zhang et al., 2022; Y. Zhou & Zhang, 2024).
In conclusion, the empirical profile documented in this study suggests a phased roadmap for Gansu. The first priority is to consolidate infrastructure and accessibility, followed by accelerating digitalisation in manufacturing sectors where significant gaps remain. Parallel efforts are required to enhance the business environment and strengthen talent pipelines, while the upgrading of agri-logistics ecosystems constitutes another critical dimension. By advancing these complementary measures, the province can improve logistics efficiency and service quality and, through that channel, foster high-quality and sustainable economic growth.
5.3. Limitations and Future Research
The empirical window ends in 2023 because of the release cycle of official yearbooks; monetary series are in current prices, and while min–max normalisation places all indicators on a common 0–1 scale, inflation and relative price shifts may still shape trajectories. Indicator families follow domestic statistical definitions with an explicit cross-walk to international constructs; where provincial time series are unavailable, transparent proxies are employed. Entropy weights are held fixed across years to preserve comparability, and indices are reported under both a compensatory (entropy-weighted TOPSIS) and a non-compensatory (SESP-SPOTIS) scheme with a PCA benchmark. Given catch-up dynamics, most indicators trend upward and composite indices rise; accordingly, cross-method agreement and COMSAM sensitivity bands mitigate, but do not eliminate, this mechanical component. The log–log regressions are reduced-form associations estimated on a short annual sample. Accordingly, statistical inference uses Eicker–White (HC0) heteroskedasticity-consistent standard errors and percentile bootstrap intervals and does not attempt causal identification via extensive control sets or instruments. Modern logistics production is proxied by the value added of transportation, warehousing, and postal services, which may under-represent platform-based logistics; the single-province design also limits external validity. To contain over-parameterization and multicollinearity in this short sample, a single macro control—fixed-asset investment per capita—is included; while this enhances parsimony, it may leave some macro channels unmodeled.
Looking ahead, several extensions would strengthen the analysis while maintaining continuity with the present design. As new yearbooks are released, the sample can be extended and deflated variants tested; where feasible, prefecture-level and operational micro-data (e.g., freight turnover, express parcel volumes, logistics employment) can complement value-added proxies. Indicator design may be aligned more closely with international frameworks, and alternative weighting/normalisation choices—such as time-varying entropy or CRITIC weights—can be evaluated alongside break tests or detrended indices to separate structural trends from shocks. With longer time series or broader cross-provincial panels, identification strategies (e.g., instrumental variables, lag structures, spatial panels) could be implemented to strengthen causal interpretation; methodologically, dynamic-factor or Bayesian factor models offer natural complements to PCA for benchmarking. Comparative analyses across western provinces and within-province heterogeneity would improve generalisability and sharpen policy relevance.
Author Contributions
Conceptualization, J.L. and S.-C.C.; Methodology, S.-C.C. and D.-M.X.; Software, J.L.; Validation, J.L., S.-C.C. and D.-M.X.; Formal Analysis, J.L. and J.G.; Investigation, J.L. and J.G.; Resources, J.L.; Data Curation, J.L.; Writing—Original Draft Preparation, J.L.; Writing—Review and Editing, J.L., S.-C.C. and J.G.; Visualisation, J.L. and J.G.; Supervision, S.-C.C.; Project Administration, S.-C.C.; Funding Acquisition, D.-M.X. All authors have read and agreed to the published version of the manuscript.
Funding
In this study, we would like to acknowledge the financial support from Chongqing Institute of Engineering, P.R.C (Chongqing Municipal Education Research Experimental Base, Grant No. JD2024Z003).
Institutional Review Board Statement
Not applicable.
Informed Consent Statement
Not applicable.
Data Availability Statement
The raw data supporting the conclusions of this article will be made available by the authors on request.
Conflicts of Interest
The authors declare no conflicts of interest.
Abbreviations
The following abbreviations are used in this manuscript:
| Abbreviation | Definition |
| CCD | Coupling-coordination degree |
| CI | Confidence interval |
| COMSAM | Composite Sensitivity Analysis Methodology |
| DEI | Digital Economy Index |
| ERP | Enterprise resource planning |
| FAI_pc | Fixed-asset investment per capita |
| GDP | Gross domestic product |
| HC0 | Heteroskedasticity-consistent covariance estimator (White, 1980), “HC0” variant (robust standard errors). |
| IoT | Internet of Things |
| IV | Instrumental variable |
| LPI | Logistics Performance Index |
| MES | Manufacturing execution system |
| MLP | Modern logistics production (value added in transportation, warehousing and postal services) |
| OLS | Ordinary least squares |
| PCA | Principal component analysis |
| R&D | Research and development |
| SESP-SPOTIS | SPOTIS extension (non-compensatory MCDA approach) |
| SPOTIS | Stable Preference Ordering Towards Ideal Solution (non-compensatory MCDA approach) |
| TMS | Transportation management system |
| TOPSIS | Technique for Order Preference by Similarity to Ideal Solution |
| WMS | Warehouse management system |
| VIF | Variance inflation factor |
Appendix A
To complement the narrative review in Section 2, Appendix A consolidates representative journal studies that anchor three elements of this study’s design: conceptual baselines for logistics digitalisation (indicator families and mechanisms); empirical frameworks that jointly assess digital economy and logistics subsystems; and methodological cautions for logistics metrics. Studies were selected for their clear relevance to digitalisation–logistics links and for offering explicit implications for measurement choices or robustness checks. The table maps each study to digital elements, logistics outcomes, methods, key findings and its specific relevance to this study.
Table A1.
Representative studies on digitalisation–logistics links and measurement baselines.
Table A1.
Representative studies on digitalisation–logistics links and measurement baselines.
| Author–Year | Region/Scope | Digital Economy Elements (Examples) | Logistics Outcomes/Metrics | Method | Key Finding | Relevance to This Study |
|---|---|---|---|---|---|---|
| Winkelhaus & Grosse (2020) | Global (review) | Cyber-physical systems, IoT, analytics, automation | Process redesign; capability portfolios | Systematic review | Logistics 4.0 reshapes processes and competencies | Conceptual basis for indicator families and mechanisms used in DEI construction. |
| Zennaro et al. (2022) | Global/EU | E-commerce platforms, ICT | Logistics KPIs under e-commerce | Structured review | Maps research areas and KPI sets | Aligns logistics outcome measures with digital enablement; informs MLP interpretation. |
| Spieske & Birkel (2021) | Global | Industry 4.0 enablers | Resilience under disruptions | Systematic review | Data-driven tools improve resilience | Supports the link from digitalisation to reliable performance, motivating robustness checks. |
| Y. Guo et al. (2022) | China—Anhui | Digital infrastructure; industry digitalisation | Provincial logistics development; coordination degree | Coupling-coordination model | Positive coordination between digital economy and logistics | Precedent for joint DE–logistics indices at provincial scale. |
| Y. Guo et al. (2022) | China—Anhui | As above | CCD diagnostics | Coupling-coordination model | Confirms feasibility and policy diagnostics | Supports indicator mapping and diagnostic use. |
| Shu et al. (2023) | China (national/rural) | Digital penetration | Rural logistics coupling/CCD | Coupling-coordination model | Positive coupling and co-evolution | Evidence in less-developed settings, relevant to Gansu. |
| Beysenbaev & Dus (2020) | Global | Measurement critique | Logistics Performance Index (LPI) | Methodological assessment | Proposes improvements to LPI | Caution for metric design; motivates robustness beyond single-score indices. |
Notes: IoT = Internet of Things; CCD = coupling-coordination degree; KPI = key performance indicator. The table is illustrative rather than exhaustive and is intended to justify measurement choices and robustness checks used in this paper.
Appendix B
Appendix B aligns each tertiary indicator in Table 1 with representative international constructs and states the expected logistics link. And all tertiary indicators are benefit-type. Four references are used as conceptual anchors: the EU’s Digital Economy and Society Index methodological notes (European Commission, 2025); OECD digital indicators and the Digital Economy Outlook (OECD, 2024a, 2024b); ITU’s Measuring Digital Development series (International Telecommunication Union [ITU], 2024); and the Network Readiness Index methodology (Portulans Institute, 2024). The mapping targets conceptual equivalence rather than identical construction; when no exact counterpart exists, the closest concept is reported. Units and directionality follow the China Statistical Yearbook, the China Science and Technology Statistical Yearbook, the China Information Yearbook, and the Gansu Statistical Yearbook to preserve provincial comparability over 2009–2023.
Table A2.
Indicator cross-walk to international frameworks and logistics relevance.
Table A2.
Indicator cross-walk to international frameworks and logistics relevance.
| Tertiary Measurement Index | Unit | Direction (+/−) | Logistics Linkage (Mechanism) | International Anchor |
|---|---|---|---|---|
| Length of Long-distance Optical Cable Lines | Ten thousand kilometres | + | Backbone capacity and geographic reach support high-throughput logistics IT and IoT backhaul | DESI: Connectivity (fixed VHCN/FTTP coverage); ITU: Fixed network deployment |
| Broadband Internet Access Ports | Ten thousand | + | Greater fixed access reduces coordination/search costs; enables tracking/EDI | ITU: Fixed-broadband subscriptions; DESI: Connectivity |
| Mobile Phone Base Stations | Ten thousand | + | Denser radio access improves coverage/reliability for real-time logistics apps | ITU: Mobile-cellular network coverage; DESI: 4G/5G coverage |
| Number of Internet Domains | Ten thousand | + | Proxy for online presence; expands digital order and service interfaces | NRI: Businesses’ online presence; OECD: Firms with websites |
| Number of IPv4 Addresses | Ten thousand | + | Network scale proxy facilitating device connectivity for logistics systems | ITU: Internet resources; NRI: International bandwidth/technology pillar |
| Number of Internet Websites | Ten thousand | + | Content and service supply supporting platform-based logistics | OECD: Business ICT use (websites); DESI: Integration of digital technology |
| Software Business Revenue | Hundred million yuan | + | Local digital services capacity (WMS/TMS/analytics) for logistics optimisation | OECD: ICT services value added; NRI: Technology |
| Total Telecommunications Business | Hundred million yuan | + | Sector throughput reflecting communication-service availability for logistics | OECD: Telecom revenues/traffic indicators |
| Number of Electronic Information Manufacturing Enterprises | Unit | + | Upstream supply of ICT equipment/devices used in logistics systems | OECD: ICT manufacturing; industry statistics |
| Number of Websites Owned by Every 100 Enterprises | Unit | + | Business digital presence enables order integration and customer visibility | DESI: Business digitisation (firms with websites/e-sales); OECD: E-commerce uptake |
| Proportion of Enterprises with E-commerce Transaction Activities | % | + | Platform adoption integrates fulfilment flows and creates logistics demand | DESI: SMEs with e-sales; OECD: E-commerce indicators |
| E-commerce Sales | Hundred million yuan | + | Digital transaction volume drives warehousing/transport workloads | OECD: E-commerce sales; DESI: Integration of digital technology |
| Number of Computers Used by Every 100 People | Unit | + | End-user hardware supports digital ordering, tracking and information exchange | OECD: Household/individual ICT access; NRI: People use of technology |
| Number of Mobile Internet Users | Ten thousand households | + | Mobile broadband adoption enables last-mile apps and real-time updates | ITU: Active mobile-broadband subscriptions |
| Number of Mobile Phone Users | Ten thousand households | + | General connectivity enlarges digital reach for logistics notifications | ITU: Mobile-cellular subscriptions |
| Number of Digital Phone Users | Ten thousand households | + | Fixed telephony complements enterprise communications and call-centre services | ITU: Fixed-telephone subscriptions |
| Proportion of Information Technology Employment to Total Employment | % | + | ICT human capital for logistics digitalisation projects and operations | DESI: Human capital (ICT specialists); OECD: ICT employment |
| Number of Undergraduate Graduates | Person | + | Education stock supporting adoption of digital tools in logistics | OECD: Tertiary graduates indicators |
| Full-time Equivalent of R&D Personnel | Person-year | + | Innovation capacity enabling algorithm/design improvements in logistics | OECD: R&D personnel (FTE); GERD statistics |
| Number of R&D Institutions | Unit | + | Research infrastructure for technology transfer to logistics | OECD/UNESCO: R&D institutions |
| Number of Patents Granted | Unit | + | Knowledge outputs underpinning digital logistics technologies | OECD/WIPO: Patents indicators |
Notes: “International anchor” lists the closest conceptual counterparts; exact operational definitions may differ. Direction “+” indicates an expected positive contribution to digital economy capacity for logistics. Data sources are the China Statistical Yearbook, the China Science and Technology Statistical Yearbook, the China Information Yearbook, and the Gansu Statistical Yearbook.
Appendix C
This appendix reports a PCA benchmark computed on the same indicator matrix used for the MCDA indices. Indicators are min–max normalised to [0, 1] across the full sample. Because the sign of principal components is not identified, the first principal component (PC1) is oriented to have non-negative correlation with the entropy-weighted TOPSIS index and then rescaled to [0, 1]. In this sample, PC1 explains about 0.667 of the total variance in the indicator set. The outputs (Figure A1 and Figure A2 and Table A3) show that PCA yields dynamics and rankings that are highly consistent with the entropy-weighted TOPSIS and SESP-SPOTIS indices.

Figure A1.
Composite indices overlay: TOPSIS, SESP-SPOTIS and PCA (Gansu, 2009–2023).
Figure A1.
Composite indices overlay: TOPSIS, SESP-SPOTIS and PCA (Gansu, 2009–2023).

All indices are computed on the same 0–1 normalised indicators. The PCA series is oriented to have non-negative correlation with the TOPSIS DEI and rescaled to [0, 1]. The three series share a common upward trajectory, a temporary dip in 2021 and a recovery in 2022–2023, indicating that comparative dynamics are not sensitive to the aggregation method.
Figure A2 illustrates that each point represents one year. The fitted line is obtained from an OLS regression of TOPSIS on the PCA index. The strong association (see Table A3) confirms the coherence between PCA and the compensatory MCDA benchmark. Table A3 summarises the strength of associations among the three methods. Within the study sample, SESP-SPOTIS and TOPSIS exhibit an exceptionally high correlation, while PCA also shows strong consistency with both TOPSIS and SESP-SPOTIS, supporting method-independent ranking.

Figure A2.
PCA index versus entropy-weighted TOPSIS (with fitted line).
Figure A2.
PCA index versus entropy-weighted TOPSIS (with fitted line).

Table A3.
Pairwise correlations and linear fits among DEIs (Pearson r, Spearman r and linear R2).
Table A3.
Pairwise correlations and linear fits among DEIs (Pearson r, Spearman r and linear R2).
| Pair | Pearson r | Spearman r | R2 (Linear) |
|---|---|---|---|
| SPOTIS vs. TOPSIS | 0.9832 | 0.9857 | 0.9666 |
| PCA vs. TOPSIS | 0.9482 | 0.9357 | 0.8992 |
Appendix D
As an index-definition robustness check, the TOPSIS-based DEI used in Section 4.4 is replaced with the SPOTIS-based composite introduced in Section 3.1.2, rescaled to the [0, 1] range for comparability. The four log–log models are re-estimated with a single macro control, ln(FAI_pc), following a general-to-specific approach suitable for the short annual sample. Inference is based on Eicker–White (HC0) robust standard errors, and variance-inflation factors indicate no problematic multicollinearity (MaxVIF < 5). The results remain qualitatively unchanged: the elasticity of ln(Logistics) is significantly positive in all four equations, while the digital economy index is significant for GDP, the primary sector, and the tertiary sector, but not for the secondary sector. Accordingly, the main tables retain the baseline DEI, and the SPOTIS-based estimates are reported in Table A4 for completeness.
The elasticity of ln(Logistics) remains positive and highly significant across all four models. The SPOTIS-based DEI is significantly positive for GDP, Primary, and Tertiary, and statistically insignificant in Secondary, mirroring the pattern obtained with the TOPSIS-based DEI. Hence, the main findings are robust to the choice of DEI construction method, and the substantive conclusions in Section 4.4 are unchanged.
Table A4.
Robustness check: Estimated log-elasticities of logistics development and the digital economy on GDP and sectoral value-added in Gansu Province (SPOTIS Index).
Table A4.
Robustness check: Estimated log-elasticities of logistics development and the digital economy on GDP and sectoral value-added in Gansu Province (SPOTIS Index).
| Variable | Model 1: ln(GDP) | Model 2: ln(Primary) | Model 3: ln(Secondary) | Model 4: ln(Tertiary) |
|---|---|---|---|---|
| Intercept | 4.6988 *** (5.685) | 2.8055 ** (2.339) | 0.8021 (0.726) | 6.0688 *** (7.585) |
| ln(Logistics) | 0.7057 *** (6.974) | 0.9713 *** (8.774) | 0.8002 *** (5.864) | 0.5615 *** (5.871) |
| ln(DEI) | 0.2201 *** (6.065) | 0.2568 *** (4.570) | −0.0548 (−1.444) | 0.4300 *** (10.101) |
| ln(FAI_pc) | 0.0204 (0.557) | −0.1547 (−1.956) | 0.2258 ** (2.811) | −0.0782 (−1.551) |
| R2 | 0.9812 | 0.9596 | 0.9259 | 0.9821 |
| F-statistic | 244.844 *** | 111.720 *** | 59.305 *** | 257.685 *** |
Note: Robust t statistics in parentheses, computed using White’s (1980) heteroskedasticity-consistent standard errors (HC0). *** p < 0.01, ** p < 0.05. Specifications are consistent with the main text models, employing a single macro control (lnFAI_pc); variables and sample are identical to Section 4.4.
References
- Achkasova, L. M. (2024). Features of Digital Transformation of the Enterprise’s Transport-Logistics System. Ekonomika Transportnoho Kompleksu, 43, 211. [Google Scholar] [CrossRef]
- Bánhidi, Z., & Dobos, I. (2023). Sensitivity of TOPSIS Ranks to Data normalisation and Objective Weights on the Example of Digital Development. Central European Journal of Operations Research, 32, 29–44. [Google Scholar] [CrossRef]
- Bergmann, F. M., Wagner, S. M., & Winkenbach, M. (2020). Integrating first-mile pickup and last-mile delivery on shared vehicle routes for efficient urban e-commerce distribution. Transportation Research Part B: Methodological, 131, 26–62. [Google Scholar] [CrossRef]
- Beysenbaev, R., & Dus, Y. (2020). Proposals for improving the logistics performance index. The Asian Journal of Shipping and Logistics, 36, 34–42. [Google Scholar] [CrossRef]
- Bland, J. M., & Altman, D. (1986). Statistical methods for assessing agreement between two methods of clinical measurement. Lancet, 327(8476), 307–310. [Google Scholar] [CrossRef]
- Cao, B. (2025). Efficiency of unmanned storage in intelligent logistics: A case study of Jingdong logistics Kunshan sorting center. Advances in Economics, Management and Political Sciences, 166, 183–188. [Google Scholar] [CrossRef]
- Cao, X., & Bao, C. (2023, July 21–23). Government subsidy, tax incentives and innovation of small and medium-sized enterprises in China. 2023 14th International Conference on E-Business, Management and Economics (ICEME’23) (pp. 398–403), Beijing, China. [Google Scholar] [CrossRef]
- Chen, S., Lai, H., & Tao, Z. (2025). Research on the optimization of Jiangsu province talent policy under the background of digital economy: A comparative analysis of Shenzhen’s talent policy based on machine learning models. Computer Fraud & Security, 2025(1), 114–122. [Google Scholar] [CrossRef]
- Chen, X., & Ling, X. (2023). A conceptual model study of tourism resource sharing in the digital economy. Sustainability, 15, 9752. [Google Scholar] [CrossRef]
- Ciardiello, F., & Genovese, A. (2023). A comparison between TOPSIS and SAW methods. Annals of Operations Research, 325, 967–994. [Google Scholar] [CrossRef]
- Cichosz, M., Wallenburg, C. M., & Knemeyer, A. M. (2020). Digital transformation at logistics service providers: Barriers, success factors and leading practices. The International Journal of Logistics Management, 31(2), 209–238. [Google Scholar] [CrossRef]
- Dani, S. (2015). Food supply chain management and logistics: From farm to fork. Kogan Page Publishers. [Google Scholar]
- Dong, A., & Pu, X. (2025). Enhancing agile responsiveness in flexible supply chains: A case study of automobile companies. Advances in Economics, Management and Political Sciences, 164, 154–159. [Google Scholar] [CrossRef]
- European Commission. (2025). Digital economy and society index (DESI)—Methodological note (latest release). European Commission. Available online: https://digital-decade-desi.digital-strategy.ec.europa.eu/datasets/desi/charts (accessed on 17 August 2025).
- Fan, X. (2011). Research on the development of modern logistics industry in Western China [Ph.D. thesis, Central University for Nationalities]. [Google Scholar]
- Fan, X., Zhang, Y., Xue, J., & Cao, Y. (2024). Exploring the path to the sustainable development of cold chain logistics for fresh agricultural products in China. Environmental Impact Assessment Review, 108, 107610. [Google Scholar] [CrossRef]
- Fan, Z., Zhou, Z., Wang, X., & Sun, Z. (2024). The impact of digital economy on the development of green logistics under the goal of dual carbon: An empirical study based on PVAR modeling. Journal of Education, Humanities and Social Sciences, 44, 19–30. [Google Scholar] [CrossRef]
- Feng, Y. (2023). The impact of the digital economy on the integration and development of manufacturing and logistics industries. Frontiers in Business, Economics and Management, 12(2), 232–239. [Google Scholar] [CrossRef]
- Fugate, B. S., Mentzer, J. T., & Stank, T. P. (2010). Logistics performance: Efficiency, effectiveness, and differentiation. Journal of Business Logistics, 31, 43–62. [Google Scholar] [CrossRef]
- Gansu Provincial People’s Congress Standing Committee. (2024, December 3). Decision on further accelerating digital government construction to promote digital economy and digital society development. Gansu Daily. 006. [Google Scholar] [CrossRef]
- Ge, X., Zhou, Z., Zhu, X., Wu, Y., & Zhou, Y. (2023). The impacts of digital economy on balanced and sufficient development in China: A regression and spatial panel data approach. Axioms, 12, 113. [Google Scholar] [CrossRef]
- Guo, C., Song, Q., Yu, M.-M., & Zhang, J. (2024). A digital economy development index based on an improved hierarchical data envelopment analysis approach. European Journal of Operational Research, 316(3), 1146–1157. [Google Scholar] [CrossRef]
- Guo, Y., & Ding, H. (2022). Coupled and coordinated development of the data-driven logistics industry and digital economy: A case study of Anhui province. Processes, 10(10), 2036. [Google Scholar] [CrossRef]
- Guo, Y., Mao, H., Ding, H., Wu, X., Liu, Y., Liu, H., & Zhou, S. (2022). Data-driven coordinated development of the digital economy and logistics industry. Sustainability, 14, 8963. [Google Scholar] [CrossRef]
- Han, J. W., Zuo, M., Zhu, W. Y., Zuo, J. H., Lü, E. L., & Yang, X. T. (2021). A comprehensive review of cold chain logistics for fresh agricultural products: Current status, challenges, and future trends. Trends in Food Science & Technology, 109, 536–551. [Google Scholar] [CrossRef]
- He, D., Zhao, X., & Qi, Q. (2023). Measurement, spatial pattern and regional difference of digital economy development in China. Journal of Industrial Technology Economics, 42(3), 54–62. [Google Scholar]
- Hendry, D. F. (2024). A brief history of general-to-specific modelling. Oxford Bulletin of Economics and Statistics, 86, 1–20. [Google Scholar] [CrossRef]
- Huang, G., & Li, Q. (2023). Research on the relationship between digital economy and the coordinated development of cold chain logistics industry. Commercial Economics Research, 15, 82–86. [Google Scholar]
- Hungerland, F., Quitzau, J., Zuber, C., Ehrlich, L., Growitsch, C., Rische, M. C., & Haß, H. J. (2015). The digital economy. No. 21e. In Strategy 2030—Wealth and life in the next generation. Berenberg Bank und Hamburgisches WeltWirtschaftsInstitut (HWWI). [Google Scholar]
- International Telecommunication Union [ITU]. (2024). Measuring digital development: Facts and figures 2024. ITU. Available online: https://www.itu.int/hub/publication/d-ind-ict_mdd-2024/ (accessed on 17 August 2025).
- Jia, T., Li, C., Wang, H., Hu, Y.-j., Wang, S., Xu, G., & Hoang, A. T. (2024). Subsidy policy or dual-credit policy? Evolutionary game analysis of green methanol vehicles promotion. Energy, 293, 130763. [Google Scholar] [CrossRef]
- Jiang, H., Sun, T., Zhuang, B., & Wu, J. (2023). Determinants of low-carbon logistics capability based on dynamic fsQCA: Evidence from China’s provincial panel data. Sustainability, 15(14), 11372. [Google Scholar] [CrossRef]
- Joshi, P., Singh, V., Thapliyal, N., Joshi, K., Bhatt, A., & Mahur, M. (2024, October 24–25). Intelligent IoT-enabled real-time monitoring system for logistics management. 2024 International Conference on Computing, Sciences and Communications (ICCSC) (pp. 1–5), Ghaziabad, India. [Google Scholar] [CrossRef]
- Kizielewicz, B., Więckowski, J., & Sałabun, W. (2024). SESP-SPOTIS: Advancing stochastic approach for re-identifying MCDA models. In International conference on computational science (pp. 281–295). Springer Nature. [Google Scholar] [CrossRef]
- Klongboonjit, S., & Kiatcharoenpol, T. (2024). Application of two-step entropy—TOPSIS method and complete linkage clustering for water-pumping windmill investment on Thailand Peninsula. Sustainability, 16, 10616. [Google Scholar] [CrossRef]
- Krolzig, H.-M., & Hendry, D. F. (2001). Computer automation of general-to-specific model selection procedures. Journal of Economic Dynamics and Control, 25(6–7), 831–866. [Google Scholar] [CrossRef]
- Kumar, M., Vipin, & Agarwal, A. (2024). Evaluation of indian railway’s supply chain parameters for improved sustainability under industry 4.0 transformation: An application of AHP and TOPSIS. Engineering Management Journal, 37, 452–464. [Google Scholar] [CrossRef]
- Le Viet, H., & Dang Quoc, H. (2023). The factors affecting digital transformation in Vietnam logistics enterprises. Electronics, 12, 1825. [Google Scholar] [CrossRef]
- Li, C., Hao, Q., Wang, H., Hu, Y.-J., Xu, G., Qin, Q., Wang, X., & Negnevitsky, M. (2024). Assessing green methanol vehicles’ deployment with life cycle assessment–system dynamics model. Applied Energy, 363, 123055. [Google Scholar] [CrossRef]
- Li, J. (2023). Can fiscal subsidies and tax incentives stimulate high-quality innovation in strategic emerging industries? Explanation based on enterprise life cycle theory. Frontiers in Business, Economics and Management, 9(2), 62–71. [Google Scholar] [CrossRef]
- Li, J., & Wang, Q. (2022). Impact of the digital economy on the carbon emissions of China’s logistics industry. Sustainability, 14, 8641. [Google Scholar] [CrossRef]
- Li, R., Ling, D., Wang, Y., Zhao, S., & Wang, J. (2023). Joint task offloading and resource allocation in vehicular edge computing networks for emergency logistics. Mathematical Problems in Engineering, 2023, 8181417. [Google Scholar] [CrossRef]
- Li, Y., Dai, J., & Cui, L. (2020). The impact of digital technologies on economic and environmental performance in the context of industry 4.0: A moderated mediation model. International Journal of Production Economics, 229, 107777. [Google Scholar] [CrossRef]
- Li, Y., & Liu, F. L. (2024). Challenges and path analysis of digital economy empowering the marketing innovation of Gansu agricultural products. China Journal of Commerce, 18, 138–141. [Google Scholar] [CrossRef]
- Li, Y., Wang, L., & Peng, Y. (2018). Intelligent development of the logistics industry and the improvement of industrial performance: An empirical test based on WIOD data and regression model. China Business and Market, (32), 36–43. [Google Scholar] [CrossRef]
- Liao, W., Yuan, R., Zhang, X., Li, N., & Qiu, H. (2024). Balancing acts: Unveiling the dynamics of revitalization policies in China’s old revolutionary areas of Gannan. Agriculture, 14, 354. [Google Scholar] [CrossRef]
- Lim, S. F. W. T., Jin, X., & Srai, J. S. (2018). Consumer-driven e-commerce: A literature review, design framework, and research agenda on last-mile logistics models. International Journal of Physical Distribution & Logistics Management, 48, 3. [Google Scholar] [CrossRef]
- Lin, K., Zhang, X., & Hou, J. (2023). Evaluation of China’s provincial digital economy development level and its coupling coordination relationship. PLoS ONE, 18(7), e0288614. [Google Scholar] [CrossRef]
- Liu, H., Zhou, L., Zhao, J., Wang, F., Yang, J., Liang, K., & Li, Z. (2022). Deep-learning-based accurate identification of warehouse goods for robot picking operations. Sustainability, 14, 7781. [Google Scholar] [CrossRef]
- Liu, S. (2023). Evaluation of digital economy development level in Hunan province based on entropy weight—TOPSIS method. The Frontiers of Society, Science and Technology, 5(10), 41–49. [Google Scholar] [CrossRef]
- Liu, Y. (2024). Research on the measurement of digital economy development level based on the entropy weight model and TOPSIS method: Taking Xinjiang Uygur autonomous region as an example. Advances in Economics, Management and Political Sciences, 60, 261–267. [Google Scholar] [CrossRef]
- Liu, Z., Zhao, Y., Guo, C., & Xin, Z. (2024). Research on the impact of digital-real integration on logistics industrial transformation and upgrading under green economy. Sustainability, 16, 6173. [Google Scholar] [CrossRef]
- Lomotko, D. V., Prymachenko, H. O., Kovalova, O. V., Shkurenko, O. V., & Hryhorova, Y. I. (2021). Use of modern logistics technologies in terms of saving resources. In IOP conference series: Materials science and engineering (Vol. 1021, p. 012041). IOP Publishing. [Google Scholar]
- Lovell, M. C. (1983). Data mining. The Review of Economics and Statistics, 65(1), 1–12. [Google Scholar] [CrossRef]
- Lu, J., & Chuah, S. C. (2023). Study on the development of Qinghai province’s logistics industry under the digital economy. Logistics Technology, 17, 99–102. [Google Scholar] [CrossRef]
- Lu, J. Y., Guo, J. H., & Li, Z. H. (2025). Digital economy and agricultural green growth: Based on input-output structure and technology empowerment perspective. Statistics & Decision, 41, 24–29. [Google Scholar] [CrossRef]
- Lu, Y. (2022). Research on the impact of digital economy on high-quality urban economic development [Master’s thesis, Southwestern University of Finance and Economics]. [Google Scholar] [CrossRef]
- Luo, R., & Wang, Q. M. (2022). The impact of digital economy on the high-quality development of the logistics industry in Chinese cities. Urban Problems, 6, 35–46. [Google Scholar] [CrossRef]
- Odimarha, A. C., Ayodeji, S. A., & Abaku, E. A. (2024). The role of technology in supply chain risk management: Innovations and challenges in logistics. Magna Scientia Advanced Research and Reviews, 10(2), 138–145. [Google Scholar] [CrossRef]
- OECD. (2024a). OECD digital economy outlook 2024 (Volume 1): Embracing the technology frontier. OECD Publishing. [Google Scholar] [CrossRef]
- OECD. (2024b). OECD digital economy outlook 2024 (Volume 2): Strengthening connectivity, innovation and trust. OECD Publishing. [Google Scholar] [CrossRef]
- Pang, S. (2016). Analysis of the current situation of talent loss in Gansu province. Enterprise Herald, 2016(05), 142. [Google Scholar] [CrossRef]
- Portulans Institute. (2024). The network readiness index 2024: Accelerating digital transformation in challenging times—Methodology and technical notes (appendix). Portulans Institute. Available online: https://networkreadinessindex.org/nri-2024/ (accessed on 17 August 2025).
- Qiao, W., & Lü, J. P. (2025). Research on empowering urban-rural integration development through digital economy: An empirical analysis based on 14 cities and states in Gansu province. Productivity Research, (01), 47–51. [Google Scholar] [CrossRef]
- Rad, F. F., Oghazi, P., Palmié, M., Chirumalla, K., Pashkevich, N., Patel, P. C., & Sattari, S. (2022). Industry 4.0 and supply chain performance: A systematic literature review of the benefits, challenges, and critical success factors of 11 core technologies. Industrial Marketing Management, 105, 268–293. [Google Scholar] [CrossRef]
- Rashidi, K. (2019). Evaluating the sustainability of national logistics performance using data envelopment analysis. Transport Policy, 74, 35–46. [Google Scholar] [CrossRef]
- Saini, A. K., Yadav, A. K., & Dhiraj. (2025). A comprehensive review on technological breakthroughs in precision agriculture: IoT and emerging data analytics. European Journal of Agronomy, 163, 127440. [Google Scholar] [CrossRef]
- Sen, L., Yang, Z., Caihong, Z., & Chengliang, W. (2021). A comprehensive evaluation of county economies in the Beijing-Tianjin-Hebei region based on entropy TOPSIS analysis. Applied Mathematics and Nonlinear Sciences, 6(2), 499–516. [Google Scholar] [CrossRef]
- Sheffi, Y. (2012). Logistics-intensive clusters: Global competitiveness and regional growth. In Handbook of global logistics: Transportation in international supply chains (pp. 463–500). Springer New York. [Google Scholar]
- Shi, Y., & Chen, Y. (2024). Research on the current situation and optimization strategies of cold chain logistics for characteristic agricultural products under the digitalisation background: A case study of Gansu province. Logistics Sci-Tech, 47(13), 131–134. [Google Scholar] [CrossRef]
- Shu, H., Zhan, L., Lin, X., & Zhou, X. (2023). Coordination measure for coupling system of digital economy and rural logistics: An evidence from China. PLoS ONE, 18, e0281271. [Google Scholar] [CrossRef] [PubMed]
- Song, C., Ma, W., Li, J., Qi, B., & Liu, B. (2022). Development trends in precision agriculture and its management in China based on data visualization. Agronomy, 12, 2905. [Google Scholar] [CrossRef]
- Song, Q. (2024). Analyzing the economic opportunities for small businesses in Gansu province’s logistics and trade sectors stemming from China’s belt and road initiative. Law and Economy, 3(5), 24–32. [Google Scholar] [CrossRef]
- Spieske, A., & Birkel, H. (2021). Improving supply chain resilience through industry 4.0: A systematic literature review under the impressions of the COVID-19 pandemic. Computers & Industrial Engineering, 158, 107452. [Google Scholar] [CrossRef]
- Strohmeier, S. (2020). Digital human resource management: A conceptual clarification. German Journal of Human Resource Management, 34(3), 345–365. [Google Scholar] [CrossRef]
- Sun, Y., & Pang, Q. (2025). Analysis of the coupling coordination and spatial difference between economic and ecological environment: A case study of China. Sustainability, 17, 869. [Google Scholar] [CrossRef]
- Susmaga, R., Szczȩch, I., Zielniewicz, P., & Brzezinski, D. (2023). MSD-space: Visualizing the inner-workings of TOPSIS aggregations. European Journal of Operational Research, 308(1), 229–242. [Google Scholar] [CrossRef]
- Teece, D. J. (2018). Profiting from innovation in the digital economy: Enabling technologies, standards, and licensing models in the wireless world. Research Policy, 47(8), 1367–1387. [Google Scholar] [CrossRef]
- Trushkina, N., Dzwigol, H., Serhieieva, O., & Yu, S. (2020). Development of the logistics 4.0 concept in the digital economy. Economic Herald of the Donbas, 4(62), 85–96. [Google Scholar] [CrossRef]
- Wang, C., Qi, F., Liu, P., Ibrahim, H., & Wang, X. (2023). The effect of the digital economy on carbon emissions: An empirical study in China. Environmental Science and Pollution Research, 30, 75454–75468. [Google Scholar] [CrossRef]
- Wang, C., & Zhang, J. (2015). Regional logistics network level and industrial growth in Western China. Lanzhou Academic Journal, 02, 163–168. [Google Scholar]
- Wang, G., & Chen, M. (2025). Performance evaluation and strategic analysis of logistics development for China railway express: A spatial connectivity perspective. Systems, 13, 166. [Google Scholar] [CrossRef]
- Wang, G., Guo, X., Fu, J., Wei, Q., & Zhang, L. (2022). Alternative pathways to CO2 reduction in Gansu province, China. Energy & Environment, 33(4), 809–825. [Google Scholar] [CrossRef]
- Wang, Z., Gao, L., & Wang, W. (2025). The impact of supply chain digitization and logistics efficiency on the competitiveness of industrial enterprises. International Review of Economics & Finance, 97, 103759. [Google Scholar] [CrossRef]
- Wei, W., Li, Y., Ma, L., Xie, B., Hao, R., Chen, D., & Yang, S. (2024). Carbon emission change based on land use in Gansu province. Environmental Monitoring and Assessment, 196(3), 311. [Google Scholar] [CrossRef]
- Wen, S., & Yuan, M. (2024). Research on the implications of the development of the logistics industry for economic growth in Gansu province. Jiangsu Business Review, 2, 40–43. [Google Scholar]
- White, H. (1980). A heteroscedasticity-consistent covariance matrix estimator and a direct test for heteroscedasticity. Econometrica, 48, 817–838. [Google Scholar] [CrossRef]
- Więckowski, J., & Sałabun, W. (2024). A new sensitivity analysis method for decision-making with multiple parameters modification. Information Sciences, 678, 120902. [Google Scholar] [CrossRef]
- Williams, L. D. (2021). Concepts of digital economy and industry 4.0 in intelligent and information systems. International Journal of Intelligent Networks, 2, 122–129. [Google Scholar] [CrossRef]
- Winkelhaus, S., & Grosse, E. H. (2020). Logistics 4.0: A systematic review towards a new logistics system. International Journal of Production Research, 58(1), 18–43. [Google Scholar] [CrossRef]
- Xie, P.-J., Liao, J., Pan, X., & Sun, F. (2023). Will China’s carbon intensity achieve its policy goals by 2030? Dynamic scenario analysis based on STIRPAT-PLS framework. SSRN Electronic Journal. preprint. [Google Scholar] [CrossRef]
- Xie, X., & Wang, J. (2023). Regional differences and dynamic evolution of the integration level between China’s logistics industry and digital economy. The World of Survey and Research, 2, 33–46. [Google Scholar] [CrossRef]
- Xu, G., Lu, T., & Liu, Y. (2021). Symmetric reciprocal symbiosis mode of China’s digital economy and real economy based on the logistic model. Symmetry, 13(7), 1136. [Google Scholar] [CrossRef]
- Xue, Y., Jia, H., & Feng, Y. (2024). The mechanism of digital economy in enhancing the high-quality development of the logistics industry. Journal of Changzhou University (Social Science Edition), (06), 79–88. [Google Scholar]
- Yan, B., Yao, B., & Zhang, C. (2023). Industrial structure, high-quality development of logistics industry, and the economy. PLoS ONE, 18(5), e0285229. [Google Scholar] [CrossRef]
- Yang, B. (2024). Research on the synergistic development of rural e-commerce logistics network and digital economy. China Storage & Transport, (07), 92–93. [Google Scholar] [CrossRef]
- Yang, J. G., & Wang, Q. M. (2024). The impact of the digital economy on the integrated development of logistics and modern agriculture. China Circulation Economy, 38, 17–32. [Google Scholar] [CrossRef]
- Yang, X. (2024). Applied research on internet of things technology enabling intelligent logistics. Academic Journal of Science and Technology, 12(1), 228–231. [Google Scholar] [CrossRef]
- Yao, R., & Zhang, Y. (2024). Measurement of rural logistics development level and analysis of obstacle factors in the five Northwestern provinces. Logistics Sci-Tech, 17, 92–95. [Google Scholar] [CrossRef]
- Yu, H., & Liu, H. (2022). Discussion on digital transformation of small and medium-sized enterprises in the post-epidemic era. Frontiers in Business, Economics and Management, 7(1), 91–105. [Google Scholar] [CrossRef]
- Yuan, P., & Yang, X. (2024). Exploration of the model of deepen industry–education integration in the digital economy era. Journal of Internet and Digital Economics, 4(3), 179–186. [Google Scholar] [CrossRef]
- Zennaro, I., Finco, S., Calzavara, M., & Persona, A. (2022). Implementing E-commerce from logistic perspective: Literature review and methodological framework. Sustainability, 14, 911. [Google Scholar] [CrossRef]
- Zhang, J., & Chen, Z. (2024). Exploring human resource management digital transformation in the digital age. Journal of the Knowledge Economy, 15, 1482–1498. [Google Scholar] [CrossRef] [PubMed]
- Zhang, W., Liu, H., Yao, Y., & Fan, Z. (2022). A study measuring the degree of integration between the digital economy and logistics industry in China. PLoS ONE, 17(9), e0274006. [Google Scholar] [CrossRef] [PubMed]
- Zhang, X., Sun, Y., & Sun, Y. (2022). Research on cold chain logistics traceability system of fresh agricultural products based on blockchain. Computational Intelligence and Neuroscience, 2022, 1957957. [Google Scholar] [CrossRef]
- Zhang, Z., Leng, Y., Huang, S., Li, L., Li, S., Chen, C., Li, K., & Wu, N. (2023, March 24–26). Measurement of the development level and spatial correlation analysis of cold chain logistics in mainland China. 2023 3rd International Conference on Applied Mathematics, Modelling and Intelligent Computing (CAMMIC 2023), (Vol. 12756). Tangshan, China. [Google Scholar] [CrossRef]
- Zhao, L. (2015). Research on the competitiveness of the logistics industry in Gansu province [Doctoral dissertation, Northwest Normal University]. [Google Scholar]
- Zhou, B. (2024). Study on the path of digital economy for high-quality economic development. Highlights in Business, Economics and Management, 24, 846–852. [Google Scholar] [CrossRef]
- Zhou, F., & Gao, Y. (2023). Research on the transformation of modern logistics industry development under the background of digital economy. China Circulation Economy, (24), 166–169. [Google Scholar] [CrossRef]
- Zhou, Y., & Lin, X. (2024). Digital economy, technological innovation, and high-quality development of the logistics industry. J. Journal of Chongqing Jiaotong University (Social Sciences Edition), (24), 46–54+91. [Google Scholar]
- Zhou, Y., & Zhang, J. X. (2024). Research on the Coupling and Coordination of Digital Economy and Agricultural Modernization—Taking Gansu Province as an Example. Productivity Research, (08), 69–73. [Google Scholar] [CrossRef]
- Zhuang, Z., Jia, H., & Zhou, M. (2023). Research on the path to enhance the international competitiveness of the digital economy through digital carbon neutral integration innovation. Wuhan Finance, 11, 28–37. [Google Scholar]


Disclaimer/Publisher’s Note: The statements, opinions and data contained in all publications are solely those of the individual author(s) and contributor(s) and not of MDPI and/or the editor(s). MDPI and/or the editor(s) disclaim responsibility for any injury to people or property resulting from any ideas, methods, instructions or products referred to in the content. |
© 2025 by the authors. Licensee MDPI, Basel, Switzerland. This article is an open access article distributed under the terms and conditions of the Creative Commons Attribution (CC BY) license (https://creativecommons.org/licenses/by/4.0/).