Abstract
The relationship between trade openness and economic performance has been widely debated and researched during the last several decades. However, the specific influence of trade openness from the perspective of controlling the inflation rate is rarely researched specifically for the Kingdom of Saudi Arabia (KSA). Accordingly, this research paper attempts to test the influence of trade openness on inflation, focusing on KSA. The paper utilizes historical data from 1975 to 2023 and employs the “Autoregressive Distributed Lag (ARDL)” and “Nonlinear Autoregressive Distributed Lag (NARDL)” cointegration techniques to assess the responsiveness of the inflation rate to increased trade openness. The results of the ARDL demonstrated the positive influence that trade openness has on inflation, which is a rejection of Romer’s hypothesis. The findings of the NARDL also rejected Romer’s hypothesis by demonstrating a positive relationship between the positive shocks in trade openness and the inflation rate. Similarly, our results illustrated a significant negative impact of domestic industrialization and government expenditure on inflation. Moreover, we found that the inflation rate in KSA is significantly dependent on economic performance. Finally, our findings demonstrated that the natural resource sector is unable to explain the inflationary pressure in KSA significantly.
1. Introduction
International trade openness has contributed to the economic performance of many countries and regions during the last several decades. Both theoretical models of trade and empirical studies have provided firm support to the trade-led growth hypothesis. The seminal work of renowned researchers has provided convincing evidence about the trade-led growth hypothesis (Dollar, 1992; Sachs & Warner, 1995; Edwards, 1998; Frankel & Romer, 1999). Tahir and Azid (2015) demonstrated that the historical growth experience of the Asian tigers and the recent growth performance of emerging economies is largely dependent on their liberalized trade policies. Openness to international trade improves the environment, enhances life expectancy, leads to productivity flourishing, and gives access to advanced technologies and important inputs for production (Managi et al., 2009; Tahir, 2020; Tahir & Azid, 2015). The dominant message from the literature is that indeed trade openness leads to flourishing of the growth performance of the host economies through multiple channels.
The growth-enhancing benefits of trade openness are well researched and widely accepted in the literature. Romer (1993), in his seminal work, demonstrated that open economies experience a relatively lower inflation rate. The negative influence of trade openness on inflation is known as Romer’s hypothesis in the literature. Following the research of Romer (1993), numerous quantitative studies have been conducted by researchers to assess the validity of Romer’s hypothesis. However, empirical studies have produced mixed results. Binici et al. (2012) demonstrated that the inflation rate responds negatively to increased market competitiveness. However, it is a fact that increased market competitiveness is largely dependent on openness to international trade. Some studies have provided support for Romer’s hypothesis (Tahir et al., 2023; Salimifar et al., 2015; Samimi et al., 2012), while some others have rejected Romer’s hypothesis (Chhabra & Alam, 2020; Sepehrivand & Azizi, 2016; Munir et al., 2015). These studies show that the available literature on the openness–inflation relationship is largely inconclusive due to inconsistent and diverse findings.
The Kingdom of Saudi Arabia (KSA hereafter) is a resource-rich country located in the Middle East, enjoying improving economic performance, partly due to its abundant natural resources, over the years. KSA has exercised relatively liberalized trade policies, particularly after gaining access to the World Trade Organization in 2006 (Ramady, 2009). Like all other economies, KSA is also facing several challenges, including rising inflation amid increased economic openness (Ali, 2024). Inflation in KSA has increased recently, particularly after the COVID-19 pandemic. The current inflationary pressure in KSA can be explained by several factors. For instance, Jazia and Khabbouchi (2024) demonstrated empirically that external factors are more responsible for inflation in KSA as compared to local factors. This means that external factors, such as the degree of trade openness, could explain the observed inflation in KSA. It is a fact that increased trade openness exposes the domestic economy to greater external shocks, such as supply disruptions and uncertainties. The literature has shown that supply disruptions and increased trade openness have increased inflation (Diaz et al., 2024; Chhabra & Alam, 2020), and KSA is not an exception. However, the previous literature has not paid the required attention to studying the impact of external factors such as trade openness on the level of the inflation rate in KSA.
Amid this backdrop, this research study attempts to explore the influence of trade openness on inflation in the framework of the well-known Romer hypothesis. KSA has introduced relatively liberalized trade policies over the years. At the same time, it is also a fact that KSA has faced inflationary pressure in recent years. Therefore, it is indeed important to figure out whether trade openness is responsible for the observed inflationary pressure in KSA. The motivation of focusing on KSA is that the previous literature has not paid sufficient attention to testing the openness–inflation relationship for KSA. Therefore, we expect that the policymakers of KSA will benefit significantly from the outcomes of this study. In turn, policymakers will be in a better position to adopt suitable policy responses to tackle the problem of the inflation rate amid increased trade openness.
The current study contributes to the literature in several ways. Firstly, this is the first study on the relationship between trade openness and the inflation rate that focuses on KSA. Hence, the outcomes of this study will add to the literature on KSA. Secondly, our study uses advanced cointegration tools such as the ARDL model, which provides both short-run and long-run impacts of independent variables on the dependent variable. It is possible that the rate of inflation may respond differently to variations in the independent variables in the short run and long run. Thirdly, in contrast to previous studies, our analysis is based on historical time-series data spanning from 1975 to 2023 to provide robust and consistent evidence about the exact relationship between trade openness and the inflation rate.
The remaining part of this article is split into several interconnected sections. Section 2 presents commentary on the relevant literature. The modeling and estimation strategies are included in Section 3. Section 4 is devoted to the presentation of the results and discussion of the results. Section 5 includes the results of a robustness exercise. Section 6 includes summary remarks, research implications, limitations, and future research directions.
2. Relevant Literature
The openness–inflation relationship has received noticeable attention worldwide from researchers, policy practitioners, and government authorities during the last few decades. Romer (1993) demonstrated an inverse relationship between openness and the inflation rate which is robust and quantitatively large. He concluded that open economies experience a relatively low level of inflation. The negative influence of openness on inflation is known as Romer’s hypothesis in the literature.
Some empirical studies have provided firm support for the traditional Romer hypothesis. For example, utilizing data for the Turkish economy for the period 1980–2011, Atabay (2016) confirmed the presence of Romer’s hypothesis by establishing a negative relationship between trade openness and the inflation rate. Similarly, for China, Tahir et al. (2023) provided support for Romer’s hypothesis. Salimifar et al. (2015) confirmed Romer’s hypothesis for Iran. Samimi et al. (2012) used the KOF index of globalization as a measure of trade openness and confirmed the validity of Romer’s hypothesis by establishing an inverse relationship between openness and inflation. Finally, Binici et al. (2012) focused on the OECD economies and endorsed that trade openness impacts inflation through the channels of productivity and market competitiveness.
On the other hand, some recent empirical studies have questioned the validity of Romer’s hypothesis. For instance, Sepehrivand and Azizi (2016) focused on D-8 economies and employed panel data techniques on data for the period 2001–2013. Their quantitative results rejected Romer’s hypothesis by displaying a positive relationship between trade openness and the inflation rate. Similarly, in the context of the Indian economy, Chhabra and Alam (2020) provided evidence against Romer’s hypothesis by applying the ARDL technique of cointegration. Moreover, utilizing panel data of selected South Asian economies, Munir et al. (2015) questioned the validity of Romer’s hypothesis by displaying an insignificant relationship between openness to trade and the inflation rate. Zakarıa (2010) used data from Pakistan from 1947 to 2007 and rejected Romer’s hypothesis by showing a positive relationship between openness to trade and the inflation rate. Finally, in the context of MENA members, Lotfalipour et al. (2013) demonstrated a positive influence of openness on the inflation rate and hence rejected the conventional Romer hypothesis.
A strand of the literature has focused on GCC economies to study the dynamics of the inflation rate. In this regard, Raggad and Ben-Salha (2025) focused on the GCC nations and applied advanced econometric methods for exploring the dynamics of inflation. Their findings highlighted the presence of significant time variation in inflation spillovers. Similarly, Rashad et al. (2023) examined the drivers of the inflation rate using data from Dubai. Their quantitative analysis revealed that Dubai’s inflation is impacted positively by the transport cost associated with the CPI. Kandil and Morsy (2011) provided evidence that inflation in major trading partners is the principal cause of inflationary pressure in GCC economies. Hemmati et al. (2023) conducted research to identify the factors of inflation by focusing on data from Iran from 1978 to 2019. Their findings showed that inflation in Iran could be explained by money supply, depreciation of currency, and sanctions.
Some researchers have conducted quantitative studies for assessing the factors determining inflation in KSA. In this regard, Naseem (2018) empirically proved that exports, imports, money supply, and the exchange rate are the significant determinants of inflation in KSA. Similarly, Alnefaee (2018) showed that inflation in KSA positively responds to money, oil prices, and demand conditions and negatively responds to the exchange rate. Moreover, Ramady (2009) concluded that money supply, depreciation of currency, and the interest rate are responsible for inflationary pressure in KSA. Furthermore, Belloumi et al. (2023) used data from KSA and concluded that higher oil prices are responsible for the inflationary pressure in KSA. Lastly, Albahouth (2025) applied the ARDL methodology using quarterly data and demonstrated that oil prices and money supply have increased inflation.
In summary, it can be concluded that only a few studies have been conducted to explore the determinants of the inflation rate in KSA. However, the specific impact of openness on inflation has not been investigated comprehensively. The present study is interested in carrying out a comprehensive quantitative study and figuring out the true relationship between trade openness and economic growth in the framework of the well-known Romer hypothesis. We expect the government authorities of KSA will benefit a lot from the outcomes of this study. In turn, they would be in a better position to develop suitable policy responses to tackle the problem of heightened inflation and minimize its adverse consequences.
3. Methodology
3.1. The Model Specification
In this section of the article, we specify how to achieve the objectives of the research. The main objective, as mentioned earlier, is to assess the factors that influence the inflation rate in KSA. Romer (1993) pointed out that open economies suffer relatively less from inflation rates. In other words, the trade-openness degree of an economy determines its inflation rate. Therefore, the rate of inflation is the dependent variable and trade openness is the prime independent variable. However, the inflation rate also depends on several factors. For example, economic growth and government expenditure, the exchange rate, and money supply matter a lot from the perspective of a heightened inflation rate (Tahir et al., 2023; Lim & Sek, 2015). Similarly, following the recent study of Sisay et al. (2022) we have also included the contribution of the industrial sector in the model as an explanatory factor of inflation. Finally, considering the economic structure of KSA, we have also included the natural resource sector as one of the predictors of inflation in our model. The recent research of Baumann et al. (2023) demonstrated that inflation also depends on the natural resource sector. The following model is designed for empirical analysis:
3.2. Description of Variables
In model 1, it is hypothesized that the inflation rate in KSA is dependent on trade openness , industrialization , the government sector , economic growth , and the abundance of natural resources . In terms of measurement, the inflation rate is measured by “consumer prices, annual percent”, while openness is measured as “trade as percent of GDP”. For measuring industrialization, the present study uses “Industry (including construction), value added as percent of GDP”. According to the World Bank (2025), domestic industrialization includes the mining, manufacturing, construction, electricity, water, and gas industries. The role of the government sector is captured through “General government final consumption expenditure as percent of GDP”. Economic growth is captured through GDP per capita, while “Total natural resources rents as percent of GDP” is utilized for measuring the impact of the natural resource sector on the inflation rate. The data for all variables is taken from the “World Development Indicators (WDI)” for the period 1975–2023. The WDI is a free source of data available to researchers.
3.3. Empirical Strategy
The unit root is a fundamental property of time-series data that necessitates specific analytical techniques like cointegration. The presence of a unit root violates the assumption of using the well-known “ordinary least squares (OLS)”.
Several cointegration techniques have been proposed by renowned researchers over the years to handle time-series data having a unit root. The cointegration techniques of Engle and Granger (1987) and Johansen (1988) have received notable attention in the literature from researchers due to their effectiveness in handling time-series variables suffering from a unit root. However, both the Engle and Granger (1987) and Johansen (1988) tests require a uniform integration order. However, sometimes in applied research, a situation arises where the integration order of variables is different. For such a scenario, a new testing procedure of cointegration, formally known as the “Autoregressive Distributed Lag (ARDL)”, was developed by Pesaran et al. (2001). Numerous research studies have used ARDL modeling recently. For the estimation of models, the present study used the EViews software, version 13.
3.4. The ARDL and NARDL Frameworks
The ARDL framework is very useful and has been used widely in applied research studies in economics and finance recently (Saleem et al., 2020; Kong et al., 2021; Tahir et al., 2023). The most common benefits of using ARDL modeling are that it produces both long-run relationships and short-run dynamics simultaneously. Similarly, ARDL modeling is capable of handling variables of different orders. However, ARDL modeling is unable to accommodate variables which are second-differenced stationary. Keeping in mind the benefits of ARDL modeling, we have transformed our model into the ARDL framework as below. Each variable used in Equation (1) is used as a dependent variable step by step. This practice is consistent with previous studies that used ARDL modeling (Ahmad et al., 2019; Tahir, 2020).
In expressions (2)–(7), we have provided the ARDL version of model 1. In all expressions, the parameters stand for the short-run dynamics. Similarly, for the long run the parameters are used.
The acceptance or rejection of cointegration among the variables can be tested using a hypothesis. The null hypothesis does not accept cointegration while the alternative hypothesis accepts cointegration. Both the hypotheses are provided below.
In the ARDL framework, the F-statistic value will be compared with the values suggested by Narayan (2004). For the cointegrating relationship, there are three possibilities. The presence of cointegration will be accepted if the F-statistic value crosses the upper-bound value. On the other hand, the absence of cointegration will be concluded if the F-statistic value is less than the lower-bound critical value. Finally, the presence of cointegration will be doubtful if the F-statistic value falls between the lower- and upper-bound critical values.
Shin et al. (2014) introduced the concept of the NARDL, which can effectively measure the asymmetrical relationship that may exist between the dependent and independent variables. The NARDL is basically the reflection of traditional ARDL modeling. In the NARDL modeling, we have divided the variables into positive and negative shocks. Following the previous literature (Shin et al., 2014; Mohsin et al., 2024), we have specified the NARDL as follows:
4. Results
4.1. Descriptive Analysis
Table 1 indicates that the average inflation rate experienced by KSA is 2.970 percent. The inflation statistics suggest that inflation has remained stable in KSA historically. The highest inflation rate of 34.576 percent was observed in 1975, while the lowest inflation rate (−3.203 percent) was recorded in 1986. Overall, the inflation rate has remained stable due to the effective policies of the government authorities.

Table 1.
Descriptive analysis.
Similarly, the average value of trade openness for KSA is 74.097 percent of the GDP. The maximum (96.102) and minimum (49.713) values of trade openness are observed in 2008 and 2020, respectively. The lowest value of trade openness in 2020 could be explained by the global trade collapse due to the COVID-19 pandemic. Overall, the trade openness statistics indicate that the trade regime in KSA is relatively liberalized compared to other economies. The better economic performance of KSA during the last few decades can be partly explained by its liberalized trade policies.
The contribution of the industrial sector towards the GDP of KSA is 52.912 percent on average. The highest (71.734) and lowest (37.120) values of industrial contribution towards the GDP were recorded in 1975 and 1986, respectively. The statistics for 2023 show that the contribution of the industrial sector towards the GDP was more than 46 percent. Domestic industrialization includes the contribution of several important sectors such as the construction, manufacturing, mining, electricity, and gas industries, as defined by the (World Bank, 2025). Therefore, the contribution of the industrial sector in KSA basically reflects the overall performance of several industries, including the construction, manufacturing, mining, electricity, and gas industries.
The descriptive analysis also shows that the average value of government expenditure is 24.750 percent of the GDP. The highest (35.222) and lowest (14.531) values of government expenditures are witnessed in 1986 and 1975, respectively. The statistics for 2023 show that the value of government expenditure is more than 23 percent. The overall statistics of government expenditure show the active role played by the government sector in the economy. The active role of the government in economic activities, particularly in times of economic depression and economic booms, is widely accepted. Therefore, the government authorities of KSA need to continue their effective role in stabilizing the economy.
Furthermore, the average value of GDP per capita is 28,745 (constant USD). The highest (57,760) and lowest (19,678) values of income were observed for KSA in 1977 and 2002, respectively. The apparent decline in GDP per capita could be due to the increase in total population over the years. The statistics for 2023 show that the value of GDP per capita was 23331, which is satisfactory. Finally, the average contribution of natural resources towards GDP is more than 37 percent. The maximum (87.284) and lowest (17.318) contributions of natural resources were observed in 1979 and 2020, respectively.
4.2. Stationarity Analysis
Before moving to the application of ARDL modeling, we conducted a stationarity analysis using the widely used “augmented Dickey–Fuller (ADF)” test. Table 2 illustrates the results of the stationarity analysis. It is found that income is stationary both at level as well as at first difference. In other words, the selected variables have a diverse integration order. Hence, the use of the ARDL technique is appropriate due to its ability to handle variables of mixed integration order.
Table 2.
Stationarity results.
4.3. The ARDL Analysis
After conducting the stationarity analysis, we applied the ARDL technique to determine the possibility of a cointegrating relationship. Table 3, provided below, includes the results of the ARDL testing. The F-test value surpasses the upper-bound value for all equations. Therefore, based on the results, we accept the presence of cointegration.
Table 3.
ARDL findings.
4.4. Error Correction Modeling
Researchers normally specify “error correction models” (ECMs hereafter) after the confirmation of cointegration among the variables (Ahmad et al., 2019; Tahir, 2020). ECM modeling is important as it has two main benefits. The first benefit of ECM modeling is that it captures short-run dynamics effectively. Secondly, ECM modeling provides significant information about the speed of adjustment from disequilibrium towards the equilibrium through the application of the “error correction term” (ECT hereafter). The ECM models based on expressions (2)–(7) are specified as presented below.
4.5. Discussion of Long-Run Findings
The results are presented in Table 4. According to the results, inflation has responded positively to increased trade openness. The positive relationship between the inflation rate and trade openness is basically a rejection of the Romer (1993) hypothesis. It means that trade openness is unable to address the problem of inflation in KSA. Our results are supported by the results of Chhabra and Alam (2020), Sepehrivand and Azizi (2016), and Yiheyis (2013) who also rejected Romer’s hypothesis. On the other hand, our results disagree with the findings of Tahir et al. (2023), who confirmed the Romer hypothesis by displaying a negative relationship between the inflation rate and trade openness when focusing on the economy of China. This means that the role of trade openness, from the perspective of inflation control, varies across countries and regions. Romer’s theory was basically based on an analysis of industrialized economies and hence its validity could be questioned in the context of resource-dependent economies like KSA. Increased trade openness normally prevents inflation in industrialized and advanced economies mainly due to the enormous production of goods and services and through the encouragement of constructive competition among the producers. However, resource-dependent economies are significantly dependent on imports of goods, mainly due to poor performance of the industrial sector. Hence, trade openness may not be able to control inflationary pressure in resource-dependent economies like KSA. Therefore, suitable policy responses based on the domestic economic conditions need to be developed to curb the problem of inflation.
Table 4.
Long-run findings.
Similarly, our results show that the industrialization of the economy has helped in controlling inflation. The coefficient of the variable used for industrialization carries a negative and statistically significant coefficient. This means that domestic industrialization is one of the dominant processes that prevents heightened inflation. The process of domestic industrialization generally increases the supply of goods and services multiple times, due to which prices decline. In other words, the problem of heightened inflation could be effectively tackled by encouraging industrial activities in the domestic economy.
The government’s role in the economy is crucial in modern economies as it protects domestic consumers against heightened inflation using several channels. The government authorities use their fiscal and monetary powers to control the rising inflation rate. The previous literature has provided mixed results regarding the role of government sectors from the perspective of inflation control. For instance, Nguyen (2019) and Tahir et al. (2023) demonstrated a positive relationship between government expenditure and inflation rate by focusing on India, China, and Indonesia. On the other hand, Mehrara et al. (2016) demonstrated that government expenditure does not create inflationary pressure provided that the money supply is tight. Specifically, in KSA, the government authorities play an active role in solving the problem of a heightened inflation rate and protecting domestic consumers by providing several subsidies. The targeted subsidies of the government in KSA have been successful in addressing the problem of inflation, as proved by the results. Therefore, the government authorities need to continue their effective role in inflation control.
Moreover, the results confirm the hypothesis that a growing economy generates relatively more inflation. According to the results, the economic performance of KSA during the last few decades is also responsible for the existing inflationary pressure in the economy. Economic growth carries a positive and statistically significant coefficient in the estimated model. Higher income generally stimulates aggregate demand in the domestic economy, which ultimately leads to a higher inflation rate. Prior studies have also shown that higher growth performance leads to inflationary pressure in the domestic economy. For example, Lim and Sek (2015) and Tahir et al. (2023) displayed the positive relationship that income has on inflation. It is therefore suggested that the government authorities adopt suitable policy responses to protect the majority of the population from a rising inflation rate amid increasing income levels in the population. Finally, the natural resource sector appears to carry inflationary pressure as it generates significant revenues and indirectly increases the income of the population. However, its direct impact on the level of inflation is positive but insignificant.
4.6. Discussion of Short-Run Results
The short-run results are displayed in Table 5. The results partly support Romer’s hypothesis, as the influence of openness on inflation is negative but insignificant. This means that trade openness may bring short-term relief against a heightened inflation rate. Trade openness is basically a policy factor and sudden changes in policies may encourage inflows of goods and services and hence prices may decrease for some time. In other words, the benefits of trade openness in terms of controlling inflation are temporary in the case of resource-dependent economies. The short-run results further display that industrialization also brings inflation. However, industrialization in the long run helps the economies by increasing the production of commodities, which ultimately brings down the price level.
Table 5.
Short-run findings.
Moreover, the results again confirm the effectiveness of the government’s role in controlling inflationary pressure in the economy. Therefore, it is suggested that the government of KSA needs to continue its effective and active role in the economy, which is important both for controlling inflation and the smooth functioning of the economy. Again, we found that the natural resource sector is unable to explain the dynamics of inflation. Further, the inflationary pressure of the income level is confirmed by the results. Finally, the correction speed of our model is 78 percent based on the ECT.
4.7. Diagnostic Analysis
In this section, some well-known diagnostic tests are carried out to assess the validity of the models. The findings are shown in Table A1 (Appendix A). The models of our study are free from serial correlation, as demonstrated by the LM test and its probability. Similarly, the problem of heteroscedasticity is also not present in our models, as confirmed by the well-known White test. Moreover, the Ramsey test is statistically insignificant, which is a confirmation of correct functional form. Lastly, the normality assumption is also not violated.
The stability of the residuals is illustrated using two well-known graphs: the “CUSUM test” and the “Square of CUSUM test”. The blue-colored lines lie inside the critical limit at the 5 percent level, as confirmed by both graphs (see Figure A1 and Figure A2 in Appendix A).
5. NARDL Analysis
Robustness testing of results is considered important in applied research. For this purpose, we have utilized NARDL modeling, decomposing our variables both into positive shocks and negative shocks. We present the results of the NARDL cointegration techniques in Table 6, provided below. The variables under consideration are cointegrated as the F-test value is higher than the critical values presented in Table 6.
Table 6.
NARDL testing.
5.1. Discussion of NARDL Results
The results based on the NARDL are shown in Table 7. The results show that a positive shock in trade openness influences the inflation rate positively, which refutes Romer’s hypothesis. This means that focusing on trade openness for controlling inflation would not bring the desired outcome. On the other hand, a negative shock in trade openness is related to the inflation rate negatively. The results confirm the asymmetrical relationship between trade openness and inflation rate. Similarly, our results show that a positive shock is unable to explain the inflation rate, while a negative shock in natural resources has a positive and statistically significant impact on the inflation rate. Moreover, we witness that a positive shock in industrialization leads to lower inflation in the long run, while a negative shock in industrialization raises the price level insignificantly. Furthermore, our results reveal that government expenditure prevents heightened inflation via a positive shock. Likewise, a negative shock is related to the inflation rate positively but insignificantly. Finally, our results show that a positive shock in GDP per capita leads to a higher inflation rate.
Table 7.
Long-run findings and short-run dynamics (NARDL).
The short-run dynamics show that trade openness impacts inflation by 0.150 and 0.126 via positive shocks. This means that Romer’s hypothesis is rejected for KSA even in the short run. Consequently, the authorities of KSA need to focus on internal factors for controlling the inflation rate. Similarly, via negative shocks, trade openness impacts the inflation rate negatively and significantly. This means that lowering the level of exposure to the global economy will reduce the inflationary pressure in KSA. The short-run dynamics also show that negative shocks in the natural resource sector are important for controlling inflationary pressure in KSA. On the other hand, a positive shock in the industrial sector is important for addressing the issue of a heightened inflation rate.
Moreover, we find evidence that, via a positive shock, the role of government is important in reducing inflationary pressure. This means the government authorities need to continue their role in the economy using fiscal and monetary channels. In addition to government expenditure, we find that a positive shock to GDP per capita increases inflation while a negative shock reduces the inflation rate. Our model has a sizeable adjustment speed of more than 27 percent, as evident from the ECT.
5.2. Diagnostics Analysis of NARDL
The estimated NARDL modeling passed all important diagnostics. The results, provided in Table A2 (Appendix A), confirmed the absence of heteroscedasticity, serial correlation, and normality and further endorsed that a suitable functional form was used. Similarly, Figure A3 and Figure A4 in Appendix A prove the stability of the error term of the NARDL modeling.
6. Concluding Remarks, Implications, and Limitations
This research study attempted to explore the openness–inflation relationship, which is interesting and a relatively open research area in KSA. The analysis of the paper is based on historical data spanning from 1975 to 2023. The ARDL approach was adopted for the analysis in the current study. For robustness, the study applied NARDL modeling.
Our results displayed a positive influence of openness on inflation, which is confirmation that the conventional Romer hypothesis does not hold. This means that the specific roles of trade openness and the inflation rate are not universal and vary across countries and regions. Therefore, suitable policy responses in the light of domestic economic conditions would be more appropriate to win the fight against a higher inflation rate. In addition, we found that government expenditure and domestic industrialization have played a dominant role in reducing inflation in KSA. Therefore, the government authorities need to play a more dominant role in the economy and further encourage the process of domestic industrialization to control a rising inflation rate. Lastly, the study found that the inflation rate in KSA is significantly dependent on the country’s economic performance and insignificantly dependent on the natural resource sector.
The NARDL results also confirmed that Romer’s hypothesis does not hold for Saudi Arabia, as positive shocks in openness are connected positively with the inflation rate and vice versa. This means the government authorities of KSA need to focus on internal factors for addressing the inflation rate instead of focusing on the role of trade. Similarly, positive shocks in government expenditure and industrialization appear to be important for addressing the issue of a heightened inflation rate in Saudi Arabia. Finally, GDP per capita increases the inflation rate via positive shocks and reduces inflation via negative shocks.
The present study has several important policy implications. Firstly, the authorities of KSA need to formulate and adopt suitable policy responses by keeping in mind the domestic economic conditions instead of relying on the foreign trade sector. We observed that a positive shock in trade openness brings enormous inflationary pressure, which is undesirable. KSA’s economy is significantly dependent on imports from the rest of the world. Hence, focusing on self-sustainable models of growth and having less dependency on a global economy would bring several benefits for KSA, including less inflation. Secondly, the government of KSA has played an important role in inflation management, as evident from the findings. All fiscal and monetary channels need to be utilized continuously for ensuring effective control over inflation. A positive shock in the government’s role is essential amid increased inflation. Moreover, targeted subsidies amid a heightened inflation rate need to be continued as they have proved their worth in protecting a large portion of the population from inflationary pressure over the years. Thirdly, the encouragement of industrial activities needs to be the top priority of the policymakers of KSA. Increased industrial activity produces more goods and services in the domestic economy; this is important for controlling inflationary pressure in the economy. Finally, it is found that a rising income level also impacts the inflation rate positively via positive shocks as it stimulates aggregate demand in the economy. In such a scenario, policymakers need to adopt suitable policy responses, such as targeted subsidies for marginalized sectors.
In addition to its implications, the present study has some noticeable limitations. Firstly, the current study’s analysis is restricted to only five determinants of the inflation rate, while some crucial determinants of the inflation rate, such as money supply, are not included among the regressors due to missing data from 2017 onward. Similarly, the rate of exchange is also missing from the analysis although it also impacts inflation, as evident from the prior literature. The current study did not include the inflation rate among the independent variables as the value of the Saudi Riyal has been fixed against the US dollar since 1987, as per the data from the World Bank. While the Riyal’s fixed peg to the US dollar is a key feature, acknowledging the potential role of the effective exchange rate (a trade-weighted average) would present a more nuanced and complete view of potential inflationary channels. Secondly, the results observed in the current study may not be applicable for other economies as KSA has a unique economic and political structure. Therefore, potential researchers need to carry out empirical studies by testing the models of our study for some other economies. In this way the issue of the generalization of the results could be solved.
Author Contributions
Conceptualization, M.T. and O.A.; software, M.T.; validation, O.A., M.T. and O.A.; formal analysis, M.T.; investigation, O.A.; resources, M.T.; data curation, O.A.; writing—original draft preparation, M.T.; writing—review and editing, O.A.; visualization, M.T.; supervision, O.A.; project administration, O.A.; funding acquisition, O.A. All authors have read and agreed to the published version of the manuscript.
Funding
This research received no external funding.
Institutional Review Board Statement
Not applicable.
Informed Consent Statement
Not applicable.
Data Availability Statement
Data will be provided upon receiving a suitable request.
Acknowledgments
The Researchers would like to thank the Deanship of Graduate Studies and Scientific Research at Qassim University for financial support (QU-APC-2025).
Conflicts of Interest
The authors declare no conflicts of interest.
Appendix A
Table A1.
Diagnostics (ARDL).
Table A1.
Diagnostics (ARDL).
| Diagnostic | Test Value | Prob. Value | Decision |
|---|---|---|---|
| White | 0.660 | 0.800 | “No Heteroscedasticity” |
| LM Test | 0.090 | 0.914 | “No Autocorrelation” |
| Ramsey | 1.582 | 0.223 | “Correct functional form” |
| Jarque–Bera | 2.988 | 0.224 | “Normal distribution” |
Table A2.
Diagnostics (NARDL).
Table A2.
Diagnostics (NARDL).
| Diagnostic | Test Value | Prob. Value | Decision |
|---|---|---|---|
| White | 0.885 | 0.627 | “No Heteroscedasticity” |
| LM Test | 2.023 | 0.178 | “No Autocorrelation” |
| Ramsey | 1.608 | 0.133 | “Correct functional form” |
| Jarque–Bera | 1.609 | 0.447 | “Normal distribution” |
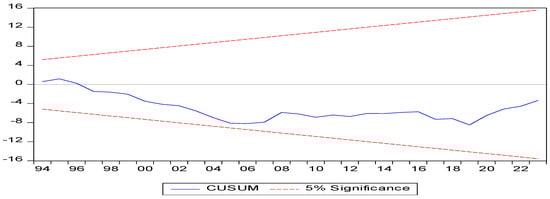
Figure A1.
ARDL “CUSUM Test”.
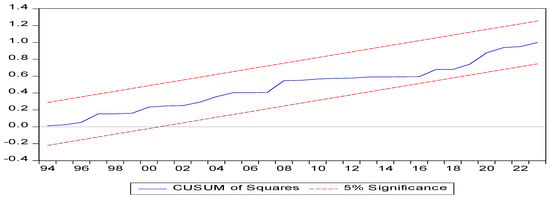
Figure A2.
ARDL “CUSUM Test (Square)”.

Figure A3.
NARDL “CUSUM Test”.

Figure A4.
NARDL “CUSUM Test Square”.
References
- Ahmad, N., Du, L., Tian, X. L., & Wang, J. (2019). Chinese growth and dilemmas: Modelling energy consumption, CO2 emissions and growth in China. Quality & Quantity, 53, 315–338. [Google Scholar] [CrossRef]
- Albahouth, A. A. (2025). Inflation rate determinants in Saudi Arabia: A non-linear ARDL approach. Sustainability, 17(3), 1036. [Google Scholar] [CrossRef]
- Ali, S. H. (2024). The policy of targeting inflation in the kingdom of Saudi Arabia and equilibrium relations using the error correction model A standard study during the period 2023–1990 AD. Journal of International Crisis and Risk Communication Research, 7(S12), 1046. [Google Scholar] [CrossRef]
- Alnefaee, S. M. (2018). Short and long-run determinants of inflation in Saudi Arabia: A cointegration analysis. International Journal of Financial Research, 9(4), 35–42. [Google Scholar] [CrossRef]
- Atabay, R. (2016). The relationship between trade openness and inflation in Turkey. International Journal of Research in Business and Social Science, 5(3), 137–145. [Google Scholar] [CrossRef]
- Baumann, P. F., Rossi, E., & Volkmann, A. (2023). What drives inflation and how? Evidence from additive mixed models selected by cAIC. Frontiers in Applied Mathematics and Statistics, 9, 1070857. [Google Scholar] [CrossRef]
- Belloumi, M., Aljazea, A., & Alshehry, A. (2023). Study of the impact of crude oil prices on economic output and inflation in Saudi Arabia. Resources Policy, 86, 104179. [Google Scholar] [CrossRef]
- Binici, M., Cheung, Y. W., & Lai, K. S. (2012). Trade openness, market competition, and inflation: Some sectoral evidence from OECD countries. International Journal of Finance & Economics, 17(4), 321–336. [Google Scholar] [CrossRef]
- Chhabra, M., & Alam, Q. (2020). An empirical study of trade openness and inflation in India. Decision, 47(1), 79–90. [Google Scholar] [CrossRef]
- Diaz, E. M., Cunado, J., & de Gracia, F. P. (2024). Global drivers of inflation: The role of supply chain disruptions and commodity price shocks. Economic Modelling, 140, 106860. [Google Scholar] [CrossRef]
- Dollar, D. (1992). Outward-oriented developing economies really do grow more rapidly: Evidence from 95 LDCs, 1976–1985. Economic Development and Cultural Change, 40(3), 523–544. [Google Scholar] [CrossRef]
- Edwards, S. (1998). Openness, productivity and growth: What do we really know? The Economic Journal, 108(447), 383–398. [Google Scholar] [CrossRef]
- Engle, R. F., & Granger, C. W. (1987). Co-integration and error correction: Representation, estimation, and testing. Econometrica: Journal of the Econometric Society, 251–276. [Google Scholar] [CrossRef]
- Frankel, J. A., & Romer, D. H. (1999). Does Trade Cause Growth? American Economic Review, 89(3), 379–399. [Google Scholar] [CrossRef]
- Hemmati, M., Tabrizy, S. S., & Tarverdi, Y. (2023). Inflation in Iran: An empirical assessment of the key determinants. Journal of Economic Studies, 50(8), 1710–1729. [Google Scholar] [CrossRef]
- Jazia, R. B., & Khabbouchi, N. (2024). Influence of inflation on the economic growth of Saudi Arabia. Saudi Journal of Business and Management Studies, 9, 75–84. [Google Scholar] [CrossRef]
- Johansen, S. (1988). Statistical analysis of cointegration vectors. Journal of Economic Dynamics and Control, 12(2–3), 231–254. [Google Scholar] [CrossRef]
- Kandil, M., & Morsy, H. (2011). Determinants of Inflation in GCC. Middle East Development Journal, 3(2), 141–158. [Google Scholar] [CrossRef]
- Kong, Q., Peng, D., Ni, Y., Jiang, X., & Wang, Z. (2021). Trade openness and economic growth quality of China: Empirical analysis using ARDL model. Finance Research Letters, 38, 101488. [Google Scholar] [CrossRef]
- Lim, Y. C., & Sek, S. K. (2015). An examination on the determinants of inflation. Journal of Economics, Business and Management, 3(7), 678–682. [Google Scholar] [CrossRef]
- Lotfalipour, M. R., Montazeri, S., & Sedighi, S. (2013). Trade openness and inflation. Evidence from MENA region countries. Petroleum-Gas University of Ploiesti Bulletin, Technical Series, 65(2), 1–11. [Google Scholar]
- Managi, S., Hibiki, A., & Tsurumi, T. (2009). Does trade openness improve environmental quality? Journal of Environmental Economics and Management, 58(3), 346–363. [Google Scholar] [CrossRef]
- Mehrara, M., Soufiani, M. B., & Rezaei, S. (2016). The impact of government spending on inflation through the inflationary environment, STR approach. World Scientific News, 37, 153–167. [Google Scholar] [CrossRef]
- Mohsin, M., Shamsudin, M. N., Alshammary, K. M., & Sarfraz, M. (2024). Exploring the nexus between CO2 emissions, trade, and sustainable economic growth: A novel NARDL approach. International Journal of Energy Economics and Policy, 14(2), 357–366. [Google Scholar] [CrossRef]
- Munir, S., Hasan, H., & Muhammad, M. (2015). The effect of trade openness on inflation: Panel data estimates from selected Asian economies (1976–2010). Southeast Asian Journal of Economics, 3, 23–42. Available online: https://so05.tci-thaijo.org/index.php/saje/article/view/48820 (accessed on 5 June 2025).
- Narayan, P. (2004). Reformulating critical values for the bounds F-statistics approach to cointegration: An application to the tourism demand model for Fiji (Vol. 2, No. 04). Monash University. [Google Scholar]
- Naseem, S. (2018). Macroeconomics determinants of Saudi Arabia’s inflation 2000–2016: Evidence and analysis. International Journal of Economics and Financial Issues, 8(3), 137–141. [Google Scholar]
- Nguyen, T. D. (2019). Impact of government spending on inflation in Asian emerging economies: Evidence from India, China, and Indonesia. The Singapore Economic Review, 64(05), 1171–1200. [Google Scholar] [CrossRef]
- Pesaran, M. H., Shin, Y., & Smith, R. J. (2001). Bounds testing approaches to the analysis of level relationships. Journal of Applied Econometrics, 16(3), 289–326. [Google Scholar] [CrossRef]
- Raggad, B., & Ben-Salha, O. (2025). Inflation spillover among GCC countries: New insights from asymmetric TVP-VAR connectedness analysis. International Journal of Islamic and Middle Eastern Finance and Management. [Google Scholar] [CrossRef]
- Ramady, M. A. (2009). External and internal determinants of inflation: A case study of Saudi Arabia. Middle East Journal of Economics and Finance, 2, 25–38. [Google Scholar]
- Rashad, A. S., El-Sholkamy, M. M., & Olimat, M. (2023). The war in Ukraine and inflation drivers in the GCC: Evidence from Dubai. Journal of International Women’s Studies, 25(6), 13. [Google Scholar]
- Romer, D. (1993). Openness and inflation: Theory and evidence. The Quarterly Journal of Economics, 108(4), 869–903. [Google Scholar] [CrossRef]
- Sachs, J. D., & Warner, A. (1995). Economic reform and the process of global integration. Brookings Papers on Economic Activity, 1995(1), 1–118. [Google Scholar] [CrossRef]
- Saleem, H., Shabbir, M. S., & Bilal khan, M. (2020). The short-run and long-run dynamics among FDI, trade openness and economic growth: Using a bootstrap ARDL test for co-integration in selected South Asian countries. South Asian Journal of Business Studies, 9(2), 279–295. [Google Scholar] [CrossRef]
- Salimifar, M., Razmi, M. J., & Taghizadegan, Z. (2015). A survey of the effect of trade openness size on inflation rate in Iran using ARDL. Theoretical & Applied Economics, 22(3), 143–154. [Google Scholar]
- Samimi, A. J., Ghaderi, S., Hosseinzadeh, R., & Nademi, Y. (2012). Openness and inflation: New empirical panel data evidence. Economics Letters, 117(3), 573–577. [Google Scholar] [CrossRef]
- Sepehrivand, A., & Azizi, J. (2016). The effect of trade openness on inflation in D-8 member countries with an emphasis on Romer theory. Asian Journal of Economic Modelling, 4(4), 162–167. [Google Scholar] [CrossRef]
- Shin, Y., Yu, B., & Greenwood-Nimmo, M. (2014). Modelling asymmetric cointegration and dynamic multipliers in a nonlinear ARDL framework. In Festschrift in honor of peter schmidt (pp. 281–314). Springer. [Google Scholar]
- Sisay, E., Atilaw, W., & Adisu, T. (2022). Impact of economic sectors on inflation rate: Evidence from Ethiopia. Cogent Economics & Finance, 10(1), 2123889. [Google Scholar] [CrossRef]
- Tahir, M. (2020). Trade and life expectancy in China: A cointegration analysis. China Economic Journal, 13(3), 322–338. [Google Scholar] [CrossRef]
- Tahir, M., Ali, N. O., Naseem, I., & Burki, U. (2023). Trade openness and inflation rate in China: Empirical evidence from time series data. Economies, 11(10), 240. [Google Scholar] [CrossRef]
- Tahir, M., & Azid, T. (2015). The relationship between international trade openness and economic growth in the developing economies: Some new dimensions. Journal of Chinese Economic and Foreign Trade Studies, 8(2), 123–139. [Google Scholar] [CrossRef]
- World Bank. (2025). World development indicators. Available online: https://databank.worldbank.org/source/world-development-indicators (accessed on 20 June 2025).
- Yiheyis, Z. (2013). Trade openness and inflation performance: A panel data analysis in the context of African countries. African Development Review, 25(1), 67–84. [Google Scholar] [CrossRef]
- Zakarıa, M. (2010). Openness and inflation: Evidence from time series data. Doğuş Üniversitesi Dergisi, 11(2), 313–322. [Google Scholar] [CrossRef]
Disclaimer/Publisher’s Note: The statements, opinions and data contained in all publications are solely those of the individual author(s) and contributor(s) and not of MDPI and/or the editor(s). MDPI and/or the editor(s) disclaim responsibility for any injury to people or property resulting from any ideas, methods, instructions or products referred to in the content. |
© 2025 by the authors. Licensee MDPI, Basel, Switzerland. This article is an open access article distributed under the terms and conditions of the Creative Commons Attribution (CC BY) license (https://creativecommons.org/licenses/by/4.0/).