The Role of Sequencing Economics in Agglomeration: A Contrast with Tinbergen’s Rule


Abstract
1. Introduction
2. Spatial Economics Approach to Railroad-Driven Agglomeration (RDA)
2.1. Literature Review
2.1.1. Tinbergen’s Rule
2.1.2. Sequencing
2.1.3. Scientific Management
2.1.4. Sequencing Economics
2.1.5. Transit-Oriented Development (TOD)
2.1.6. Spatial Economics
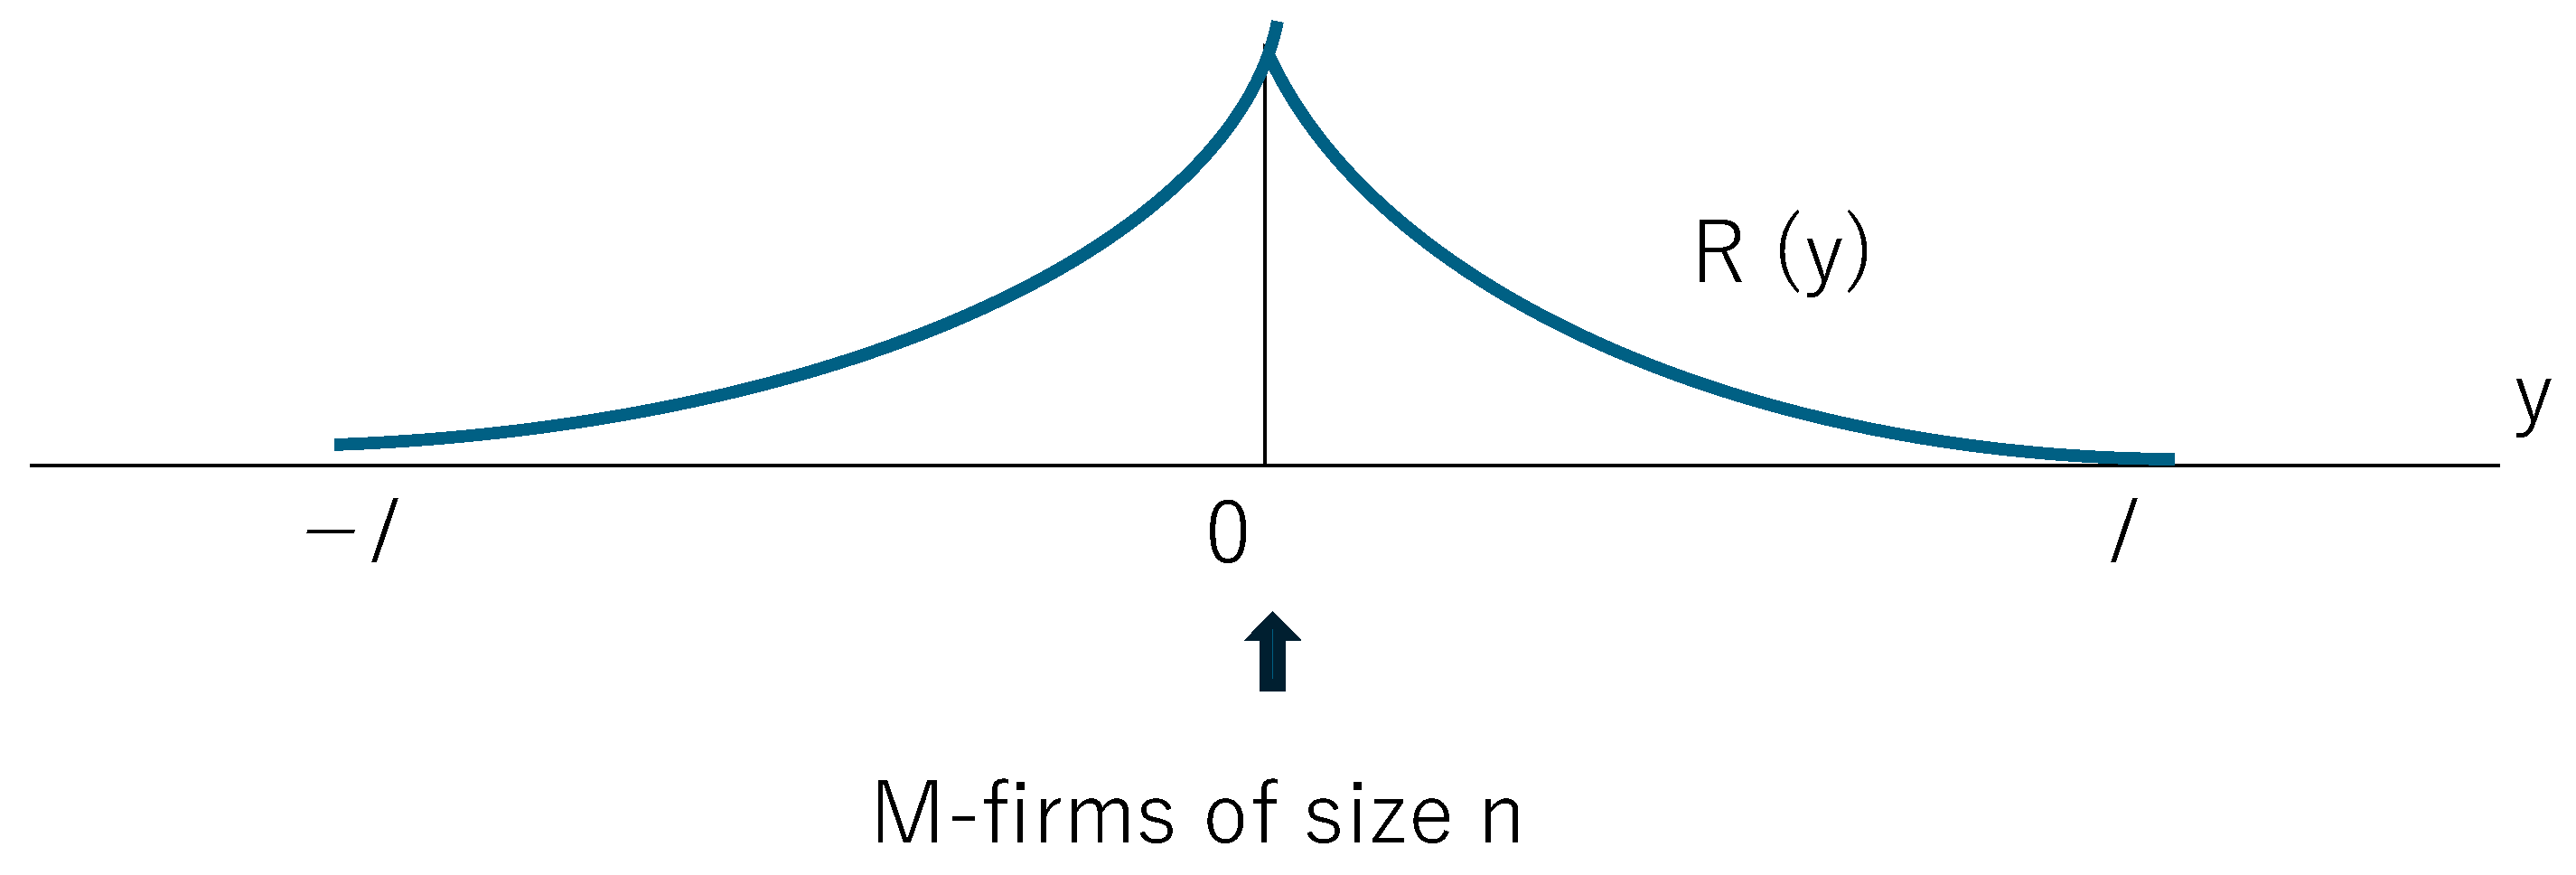
2.2. The Monocentric City Model of Fujita and Krugman
2.3. Relationship Between the Emergence of a New City and Lower Transport Costs
3. The Forward-Linkage Effects of the Sectors of Transport and Trade, and Services
3.1. Tertiary Industries
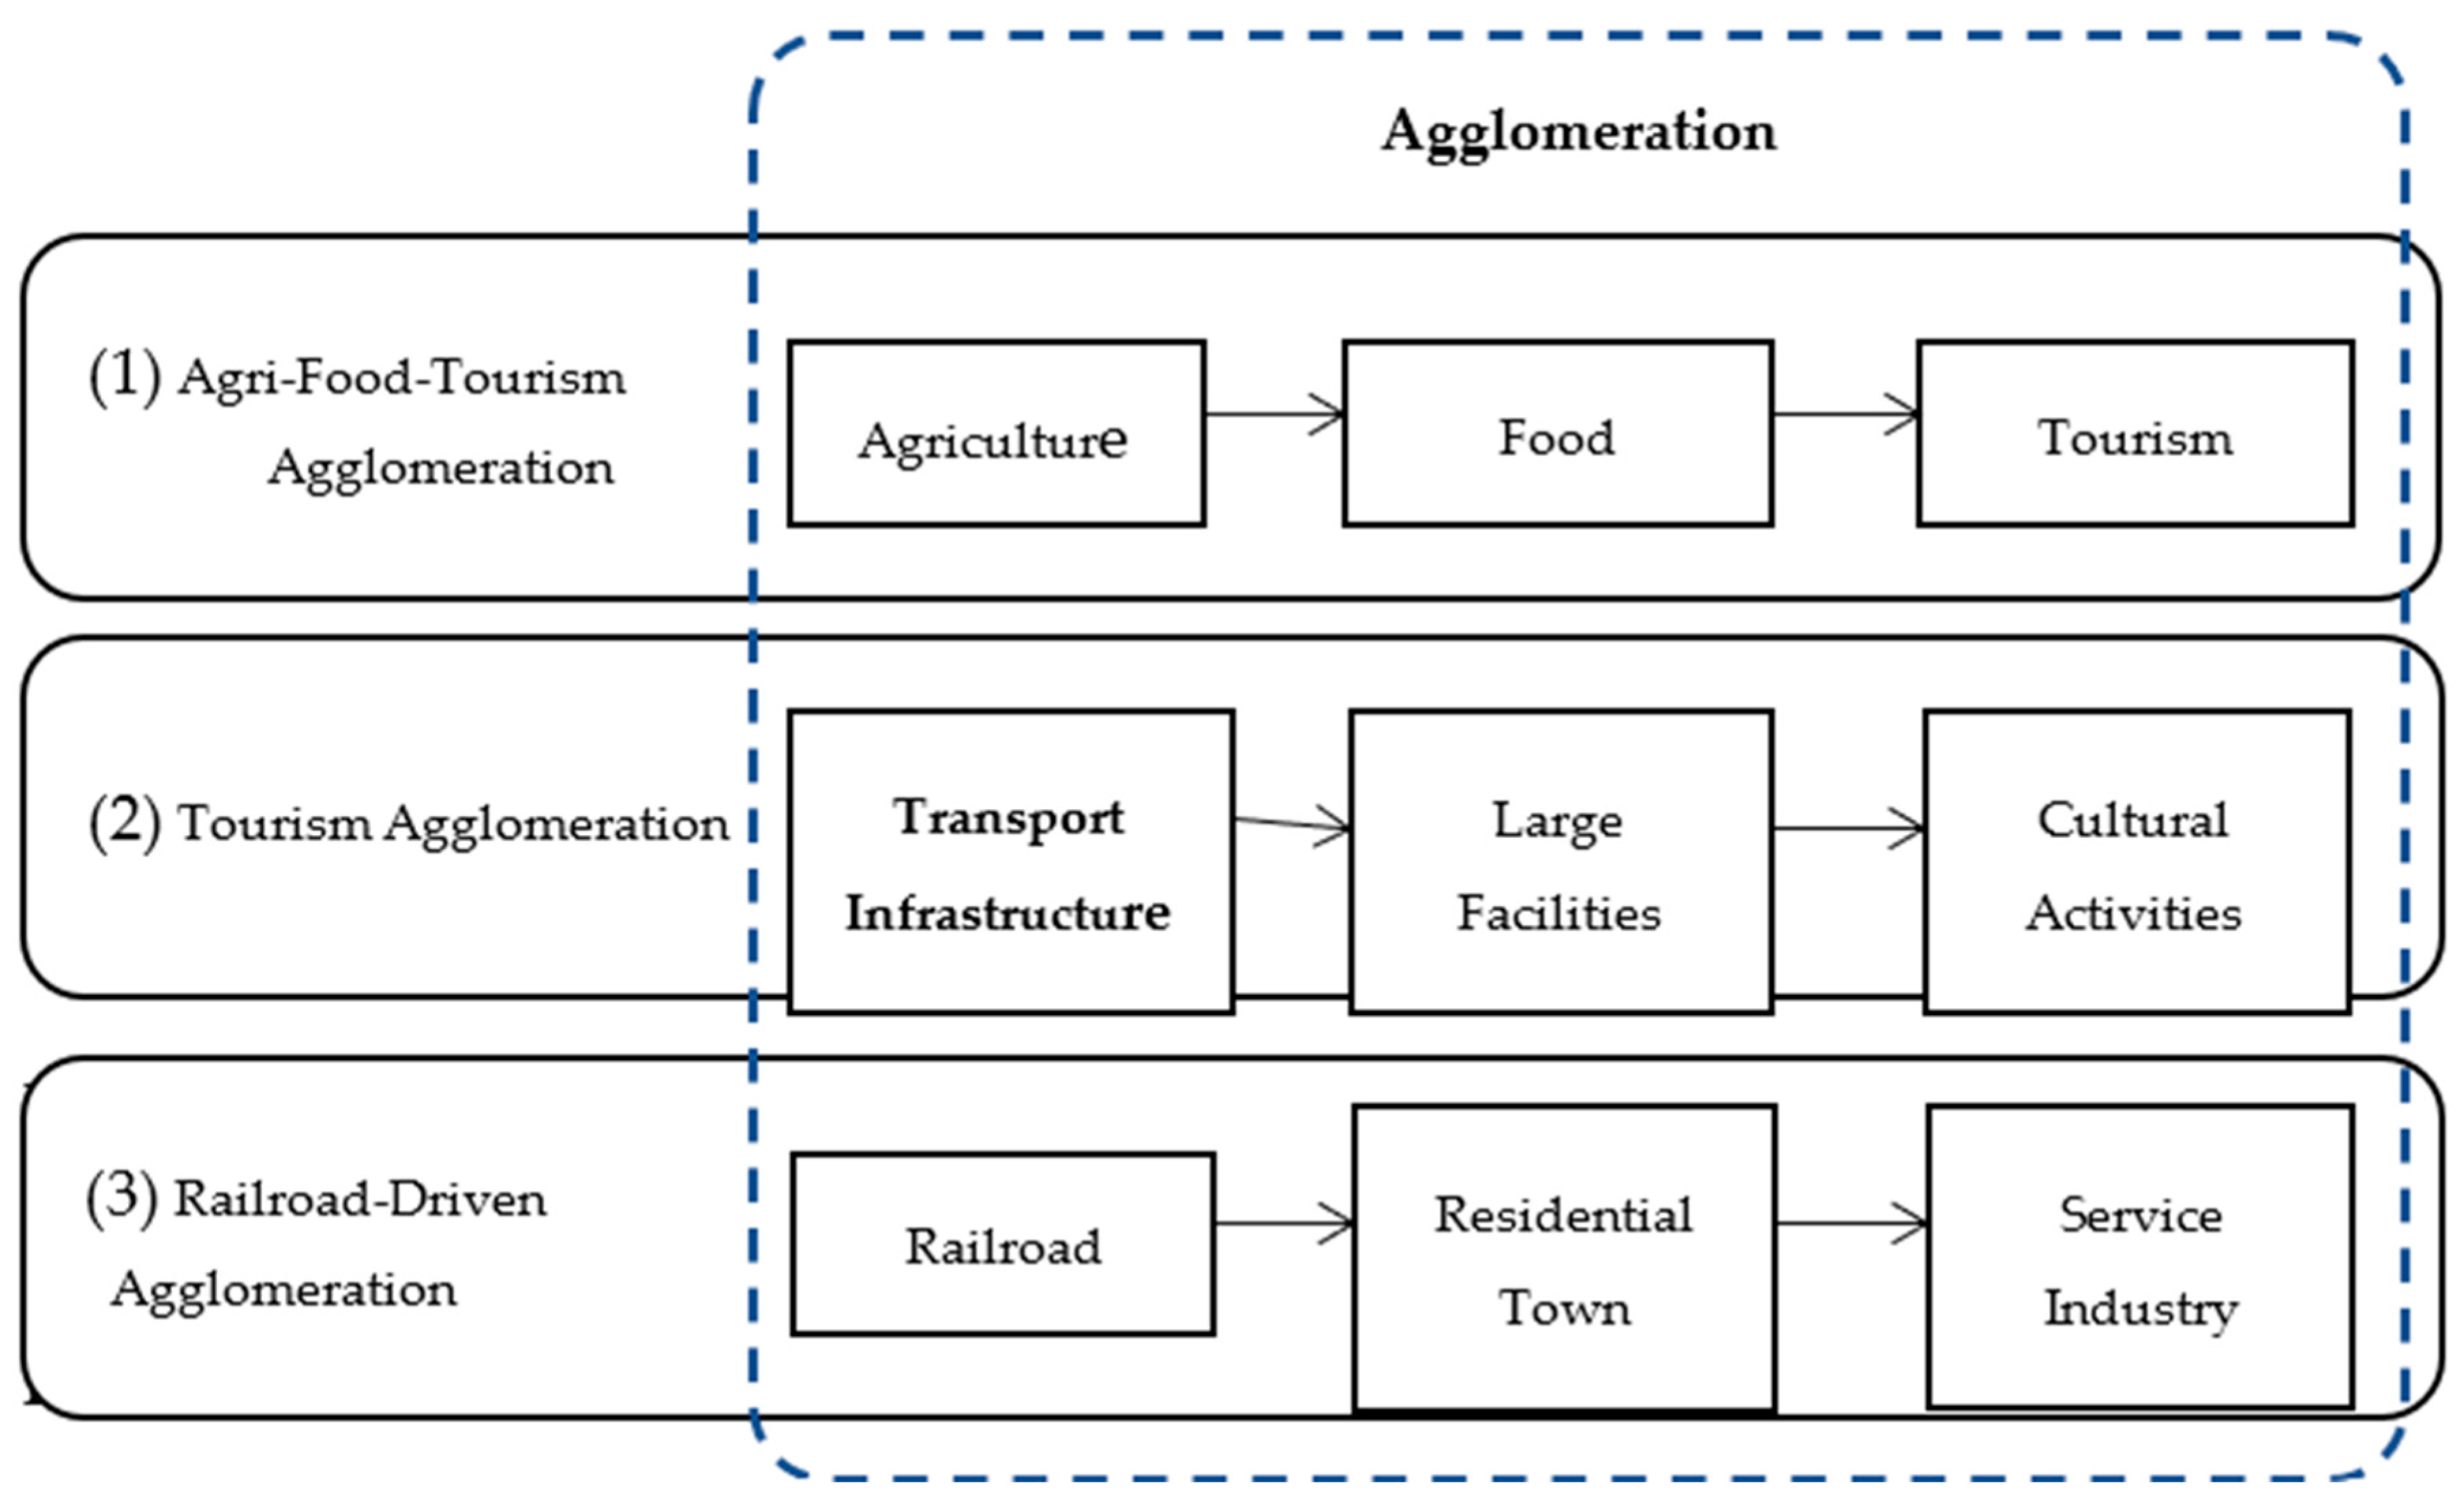
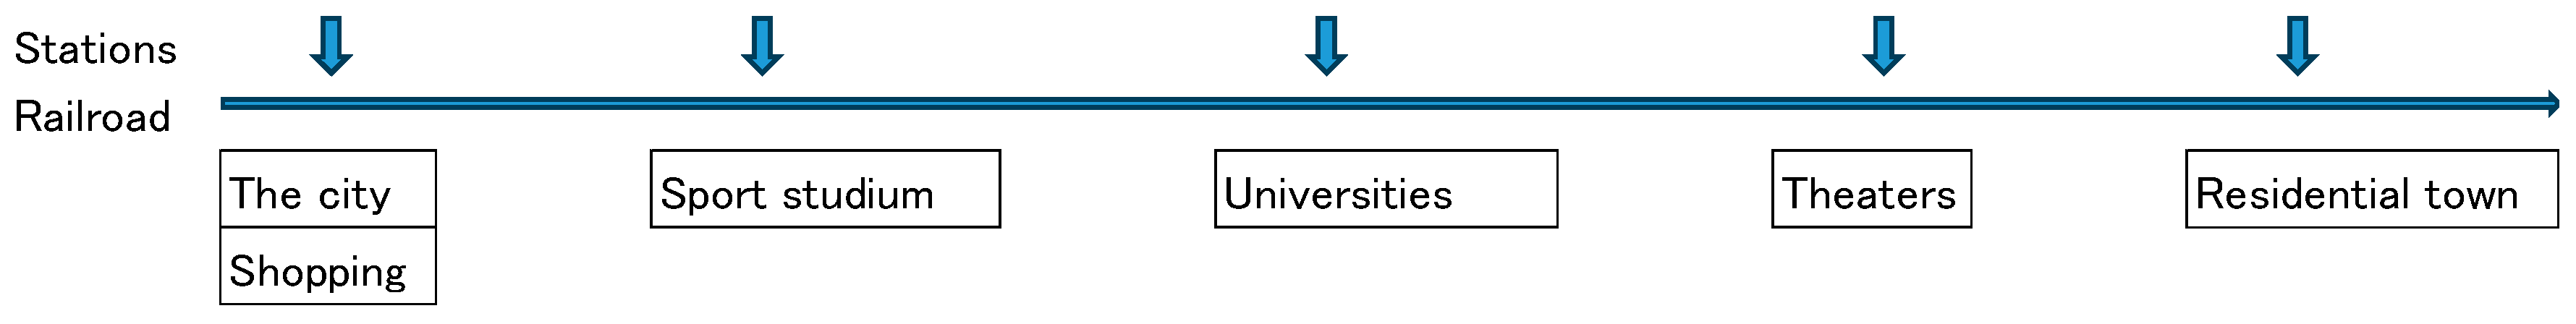
3.2. The Integration Model of Railroad Construction and Cultural Activities
3.3. Definition of the Forward-Linkage Effect in the Input–Output Table
4. A Prototype Model of the Hankyu Railroad
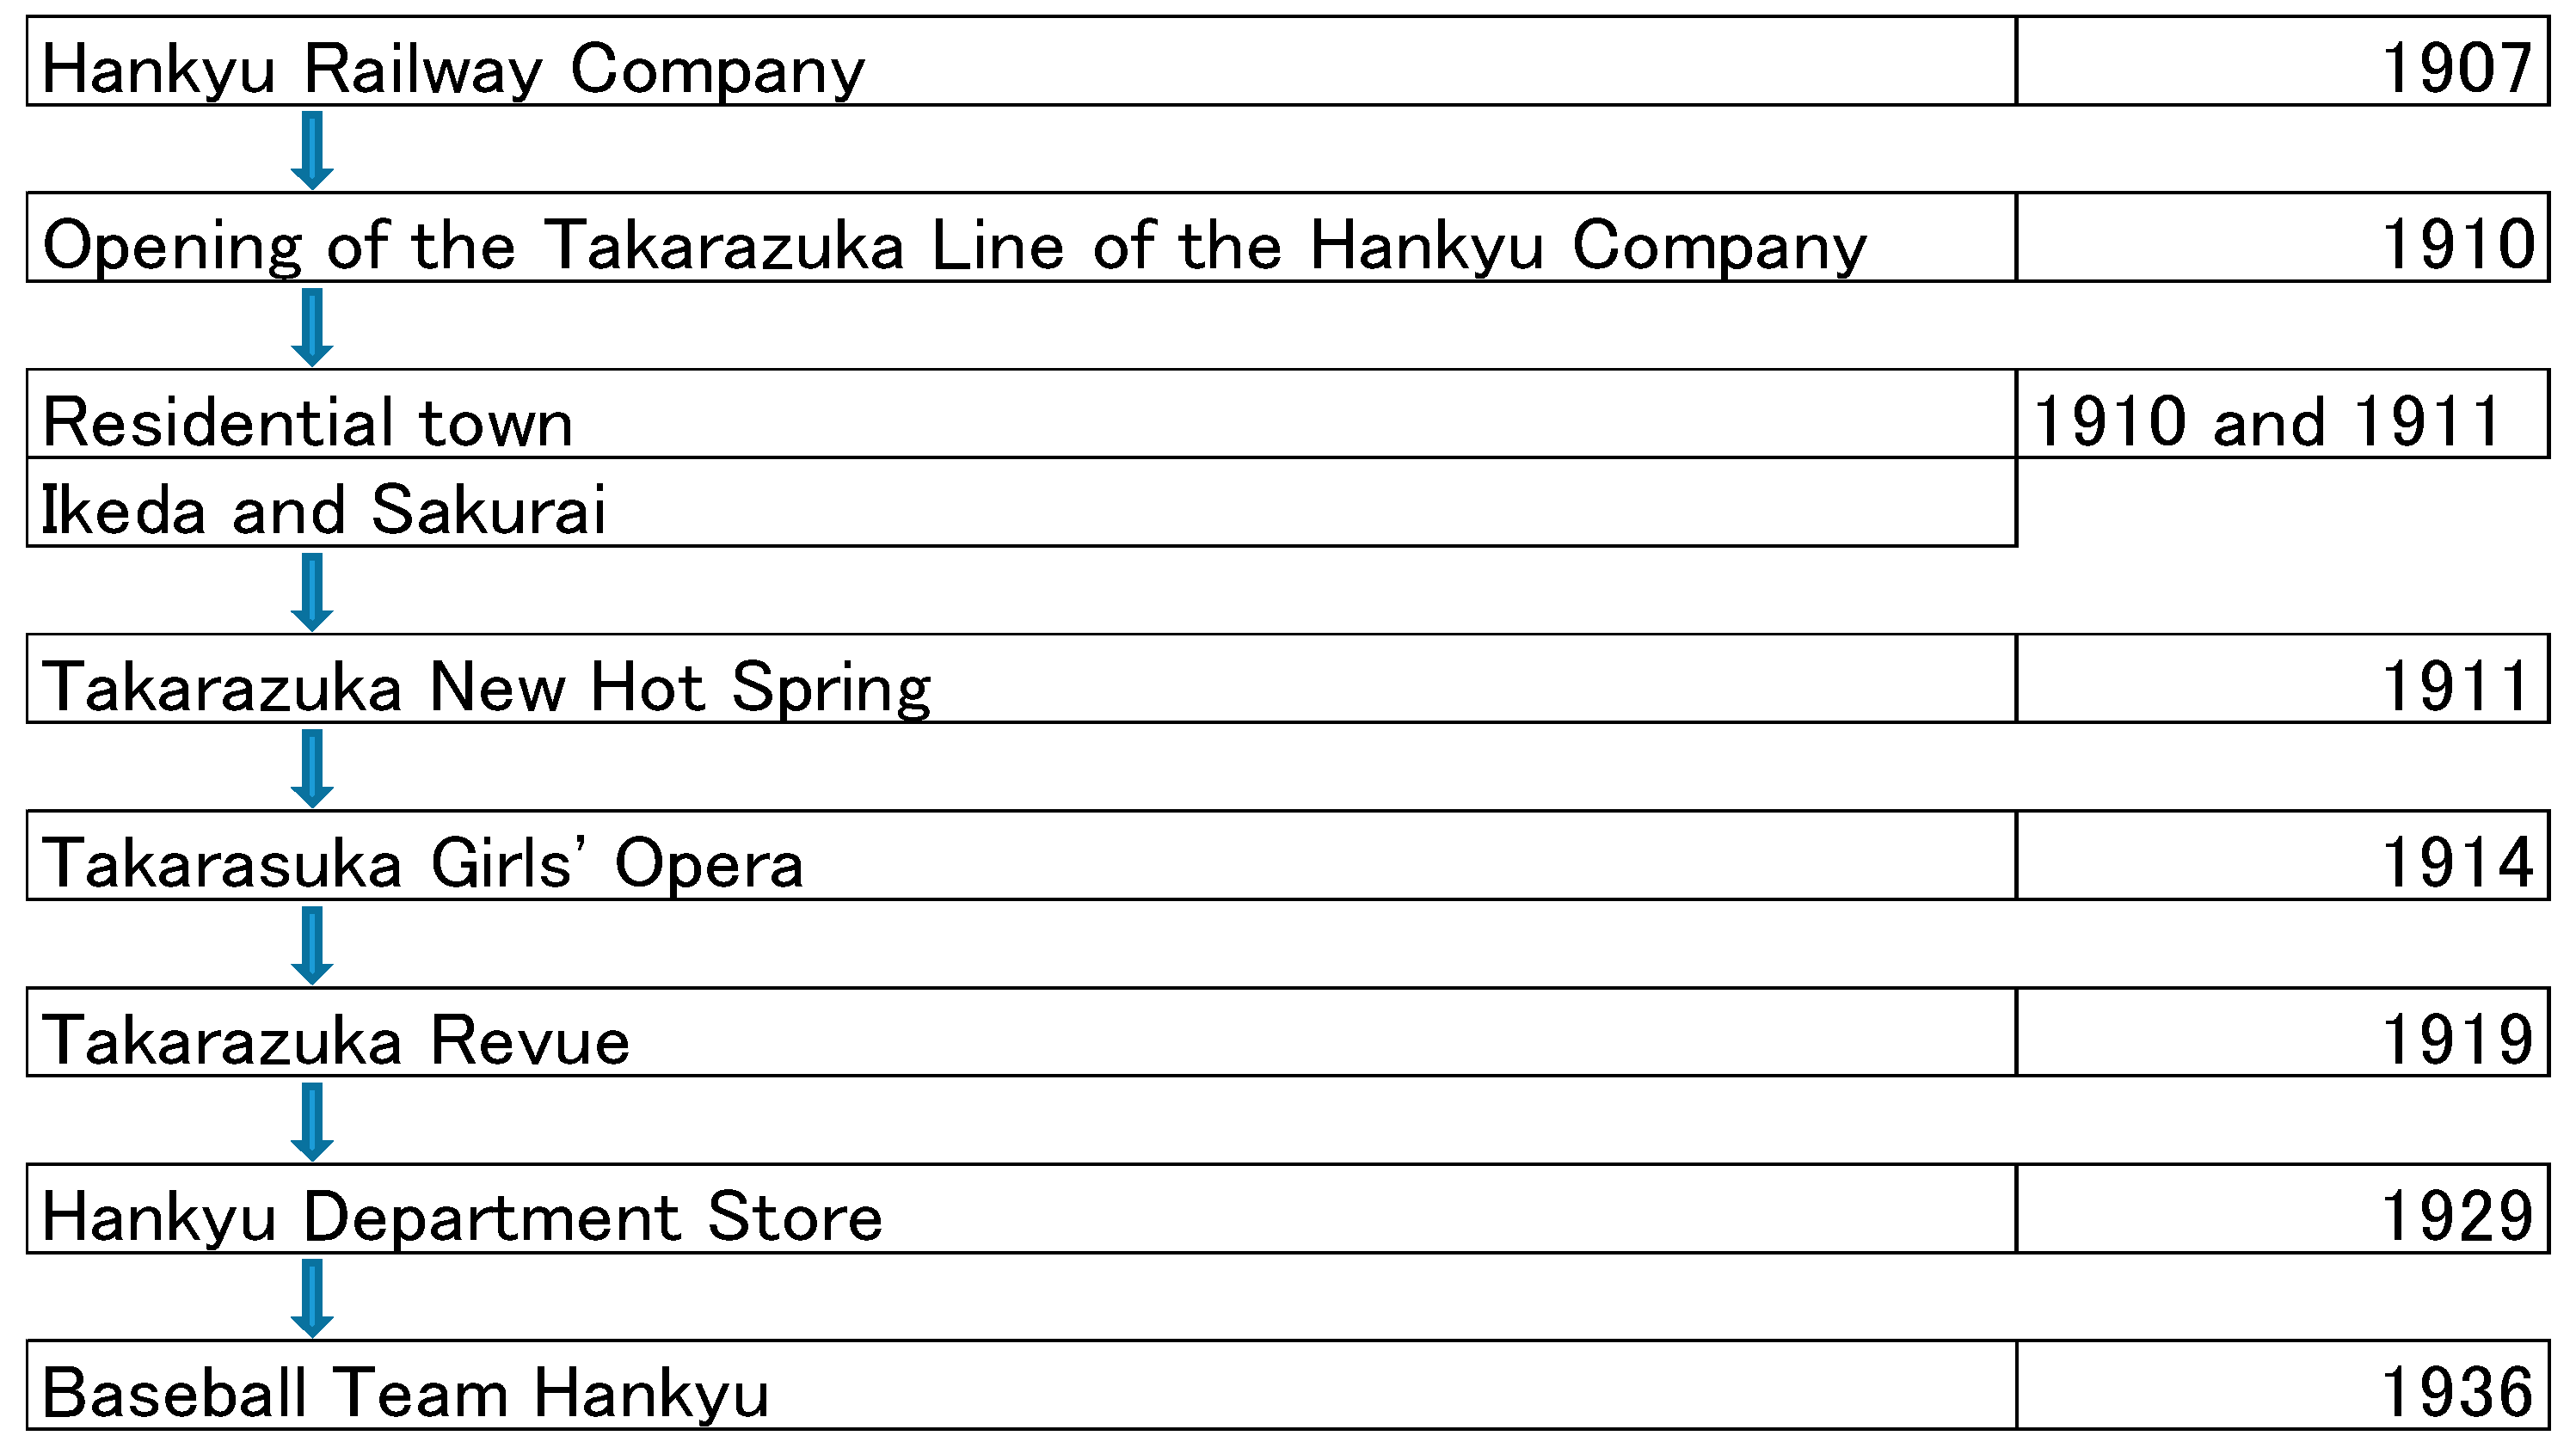
4.1. Hankyu Railway Company in Western Japan, Kanto
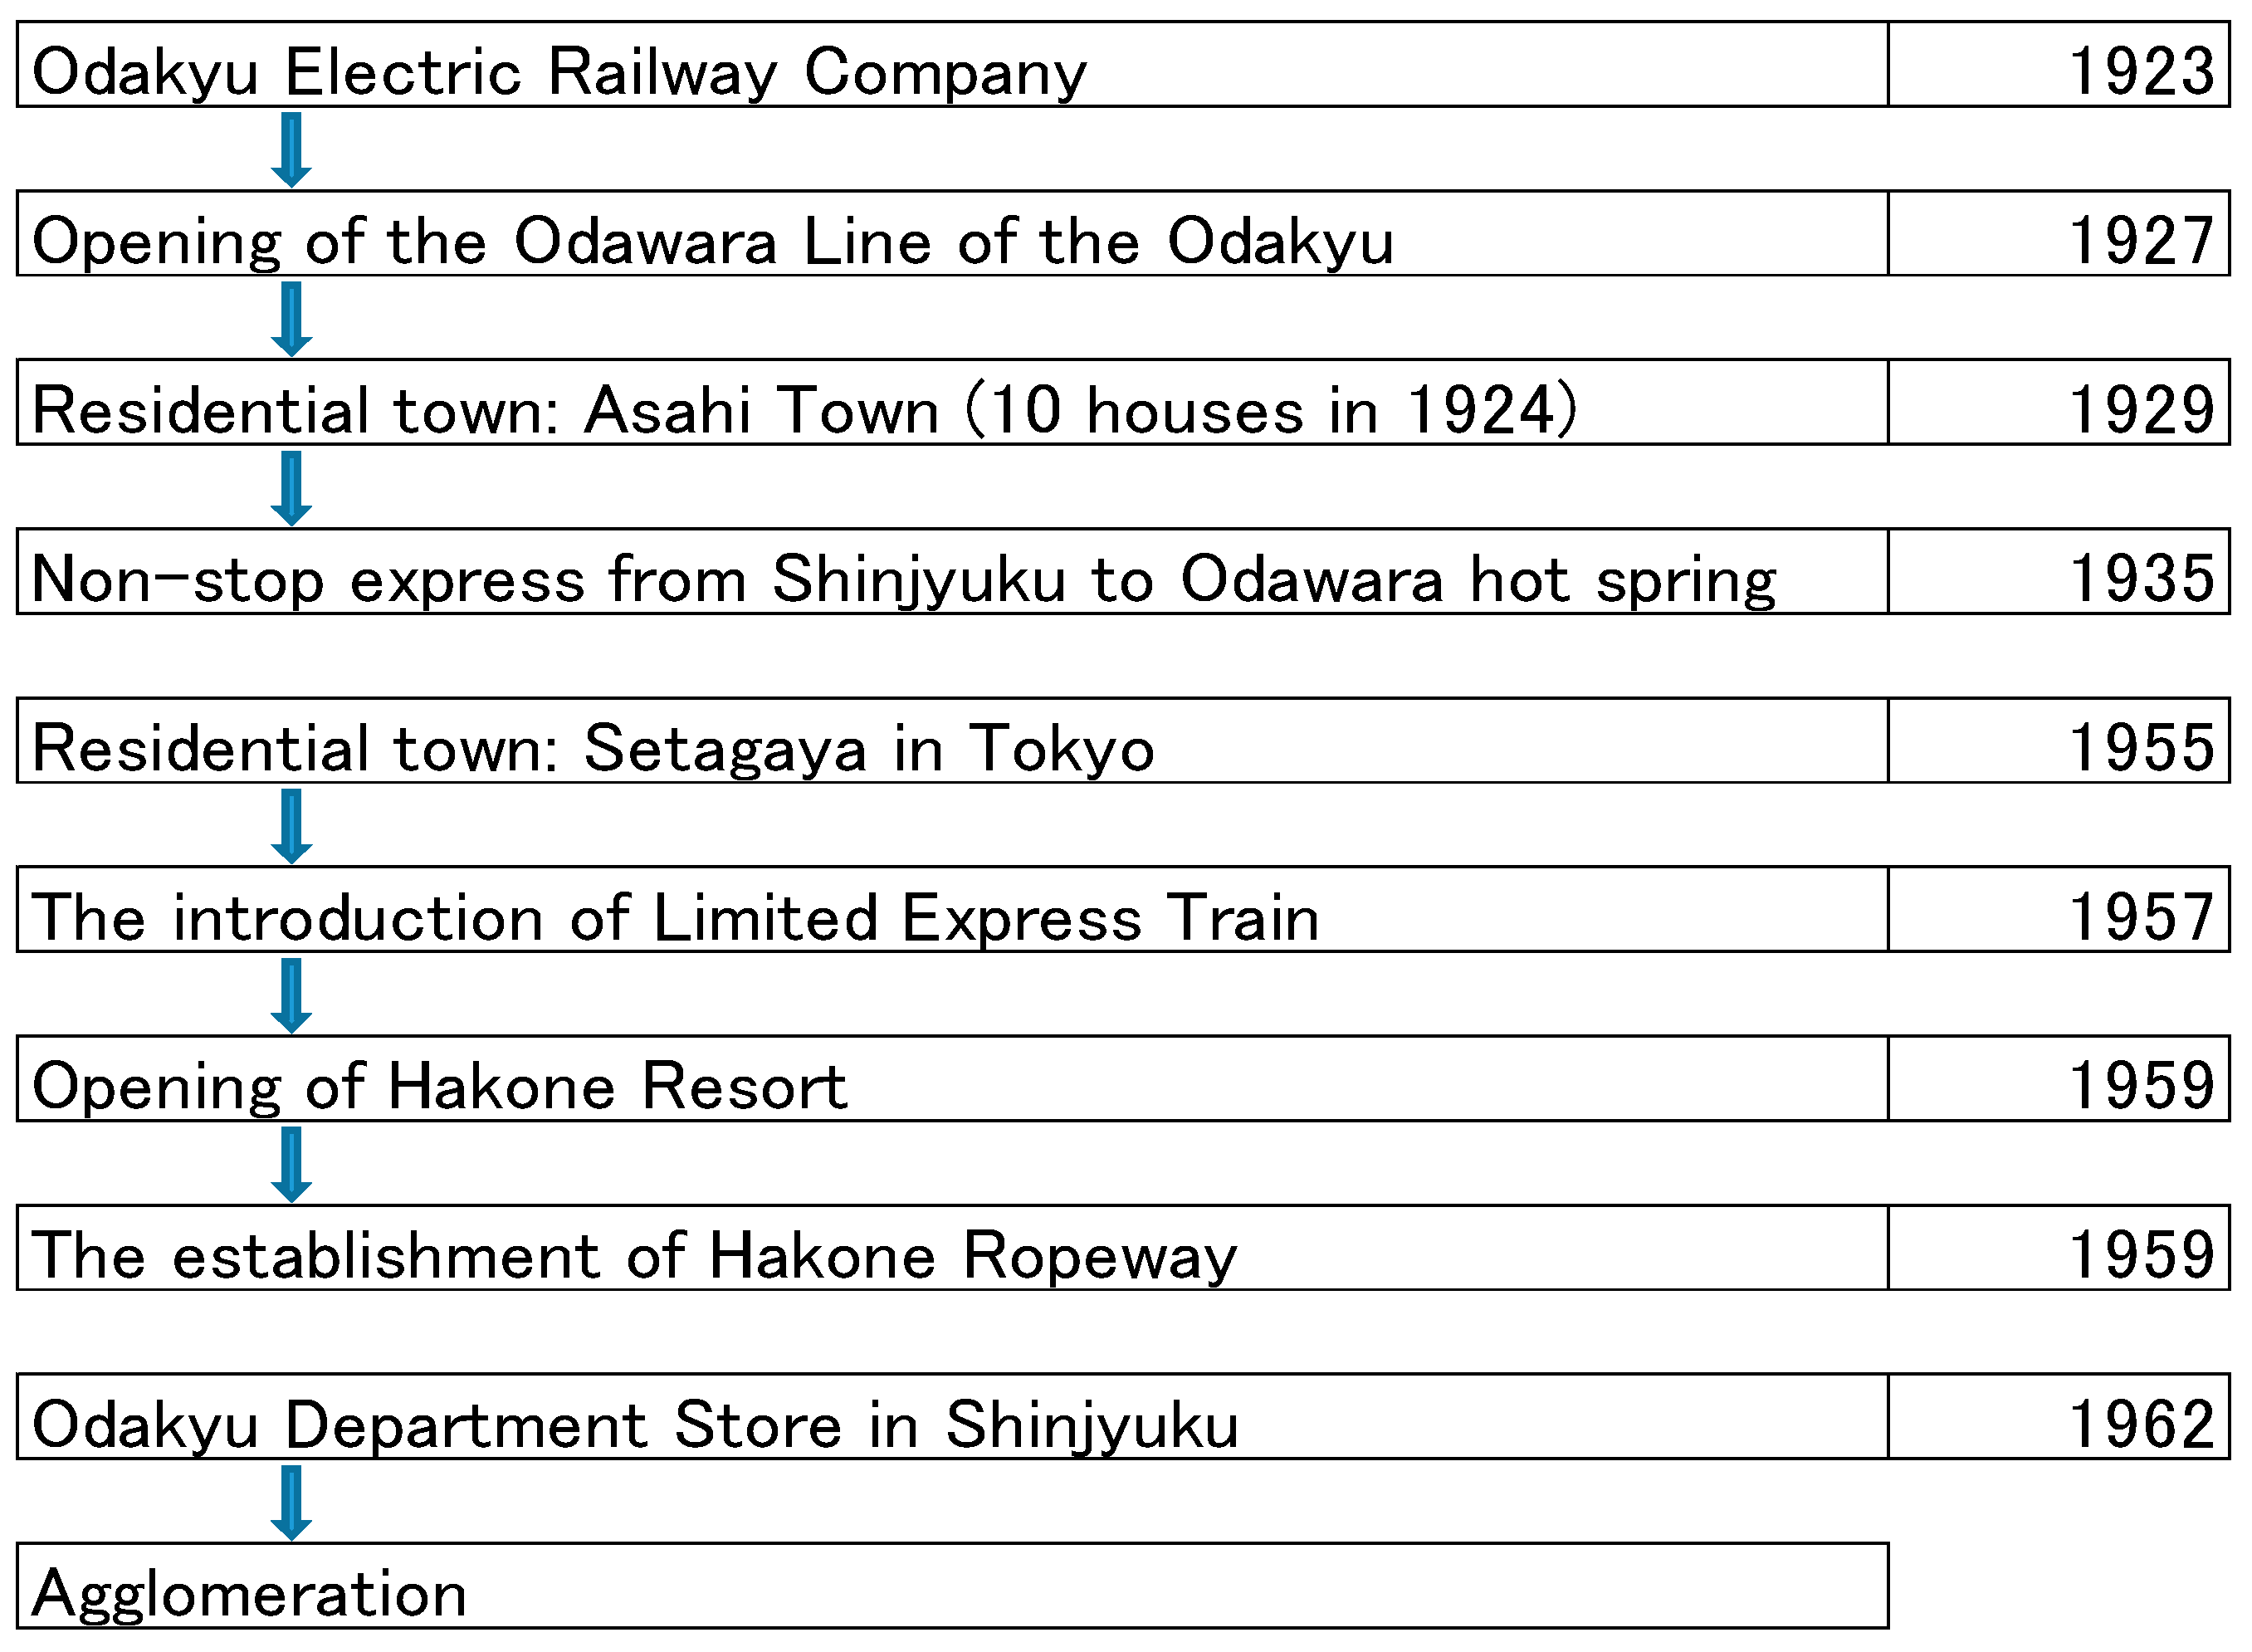
4.2. Odakyu Electric Railway Company in Eastern Japan, Kanto
5. The Success of Tsukuba Science City
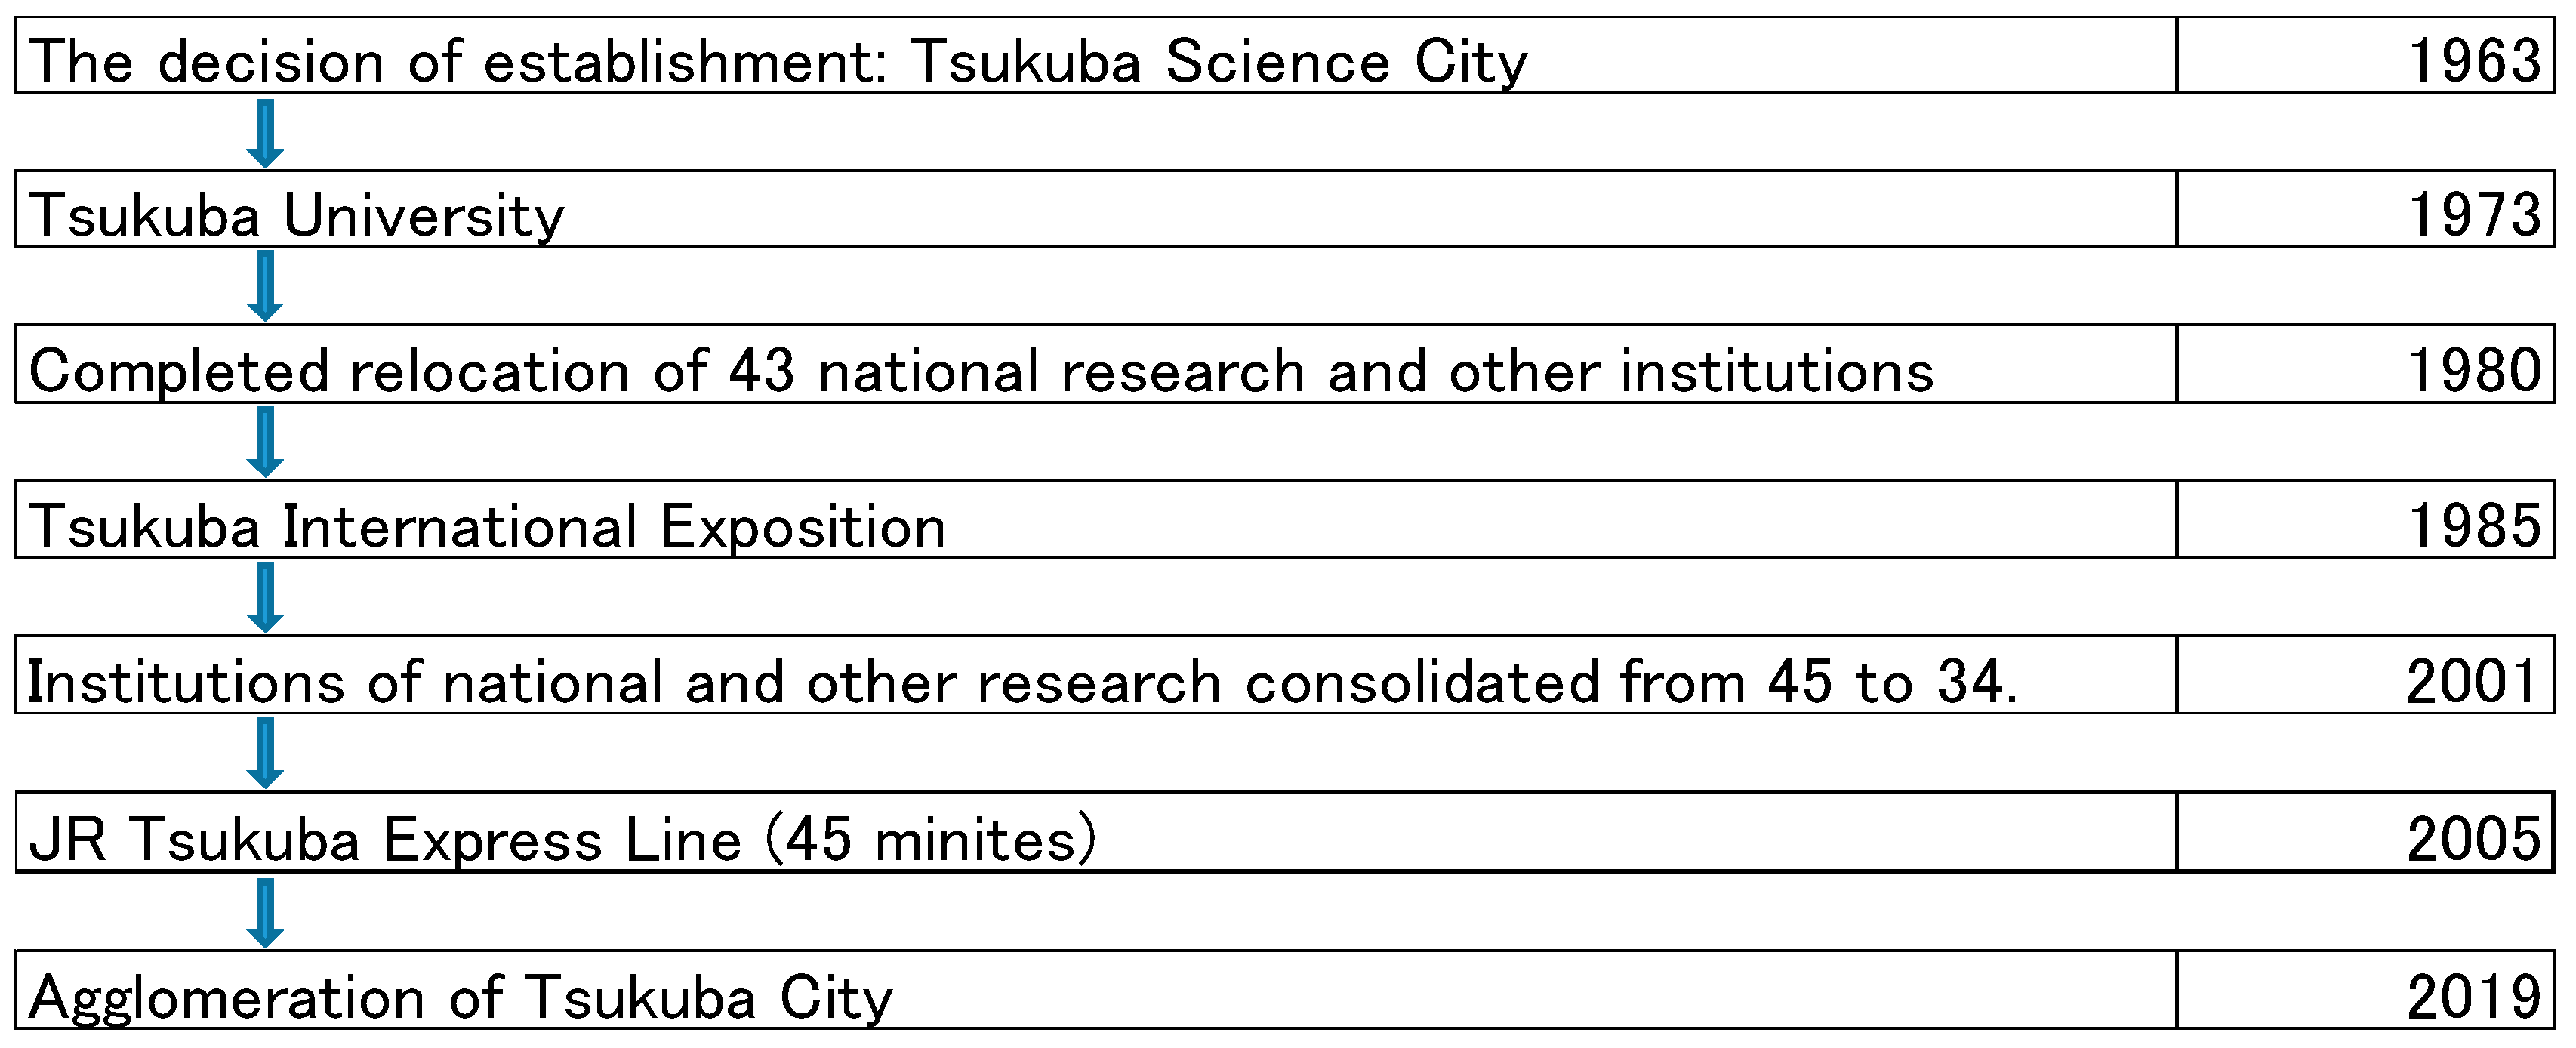
5.1. Tsukuba Science City
5.2. Tsukuba Express
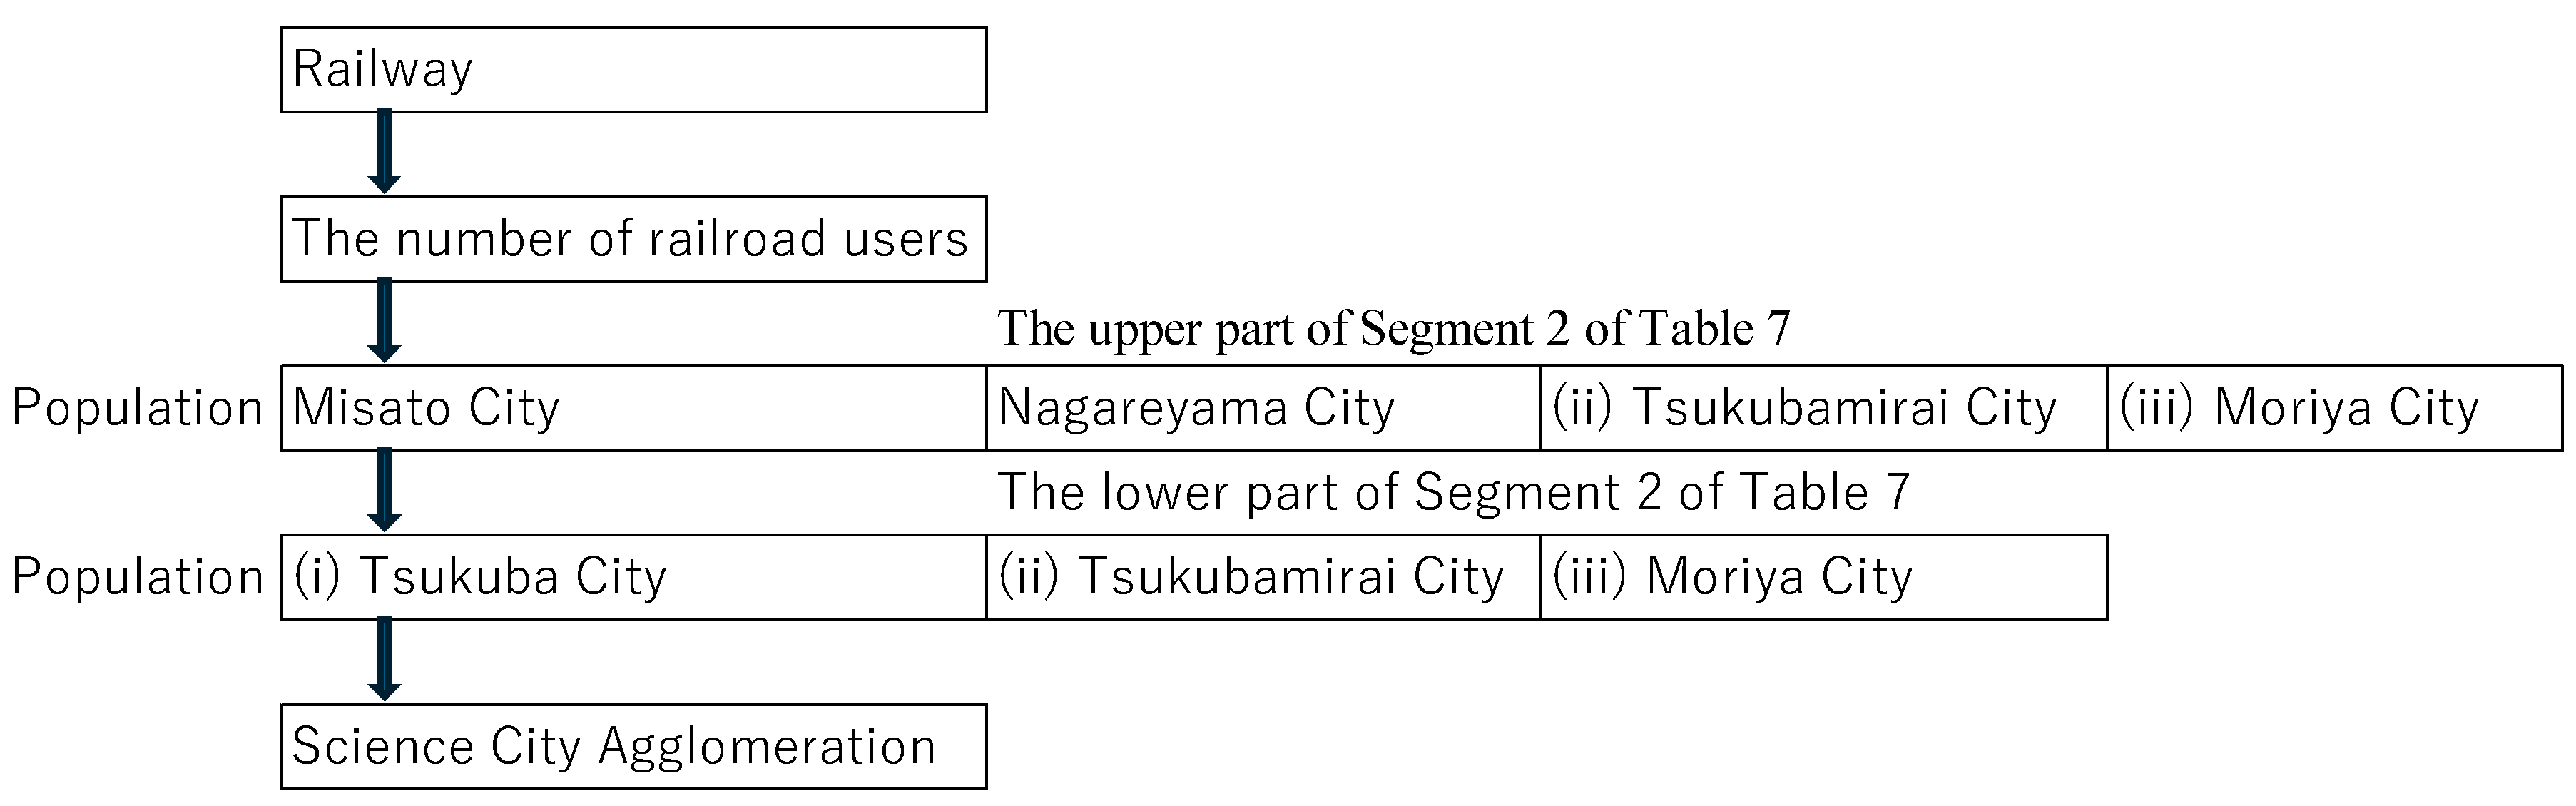
5.3. The Railroad as a Master Switch for Science City Agglomeration
6. Conclusions
Funding
Institutional Review Board Statement
Informed Consent Statement
Data Availability Statement
Acknowledgments
Conflicts of Interest
Appendix A
Appendix B

| Year | Tsukuba | Railroad Users | Moriya | Nagareyama | Yashio | Tsukubamirai | Misato | Kashiwa |
|---|---|---|---|---|---|---|---|---|
| 2005 | 191,582 | 150,700 | 53,501 | 151,838 | 75,507 | 40,174 | 129,679 | 380,963 |
| 2006 | 194,652 | 195,300 | 54,037 | 153,662 | 76,927 | 40,529 | 130,495 | 384,420 |
| 2007 | 197,853 | 234,200 | 56,307 | 155,106 | 78,347 | 41,697 | 130,563 | 388,350 |
| 2008 | 200,428 | 257,600 | 57,793 | 157,058 | 79,978 | 42,627 | 130,537 | 391,943 |
| 2009 | 203,253 | 270,300 | 59,167 | 159,446 | 81,231 | 43,557 | 131,284 | 397,446 |
| 2010 | 206,106 | 282,600 | 61,143 | 162,361 | 82,977 | 44,461 | 132,299 | 404,012 |
| 2011 | 207,628 | 289,700 | 62,621 | 156,661 | 83,600 | 45,198 | 133,372 | 405,658 |
| 2012 | 216,331 | 305,900 | 63,000 | 166,493 | 84,465 | 46,911 | 133,318 | 404,578 |
| 2013 | 218,418 | 323,900 | 63,344 | 167,699 | 87,744 | 47,672 | 134,515 | 406,395 |
| 2014 | 220,135 | 325,600 | 63,740 | 170,168 | 85,517 | 48,807 | 135,856 | 408,198 |
| 2015 | 222,818 | 340,100 | 64,287 | 173,231 | 86,091 | 50,091 | 136,840 | 413,954 |
| 2016 | 226,253 | 354,200 | 64,906 | 177,208 | 86,998 | 50,836 | 137,940 | 417,294 |
| 2017 | 229,404 | 370,200 | 65,744 | 181,737 | 88,831 | 51,503 | 139,413 | 420,824 |
| 2018 | 232,894 | 386,300 | 66,415 | 186,863 | 90,789 | 51,630 | 140,702 | 424,322 |
| 2019 | 236,842 | 395,400 | 67,127 | 191,403 | 91,967 | 51,825 | 141,765 | 429,070 |
References
- Alonso, W. (1964). Location and land use. Toward a general theory of land Rent. Harward University Press. [Google Scholar] [CrossRef]
- Audretsch, D. B., & Feldman, M. P. (1996). R&D spillovers and the geography of innovation and production. American Economic Review, 86(3), 630–640. [Google Scholar]
- Calthorpe Associates. (1992). City of San Diego land guidance system: Transit-oriented development design guidelines. City of San Diego & Calthorpe Associates. [Google Scholar]
- Calthorpe, P. (1993). The next American metropolis: Ecology, community, and the American dream. Princeton Architectural Press. [Google Scholar]
- City of Tsukuba. (2023). What is Tsukuba science city? Available online: https://www.city.tsukuba.lg.jp/soshikikarasagasu/toshikeikakubutoshikeikakuka/gyomuannai/4/3/1002135.html (accessed on 4 December 2024).
- City of Tsukuba. (2024). Available online: https://www.city.tsukuba.lg.jp/shisei/joho/jinkohyo/index.html (accessed on 6 December 2024).
- Doi, T. (2020). TOD in 1910—Establishment and development of the urban railroad business model in Kansai. In City planning review (Vol. 346, pp. 30–33). The City Planning Institute of Japan. Available online: https://chikoken.org/wp/wp-content/uploads/toshi030-033.pdf (accessed on 7 December 2024).
- Fogelson, R. M. (1967). The fragmented metropolis: Los Angeles, 1850–1930. University of California University Press. [Google Scholar]
- Fujita, M., & Krugman, P. (1995). When is the economy monocentric?: Von Thünen and Chamberlin unified. Regional Science and Urban Economics, 25, 505–528. [Google Scholar] [CrossRef]
- Fujita, M., & Thisse, J.-F. (2003). Does geographical agglomeration foster economic growth? And who gains and loses from it? Japanese Economic Review, 54, 121–45. [Google Scholar] [CrossRef]
- Gantt, H. L. (1910). Work, wages and profits: Their influence on the cost of living. Engineering Magazine Company. [Google Scholar]
- Golizadeh, H. (2017). Automated construction progress monitoring using image segmentation methods and BIM. LAP Lambert Academic Publishing. [Google Scholar]
- Helpman, E., & Krugman, P. (1985). Market structure and foreign trade. The MIT Press. [Google Scholar]
- Hilton, G. W., & Due, J. F. (1960). The electric interurban railways in America. Stanford University Press. [Google Scholar]
- Howard, E. (1902). Garden cities of tomorrow. Swan Sonnenschein & Co., Ltd. Available online: https://dn790002.ca.archive.org/0/items/gardencitiesofto00howa/gardencitiesofto00howa.pdf (accessed on 9 March 2025).
- Ibaraki Preferential Government. (2025). Population. Available online: https://www.pref.ibaraki.jp/kikaku/tokei/fukyu/tokei/sugata/local/tsukuba.html?utm_source=chatgpt.com (accessed on 9 March 2025).
- Ikeda Municipal Library. (2014). Muromachi housing. Ikeda City Library. Available online: https://lib-ikedacity.jp/kyodo/kyodo_bunken/muromachi_jutaku.html (accessed on 10 July 2025).
- Institute of Developing Economies-JETRO. (2006). Asian international input-output table 2000: Volume 2 data, statistical data series (p. 315). No. 90. Institute of Developing Economies-JETRO. [Google Scholar]
- Jamme, H.-T., Rodriguez, J., Bahl, D., & Banerjee, T. (2019). A twenty-five-year biography of the TOD concept: From design to policy, planning, and implementation. Journal of Planning Education and Research, 39(4), 409–428. [Google Scholar] [CrossRef]
- JICA. (2014). Information collection and confirmation study on ASEAN 2025: Final report. Available online: https://openjicareport.jica.go.jp/pdf/12152906.pdf (accessed on 7 December 2024).
- Johnston, R. B., & Sundararajan, V. (Eds.). (1999). Sequencing financial sector reforms: Country experiences and issues. International Monetary Fund. [Google Scholar] [CrossRef]
- Kashima, S. (2018). The great management innovator born in Japan, Ichizo Kobayashi. Chuokoron Shinsha Company. [Google Scholar]
- Kashiwa City. (2024). Available online: https://www.city.kashiwa.lg.jp/databunseki/shiseijoho/toukei/jinko/joju.html (accessed on 6 December 2024).
- Kelley, J. E., Jr., & Walker, M. R. (1959). Critical path planning and scheduling proceedings of the eastern joint computer conference. Available online: https://mosaicprojects.com.au/PDF/PM-History_Critical_Path_Planning_&_Scheduling_Kelley_and_Walker_1959.pdf (accessed on 4 January 2025).
- Krugman, P. (1991). Increasing returns and economic geography. Journal of Political Economy, 99, 483–99. [Google Scholar] [CrossRef]
- Kuchiki, A. (2015). Building a “sixth industrial cluster in the form of a cobweb type of train-led cluster” as a growth strategy for Asia. International Trade and Investment, (101). Available online: https://www.iti.or.jp/kikan101/101kuchiki.pdf (accessed on 10 January 2025). (In Japanese).
- Kuchiki, A. (2023). Accelerator for agglomeration in sequencing economics: “Leased” industrial zones. Economies, 11, 295. [Google Scholar] [CrossRef]
- Kuchiki, A. (2024a). Brake segment for agglomeration policy: Engineers as human capital. Economies, 12, 163. [Google Scholar] [CrossRef]
- Kuchiki, A. (2024b). Start switch for innovation in “construction sequencing”: Research funding. Economies, 12, 302. [Google Scholar] [CrossRef]
- Kuchiki, A., Gokan, T., & Maruya, T. (2017). Railway-led formation of the agriculture-food-tourism industry cluster. In A. Kuchiki, T. Mizobe, & T. Gokan (Eds.), A multi-industrial linkages approach to Cluster (pp. 187–205). Chapter 9. Palgrave Macmillan. [Google Scholar]
- Kuchiki, A., & Sakai, H. (2023). Symmetry breaking as “master switch” for agglomeration policy. Review of Public Administration and Management, 11(2), 1–8. [Google Scholar] [CrossRef]
- Kuchiki, A., & Tsuji, M. (Eds.). (2008). The flowchart approach to industrial cluster policy. Palgrave Macmillan. [Google Scholar]
- Malcolm, D. G., Roseboom, J. H., Clark, C. E., & Fazar, W. (1959). Application of a technique for research and development program evaluation. Operations Research, 7(5), 646–669. Available online: https://econpapers.repec.org/article/inmoropre/v_3a7_3ay_3a1959_3ai_3a5_3ap_3a646-669.htm (accessed on 4 January 2025). [CrossRef]
- Matsuda, A. (2003). The development of residential towns in the suburbs and strategies of private railroad companies. Japanese Journal of Human Geography, 55(5), 492–508. [Google Scholar] [CrossRef]
- Ministry of Economy, Trade and Industry of Japan. (2024). Monthly report of indices of tertiary industry activity. Available online: https://www.meti.go.jp/english/statistics/tyo/sanzi/result-2.html#historical (accessed on 2 December 2024).
- Ministry of Land, Infrastructure, Transport and Tourism of Japan. (2024). Available online: https://www.mlit.go.jp/common/001447956.pdf (accessed on 4 December 2024).
- Misato City. (2024). Available online: https://www.city.misato.lg.jp/soshiki/somu/somu/3/2/1310.html (accessed on 6 December 2024).
- Moriya City. (2024). Available online: https://www.city.moriya.ibaraki.jp/_res/projects/default_project/_page_/001/005/527/201901joju.pdf (accessed on 6 December 2024).
- Nagareyama City. (2024). Available online: https://www.city.nagareyama.chiba.jp/appeal/1003878/1003882.html (accessed on 6 December 2024).
- National Diet Library of Japan. (2025). Takarazuka hot spring. National Diet Library of Japan. Available online: https://www.ndl.go.jp/scenery/column/kansai/takarazuka_onsen.html (accessed on 9 March 2025).
- Odakyu Electric Railway Co. (2025). Available online: https://www.odakyu.jp/company/history/ (accessed on 10 July 2025).
- Porter, M. E. (1998). Clusters and the new economics of competition. Harvard Business Review, 76(6), 77–90. [Google Scholar] [PubMed]
- Rodrik, D. (2007). One economics, many recipes: Globalization, institutions, and economic growth. Princeton University Press. [Google Scholar]
- Taylor, F. W. (1911). The principles of scientific management. Harper Brothers. Available online: https://resources.saylor.org/wwwresources/archived/site/wp-content/uploads/2011/08/HIST363-7.1.3-Frederick-W-Taylor.pdf (accessed on 1 January 2025).
- Tinbergen, J. (1952). On the theory of economic policy. North-Holland. [Google Scholar]
- Tsuganezawa, S. (1991). Takarazuka strategy. Kodansha. [Google Scholar]
- Tsukubamirai City. (2024). Available online: https://www.city.tsukubamirai.lg.jp/gyousei/shoukai/page000783.html (accessed on 6 December 2024).
- Warner, S. B. (1962). The process of growth in Boston, 1870–1900. Harvard University Press. [Google Scholar]
- World Bank. (2024). World development report 2024: The middle-income trap. World Bank. Available online: https://www.worldbank.org/en/publication/wdr2024 (accessed on 9 March 2025).
- Yashio City. (2024). Available online: https://www.city.yashio.lg.jp/shisei/tokei/toukeiyashio/R5toukeiyashio.files/yashio_r5toukeisho.pdf (accessed on 10 July 2025).
- Zalduendo, J. (2005). Pace and sequencing of economic policies. IMF working paper. WP/05/118. Available online: https://www.imf.org/external/pubs/ft/wp/2005/wp05118.pdf (accessed on 9 March 2025).

| Economics | (A) Segmentation, (B) Construction Sequencing | (C) Segment Function |
|---|---|---|
| Characteristics | (A) Segments | (C) Functions |
| Key Segments | Residential town, public spaces, airports, factories, IT OS and data center business, and so on | (C) (i) Master switch, (ii) Accelerator, (iii) Brake |
| Theory | Scientific management: CPM, PERT, BIM etc. | Flowchart Approach: economies of sequence |
| Source | Taylor (1911), Gantt (1910) | Kuchiki (2024a), Kuchiki (2023), Kuchiki and Sakai (2023) |
| Types of Agglomerations | Function | Segment | Spatial Economics | Papers | Location |
|---|---|---|---|---|---|
| Urban agglomeration | (1) Master switch | Transport costs | Krugman (1991), Alonso (1964) | Kuchiki and Sakai (2023) | Sapporo, Japan |
| Manufacturing | (2) Accelerator | Industrial zones | Helpman and Krugman (1985) | Kuchiki (2023) | Industrial hubs, China |
| Manufacturing | (3) No braking | Engineers | Helpman and Krugman (1985) | Kuchiki (2024a) | Industrial hubs, India |
| Knowledge and manufacturing industry | (4) Start switch | Research funding | Fujita and Thisse (2003) | Kuchiki (2024b) | Nations |
| Scientific city | (1) Master switch | Transport costs | Fujita and Krugman (1995) | This paper | Tsukuba Science City |
| Item_Number | Item_Name |
|---|---|
| J000000I | Tertiary Industry |
| JF00000I | Electricity, Gas, Heat Supply and Water |
| JG00000I | Information and Communications |
| JH00000I | Transport and Postal Activities |
| JI00000I | Wholesale and Retail Trade |
| JJ00000I | Finance and Insurance |
| JK00000I | Real Estate and Goods Rental and Leasing |
| JL00000I | Scientific Research, Professional and Technical Services |
| JM00000I | Accommodations, Eating and Drinking Services |
| JN00000I | Living-related and Personal Services and Amusement Services |
| JO00000I | Learning Support |
| JP00000I | Medical, Health Care and Welfare |
| JQ00000I | Compound Services |
| JR00000I | Miscellaneous Services (except Government Services etc.) |
| SBA0000I | Services |
| SBA1000I | Personal Services |
| SBA2000I | Business Services |
| SBB0000I | Broad-ranging Personal Services |
| SBB1000I | Broad-ranging Essential Personal Services |
| SBB2000I | Broad-ranging Non-essential Personal Services |
| SBC0000I | Broad-ranging Business Services |
| SBCB100I | Manufacturing-dependent Business Services |
| SBCB200I | Non-manufacturing-dependent Business Services |
| SBE2000I | Private Capital Investment Services |
| SBRA000I | Tourism Industry |
| SKEL000I | Tertiary Industry (except Wholesale and Retail Trade) |
| Indonesia | Malaysia | Philippines | Singapore | Thailand | China | Taiwan | Republic of Korea | Japan | U.S. | The Average | ||
|---|---|---|---|---|---|---|---|---|---|---|---|---|
| 1 | Paddy | 0.732 | 0.633 | 0.629 | 0.517 | 0.672 | 0.762 | 0.584 | 0.73 | 0.595 | 0.517 | 0.6371 |
| 2 | Other agricultural products | 0.902 | 0.896 | 0.741 | 0.567 | 0.92 | 1.263 | 0.8 | 0.592 | 0.624 | 1.009 | 0.8314 |
| 3 | Livestock and poultry | 0.609 | 0.721 | 0.606 | 0.519 | 0.628 | 0.771 | 0.803 | 0.676 | 0.642 | 0.787 | 0.6762 |
| 4 | Forestry | 0.698 | 0.8 | 0.556 | 0.517 | 0.559 | 0.698 | 0.521 | 0.578 | 0.651 | 0.838 | 0.6416 |
| 5 | Fishery | 0.564 | 0.61 | 0.559 | 0.519 | 0.642 | 0.626 | 0.673 | 0.566 | 0.576 | 0.524 | 0.5859 |
| 6 | Crude petroleum and natural gas | 1.813 | 1.158 | 0.519 | 0.517 | 0.81 | 1.274 | 0.559 | 0.517 | 0.523 | 1.071 | 0.8761 |
| 7 | Other mining | 1.096 | 0.61 | 0.662 | 0.558 | 0.637 | 1.074 | 0.605 | 0.615 | 0.592 | 0.723 | 0.7172 |
| 8 | Food, beverage and tobacco | 1.043 | 1.531 | 0.866 | 0.708 | 1.125 | 1.033 | 1.109 | 1.066 | 0.991 | 0.925 | 1.0397 |
| 9 | Textile, leather, and the products thereof | 0.803 | 0.692 | 0.653 | 0.615 | 0.839 | 1.733 | 0.992 | 0.968 | 0.871 | 0.824 | 0.899 |
| 10 | Timber and wooden products | 0.675 | 0.734 | 0.602 | 0.577 | 0.6 | 0.72 | 0.564 | 0.683 | 0.693 | 0.755 | 0.6603 |
| 11 | Pulp, paper and printing | 0.822 | 0.789 | 0.641 | 0.639 | 0.766 | 0.992 | 0.898 | 1.07 | 1.355 | 1.195 | 0.9167 |
| 12 | Petroleum and petro products | 1.008 | 1.049 | 0.791 | 0.962 | 0.986 | 2.475 | 1.498 | 2.148 | 2.734 | 2.034 | 1.5685 |
| 13 | Other manufacturing products | 0.808 | 1.268 | 1.119 | 1.37 | 1.141 | 1.583 | 0.911 | 1.361 | 0.983 | 1.006 | 1.155 |
| 14 | Rubber products | 0.584 | 0.587 | 0.58 | 0.552 | 0.677 | 0.744 | 0.585 | 0.606 | 0.707 | 0.604 | 0.6226 |
| 15 | Non-metallic mineral products | 0.591 | 0.75 | 0.678 | 0.617 | 0.7 | 0.858 | 0.734 | 0.787 | 0.812 | 0.706 | 0.7233 |
| 16 | Metal products | 0.818 | 0.998 | 0.833 | 0.801 | 0.77 | 2.137 | 1.262 | 1.79 | 2.648 | 1.522 | 1.3579 |
| 17 | Machinery | 0.711 | 0.952 | 0.63 | 0.804 | 0.919 | 2.15 | 1.184 | 1.373 | 2.757 | 1.832 | 1.3312 |
| 18 | Transport equipment | 0.893 | 0.744 | 0.538 | 0.702 | 0.809 | 1.177 | 0.765 | 0.853 | 1.627 | 0.94 | 0.9048 |
| 19 | Other manufacturing products | 0.593 | 0.798 | 0.594 | 0.816 | 0.722 | 1.108 | 0.783 | 0.893 | 1.367 | 1.052 | 0.8726 |
| 20 | Electricith, gas, and water supply | 0.737 | 0.908 | 1.072 | 0.629 | 1.09 | 1.778 | 0.67 | 0.995 | 1.224 | 1.001 | 1.0104 |
| 21 | Construction | 0.674 | 0.633 | 0.609 | 2.481 | 0.529 | 0.639 | 0.727 | 0.617 | 0.786 | 0.688 | 0.8383 |
| 22 | Trade and transport | 1.935 | 1.727 | 1.4 | 3.042 | 1.949 | 2.329 | 1.589 | 1.311 | 3.125 | 2.882 | 2.1289 |
| 23 | Services | 1.434 | 1.724 | 1.744 | 0.644 | 1.719 | 2.259 | 2.827 | 2.776 | 4.159 | 4.625 | 2.3911 |
| 24 | Public administration | 0.525 | 0.562 | 0.517 | 0.875 | 0.517 | 0.517 | 0.517 | 0.517 | 0.526 | 0.517 | 0.559 |
| Indonesia | Malaysia | Philippines | Singapore | Thailand | China | Taiwan | Republic of Korea | Japan | U.S. | The Average | ||
|---|---|---|---|---|---|---|---|---|---|---|---|---|
| 1 | Paddy | 0.644 | 0.948 | 0.647 | 0.517 | 0.73 | 0.977 | 0.961 | 0.678 | 0.85 | 0.517 | 0.7469 |
| 2 | Other agricultural products | 0.678 | 0.765 | 0.693 | 1.142 | 0.768 | 0.957 | 0.863 | 0.784 | 0.844 | 0.975 | 0.8469 |
| 3 | Livestock and poultry | 0.959 | 1.411 | 0.882 | 1.142 | 1.087 | 1.086 | 1.403 | 1.318 | 1.254 | 1.399 | 1.1941 |
| 4 | Forestry | 0.677 | 0.729 | 0.681 | 0.517 | 0.662 | 0.833 | 0.956 | 0.704 | 0.785 | 0.968 | 0.7512 |
| 5 | Fishery | 0.699 | 0.933 | 0.73 | 1.134 | 0.889 | 0.994 | 0.846 | 0.91 | 0.907 | 0.91 | 0.8952 |
| 6 | Crude petroleum and natural gas | 0.637 | 0.694 | 0.761 | 0.517 | 0.753 | 0.904 | 0.634 | 0.517 | 0.851 | 0.822 | 0.709 |
| 7 | Other mining | 0.707 | 0.897 | 0.811 | 1.062 | 0.802 | 1.165 | 0.779 | 0.829 | 1.044 | 0.934 | 0.903 |
| 8 | Food, beverage and tobacco | 1.019 | 1.282 | 1.017 | 1.197 | 1.112 | 1.235 | 1.29 | 1.197 | 1.073 | 1.184 | 1.1606 |
| 9 | Textile, leather, and the products thereof | 1.07 | 1.217 | 1.013 | 1.093 | 1.168 | 1.426 | 1.278 | 1.226 | 1.123 | 1.124 | 1.1738 |
| 10 | Timber and wooden products | 1.019 | 1.093 | 0.98 | 1.19 | 0.905 | 1.411 | 0.936 | 1.113 | 1.075 | 1.09 | 1.0812 |
| 11 | Pulp, paper and printing | 0.934 | 1.12 | 0.943 | 1.023 | 0.986 | 1.277 | 1.031 | 1.215 | 1.068 | 1.001 | 1.0598 |
| 12 | Petroleum and petrol products | 0.944 | 1.234 | 1.067 | 1.053 | 1.067 | 1.402 | 1.15 | 1.199 | 1.139 | 1.053 | 1.1308 |
| 13 | Other manufacturing products | 0.777 | 0.997 | 0.681 | 0.732 | 0.651 | 1.12 | 0.637 | 0.668 | 0.66 | 1.076 | 0.7999 |
| 14 | Rubber products | 0.987 | 1.116 | 1.078 | 1.155 | 1.114 | 1.415 | 1.096 | 1.132 | 1.123 | 1.048 | 1.1264 |
| 15 | Non-metallic mineral products | 0.942 | 1.106 | 1.107 | 1.118 | 0.997 | 1.368 | 0.987 | 1.105 | 1.04 | 0.973 | 1.0743 |
| 16 | Metal products | 1.033 | 1.177 | 1.114 | 1.241 | 0.97 | 1.477 | 1.153 | 1.268 | 1.149 | 1.069 | 1.1651 |
| 17 | Machinery | 1.041 | 1.263 | 1.134 | 1.257 | 1.2 | 1.45 | 1.256 | 1.21 | 1.168 | 1.016 | 1.1995 |
| 18 | Transport equipment | 1.003 | 1.147 | 1.193 | 1.22 | 1.151 | 1.539 | 1.161 | 1.375 | 1.398 | 1.128 | 1.2315 |
| 19 | Other manufacturing products | 1.048 | 1.105 | 1.004 | 1.107 | 1.062 | 1.435 | 1.203 | 1.26 | 1.155 | 1.003 | 1.1382 |
| 20 | Electricity, gas, and water supply | 1.009 | 0.838 | 1.008 | 0.947 | 0.91 | 1.206 | 0.54 | 0.837 | 0.882 | 0.952 | 0.9129 |
| 21 | Construction | 1.019 | 1.139 | 0.874 | 1.116 | 1.093 | 1.434 | 1.115 | 1.093 | 1.035 | 1.032 | 1.095 |
| 22 | Trade and transport | 0.829 | 0.796 | 0.832 | 0.93 | 0.8 | 1.137 | 0.711 | 0.81 | 0.799 | 0.843 | 0.8487 |
| 23 | Services | 0.838 | 0.816 | 0.791 | 0.938 | 0.878 | 1.107 | 0.724 | 0.836 | 0.811 | 0.824 | 0.8563 |
| 24 | Public administration | 0.794 | 0.956 | 0.743 | 0.977 | 1.092 | 1.154 | 0.75 | 0.792 | 0.778 | 0.837 | 0.8873 |
| 1929 | 1930 | 1931 | 1932 | 1933 | 1934 | 1935 | 1936 | Annual Growth Rate | |
|---|---|---|---|---|---|---|---|---|---|
| Soshigayaohkura | 127,891 | 269,697 | 262,949 | 277,395 | 287,696 | 369,794 | 382,038 | 428,550 | 18.8 |
| Seijyogakuen | 293,413 | 661,705 | 600,200 | 698,814 | 714,946 | 681,274 | 716,197 | 754,806 | 14.4 |
| Kitami | 46,948 | 138,449 | 85,659 | 72,098 | 69,599 | 71,458 | 77,583 | 89,260 | 9.6 |
| Shimokitazawa | 417,052 | 919,068 | 1,013,315 | 1,073,424 | 1,049,095 | 837,628 | 919,614 | 1,002,019 | 13.3 |
| Keido | 232,470 | 516,942 | 577,500 | 615,558 | 674,186 | 717,929 | 877,786 | 993,010 | 23.0 |
| Total | 1,117,774 | 2,505,861 | 2,539,623 | 2,737,289 | 2,795,522 | 2,678,083 | 2,973,218 | 3,267,645 | 16.5 |
| Segment 1 | Segment 2 | p-Value | F-Value | Lag | Time | |
|---|---|---|---|---|---|---|
| Saitama Prefecture | Years | Minutes | ||||
| Misato City | 1. the number of “railroad users” | the number of population of Misato City | 0.0267 * | 5.5729 | 1 | 20 |
| 2. the number of population of Misato City | the number of “railroad users” | 1.31 × 10⁻⁶ *** | 40.852 | 1 | ||
| 3. the number of population of (i) Tsukuba City | the number of population of Misato City | 0.002257 ** | 8.8762 | 3 | ||
| Yashio City | 4. the number of population of Yashio City | the number of “railroad users” | 6.33 × 10⁻⁶ *** | 33.057 | 1 | 17 |
| Chiba Prefecture | ||||||
| Nagareyama City | 5. the number of “railroad users” | the number of population of Nagareyama City | 0.0001999 *** | 38.843 | 4 | 25 |
| 6. the number of population of Nagareyama City | the number of “railroad users” | 1.75 × 10⁻⁷ *** | 52.478 | 1 | ||
| Kashiwa City | 7. the number of population of Kashiwa City | the number of “railroad users” | 3.24 × 10⁻⁶ *** | 36.25 | 1 | 36 |
| Ibaraki Prefecture | ||||||
| Tsukubamirai City | 8. the number of “railroad users” | the number of population of (ii) Tsukubamirai City | 0.001807 ** | 9.1563 | 2 | 40 |
| 9. the number of population of Tsukubamirai City | the number of “railroad users” | 6.47 × 10⁻⁸ *** | 58.96 | 1 | ||
| Moriya City | 10. the number of “railroad users” | the number of population of (iii) Moriya City | 0.02679 * | 4.4557 | 2 | 32 |
| 11. the number of population of Moriya City | the number of “railroad users” | 6.55 × 10⁻⁶ *** | 32.899 | 2 | ||
| (i) Tsukuba City | 12. the number of population of Tsukuba City | the number of “railroad users” | 4.13 × 10⁻⁷ *** | 47.265 | 1 | 45 |
| Agglomeration of population of (i) Tsukuba City, (ii) Tsukubamira City and (iii) Moriya City | ||||||
| Segment 1 | Segment 2 (Agglomeration of Tsukuba Science City) | p-value | F-value | Lag | From Tokyo | |
| Ibaraki Prefecture | Years | Minutes | ||||
| (i) Tsukubamirai City | 13. the number of population of Tsukuba City (i) | the number of population of (ii) Tsukubamirai City | 0.01584 * | 5.2647 | 2 | 40 |
| (ii) Moriya City | 14. the number of population of Tsukuba City (i) | the number of population of (iii) Moriya City | 0.0589 | 3.3259 | 2 | 32 |
| Chiba Prefecture | ||||||
| Nagareyama City | 15. the number of population of Nagareyama | the number of population of (i) Tsukuba City | 0.003031 ** | 8.2388 | 3 | 25 |
| Kashiwa City | 16. the number of population of Kashiwa | the number of population of (i) Tsukuba City | 0.02323 * | 6.4298 | 4 | 36 |
| Saitama Prefecture | ||||||
| Yashio City | 17. the number of population of Yashio | the number of population of (i) Tsukuba City | 0.007985 ** | 10.012 | 4 | 17 |
| Misato City | 18. the number of population of Misato City | the number of population of (i) Tsukuba City | 0.01004 ** | 9.134 | 4 | 20 |
| # | Direction (X → Y) | Lags | With Granger Causality (p < 0.05) Interpretation |
|---|---|---|---|
| 1 | ex.va → ex.mm | lags 1–3 | Moderate causality at short lags |
| 2 | ex.mm → ex.va | lag 1 only | Very strong short-term causality |
| 3 | ex.pt → ex.mm | lags 1–3 | Strong consistent causality |
| 4 | ex.py → ex.va | lags 1–2 | Strong short-term causality |
| 5 | ex.va → ex.pn | lags 3–4 | Causality appears only at higher lags |
| 6 | ex.pn → ex.va | lags 1, 3 | Strong but irregular pattern |
| 7 | ex.pk → ex.va | lag 1 only | Strong short-term effect |
| 8 | ex.va → ex.pf | lags 2, 4 | Evidence of delayed causality |
| 9 | ex.pf → ex.va | lags 1, 3 | Strong at lag 1, weaker later |
| 10 | ex.va → ex.pm | lag 2 only | Weak evidence |
| 11 | ex.pm → ex.va | lag 1 only | Strong short-term causality |
| 12 | ex.pt → ex.va | lags 1, 3 | Strong short-term, possible mid-term effect |
| 13 | ex.pt → ex.pf | lag 2 only | Weak evidence |
| 14 | ex.pt → ex.pm | No lags < 0.05 | No causality |
| 15 | ex.pn → ex.pt | lags 2–4 | Strong delayed causality |
| 16 | ex.pk → ex.pt | lag 4 only | Weak and delayed effect |
| 17 | ex.py → ex.pt | lag 4 only | Delayed causality only |
| 18 | ex.mm → ex.pt | lag 4 only | Only very delayed causality |
| (i) Spatial economics: Fujita and Krugman | (i) Master switch | (i) Lower transport costs |
| (ii) Input output table: Forward linkage effect | (ii) Accelerator | (ii) Service sector |
| Function in Sequencing economics | (i) Master switch | (i) Railroad |
| (ii) Accelerator | (ii) Cultural activities | |
| Transit-Oriented Development (TOD) | Cases: Hankyu Railway of Japan | Railroad-Driven Agglomeration (RDA) |
| Agglomeration (RDA) | (i) Master switch | (i) Tsukuba Express |
| Finding: Tsukuba Science City | (ii) Accelerator | (ii) Research and education |
Disclaimer/Publisher’s Note: The statements, opinions and data contained in all publications are solely those of the individual author(s) and contributor(s) and not of MDPI and/or the editor(s). MDPI and/or the editor(s) disclaim responsibility for any injury to people or property resulting from any ideas, methods, instructions or products referred to in the content. |
© 2025 by the author. Licensee MDPI, Basel, Switzerland. This article is an open access article distributed under the terms and conditions of the Creative Commons Attribution (CC BY) license (https://creativecommons.org/licenses/by/4.0/).
Share and Cite
Kuchiki, A. The Role of Sequencing Economics in Agglomeration: A Contrast with Tinbergen’s Rule. Economies 2025, 13, 204. https://doi.org/10.3390/economies13070204
Kuchiki A. The Role of Sequencing Economics in Agglomeration: A Contrast with Tinbergen’s Rule. Economies. 2025; 13(7):204. https://doi.org/10.3390/economies13070204
Chicago/Turabian StyleKuchiki, Akifumi. 2025. "The Role of Sequencing Economics in Agglomeration: A Contrast with Tinbergen’s Rule" Economies 13, no. 7: 204. https://doi.org/10.3390/economies13070204
APA StyleKuchiki, A. (2025). The Role of Sequencing Economics in Agglomeration: A Contrast with Tinbergen’s Rule. Economies, 13(7), 204. https://doi.org/10.3390/economies13070204