Abstract
Promoting urban energy transition is essential for achieving environmental sustainability, yet how to effectively guide this process through public policy remains a key research question. This study aims to evaluate the effectiveness of government policy in facilitating urban energy transition, with a specific focus on China’s National New Energy Demonstration City Construction (NEDC) Policy. Using a difference-in-differences model with panel data from 274 Chinese cities, the empirical results indicate that the NEDC policy significantly advances urban energy transition, resulting in a notable increase of 0.571 units in the Urban Energy Transition Index and an improvement of 0.0321 units in the Urban Energy Transition Efficiency Index. Mechanism analysis further reveals that the NEDC policy promotes urban energy transition primarily by advancing financial development, strengthening environmental regulations, and encouraging capital-biased technological progress. Heterogeneity analysis indicates that the NEDC policy significantly boosts urban energy transition in resource-based cities, whereas it exerts a suppressive effect on urban energy transition in non-resource-based cities. This study offers valuable policy implications for developing countries seeking sustainable urban transformation.
1. Introduction
Understanding how public policy can effectively promote urban energy transition is a critical research aim in the context of achieving global environmental sustainability. The urgency of environmental sustainability has prompted nations worldwide to explore new urban development models that balance economic growth and ecological preservation. China’s systematic practices in eco-city transformation have emerged as a representative case study in the exploration of new urban paradigms (Islam, 2024; Y. Wu & Zhang, 2024; Dai, 2025). To address environmental pressures from rapid urbanization and industrial expansion, the Chinese government implemented the New Energy Demonstration Cities Construction (NEDC) policy in 2014, aiming to increase the proportion of renewable energy consumption in designated pilot cities (Jiao et al., 2024; J. Zhang et al., 2020). However, there is still a lack of empirical research examining the impact of similar policies on urban energy transition. Therefore, this study seeks to address this gap by systematically evaluating the effectiveness and underlying mechanisms of the NEDC policy in promoting urban energy transition, thereby providing valuable policy insights for developing countries pursuing sustainable urban transformation. As the largest developing country, China’s experience offers a distinctive case, and although the empirical analysis is grounded in the Chinese context, the core mechanisms and policy rationale—such as differentiated governance strategies and institutional innovation—may serve as useful insight for other developing countries confronting similar challenges in their urban energy transitions.
Some studies indicate that Chinese urban areas accounted for approximately 85% of national carbon emissions (Z. Liu et al., 2022), making urban transformation outcomes critical determinants for achieving China’s national dual carbon goals. Existing studies indicate that the influential factors of urban energy utilization mainly include financial development levels (Irfan et al., 2023), energy prices (Geng et al., 2021), technological innovation (Marcantonini & Ellerman, 2015), government incentives (Shahbaz et al., 2022), and industrial structures (Zhao et al., 2023). The urban energy transition policy incentive essentially represents a paradigmatic innovation that integrates ecological values into economic growth systems (Dai et al., 2025; Xu et al., 2024). Empirical findings also show that the NEDC program has significantly improved environmental performance (Shao et al., 2024) and accelerated ecological transitions (J. Wu et al., 2018; Q. Zhang et al., 2022) in pilot cities through policy-guided technological innovation and industrial upgrading. Additionally, prior research tends to focus on the theoretical and domestic dimensions of urban energy policy impacts, with limited attention given to potential cross-border effects, such as technology spillovers and international cooperation. Therefore, this study seeks to address these contradictions by conducting a comprehensive and systematic analysis of the NEDC policy’s impact on urban energy transitions in China. In particular, it aims to clarify the mechanisms driving energy transition, thereby contributing to a more nuanced understanding of urban transformation under dual carbon constraints.
Using a quasi-natural experiment design based on China’s 2014 NEDC policy implementation, this study employs panel data from 274 Chinese prefecture-level cities (2011–2018) to examine policy impacts and mechanisms via a difference-in-differences (DID) model. Findings reveal that the NEDC policy increased energy structure transformation by 0.57 units and energy efficiency transformation by 0.03 units in pilot cities compared to non-pilot counterparts. Results remain robust after adjusting cluster-robust standard errors, adding time/city fixed effects, and some further robustness checks using staggered policy timing, alternative treatment variables, and placebo analysis confirm estimation reliability. Mechanism analysis identifies three impact pathways: promoting financial development, strengthening environmental regulations, and stimulating capital-biased technological progress. This study enhances the understanding of urban energy transition policies in emerging economies.
This study makes three key contributions to the existing literature. First, it addresses an important research gap by empirically examining the effectiveness of China’s public policy (New Energy Demonstration City Policy) in driving urban energy transition—a policy area that has received limited attention in prior studies. While much of the existing literature has focused on the national level, the specific impacts of city-level demonstration policies on energy transition remain underexplored. By focusing on the NEDC policy initiative, this study enriches the field of energy economics with fresh empirical evidence on how place-based policies can reshape urban energy systems. Second, this study advances the understanding of the mechanisms underlying policy-driven urban energy transitions. Specifically, it identifies three critical channels—financial development, environmental regulation, and capital-biased technological progress—through which the NEDC policy facilitates urban energy transition. This mechanism analysis provides valuable insights for designing differentiated and targeted policy interventions in future sustainable urban development strategies. Third, this research employs a multi-period difference-in-differences (DID) methodology to rigorously identify the causal effect of the NEDC policy on urban energy transition outcomes, effectively addressing potential endogeneity and selection bias issues that may have undermined the validity of earlier studies. The adoption of this robust empirical strategy enhances the credibility of the findings and supports the formulation of evidence-based policy recommendations for developing countries aiming to implement similar eco-city initiatives.
2. Theoretical Analysis and Research Hypotheses
As a core policy within the institutional innovation framework of the new energy governance paradigm, China’s National New Energy Demonstration City Construction (NEDC) policy distinguishes itself through its vertical integration mechanism of “goal anchoring-technological adaptation-scenario development”. Unlike traditional one-way energy planning models, the NEDC policy employs an urban-subjective development logic, linking innovative energy demand-side management tools (e.g., green electricity trading mechanisms) with supply-side structural reforms to form multi-scale nested sustainable energy ecosystems.
Building on this foundation, the NEDC policy functions as a systematic strategy to accelerate the transition from fossil fuel-based to sustainable energy systems. Prior studies show that the policy reduces enterprise energy intensity via technological innovation and tax incentives (X. Liu et al., 2023). For instance, Chen et al. (2023) finds that NEDC directly drives energy structural transformation by boosting renewable energy use, while efficiency gains are indirect results of technological progress. Q. Zhang et al. (2022) confirms this dual transition enhances urban energy carbon performance (ECP). J. Yang et al. (2024) demonstrate that government guidance combined with green technological innovation under NEDC yields systematic improvements in both energy structure and efficiency. Collectively, these findings suggest that NEDC’s composite approach leverages both direct promotion of new energy development and indirect facilitation of technological progress.
Based on the theoretical analysis above, we propose the following:
Hypothesis 1:
The NEDC policy exerts positive effects on urban energy transition.
Financial development plays a pivotal role in this process by enabling efficient capital allocation to green industries, reducing financing costs and risks associated with renewable projects. At the firm level, improved financial accessibility helps overcome funding constraints, accelerating green investments (He et al., 2021). The growth of green financial instruments, such as sustainability-linked bonds, further supports capital-intensive clean energy projects. Macroeconomically, financial development strengthens fiscal and regulatory frameworks, enabling targeted subsidies, tax incentives, and public investment in green infrastructure. Financial liberalization and emerging green finance markets, including carbon trading and ESG-based strategies, create an enabling environment aligning financial decisions with sustainability goals (C. Li et al., 2022). These mechanisms integrate closely with the NEDC policy’s financial incentives to drive urban energy transition.
Based on the theoretical analysis above, we propose the following:
Hypothesis 2:
NEDC policy promotes urban energy transition by promoting financial development.
Beyond financial development, fiscal resources and environmental regulations are also vital facilitators of energy transition. A stable fiscal revenue base provides necessary funding for renewable energy innovation and enables governments to strengthen environmental oversight (Hou et al., 2024). The NEDC policy leverages fiscal subsidies and tax incentives to build a regulatory framework that encourages clean energy adoption. Unlike financial development, which mainly influences energy transition via capital allocation and investment efficiency, environmental regulations operate through enforcement and institutional constraints that shape corporate and consumer behavior toward sustainability. These regulations promote energy transition through multiple pathways: imposing compliance costs on polluting industries to drive greener production; incentivizing R&D in renewable technologies to accelerate innovation; and employing market-based instruments like carbon pricing and emission trading to shift energy consumption patterns.
The effectiveness of these regulations is enhanced by financial development, which supplies the capital firms need to comply and invest in low-carbon technologies. This interplay aligns with previous findings emphasizing the role of innovative financial instruments in renewable energy growth (Song et al., 2023), the positive effects of financial openness on structural energy transformation (Jia et al., 2024), and the influence of green finance on consumption and pollution reduction (C. Li et al., 2022).
Based on the theoretical analysis above, we propose the following:
Hypothesis 3:
NEDC policy promotes urban energy transition by strengthening environmental regulations.
Technological progress, especially capital-biased technological progress (IBTE), is a core driver of energy structural transformation (Hassan et al., 2022; Weber & Domazlicky, 1999). Under the NEDC policy, binding renewable energy and carbon intensity targets phase out energy-intensive firms, redirecting capital to green innovation sectors. The policy’s combination of R&D subsidies and carbon market incentives creates a reinforcing innovation loop, enhancing capital-biased technological advances (Wang & Yi, 2021). City-type heterogeneity moderates this effect: resource-based cities, with established green regulatory frameworks and heavy capital stocks, experience stronger capital-biased progress due to supportive institutional and financial conditions (X. Zhang et al., 2022).
Based on the theoretical analysis above, we propose the following:
Hypothesis 4:
NEDC policy promotes urban energy transition by stimulating capital-biased technological progress.
3. Data and Method
3.1. Sample Selection and Data Sources
3.1.1. Dependent Variable
Urban energy transition, the dependent variable of this study, encompasses two dimensions: energy supply-side structural optimization and demand-side efficiency improvement (Fan & Yi, 2021). This study focuses on the dimension of energy structure transition (UET), while simultaneously examining the impact of policies on energy efficiency transition (CTFP).
For measuring UET, referring to the research framework of Shen et al. (2023), a two-dimensional assessment system is developed, incorporating energy system transition performance and energy transition readiness. The former measures the current state of the energy system, covering energy structure and environmental sustainability, while the latter reflects transition-driving factors, including economic foundation, capital investment, technological application, and talent reserves. In addition, to verify the internal consistency and reliability of the variable scale, this study calculates the Cronbach’s Alpha coefficient. This coefficient is used to assess the internal consistency among multiple indicators within a measurement tool, with values ranging from 0 to 1. Generally, a value of α > 0.7 is considered to indicate high reliability (Nunnally, 1978). In this study, the Cronbach’s Alpha coefficient for the UET variable exceeds 0.75 (Shen et al., 2023), demonstrating that the constructed measurement system has good consistency and stability in reflecting the core concept.
For energy efficiency evaluation, we innovatively introduce the carbon total factor productivity (CTFP) indicator. Rooted in the environmental production technology theory proposed by Färe et al. (1989, 1993), CTFP incorporates carbon emissions as a non-desirable output into the TFP calculation framework using the Shepherd distance function. Unlike traditional green total factor productivity (GTFP) that only considers pollutants, CTFP further distinguishes the heterogeneous impacts of energy input and carbon emissions through the following formula:
where Y represents regional GDP, L, K, and E denote labor, capital, and energy inputs, respectively, CO2 is the non-desirable output, and α, β, γ, δ are the output elasticity coefficients of corresponding factors. A higher CTFP value indicates higher comprehensive efficiency in achieving economic growth and carbon emission control under the same factor inputs.
3.1.2. Independent Variable
The core independent variable is China’s National New Energy Demonstration City (NEDC) policy, represented by the interaction term DIDit between the policy dummy variable and time dummy variable. This policy adopts a purposeful sampling strategy based on the 2014 NEDC list issued by the National Energy Administration, selecting 59 pilot cities as the treatment group (excluding remote areas like Tibet and Xinjiang). When establishing the NEDC, China set specific entry criteria for selected cities, requiring them to meet standards in economic, social, energy, and environmental development capacity. Pilot cities were also required to complete national and provincial targets for total pollutant emission reduction within the designated timeframe (X. Yang et al., 2021; X. Liu et al., 2023). The scientific rationale of this sampling design lies in the fact that the pilot cities were uniformly designated by the central government, which helps eliminate selection bias stemming from cities’ own energy characteristics (Jacobson et al., 1993). The control group, consisting of 215 non-pilot cities, was determined based on a dual matching principle: geographic proximity, to control for differences in climate conditions and energy infrastructure; and industrial structure similarity, to ensure the comparability of energy consumption characteristics. This sampling design aligns with the requirements of the DID model’s counterfactual framework and effectively isolates the net effect of policy intervention.
Ultimately, this approach forms a balanced panel dataset comprising 274 cities over the period 2011–2018. The policy implementation year is set as 2014, with the DIDit variable assigned a value of 1 for treatment group cities in years ≥2014, and 0 otherwise.
3.1.3. Mechanism Variables
The mechanism variables include financial development, environmental regulations, and capital-biased technological progress. Financial development (FDI) is measured using the inclusive finance index developed by G. Li et al. (2023), which comprehensively reflects financial accessibility and service efficiency through 12 indicators such as bank outlet density and mobile payment coverage. Environmental regulations (IPCI) follow the methodology provide by He et al. (2021) and Ye et al. (2021), calculated as the ratio of industrial pollution control investment to environmental protection investment. A higher IPCI value indicates greater fiscal investment intensity in pollution governance.
The measurement of capital-biased technological progress (IBTE) follows the methodology of Weber and Domazlicky (1999) and Färe et al. (1997). Based on the Malmquist input productivity index, total factor productivity (TFP) change is decomposed into overall technical efficiency change (OTEC) and technological progress (TECH). Technological progress is further decomposed into the product of output-biased technological progress (OBTE), input-biased technological progress (IBTE), and neutral technological progress (MATE). The IBTE coefficient is used to quantify the technology bias characteristics of capital factors. The calculation data is sourced from C. Li et al. (2022). The specific calculation equations are as follows:
3.1.4. Control Variables
In the selection and measurement of control variables, this study systematically incorporates some key variables that may influence urban energy transition (UET), with indicator construction strictly adhering to theoretical logic and measurement standards established in prior research. Industrial structure level (IND) is measured using the natural logarithm of secondary industry added value, effectively capturing the structural impact of energy-intensive sectors such as manufacturing and heavy industries on urban energy consumption. Economic development stage (XGDP) is characterized by the natural logarithm of per capita GDP, controlling for differential effects of urban economic scale and living standards on energy demand elasticity. Green technological innovation capacity (GTFP) is calculated as the natural logarithm of annual green patent counts (including utility and invention patents) plus one, a treatment that avoids zero-value bias while quantifying the marginal contribution of environmentally friendly technologies to energy system optimization. Technological R&D intensity (RD) is measured by the ratio of R&D expenditure to GDP. The selection of these control variables aligns with broad consensus in energy economics literature and corresponds to the theoretical framework positing three-dimensional impacts of industrial structure, economic foundation, and technological innovation on energy transition. Table 1 presents the definitions of the relevant variables.

Table 1.
Definition of Variables.
3.2. Model
Regarding empirical model construction, this study treats the 2014 New Energy Demonstration Cities (NEDC) policy implementation as a quasi-natural experiment. A difference-in-differences (DID) model is employed to estimate the net effects of policy intervention on urban energy structure transformation (UET) and energy efficiency enhancement (CTFP). Leveraging the list of policy pilots, cities are categorized into treatment groups (policy pilot cities) and control groups (non-pilot cities). The DID design offers significant methodological advantages: First, the exogenous nature of policy shocks substantially mitigates endogeneity caused by reverse causality, as local government selection of pilot cities typically follows central policy directives rather than inherent urban energy endowments. Second, the inclusion of two-way fixed effects can reduce estimation bias from omitted variables. The model specification, as shown in Equations (4) and (5), directly reflects the magnitude of energy transition improvement in treatment groups relative to control groups post-policy implementation through its interaction term coefficient.
and represent the dependent variables, which mean the urban energy transition and urban energy efficiency transition of city i in year t, respectively. is a strategic dummy variable, reflecting the implementation of NEDC policy in year t by city i, which is counted as 1 for implementation and 0 for non-implementation. For the control variables , including industrial level (IND), economic development level (XGDP), green innovation level (GTFP) and technology research and development level (RD); represents the fixed effect of cities, which is used to control the inherent characteristics of different cities; is a fixed effect of the years to control the influence of the macro environment over time; is an error term that covers random interference factors that are not considered by the model.
The data used in this study are sourced from the Urban Statistical Yearbooks of various Chinese cities and from relevant data manually collected by the authors from different cities. Table 2 presents the descriptive statistics of the variables. Table 3 presents the descriptive statistics for the treatment and control groups, before and after the implementation of the policy.
Table 2.
Descriptive statistics.
Table 3.
Descriptive Statistics: Treatment and Control Groups Before and After Policy Implementation.
4. Empirical Results and Analysis
4.1. Baseline Regression Results
In Table 4, the baseline regression results based on the difference-in-differences (DID) model reveal that China’s New Energy Demonstration City (NEDC) policy significantly promotes urban energy transition. Specifically, columns (1) and (2), where the Urban Energy Transition Index (UET) serves as the dependent variable, indicate that the implementation of the NEDC policy has led to an increase of 0.571 units in UET in the pilot cities, after controlling for other variables. The coefficient is statistically significant at the 5% level. Columns (3) and (4), which use the City-level Energy Transition Efficiency Index (CTFP) as the dependent variable, indicate that the NEDC policy led to a 0.0321-unit increase in CTFP, with the coefficient being statistically significant at the 5% level. All models control for both city-specific and year-specific fixed effects. These findings support Research Hypothesis 1, suggesting that the NEDC policy can promote urban energy transition.
Table 4.
Baseline regression results.
The empirical results demonstrate that the NEDC policy’s impact on energy structure transition is markedly stronger than its effect on energy efficiency transition. This disparity stems from the dual characteristics of policy implementation pathways and institutional design. On the one hand, the NEDC policy employs administrative mandates to directly intervene in energy infrastructure development—for instance, by enforcing quantifiable targets such as new photovoltaic installed capacity and charging station coverage in pilot cities. Such top-down rigid constraints enable rapid adjustments to energy consumption structures in the short term, generating immediate effects on UET. On the other hand, energy efficiency improvements rely on long-term dynamic processes including technological innovation diffusion, management process optimization, and human capital accumulation. The policy primarily influences these through indirect incentives like R&D subsidies and energy efficiency standards, whose effects exhibit significant time lags. Furthermore, the NEDC evaluation system exhibits imbalanced indicator weighting. For example, structural indicators such as “share of non-fossil energy consumption” account for 60% of the total weight in the New Energy Demonstration City Assessment Criteria, whereas efficiency indicators like “energy consumption per unit of GDP reduction rate” constitute only 20%. This institutional design incentivizes local governments to prioritize resource allocation for structural transition targets during policy implementation while adopting gradualist strategies for efficiency improvements, thereby amplifying the differential policy effects.
4.2. Robustness Test
4.2.1. Parallel Trend Test
When using the DID model to estimate causal effects, the validity of the parallel trend assumption is a crucial prerequisite for ensuring the accuracy of the estimation results. This assumption requires that in the absence of policy intervention, there should be no significant difference in the time trends of the energy transition indices between experimental city and control city. In other words, the two groups of cities should have exhibited similar development trajectories in terms of energy transition prior to the implementation of the policy. Only in this way can the DID model accurately isolate the net effect of the policy on urban energy transition.
To rigorously verify the parallel trend assumption and comprehensively explore the dynamic impact of the NEDC policy on urban energy transition, this study introduces the event-study analysis method (Jacobson et al., 1993). This method can clearly capture the differential changes between the treatment group and the control group at different time points before and after the policy implementation by constructing dynamic dummy variables. The core equation of the event-study analysis method is as follows:
is a dynamic dummy variable representing the time point of the NEDC policy. Its value is set as follows: negative values correspond to the years before the policy implementation, and positive values correspond to the years after the policy implementation. This study takes the year of policy occurrence as the base period and selects data from 2011 to 2018 for testing.
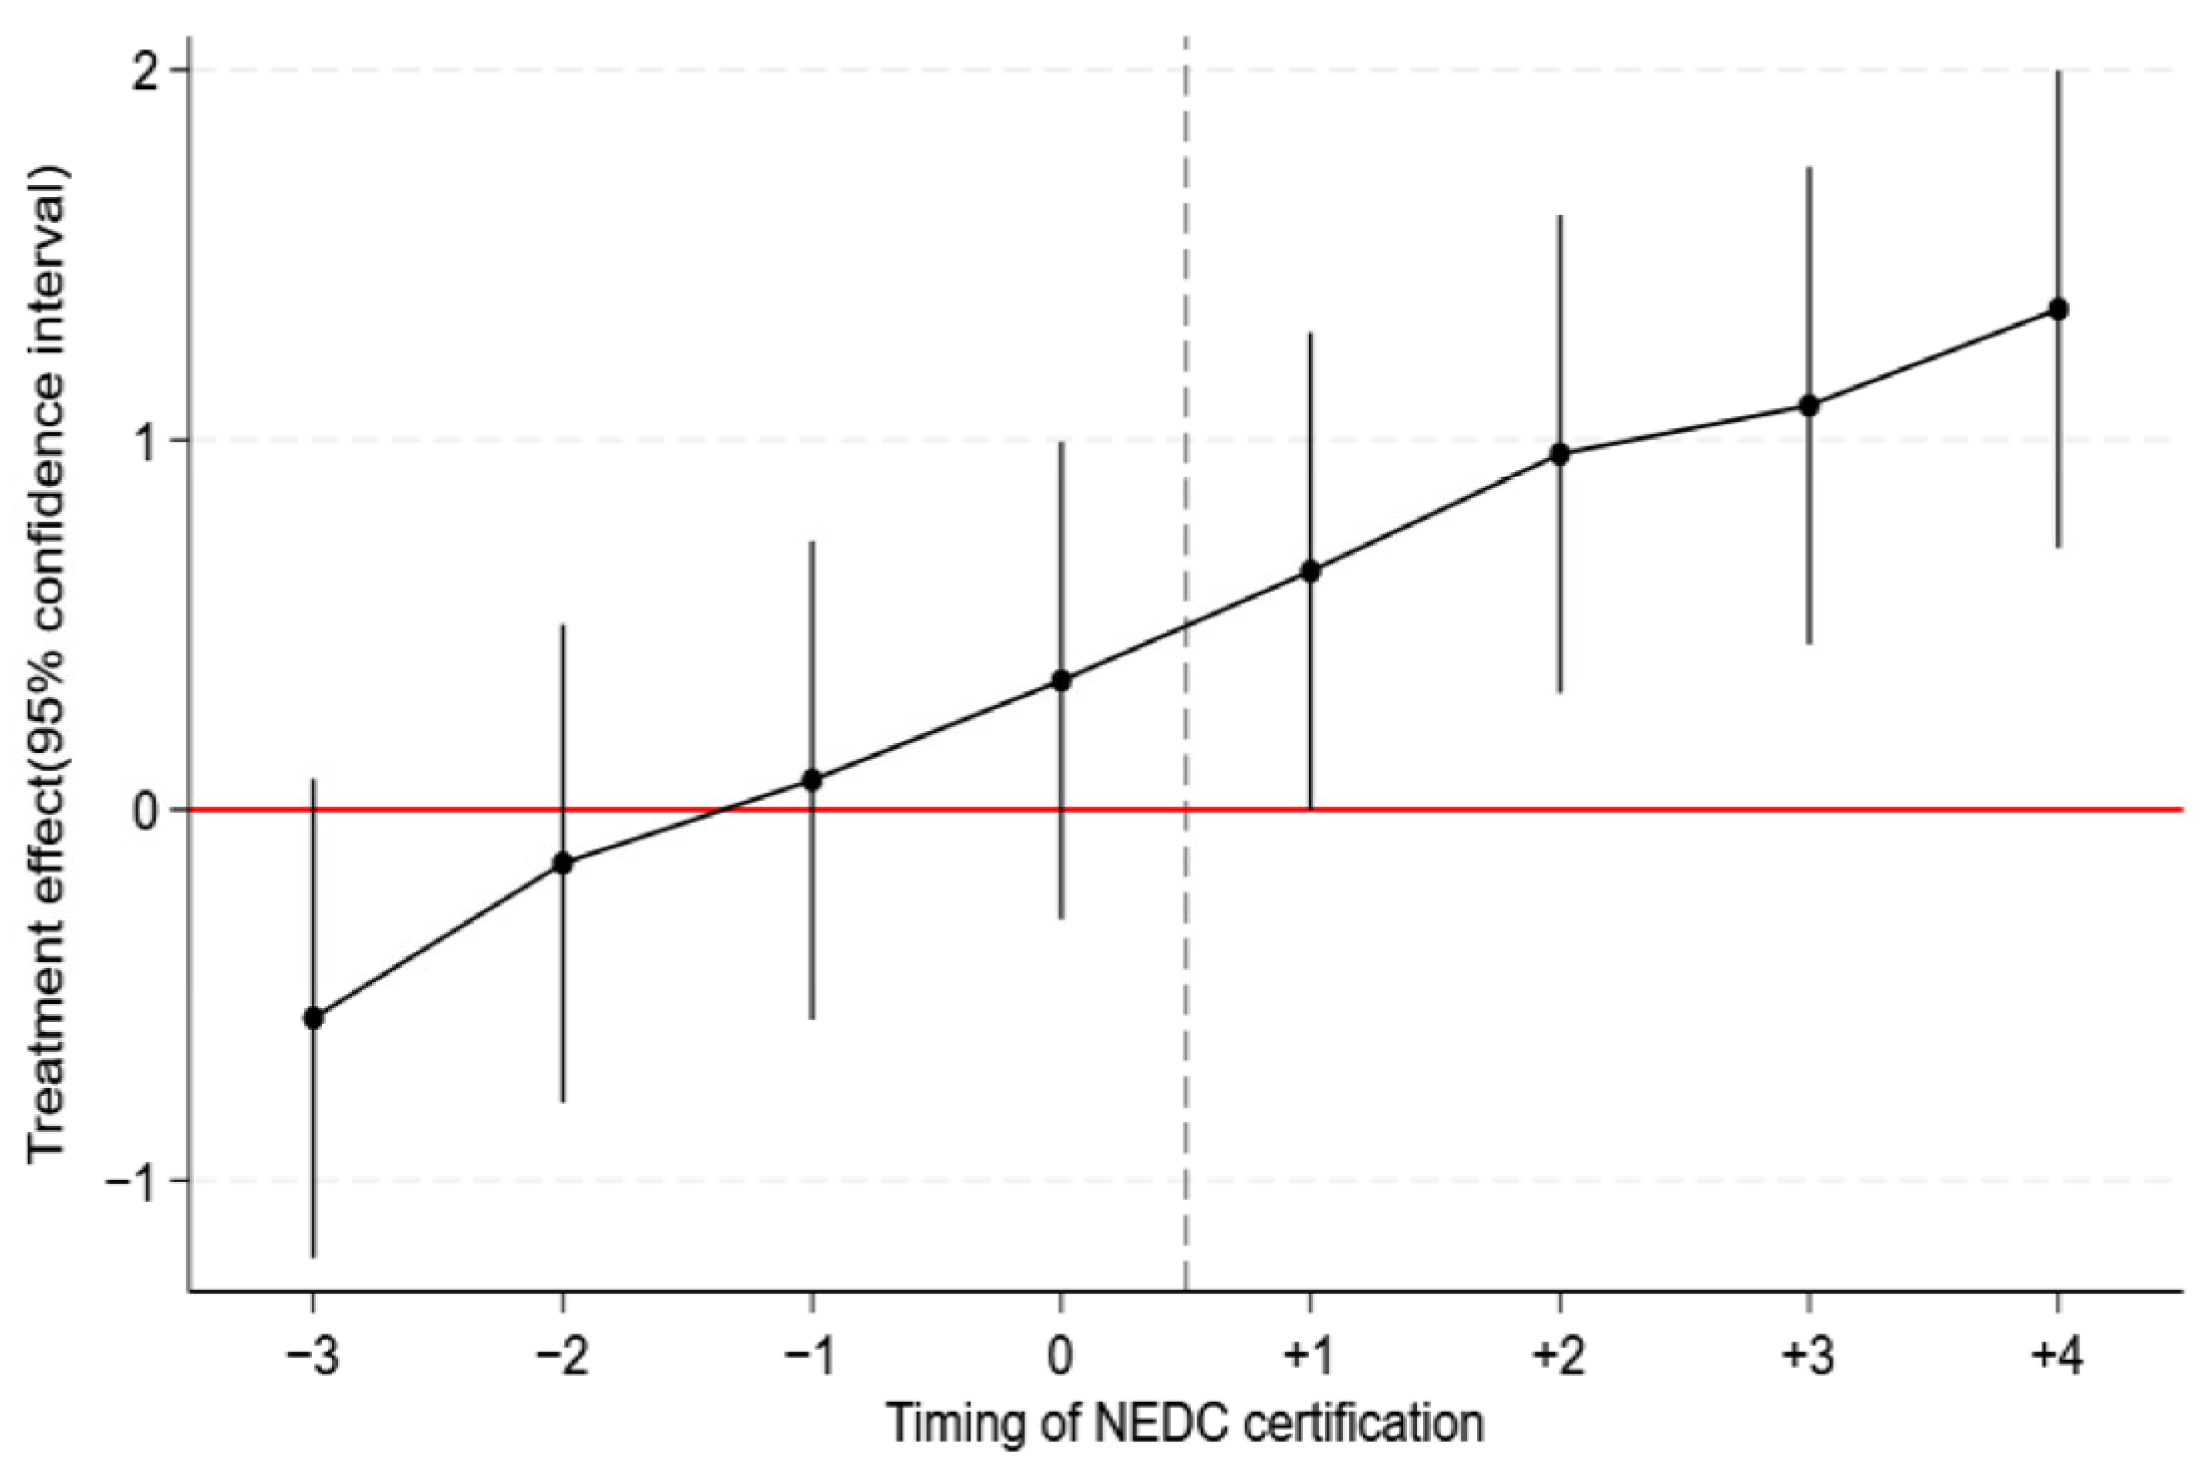
This study uses the event-study analysis framework to set dynamic treatment effect parameters. The parameter indicates the difference in urban energy transition (UET) between the treatment group and the control group before and after the implementation of the NEDC policy. The results of the parallel trend test are shown in the following figure. Within the 95% confidence interval, fails the significance test for the year of policy implementation and the years before. This result strongly proves that there is no significant difference in the energy transition trends between the pilot cities and non-pilot cities before the policy implementation, thus satisfying the parallel trend assumption.
The results of the event study analysis are shown in Figure 1. Before the implementation of the policy, the coefficients obtained from the analysis of the event study were not statistically significant, indicating that the hypothesis of the parallel trend was satisfied. Starting from the second year after the policy implementation, shows an upward trend, indicating that the impact of the NEDC policy on urban energy transition has a lag effect. This lag effect is consistent with the actual situation during the policy implementation process. In the first year of policy implementation, the energy transition policies are still in the stage of gradual promotion and implementation.
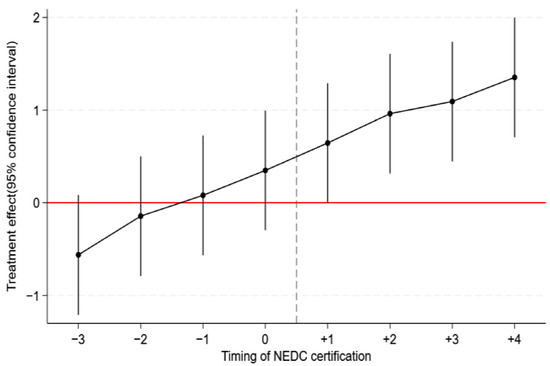
Figure 1.
Parallel trend test.
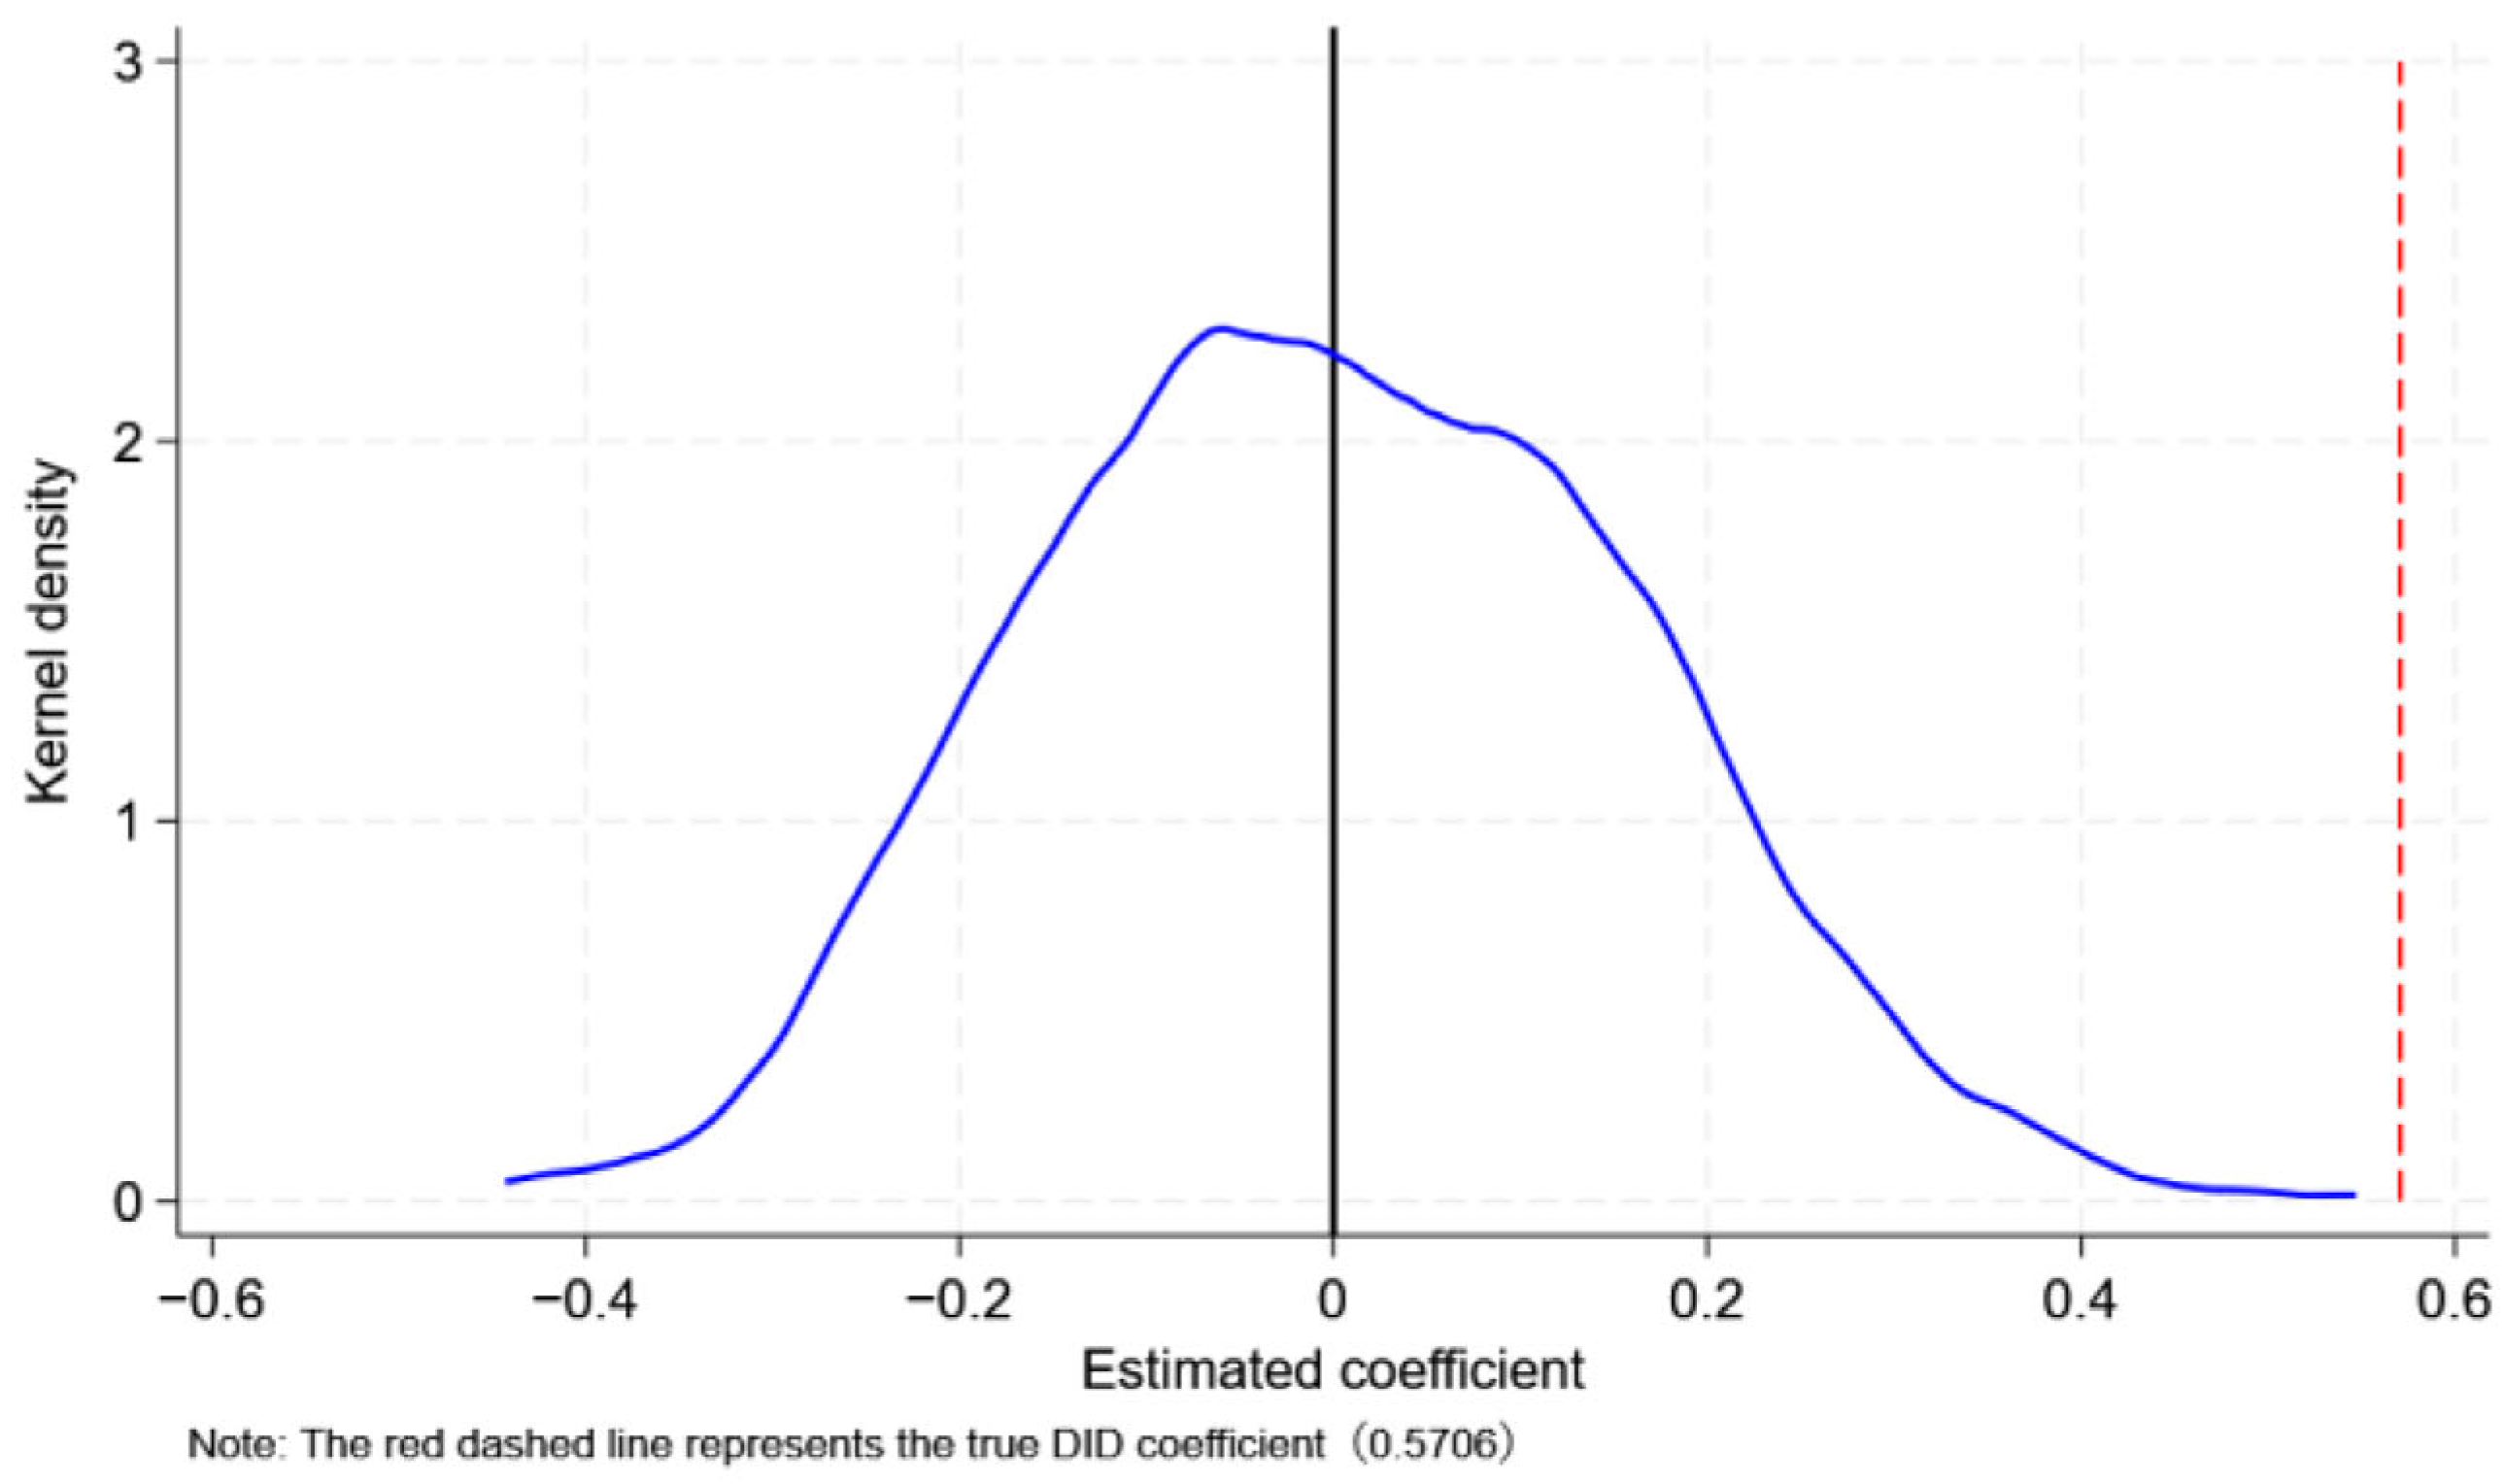
4.2.2. Placebo Test
As illustrated in Figure 2, the authentic DID coefficient exhibits statistically significant deviation from the simulated treatment effect distribution, clustering within the right-tail region. Empirical results demonstrate that 500 placebo test coefficients generated through randomized treatment variables follow a zero-centered normal distribution (confidence interval: [−0.2, 0.2]), whereas the genuine treatment effect coefficient (X) lies outside this interval with a corresponding p-value (p = 0.01) substantially below the 5% significance threshold. This chain of evidence suggests that the observed policy effects cannot be attributed to stochastic noise or unobserved confounding variables, thereby confirming the robustness of the core causal relationship. Further quantile analysis reveals that the absolute value of the genuine treatment effect coefficient exceeds the 99th percentile of simulated coefficients (X > Q0.99), reinforcing the causal interpretation of policy intervention through both statistical and economic significance dimensions. These findings complement the dynamic effect trajectories in parallel trend tests, jointly refuting competing hypotheses regarding pre-treatment systematic divergence between treatment and control groups.
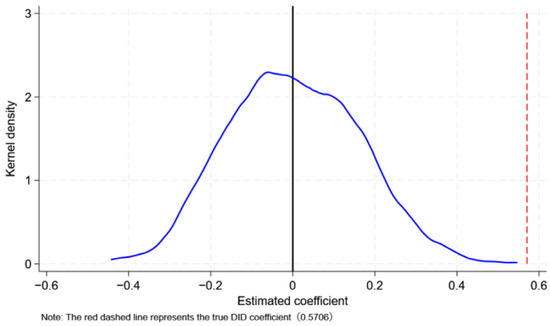
Figure 2.
Placebo test.
4.2.3. Further Tests
We conduct a robustness check by advancing the policy implementation time by two years, and the results are shown in Table 5. The regression results in columns (1)–(2) are based on the assumption that the policy was implemented two years earlier. These results are not statistically significant. This phenomenon implies that the policy implementation year was not randomly determined but was instead the result of reasonable planning and arrangement, in line with the actual logic of policy-making and implementation.
Table 5.
Robustness test.
Columns (3)–(4) present the regression results when the core policy is replaced by the Carbon Emission Trading Policy (CCT) as a form of policy interference. We find that the results of the NEDC policy remain stable under this interference and are consistent with those of the baseline regression. Moreover, after including control variables, the regression coefficients and the model’s goodness-of-fit (R2) are also highly consistent with the baseline results. This indicates that the core conclusions are not affected by interference from other policies.
Based on the above analysis, the regression results obtained from the previous analysis using the NEDC policy are highly robust and can reliably reflect the impact of the policy on variables related to urban energy transition.
4.3. Mechanism Analysis
4.3.1. Mechanism Test
Based on theoretical analysis and research hypotheses, this study proposes that the NEDC policy drives urban energy transition (UET) through three pathways: financial development (FDI), environmental regulations (IPCI), and capital-biased technological progress (IBTE). To validate these theoretical assumptions, Table 6 presents the results of mechanism tests.
Table 6.
Mechanism test results.
As shown in Table 6, Columns (1)–(2) show regression results for financial development under both controlled and uncontrolled variable conditions. Empirical findings indicate that coefficients of the explanatory variables are statistically significant and positive, demonstrating that the NEDC policy indeed exerts positive effects on urban energy transition through promoting financial development. These findings confirm the research Hypothesis 2.
As shown in Table 6, Columns (3)–(4) show regression results for environmental regulations under both controlled and uncontrolled variable conditions. Empirical findings indicate that coefficients of the explanatory variables are statistically significant and positive, demonstrating that the NEDC policy indeed exerts positive effects on urban energy transition through promoting environmental regulations. These findings confirm the research Hypothesis 3.
As shown in Table 6, Columns (5)–(6) show regression results for capital-biased technological progress under both controlled and uncontrolled variable conditions. Empirical findings indicate that coefficients of the explanatory variables are statistically significant and positive, demonstrating that the NEDC policy indeed exerts positive effects on urban energy transition through promoting capital-biased technological progress. These findings confirm the research Hypothesis 4.
4.3.2. Heterogeneity Analysis on IBTE
The regression analysis in Table 7 reveals heterogeneous effects of the NEDC policy on capital-biased technological enhancement (IBTE). Full-sample results in Table 6 demonstrate that NEDC implementation significantly increased the IBTE, indicating the policy drives urban energy transition through capital-intensive technological pathways. However, the impact coefficient of the NEDC policy on capital-biased technological progress (IBTE) is relatively small. This result can be attributed to differences among cities in terms of capital-labor factor allocation, the difficulty of achieving emission reduction targets, and the scale of emission reduction infrastructure construction. To further analyze this mechanism, cities are categorized into resource-based and non-resource-based cities for regression analysis, following the classification method outlined in the State Council document (China’ Guo Fa [2013] No. 45).
Table 7.
Heterogeneity analysis on IBTE.
The regression results, as shown in Table 7, indicate that the coefficient for resource-based cities is significantly negative, while that for non-resource-based cities is significantly positive. Moreover, compared to the overall regression results, the absolute values of these coefficients are larger. These findings suggest that the NEDC policy significantly enhances IBTE in resource-based cities, thereby facilitating urban energy transition. In contrast, the policy significantly suppresses IBTE in non-resource-based cities, which to some extent hinders their energy transition.
5. Conclusions and Policy Implications
The study systematically evaluates the impact effects and mechanisms of China’s National New Energy Demonstration City policy on urban energy transition through a difference-in-differences (DID) model. Empirical results demonstrate that the NEDC policy significantly enhances energy structure transformation and efficiency transition in pilot cities. Structural optimization effects exhibit immediate significance, while efficiency improvements follow a gradual trajectory. Mechanism analysis reveals three transmission pathways: enhancing financial development, strengthening environmental regulations, and promoting capital-biased technological progress. While the heterogeneity analysis indicates that the NEDC policy significantly boosts urban energy transition in resource-based cities, whereas it exerts a suppressive effect on urban energy transition in non-resource-based cities.
This research validates the theoretical logic of policy interventions reconstructing energy governance paradigms through institutional innovation, providing replicable empirical evidence for developing countries seeking sustainable urban transformation. By systematically assessing both the impact effects and transmission mechanisms of China’s National New Energy Demonstration City (NEDC) policy, the study offers a comprehensive understanding of how differentiated policy design, fiscal–financial synergy, and institutional innovation can jointly promote urban energy transition. These findings not only enrich the theoretical framework of energy governance reform but also provide practical guidance for other emerging economies in formulating context-specific and adaptive urban energy policies.
From a policy perspective, a differentiated framework based on “categorized guidance, dynamic adjustment, and system coordination” is recommended. For resource-based cities, governments should enhance fiscal–financial synergy mechanisms to support capital-intensive technological innovation, leveraging existing traditional energy infrastructure to drive clean technology iteration. In contrast, non-resource-based cities should focus on strengthening market-driven incentive mechanisms to optimize labor-capital allocation. Additionally, we propose reforming the current policy evaluation system, which tends to overemphasize structural indicators, by establishing long-term monitoring mechanisms to track efficiency transitions. To foster regional energy technology innovation, collaborative alliances should be developed through “technology spillover, institutional learning, and capacity co-construction” models. In terms of implementation, environmental regulation tools should be integrated with green financial product innovation, including the development of differentiated credit support systems based on carbon intensity grading. Furthermore, establishing intertemporal compensation mechanisms will be essential to ensure sustainable returns on new energy infrastructure investments. To further strengthen the sustainability policy narrative, such as improving lifecycle efficiency, promoting resource recycling and encouraging fuel reuse should be embedded into urban energy transition strategies. These measures can enhance overall resource utilization efficiency, reduce environmental burdens, and foster long-term economic and ecological benefits, aligning the NEDC policy with broader sustainable development goals. From an international perspective, other developing countries can learn from China’s NEDC policy by tailoring similar integrated policy frameworks that combine financial innovation with robust environmental regulation. However, it is important to consider potential unintended consequences, such as exacerbation of energy access inequalities or the risk of technological path dependence that may limit flexibility in future transitions. Moreover, reflecting on equity issues is crucial, especially within the global North–South context, to ensure that energy transitions are inclusive and just, avoiding disproportionate burdens on vulnerable populations and promoting shared benefits across regions.
This study also has several limitations. First, it does not consider spatial spillover effects, which may arise from inter-city interactions in energy policy diffusion or infrastructure sharing. Future research could employ spatial econometric models to capture these externalities more accurately. Additionally, the analysis focuses mainly on economic and institutional mechanisms, overlooking the influence of social acceptance and behavioral responses. Incorporating survey-based methods or simulation models could help explore stakeholder dynamics more thoroughly. Second, due to data constraints, the study relies on aggregate city-level indicators, which may mask intra-city variation. Using firm-level or project-level data in future research could enhance the precision of causal inference. Furthermore, as the NEDC policy context is specific to China’s centralized governance model, cross-country comparative studies are encouraged to test the applicability of similar policies in different institutional environments.
Author Contributions
Conceptualization, J.L. and Y.Q.; methodology, Y.Q.; software, Y.Q.; validation, J.L., Y.Q. and S.L.; formal analysis, J.L.; investigation, J.L.; resources, Y.Q.; data curation, Y.Q.; writing—original draft preparation, J.L., Y.Q. and S.L.; writing—review and editing, J.L., Y.Q. and S.L.; visualization, J.L.; supervision, J.L.; project administration, J.L.; funding acquisition, S.L. All authors have read and agreed to the published version of the manuscript.
Funding
National Natural Science Foundation of China Project (Grant No. 72364014). Jiangxi Provincial Social Science Foundation Project (Grant No. 25JL06).
Institutional Review Board Statement
Not applicable.
Informed Consent Statement
Not applicable.
Data Availability Statement
The raw data supporting the conclusions of this article will be made available by the authors on request.
Conflicts of Interest
The authors declare no conflict of interest.
References
- Chen, B., Jin, F., Li, G., & Zhao, Y. (2023). Can the new energy demonstration city policy promote green and low-carbon development? Evidence from China. Sustainability, 15(11), 8727. [Google Scholar] [CrossRef]
- Dai, J. (2025). Is policy pilot a viable path to sustainable development? Attention allocation perspective. International Review of Financial Analysis, 98, 103923. [Google Scholar] [CrossRef]
- Dai, J., Mehmood, U., & Nassani, A. A. (2025). Empowering sustainability through energy efficiency, green innovations, and the sharing economy: Insights from G7 economies. Energy, 318, 134768. [Google Scholar] [CrossRef]
- Fan, Y., & Yi, B. (2021). Evolution, driving mechanism, and pathway of China’s energy transition. Journal of Management World, 37(8), 95–105. [Google Scholar]
- Färe, R., Grifell-Tatjé, E., Grosskopf, S., & Lovell, C. A. K. (1997). Biased technical change and the Malmquist productivity index. Scandinavian journal of Economics, 99(1), 119–127. [Google Scholar] [CrossRef]
- Färe, R., Grosskopf, S., & Kokkelenberg, E. C. (1989). Measuring plant capacity, utilization and technical change: A nonparametric approach. International Economic Review, 30, 655–666. [Google Scholar] [CrossRef]
- Färe, R., Grosskopf, S., Lovell, C. A. K., & Yaisawarng, S. (1993). Derivation of shadow prices for undesirable outputs: A distance function approach. The Review of Economics and Statistics, 75(2), 374–380. [Google Scholar] [CrossRef]
- Geng, J.-B., Liu, C., Ji, Q., & Zhang, D. (2021). Do oil price changes really matter for clean energy returns? Renewable and Sustainable Energy Reviews, 150, 111429. [Google Scholar] [CrossRef]
- Hassan, T., Song, H., Khan, Y., & Kirikkaleli, D. (2022). Energy efficiency a source of low carbon energy sources? Evidence from 16 high-income OECD economies. Energy, 243, 123063. [Google Scholar] [CrossRef]
- He, Y., Ding, X., & Yang, C. (2021). Do environmental regulations and financial constraints stimulate corporate technological innovation? Evidence from China. Journal of Asian Economics, 72, 101265. [Google Scholar] [CrossRef]
- Hou, Y., Yang, M., Ma, Y., & Zhang, H. (2024). Study on city’s energy transition: Evidence from the establishment of the new energy demonstration cities in China. Energy, 292, 130549. [Google Scholar] [CrossRef]
- Irfan, M., Rehman, M. A., Razzaq, A., & Hao, Y. (2023). What derives renewable energy transition in G-7 and E-7 countries? The role of financial development and mineral markets. Energy Economics, 121, 106661. [Google Scholar] [CrossRef]
- Islam, M. Z. (2024). Can China’s rural revitalisation policies be an example for other countries aligning with sustainable development goals (SDGs)-1, 2 and 12? China Agricultural Economic Review, 16(4), 763–786. [Google Scholar] [CrossRef]
- Jacobson, L. S., LaLonde, R. J., & Sullivan, D. G. (1993). Earnings losses of displaced workers. The American Economic Review, 83(4), 685–709. [Google Scholar]
- Jia, X., Xu, W., & Wang, K. (2024). Financial openness and energy structure transformation. Frontiers in Environmental Science, 11, 1346594. [Google Scholar] [CrossRef]
- Jiao, Y., Chen, Q., Wu, Y., Ji, C., Zhang, N., Luo, H., & Zhang, K. (2024). Designing new environmental policy instruments to promote the sustainable development of iron and steel production in China: A comparative analysis of cleaner production assessment indicator systems and the assessment principles of the green factory. Resources Policy, 96, 105244. [Google Scholar] [CrossRef]
- Li, C., Chen, Z., Wu, Y., Zuo, X., Jin, H., Xu, Y., Zeng, B., Zhao, G., & Wan, Y. (2022). Impact of green finance on China’s high-quality economic development, environmental pollution, and energy consumption. Frontiers in Environmental Science, 10, 1032586. [Google Scholar] [CrossRef]
- Li, G., Wu, H., Jiang, J., & Zong, Q. (2023). Digital finance and the low-carbon energy transition (LCET) from the perspective of capital-biased technical progress. Energy Economics, 120, 106623. [Google Scholar] [CrossRef]
- Liu, X., Wang, C., Wu, H., Yang, C., & Albitar, K. (2023). The impact of the new energy demonstration city construction on energy consumption intensity: Exploring the sustainable potential of China’s firms. Energy, 283, 128716. [Google Scholar] [CrossRef]
- Liu, Z., Deng, Z., He, G., Wang, H., Zhang, X., Lin, J., Qi, Y., & Liang, X. (2022). Challenges and opportunities for carbon neutrality in China. Nature Reviews Earth & Environment, 3(2), 141–155. [Google Scholar]
- Marcantonini, C., & Ellerman, A. D. (2015). The implicit carbon price of renewable energy incentives in Germany. The Energy Journal, 36(4), 205–240. [Google Scholar] [CrossRef]
- Nunnally, J. C. (1978). An overview of psychological measurement. In Clinical diagnosis of mental disorders: A handbook (pp. 97–146). Springer. [Google Scholar]
- Shahbaz, M., Wang, J., Dong, K., & Zhao, J. (2022). The impact of digital economy on energy transition across the globe: The mediating role of government governance. Renewable and Sustainable Energy Reviews, 166, 112620. [Google Scholar] [CrossRef]
- Shao, H., Tang, X., Xiao, X., Ma, Y., & Lin, Z. (2024). Can Smart city policies enhance corporate environmental performance? Evidence from China. Environment, Development and Sustainability, 1–32. [Google Scholar] [CrossRef]
- Shen, Y., Shi, X., Zhao, Z., Xu, J., Sun, Y., Liao, Z., Li, Y., & Shan, Y. (2023). A dataset of low-carbon energy transition index for Chinese cities 2003–2019. Scientific Data, 10(1), 906. [Google Scholar] [CrossRef]
- Song, M., Zheng, H., Shen, Z., & Chen, B. (2023). How financial technology affects energy transformation in China. Technological Forecasting and Social Change, 188, 122259. [Google Scholar] [CrossRef]
- Wang, Q., & Yi, H. (2021). New energy demonstration program and China’s urban green economic growth: Do regional characteristics make a difference? Energy Policy, 151, 112161. [Google Scholar] [CrossRef]
- Weber, W. L., & Domazlicky, B. R. (1999). Total factor productivity growth in manufacturing: A regional approach using linear programming. Regional Science and Urban Economics, 29(1), 105–122. [Google Scholar] [CrossRef]
- Wu, J., Zuidema, C., & Gugerell, K. (2018). Experimenting with decentralized energy governance in China: The case of New Energy Demonstration City program. Journal of Cleaner Production, 189, 830–838. [Google Scholar] [CrossRef]
- Wu, Y., & Zhang, Q. (2024). The confrontation and symbiosis of green and development: Coupling coordination analysis between carbon emissions and spatial development in urban agglomerations of China. Sustainable Cities and Society, 106, 105391. [Google Scholar] [CrossRef]
- Xu, R., Farooq, U., Alam, M. M., & Dai, J. (2024). How does cultural diversity determine green innovation? New empirical evidence from Asia region. Environmental Impact Assessment Review, 106, 107458. [Google Scholar] [CrossRef]
- Yang, J., Wang, J., Wang, W., & Wu, H. (2024). Exploring the path to promote energy revolution: Assessing the impact of new energy demonstration city construction on urban energy transition in China. Renewable Energy, 236, 121437. [Google Scholar] [CrossRef]
- Yang, X., Zhang, J., Ren, S., & Ran, Q. (2021). Can the new energy demonstration city policy reduce environmental pollution? Evidence from a quasi-natural experiment in China. Journal of Cleaner Production, 287, 125015. [Google Scholar] [CrossRef]
- Ye, F., Quan, Y., He, Y., & Lin, X. (2021). The impact of government preferences and environmental regulations on green development of China’s marine economy. Environmental Impact Assessment Review, 87, 106522. [Google Scholar] [CrossRef]
- Zhang, J., Kang, L., Li, H., Ballesteros-Pérez, P., Skitmore, M., & Zuo, J. (2020). The impact of environmental regulations on urban green innovation efficiency: The case of Xi’an. Sustainable Cities and Society, 57, 102123. [Google Scholar] [CrossRef]
- Zhang, Q., Huang, X., Xu, Y., Bhuiyan, M. A., & Liu, P. (2022). New energy demonstration city pilot and green energy consumption: Evidences from China. Energy Reports, 8, 7735–7750. [Google Scholar] [CrossRef]
- Zhang, X., Zhang, R., Zhao, M., Wang, Y., & Chen, X. (2022). Policy orientation, technological innovation and energy-carbon performance: An empirical study based on China’s new energy demonstration cities. Frontiers in Environmental Science, 10, 846742. [Google Scholar] [CrossRef]
- Zhao, S., He, X., & Faxritdinovna, K. U. (2023). Does industrial structure changes matter in renewable energy development? Mediating role of green finance development. Renewable Energy, 214, 350–358. [Google Scholar] [CrossRef]
Disclaimer/Publisher’s Note: The statements, opinions and data contained in all publications are solely those of the individual author(s) and contributor(s) and not of MDPI and/or the editor(s). MDPI and/or the editor(s) disclaim responsibility for any injury to people or property resulting from any ideas, methods, instructions or products referred to in the content. |
© 2025 by the authors. Licensee MDPI, Basel, Switzerland. This article is an open access article distributed under the terms and conditions of the Creative Commons Attribution (CC BY) license (https://creativecommons.org/licenses/by/4.0/).