Abstract
The global shift toward digital transformation presents both opportunities and challenges for national economies, particularly in terms of workforce readiness. While many studies assess digital readiness via infrastructure or technological adoption, fewer investigate the preparedness of countries’ future labor forces. This article addresses this research gap by examining how quality of education relates to job automation risk across OECD countries. The goal is to identify which nations are least prepared for digital disruption due to weak educational foundations and high automation exposure. Using data on education expenditure, PISA scores, and the Education Index, compared to the percentage of jobs at high risk of automation, this study applies correlational analysis and a quadrant overview to assess national readiness. Findings show that countries such as Slovakia, Poland, and Greece are least prepared, combining low investment in education and high exposure to automation. Conversely, nations like Finland, Norway, Sweden, and New Zealand exhibit strong readiness, characterized by robust education systems and lower automation risks. This study contributes to the literature by integrating automation vulnerability into national readiness assessments and offers actionable insights for policymakers focused on education reform and workforce development.
1. Introduction
Digital transformation—the widespread adoption of digital technologies—has emerged as a defining trend of the 21st century. It is fundamentally altering how individuals live and work, businesses operate, and how governments deliver services (Mikalef & Parmiggiani, 2022; Verhoef et al., 2021). The importance of studying countries’ readiness for digital transformation lies in the profound economic and social implications of this shift. Nations that effectively harness digitalization can achieve higher productivity, innovation, and competitiveness, whereas those that lag risk widening development gaps and losing out on growth opportunities. As digital tools become ubiquitous, countries must be prepared to integrate these tools into their industries. Understanding which countries are ready (and which are not) is critical for international development and policy making, as digital transformation is now closely linked to economic prosperity and social well-being (Corejova & Chinoracky, 2021; Arıkan Kargı, 2022; Cisco Systems, 2019; OECD, 2019b; Aleksandrova et al., 2022; Tudose et al., 2023).
A key insight from comparative studies is that multiple factors influence a country’s digital transformation readiness, cutting across technology, human capital, governance, and economic conditions. Robust ICT infrastructure is a foundational requirement—widespread internet access, reliable electricity, and modern telecommunications networks enable digital connectivity. Equally important is human capital, including education quality and digital skills in the workforce, since people must be able to use and develop new technologies. The business environment and investment climate shape how readily firms can adopt digital innovation; factors such as R&D expenditure, entrepreneurship, and ease of doing business all contribute to readiness for digital transformation (Cisco Systems, 2019). Effective government policies and institutions—from national digital strategies and e-government services to legal frameworks for data and intellectual property—create an enabling environment for digital transformation. As the United Nations Development Programme notes, an inclusive digital transformation requires coordinated efforts across five pillars: people, connectivity, government, regulation, and economy (United Nations Development Programme [UNDP], 2023). In sum, readiness is multidimensional, reflecting a country’s technical capacity, skill base, and policy support for leveraging digital technology.
Within this context, an important and under-examined question rises: Which countries are least prepared for the changes brought about by digitalization, based on the potential of their future workforce? The “future workforce” refers to the upcoming generation of workers—today’s students and young people—who will drive and sustain digital transformation in the years ahead.
This aspect is especially critical because even if a country builds infrastructure, it cannot fully benefit from digitalization without a skilled workforce to use and innovate on those technologies. Countries with a well-educated, adaptable youth population may leapfrog in readiness despite lower income levels (Arntz et al., 2016; OECD, 2022; World Economic Forum, 2024; United Nations Development Programme [UNDP], 2023). Yet, relatively few studies have explicitly focused on the intersection of workforce development and national digital readiness. Many existing indices emphasize current infrastructure or institutional metrics, while giving less attention to whether the educational system and labor force are equipped for rapid technological change. This is a notable research gap: for instance, global assessments have pointed out that low-skilled and low-educated workers are the most vulnerable to job automation, and that without sufficient retraining, countries will face rising inequality as automation accelerates (Arntz et al., 2016). Even high-skilled workers are not immune—recent evidence shows that non-routine analytical tasks performed by highly educated professionals are increasingly susceptible to AI-driven automation, with significant variation in wage outcomes and job redesign implications (Ozgul et al., 2024; OECD, 2022). Translating this insight into a country-level readiness perspective—identifying which countries’ future labor workforce face the greatest risk—remains an open challenge.
This article addresses this gap by examining global digital transformation readiness through the lens of workforce education and automation risk. In particular, it investigates which countries appear already prepared and least prepared for digital disruption due to limitations in their future workforce’s skills and the susceptibility of their jobs to automation. This focus on the human capital dimension complements prior work and is crucial for policymakers: if a country’s next-generation workforce lacks digital skills, or if a large share of its jobs are poised to be replaced by technology, then that country’s digital future is uncertain despite other favorable factors. Identifying such nations can inform targeted interventions (such as educational reforms, upskilling programs, or labor market policies) to support preparedness for the coming wave of digitalization.
The remainder of this article is organized as follows: first, we present a review of the relevant literature, clarifying key concepts (digitization vs. digital transformation), the economic benefits of digitalization, the concept of national readiness and its drivers, and prior findings on workforce readiness and automation. We then outline the research gap and contribution of this study in detail, before proceeding to the methodological approach and analysis that address the research question. The last part of the article is dedicated to a discussion and conclusion. Section 5 sums up the research and subsequently points to the policy implications. Section 6 outlines research limitations and lists opportunities for future research.
2. Literature Review
Robert Wachal, in his essay addressing the social consequences of societal changes in the context of evaluating the potential of computer-based research in the humanities, was the first to use the term digitalization (Wachal, 1971). The term digitalization is often incorrectly confused with the term digitization. While digitization is the conversion of information flows from analogue to digital in a form of a combination of zeros and ones within one process, digitalization is the conversion of all information flows within the entire process. Digitalization simply refers to the use and implementation of specific digital technology by a company, an entire industry, or even society as a whole within the scope of a single project (Mikalef & Parmiggiani, 2022; Wachal, 1971; Brennen & Kreiss, 2016).
A company may carry out a series of projects aimed at digitalization: from the automation of production processes, the implementation of information systems managing various elements of supply chains, to the creation of ecommerce platforms and the training of employees to work with artificial intelligence. The set of such digitalization projects is collectively referred to as digital transformation, which is a strategic transformation based not only on the implementation of digital technologies, but also on changes in corporate culture, cross-organizational shifts, and adjustments in business models (Vial, 2019; Vrana & Singh, 2021).
Digitization is about bits and bytes—converting analog to digital. Digitalization is about processes—using digital technologies to do what we already do, but better. Digital transformation is about strategy and paradigm shifts—doing what we never could before, or doing fundamentally new things, enabled by digital technology (Mikalef & Parmiggiani, 2022; Wachal, 1971; Brennen & Kreiss, 2016; Vial, 2019; Vrana & Singh, 2021).
At the national level, a country may start by building internet infrastructure (digitization), then promote online services and e-commerce (digitalization), and eventually see its economy transformed with new digital industries and innovations (digital transformation). Clarifying these terms is not just semantic, it helps in scoping what “readiness” entails. A country might be well-equipped for digitization (e.g., having the hardware to convert analog systems) but not yet ready for deeper digital transformation (which requires talent, innovation ecosystems, and adaptable institutions) (Schreckling & Steiger, 2017). Thus, in assessing readiness, we must consider not only technology deployment but also the capacity for strategic, transformative change.
Digital transformation is widely seen as a positive force for economic development. For example, firms that digitalize their operations (through enterprise software, automation, AI, and so forth) can produce more with the same inputs, innovate faster, and serve customers in new ways, thereby expanding their market share and profitability.
On a larger scale, when many firms in an economy become more productive thanks to digital tools, the aggregate economic output (GDP) of that country is expected to rise. Empirical research supports these expectations:
- A cross-country econometric analysis by Tudose et al. (2023) finds that higher digital readiness correlates with higher GDP per capita. Using the Network Readiness Index (NRI) as a measure of nations’ digital transformation status, they show that the NRI has a positive and significant impact on GDP per capita across a sample of 46 countries. In other words, countries that score better on infrastructure, technology adoption, skills, and other digital criteria tend to enjoy stronger economic performance, even after controlling for their income group. This suggests that digital transformation is a driver of growth: better networked, more digital-savvy economies can produce more goods and services or higher-value outputs, boosting average incomes (Tudose et al., 2023; Dutta & Lanvin, 2023).
- Similarly, Cisco’s global digital readiness study reported a strong relationship between digital readiness and GDP per capita, underscoring that investing in digital capacity yields tangible economic value. One reason is that digitalization can spur innovation and entrepreneurship, creating entirely new industries (such as fintech, e-commerce, digital entertainment) and job opportunities that did not exist before. For example, the rise of the mobile app economy or digital content creation has contributed significantly to employment and GDP in countries that have embraced these trends (Cisco Systems, 2019).
- From the perspective of work-related processes, routine tasks can be automated, reducing labor costs or freeing workers for higher-value activities; supply chains can be synchronized in real time, minimizing inventories and downtime; and data analytics can optimize everything from energy use to marketing strategies. Historical evidence shows that major technological adoptions—steam power, electricity, etc.—boosted productivity, and digital technology is no exception (Corejova & Chinoracky, 2021). Corejova and Chinoracky (2021) further note that the effects of digital technologies are associated with growth in efficiency and output, often leading to increased revenues and profits for businesses that successfully integrate them.
Digital transformation also tends to enhance a country’s competitiveness and efficiency in global markets. By adopting advanced technologies (like robotics in manufacturing or digital finance in banking), countries can increase the productivity of their industries, making their exports more competitive. It enables cost reductions and quality improvements that can expand a nation’s trade potential. Digitalization often improves service delivery in both private and public sectors, which can raise the overall productivity of the economy. For example, digital banking and e-payments make financial transactions faster and more secure, supporting commerce; e-government services reduce bureaucratic hurdles, saving time for businesses and citizens. These efficiency gains collectively improve what economists call total factor productivity, a key ingredient of long-term growth (Arıkan Kargı, 2022; Tudose et al., 2023). The OECD and World Bank have documented that digital adoption boosts productivity and growth, particularly when combined with complementary investments in skills and organizational change (OECD, 2019a; Cusolito et al., 2020).
Another benefit of digital transformation is the potential for inclusive growth, though this is not automatic. Digital platforms can empower small entrepreneurs to reach wider markets (think of artisans selling on global e-commerce platforms) and can provide new job opportunities such as gig work or IT-enabled services in regions where formal jobs are scarce. This means that digital technologies can help overcome geographic barriers—for instance, allowing remote education and telemedicine in rural areas—thereby contributing to human capital development and health, which feed back into economic growth. (Aleksandrova et al., 2022) A study by Suntsova (2024), on the global digital economy, argued that while digitalization is a “two-edged sword”, the opportunities for economic growth, innovation, and improved services are significant if managed well. However, it must be noted that the benefits of digital transformation can be uneven if parts of the population or certain regions are left behind; hence, many scholars and international organizations stress the need for policies to bridge the digital divide so that the gains from digitalization are broadly shared (Suntsova, 2024).
In summary, digital transformation can drive a country’s economy forward by increasing productivity, fostering innovation, creating new markets and industries, and improving efficiency in existing sectors. Countries that successfully embrace digitalization often experience faster economic growth and improved competitiveness. For example, Estonia’s economy has benefited from its early adoption of e-government and digital services (often cited as “e-Estonia”) (Vassil, 2015; e-Estonia, 2022), and China’s rapid digital economy expansion (e.g., in e-commerce and fintech) has contributed to its GDP growth and global trade presence (McKinsey & Company, 2021; ING Think, 2022). These examples illustrate the general finding that digital readiness is tied to economic performance. However, realizing these benefits is contingent on having the necessary conditions in place—which brings us to the concept of digital transformation readiness at the national level.
Readiness for digital transformation at the national economic level refers to a country’s capacity to adopt, implement, and leverage digital technologies for its development and growth. It is a holistic concept that encompasses the state of infrastructure, human capital, institutions, and other foundational elements that determine how well positioned a country is to undergo digital transformation. In simple terms, a nation that is “digitally ready” has the prerequisites needed to successfully integrate advanced technologies into its economy and society, whereas a less ready nation faces significant gaps or barriers in doing so. Several frameworks and indices have been developed to measure digital readiness across countries, including the following:
- The Network Readiness Index (NRI) (Tudose et al., 2023; Dutta & Lanvin, 2023),
- The IMD World Digital Competitiveness Ranking (IMD, 2024),
- The Digital Adoption Index of the World Bank (World Bank, 2016),
- Industry-backed measures like the Cisco Digital Readiness Index (Cisco Systems, 2019).
These typically aggregate various indicators into a composite score meant to benchmark countries’ digital capabilities. Common to these assessments is the understanding that readiness spans multiple dimensions.
One useful example is Cisco’s model, which uses seven components to gauge digital readiness: (1) Basic Needs, (2) Business and Government Investment, (3) Ease of Doing Business, (4) Human Capital, (5) Start-up Environment, (6) Technology Adoption, and (7) Technology Infrastructure (Arıkan Kargı, 2022; Cisco Systems, 2019):
- The “Basic Needs” (1) component acknowledges that general socio-economic development (health, education, basic services) sets the stage—if basic needs are not met, a country will struggle to focus on digital advancement (Arıkan Kargı, 2022).
- The “Technology Adoption and Infrastructure” (6) (7) components measure the availability of digital networks (like broadband and mobile) and the extent to which people and businesses are actually using digital services.
- The “Human Capital” (4) component captures education levels, digital skills, and labor force participation, indicating whether the workforce can support and sustain digital initiatives.
- The “Business environment and government investment” (2) (3) (5) components reflect whether firms have the freedom, incentives, and support to innovate and invest in technology (for instance, ease of starting a business, R&D spending, venture capital availability). When all these factors are favorable, countries create a virtuous cycle that attracts tech investment and enables widespread tech adoption, thus being highly “ready”.
Apart from dimensions, the literature identifies a broad array of factors that impact these dimensions. These factors are often interlinked and reinforce one another. The factors are categorized as follows:
- Infrastructure and Connectivity: A fundamental requirement for any digital activity is physical and digital infrastructure. This includes telecommunications networks (broadband internet, mobile 4G/5G coverage, fiber optic networks), data centers and cloud services, electricity supply, and access to devices (smartphones, computers). High-quality, ubiquitous connectivity is consistently associated with greater digital uptake. For instance, the expansion of broadband infrastructure has been linked to increases in economic growth and online business activity (Röller & Waverman, 2001). Countries that have invested in nationwide high-speed internet (like South Korea’s early adoption of broadband or Estonia’s public Wi-Fi and digital ID system) enjoy a head start in digital readiness. In contrast, infrastructure gaps—whether rural communities without the internet or frequent power outages—severely hinder digital progress. Thus, metrics like internet penetration rate, broadband speed, and network reliability are core indicators in readiness indices (Arıkan Kargı, 2022; Cisco Systems, 2019).
- Human Capital and Skills: Arguably the most critical factor is the education and skill level of the population, particularly the workforce. Digital transformation is not self-acting; it requires people who can develop, implement, and utilize new technologies. A country with a high level of general education, strong STEM (science, technology, engineering, mathematics) training, and widespread digital literacy will be far more ready to innovate and adapt. Indicators such as the literacy rate, average years of schooling, share of graduates in STEM fields, and proficiency in ICT skills are regularly used to evaluate this (Arıkan Kargı, 2022; Cisco Systems, 2019). It is not just technical skills—adaptability, problem solving, and continuous learning are vital in a fast-changing digital environment. The World Economic Forum often emphasizes “reskilling and upskilling” the workforce as a pillar of future readiness (World Economic Forum, 2024). Empirical studies reinforce the importance of human capital: countries that score higher on education indices tend to have greater technology adoption and innovation output. Conversely, nations where large portions of the workforce have low educational attainment may struggle; indeed, research on automation risk finds that workers with low education face greater threats from displacement by technology, which can hamper a country’s overall readiness to transition to a digital economy. A digitally ready country invests heavily in its people—through quality basic education, digital skills training, vocational IT programs, and lifelong learning (Arntz et al., 2016).
- Policy and Regulatory Environment: Government policies and the regulatory framework can significantly enable or impede digital transformation. Proactive government investment in digitalization (for example, funding broadband rollout, smart city pilots, or R&D in tech) can jumpstart progress (Digital Regulation Project, 2023). Clear and forward-looking regulations (such as data protection laws, cybersecurity frameworks, electronic transaction laws) build trust and stability, encouraging businesses and consumers to participate in the digital economy (United Nations Capital Development Fund, 2023). For instance, a country that quickly establishes a legal basis for fintech and digital payments may experience rapid growth in those services. On the other hand, uncertain regulations can suppress innovation. The presence of a national digital strategy or an e-government agenda also signals readiness—many of the top-ranked countries have comprehensive plans (e.g., Singapore’s Smart Nation initiative or the EU’s Digital Decade targets) (Government of Singapore, 2024; European Commission, 2021). Additionally, ease of doing business and governance quality matter: if it is easier to start a business, register intellectual property, or engage in trade, then digital entrepreneurs can flourish (Beier et al., 2018). In summary, an enabling institutional environment—characterized by political support for digital initiatives, effective public administration, and inclusive digital policies—is a key factor. This includes public-sector readiness too: governments that themselves adopt digital tools (for tax collection, service delivery, etc.) not only become more efficient but also drive demand for digital solutions in society (Ha, 2022; Lindgren et al., 2019).
- Economic Factors and Investment Climate: A country’s overall economic development and openness to investment shape its digital readiness. Wealthier countries naturally have more resources to invest in technology and education, but beyond income, the allocation of investment matters. High R&D spending (public or private), a vibrant start-up ecosystem, and availability of venture capital or financing for tech projects all contribute to readiness (de Lucas Ancillo & Gavrila Gavrila, 2023). For example, Israel’s strong venture capital scene and government support have made it one of the leading tech hubs (the “Startup Nation”) despite its small size (Senor & Singer, 2009). Trade openness can facilitate access to new technologies and expertise from abroad (Škare & Ribeiro Soriano, 2021). A culture of innovation also plays a role: societies that encourage experimentation, entrepreneurship, and have a tolerance for risk and failure often adapt faster to technological shifts (Butt et al., 2024). On the flip side, countries with rigid economic structures, monopolistic markets, or low competition may see slower digital adoption. The presence of large tech companies or industries can also help—for instance, Taiwan’s semiconductor industry or India’s IT services sector have spillover effects on the country’s digital capabilities (Raj, 2024; Chen & Shih, 2007). In essence, a dynamic economy that invests in future technologies and fosters business innovation will be more ready to transform digitally.
- Social and Cultural Factors: These are sometimes less quantified but still important. Public attitudes towards technology (e.g., trust in digital services, willingness to adopt new products) influence uptake. In some countries, fear of job loss or privacy concerns might impede things like AI or data sharing unless addressed. Demographics can matter too—a younger population might be more tech-savvy and quick to embrace digital lifestyles, whereas aging societies may have more difficulty retraining workers (Kiser & Washington, 2015). Additionally, inequality and the digital divide within a country affect readiness: if certain groups (rural, lower income, women) have less access to technology or education, that country’s overall readiness is hampered by an underutilized segment of talent (Barra et al., 2024). Therefore, inclusive policies that bring marginalized groups into the digital fold can improve a nation’s readiness profile.
These factors often interact. For example, improving broadband infrastructure (technology factor) might be of limited use if the education system is not producing IT-proficient graduates (human capital factor)—both need to progress in tandem. Likewise, even a highly educated workforce may innovate elsewhere if the domestic business climate is poor (policy/economic factors). This suggests that foundational socio-economic development and proactive investments create the fertile ground upon which specific digital advancements grow.
In practice, countries need to address all these areas to varying degrees to boost their readiness. For developing nations, international organizations often recommend starting with infrastructure and skills (as basics) but also modernizing regulatory frameworks to not fall behind. For advanced nations, the focus might be on frontier innovations and continuously updating skillsets through lifelong learning. The literature emphasizes that digital readiness is not a static end-state but a continuous process of capacity building (United Nations Development Programme [UNDP], 2023).
Policies such as improving STEM education, incentivizing ICT infrastructure expansion, ensuring affordable internet access, encouraging tech startups, and protecting digital rights are all levers to enhance readiness. If these policies are neglected, it may evolve into a key barrier to progress. For instance, if a country fails to invest in education, it may face a talent shortage that leaves expensive new infrastructure underutilized.
The readiness of a country’s future workforce—essentially the supply of young talent and the adaptability of its labor force—is increasingly viewed as a key driver of digital transformation success. While research, studies and indices have measured nations’ digital infrastructure and current usage extensively, fewer have closely analyzed how the education system and occupational structure of a country prepare it (or not) for impending digital disruptions.
Digital transformation, especially in its next phase involving artificial intelligence and robotics, is expected to bring about substantial changes in the labor market. Many tasks will be automated, some jobs will decline, new jobs will emerge, and almost all jobs will require a higher baseline of digital competency. Therefore, a country’s capacity to educate, train, and retrain its people is absolutely critical for ensuring that digitalization leads to broadly shared prosperity rather than unemployment or polarization. The literature strongly indicates that countries investing in education and skills development are better positioned to absorb technological shocks (Arntz et al., 2016).
Workers with lower educational attainment are disproportionately at risk from automation (Arntz et al., 2016; Chang & Huynh, 2016). Low-wage, routine jobs—often held by less-educated workers—are easier to automate than high-skill jobs that involve creativity, complex problem solving, or human interaction (Chang & Huynh, 2016; OECD, 2019a). Thus, countries with a large share of employment in low-skill routine occupations (for example, assembly line manufacturing or basic clerical work) face a double challenge: these jobs might be lost to machines, and the workers may not have the education needed to shift into new roles. The International Labour Organization (ILO) and other bodies have warned that without significant upskilling, automation could worsen inequality between high-skill and low-skill workers, and between countries that have skilled labor versus those that do not (United Nations & International Labour Organization, 2024).
Although research points to the risk of automation of work based on routine tasks performed by low-skilled workers, recent studies point to the fact that high-skilled workers are not immune to disrupting changes. Advances in artificial intelligence and machine learning enable automation of non-routine cognitive tasks traditionally thought to be the domain of highly educated professionals (Ozgul et al., 2024; OECD, 2022). While some highly skilled workers benefit from task augmentation, others experience wage stagnation or erosion, particularly in occupations where routine elements are susceptible to automation (Acemoglu & Restrepo, 2018). Brynjolfsson and McAfee (2014) emphasize that this wave of “digital disruption” has introduced a new form of skill-biased technological change, where both low- and mid-skill jobs are hollowed out while high-skill roles become more competitive. This suggests that inequality risks are not only vertical (low- vs. high-skill) but also horizontal—cutting across sectors and job types depending on their specific task structures.
While policymakers talk about the future of work, traditional readiness metrics do not directly account for how threatened a country’s existing jobs are by automation. A country might score reasonably on infrastructure and current usage, but if a large fraction of its workforce is in automatable jobs and the country lacks retraining programs, its future readiness is shaky. The Economist Intelligence Unit’s Automation Readiness Index (ARI) in 2018 was a pioneering effort to qualitatively assess how prepared countries are for automation, examining education policies, labor market programs, and innovation strategies. The ARI found that even leading nations had much room for improvement—for example, few countries had updated their education policies significantly to address AI and automation (The Economist Intelligence Unit, 2018). South Korea, Germany, and Singapore topped that index because they had started initiatives like curriculum reforms and vocational training updates, whereas many others had barely begun. This suggests that policy proactiveness in workforce development is a differentiator. The ARI also highlighted that middle-income countries (like Malaysia, Indonesia) aiming to industrialize via automation face severe hurdles due to weaknesses in basic education and skills, implying they are at risk of being caught unprepared. However, the ARI was more of a policy checklist and did not directly quantify the state of the workforce or education outcomes. Thus, there is room for academic research to incorporate metrics like the percentage of workforce in high-risk jobs, or the effectiveness of training systems, into evaluations of digital readiness. We can conclude that the research gap is in considering automation risk as a component of national readiness for digital transformation.
While conceptual links between education, skills, and digital readiness are acknowledged, they have not been the primary focus of most empirical cross-country analyses. Researchers have thoroughly studied the impacts of infrastructure and digital technology adoption on economic outcomes (Corejova & Chinoracky, 2021; Arıkan Kargı, 2022; Tudose et al., 2023; Cisco Systems, 2019; OECD, 2019b; Cusolito et al., 2020; Suntsova, 2024; Dutta & Lanvin, 2023; Röller & Waverman, 2001; de Lucas Ancillo & Gavrila Gavrila, 2023; Senor & Singer, 2009; Škare & Ribeiro Soriano, 2021; Butt et al., 2024; Aleksandrova et al., 2022; Ha, 2022; Lindgren et al., 2019), but fewer studies systematically rank countries by the skill readiness of their population for digital disruption (Tudose et al., 2023; Cisco Systems, 2019; Arntz et al., 2016; IMD, 2024; World Bank, 2016; World Economic Forum, 2024).
This article aims to contribute by examining the workforce dimension of digital transformation readiness. Workforce dimension and its readiness for digital transformation was examined by quantifying the relationship between measures related to risk of job automation and measures related to education quality. Final measurements point out which countries are least prepared for digitalization-driven change. This addresses the identified research gap.
The concept of education is operationalized through three widely recognized indicators. First, expenditure on educational institutions as a percentage of GDP reflects a country’s investment in developing its human capital. Second, PISA overall scores, combining results in mathematics, science, and reading, provide a standardized measure of student learning outcomes and cognitive readiness. Third, the Education Index, part of the UN’s Human Development Index, captures average and expected years of schooling, thus offering a broader view of educational attainment. These indicators were selected based on their international comparability and together they form a composite representation of education quality, enabling a data-driven analysis of how educational factors relate to national exposure to job automation and future workforce vulnerability.
3. Methodology
Based on the literature review conducted and the identified research gap, it is possible to summarize and formulate the following research question: Which countries, by the potential of their future workforce, are the least prepared for the changes resulting from digitalization?
For the purpose of addressing the formulated research question, and as mentioned at the end of the literature review section, specific variables were identified.
On the basis of study by Frey and Osborne (2017), Nedelkoska and Quintini published a study in 2018 in which they identified the percentages of jobs at risk of automation, specifically the “Jobs at high risk of automation” metric (Nedelkoska & Quintini, 2018). This study is based on data from the 2012 PIAAC survey. Thirteen years have passed since that year, and more recent data are not available. If the aim is to analyze the readiness of countries for the changes resulting from the development of digital technologies, it is necessary to examine the data in the time range closest to year 2025.
The anchor point for the research presented in this article is 2012. In this year, the values by which the risk of job automation were measured are set. In our research, we applied a research approach from Georgieff and Milanez, and their study “What happened to jobs with high risk of automation?” (Georgieff & Milanez, 2021) conducted for the OECD. As part of the study, the authors examined how employment has changed over time since the risk of automation of jobs was identified in 2012. They examined employment as a percentage of the average change in employment rates for selected years from 2012 to 2019.
Building on the measurement essence of the Georgieff and Milanez study, this study provides an analysis of how the values of selected education-related indicators change over time in selected countries compared to the risk of job automation in 2012. The selected countries can be understood as OECD countries for which, in the measurement framework, data are available.
The dimension of education was quantified using selected indicators:
- The first is the share of education expenditure in GDP. By education expenditure we mean the share of expenditure of both public and private institutions. This metric is important because it is an indicator of the quality of education in a country. Higher investment in education can improve school infrastructure, provide better salaries for teachers, support modern teaching aids and technology, and fund research and innovation in education. Data for the calculation of this metric (“Expenditure on educational institutions as a percentage of GDP”) were obtained from the OECD database (OECD, 2025).
The question is whether this indicator alone is indicative of the quality of education. Therefore, to make the measurements more accurate and comprehensive, two other indicators in the calculations were included:
- The second indicator is the PISA overall score metric. PISA overall scores provide data on students’ basic skills in reading, math, and science. It is calculated as an average of math, reading, and science scores. High scores indicate that students in a given country have good academic skills and are able to apply them in a variety of contexts, in a variety of subject areas. Conversely, low scores may indicate problems in basic skills. The data on the value of the metric (“PISA overall score”) were obtained directly from the database (OECD, 2019c, 2023).
- The third metric is the Education Index. This index is a part of the HDI (Human Development Index). The Education Index basically measures the average of the expected number of years a young person spends in school and the average number of years a young person spends in school. A high score on the Education Index implies that a country has strong educational outcomes and broad access to education. The data related to the metrics (“Expected years of schooling” and “mean years of schooling”) from which Education Index was calculated were obtained from the UN Human Development Reports database (United Nations Development Programme [UNDP], 2024).
To assess the dependence of the selected metrics, this article uses metrics that determine the statistical significance of the observed relationships (using a hypothesis test of correlation significance) to help us determine whether the observed relationship between the variables is real or coincidental:
- The first metric is the correlation coefficient, which measures the strength and direction of the relationship between two variables. Depending on the linear dependence of the variables, the correlation can be positive, negative, or zero. For the purpose of performing the calculations, we chose Pearson’s correlation coefficient, as all analyzed variables are continuous and measured on an interval or ratio scale. In addition, visual inspection of scatterplots confirmed that the relationships between the variables are approximately linear, and the data do not exhibit extreme deviations or significant non-linear trends. Pearson’s correlation coefficient is therefore appropriate for capturing the strength of linear associations in this context. The correlation coefficient itself does not provide information about the statistical significance of the relationship.
- Therefore, to assess the statistical significance of the correlation coefficients, we applied a standard hypothesis testing procedure. Specifically, we used the t-statistic derived from the Pearson correlation coefficient, which allows us to determine whether the observed correlation could have occurred by chance. Based on the t-statistic, a p-value is calculated to evaluate whether the correlation is statistically significant.
- The hypothesis test follows the conventional logic: if the p-value is less than the alpha level of significance (0.05), the null hypothesis (that there is no statistically significant correlation) is rejected, and the alternative hypothesis (that there is a statistically significant correlation between the two variables) is accepted. This approach enables us to distinguish between relationships that are likely to exist in the population and those that may result from sampling variability.
The results of the measurements are intended primarily for policymakers concerned with the issue of countries’ readiness for changes related to the digital transformation. In addition, the results of the measurements represent an information basis for strategic planning aimed at shaping education policies.
4. Results
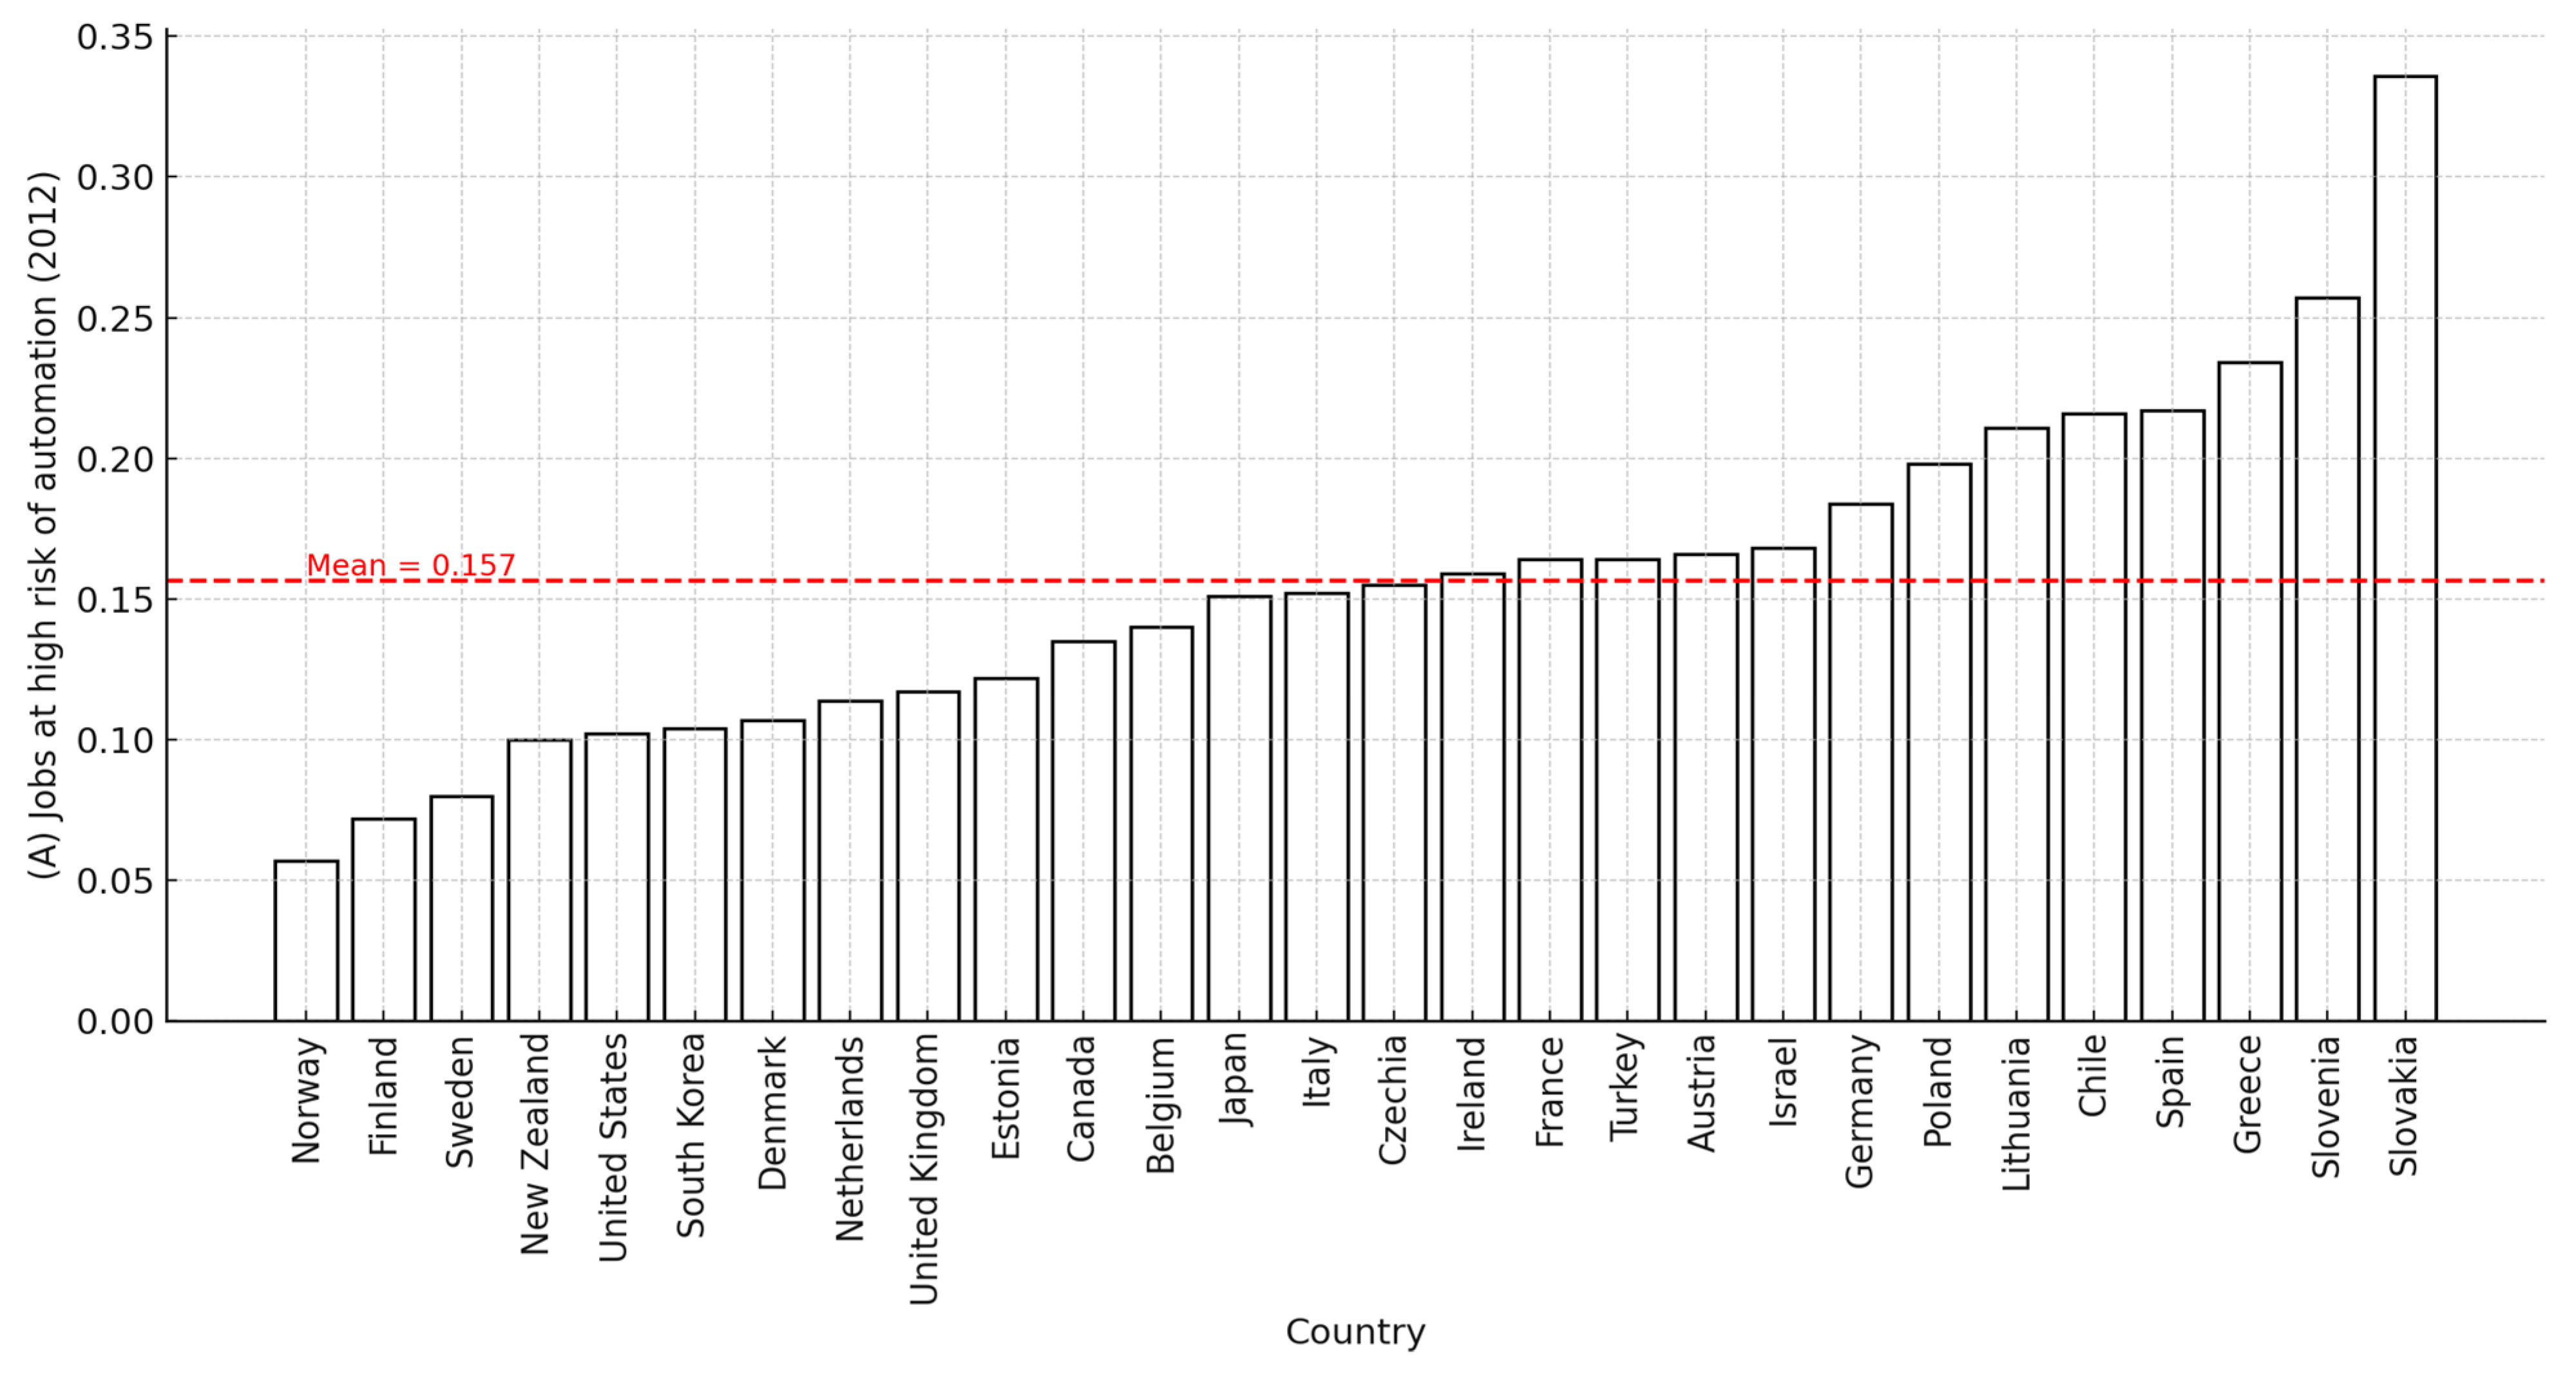
Based on the measurements reported by Nedelkoska and Quintini, the proportion of jobs at high risk of automation (metric A “Jobs at high risk of automation”) significantly varies across the countries studied (see Chart 1). The percentage of such jobs ranges from 5.7% in Norway to 33.7% in Slovakia. Generally, Northern Europe (including Scandinavian countries and the United Kingdom), North America (Canada and the United States), and New Zealand exhibit relatively low levels of risk. Conversely, Eastern and Southern European countries face a much higher risk of automation. The publication notes that these differences are not due to sectoral variations in the economies but rather to how jobs are organized in these countries. Jobs in Southern and Eastern Europe are more likely to involve automatable tasks compared to similar job categories in other countries. For instance, in one country, assembly line workers might only perform manual tasks with a high risk of automation, whereas, in another country, workers in the same role might also monitor industrial robots and carry out quality control measures. Consequently, jobs in the second country are much less at risk than those in the first.
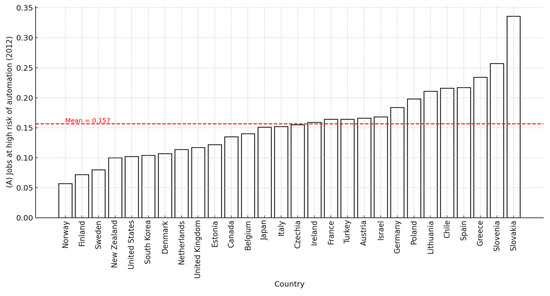
Chart 1.
Jobs at high risk of automation by country.
Considering the values of metric A (jobs at high risk of automation), we identified values for metrics B (expenditure on educational institutions as a percentage of GDP), C (PISA testing overall score) and D (Education Index). Based on the research and measurement logic (outlined in the methodology section of the paper and derived from measurements in the Georgieff and Milanez study (2021)), metrics B, C, and D are the average of the values measured over the years (see Table 1). For metric C, it is an average of average overall values of metric. The selection of years was affected by availability of the data.

Table 1.
Summarization of values identified for metrics A, B, C, and D.
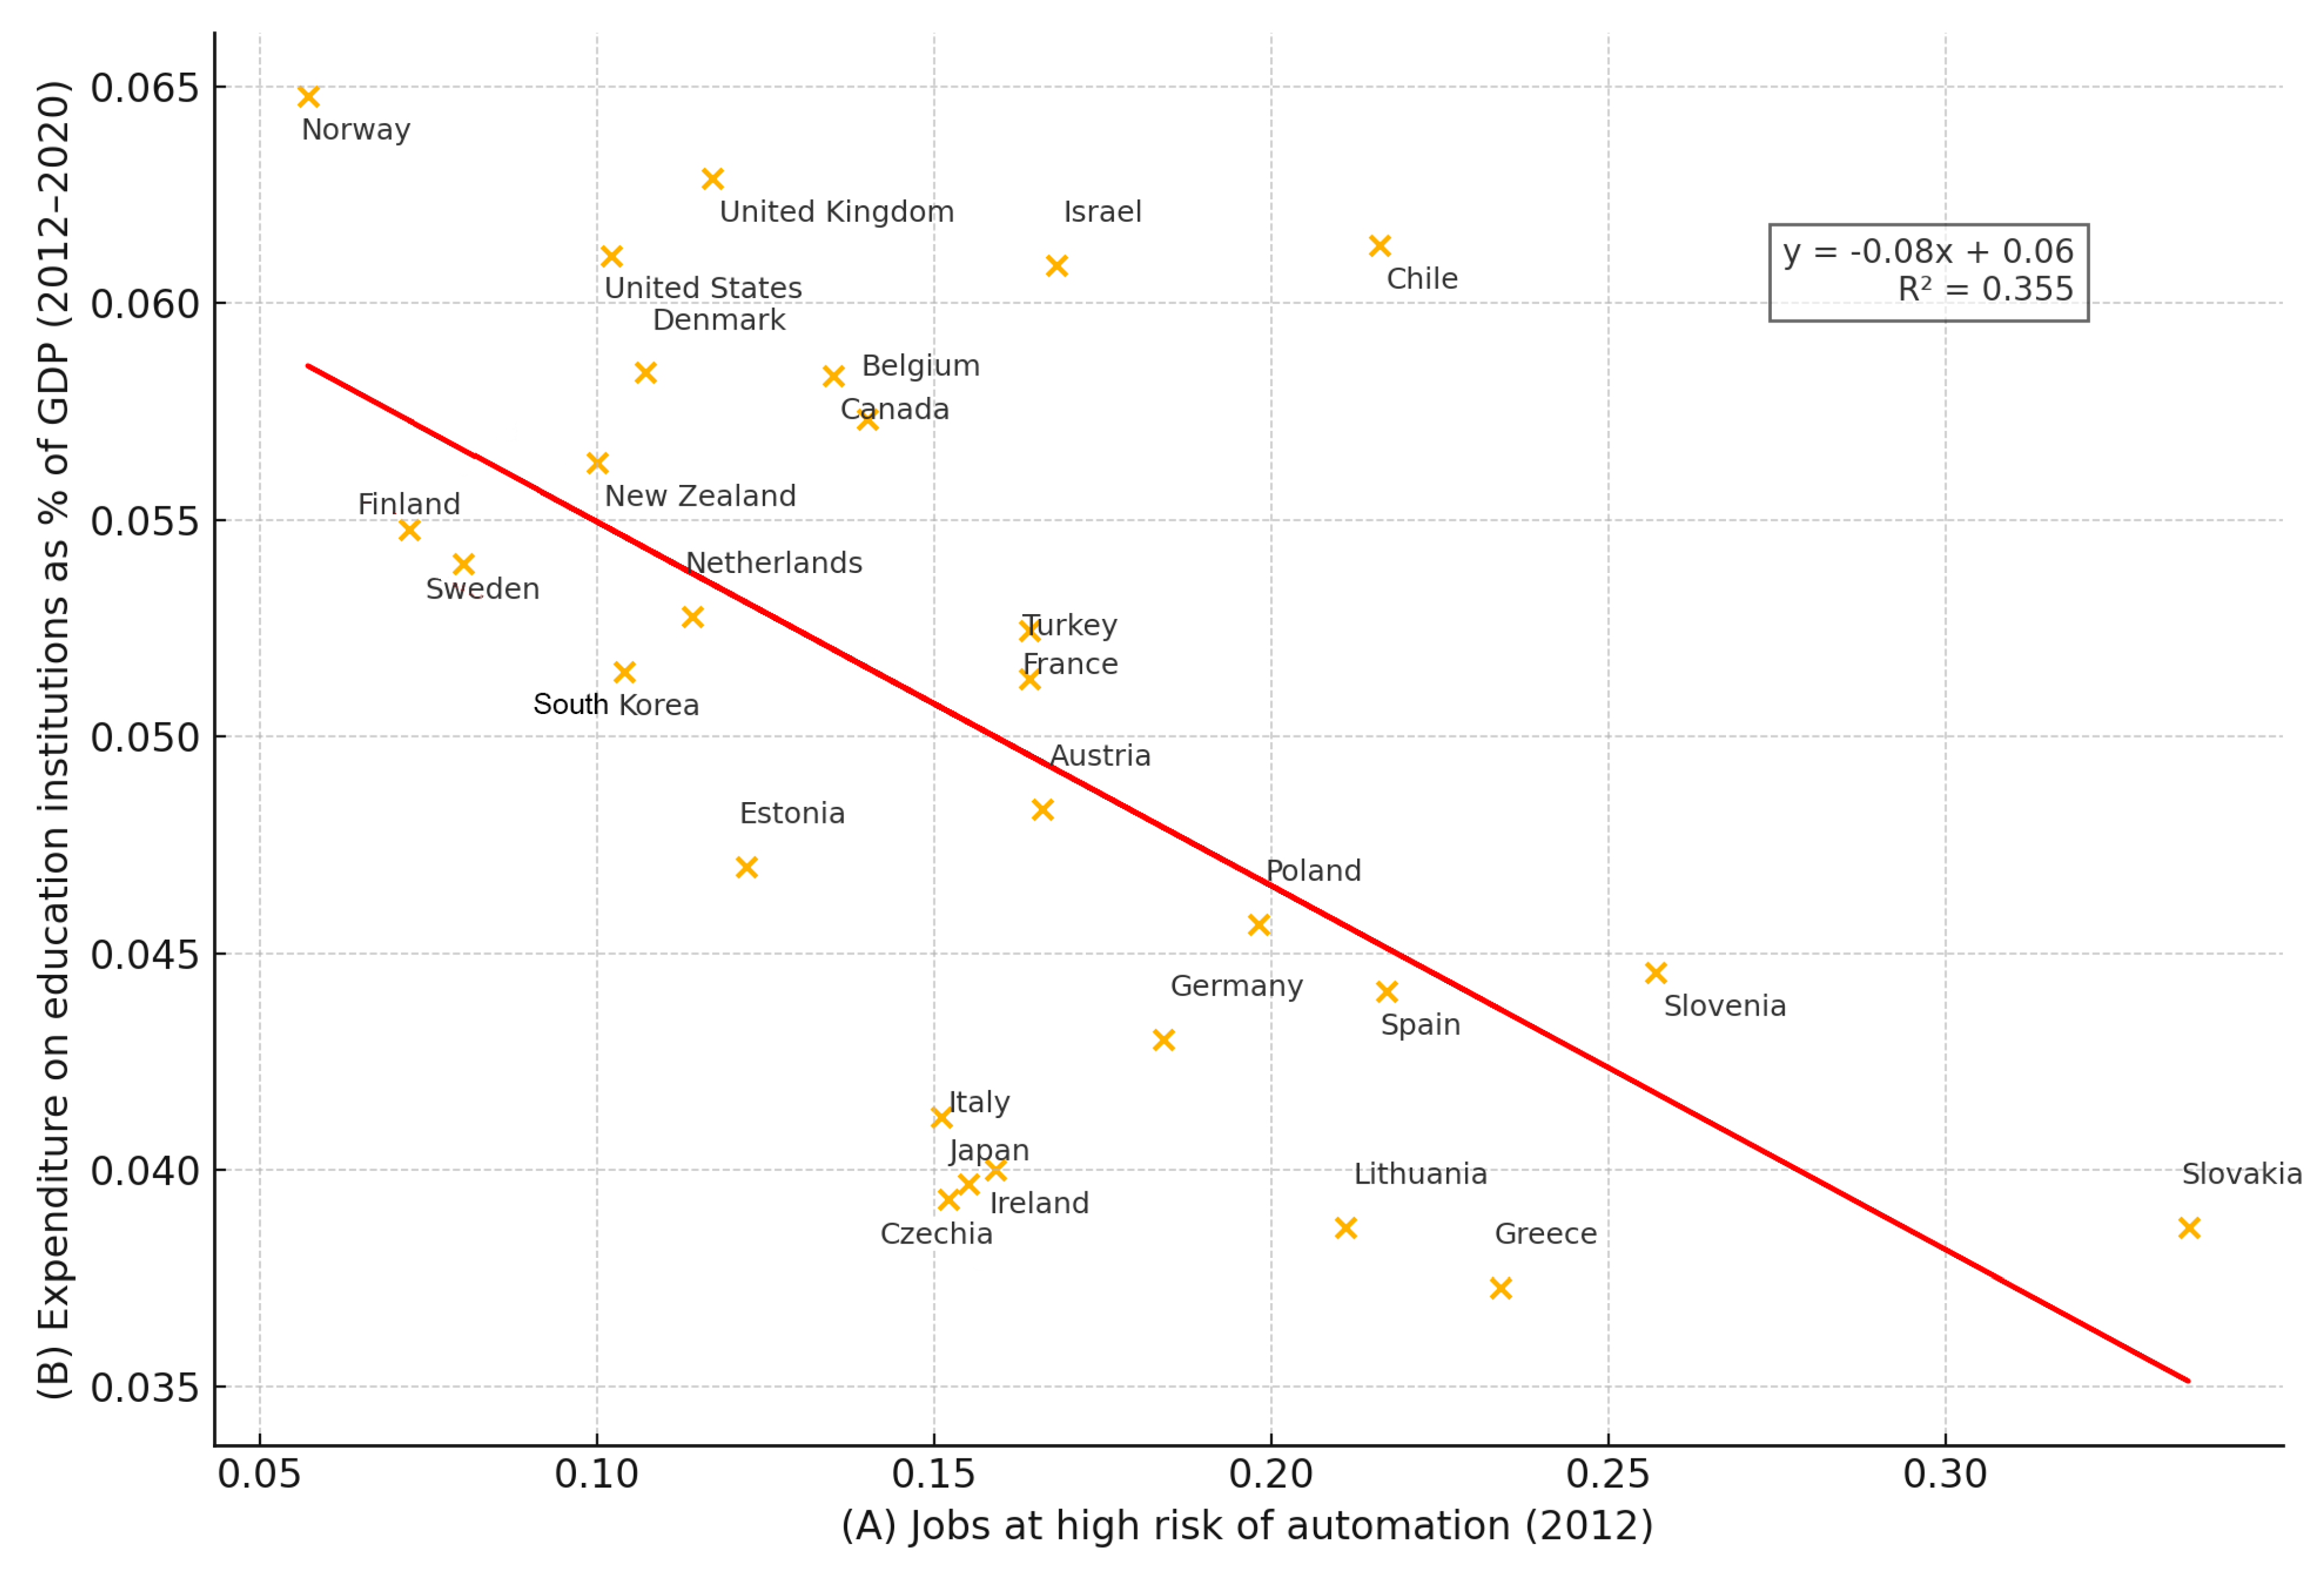
The first metric (B) that is examined is the expenditure on educational institutions as a percentage of GDP metric (Figure 1). The slope of the trend line resulting from the graph tells us that this is a negative relationship. As the values of metric A decrease, the values of metric B decrease. This means that if a country is measured to have a high risk of job automation, then that country has a lower share of spending on education as a proportion of the country’s total GDP.
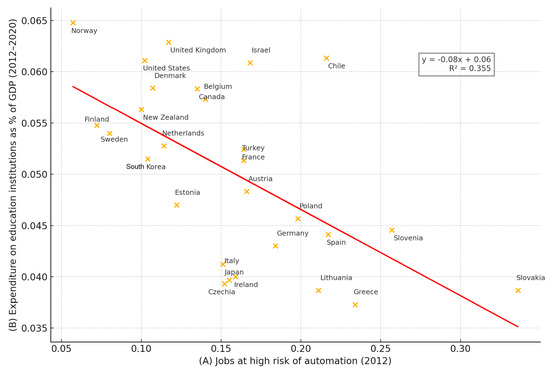
Figure 1.
Automation risk vs. education expenditure.
The second metric we examined is the overall PISA score for the domains of math, science, and reading (Figure 2). The graphical results presented in the graph suggest a possible same dependency as in the previous case. The higher risk of automation is in those countries where lower PISA scores were recorded. What should be noted is that if there is a dependency even between the metrics, it is a dependency with very low intensity.
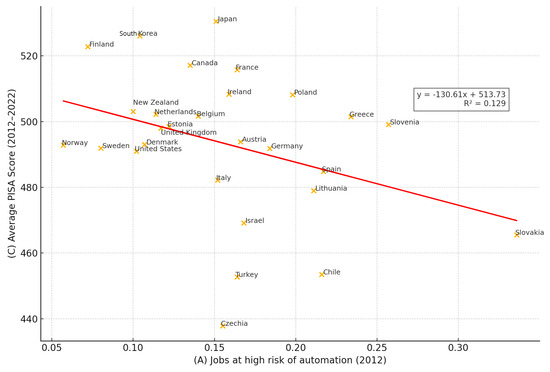
Figure 2.
Automation risk vs. PISA score.
The third metric we examined is the value of the Education Index, which is part of the HDI measurements (Figure 3). As in the previous cases—the graphical visualization suggests a negative relationship. The higher the risk of automation of jobs in a given country is, the lower is the value of the Education Index.
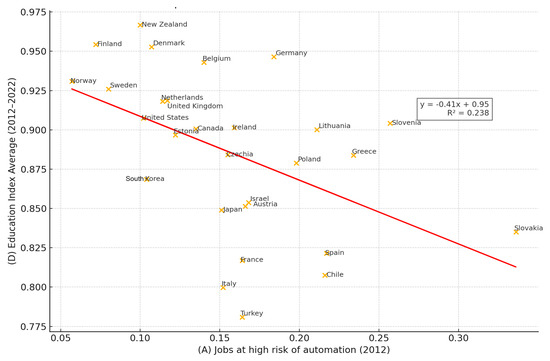
Figure 3.
Automation risk vs. Education Index.
Even if certain dependencies between metrics were measured. They need to be further statistically investigated. The table below presents the findings, which provide a more detailed picture of how the metrics are interdependent. For each variable, it is indicated what combination of metrics (A to D) is under investigation.
If we look at the correlation coefficients (Table 2), none of the observed relationships can be classified as strong. In two cases—between metrics B and A, and between D and A—the correlations are moderate and negative. In the third case—between C and A—the correlation is weak and negative.
Table 2.
Statistical significance of measurements.
To evaluate the statistical relevance of these correlations, we examined the p-values associated with each Pearson correlation coefficient. In the case of the first correlation (B–A), the p-value is below 0.05, which indicates that the observed negative correlation is statistically significant. We can therefore reject the null hypothesis of no correlation.
For the second correlation (C–A), the p-value is 0.06, which exceeds the standard threshold of 0.05. This means that we do not have sufficient evidence to reject the null hypothesis, and the observed weak negative correlation may not be statistically significant. Consequently, this relationship is not subject to further interpretation or analysis in the following sections.
In the third case (D–A), the p-value is again below 0.05, confirming a statistically significant negative correlation between metrics D and A.
It is important to note that while the strength and direction of the relationship are described by the correlation coefficient, the p-value is used to determine whether the observed correlation is statistically unlikely to have occurred by chance. In line with this criterion, only those correlations with p-values below 0.05 are considered further in the analysis.
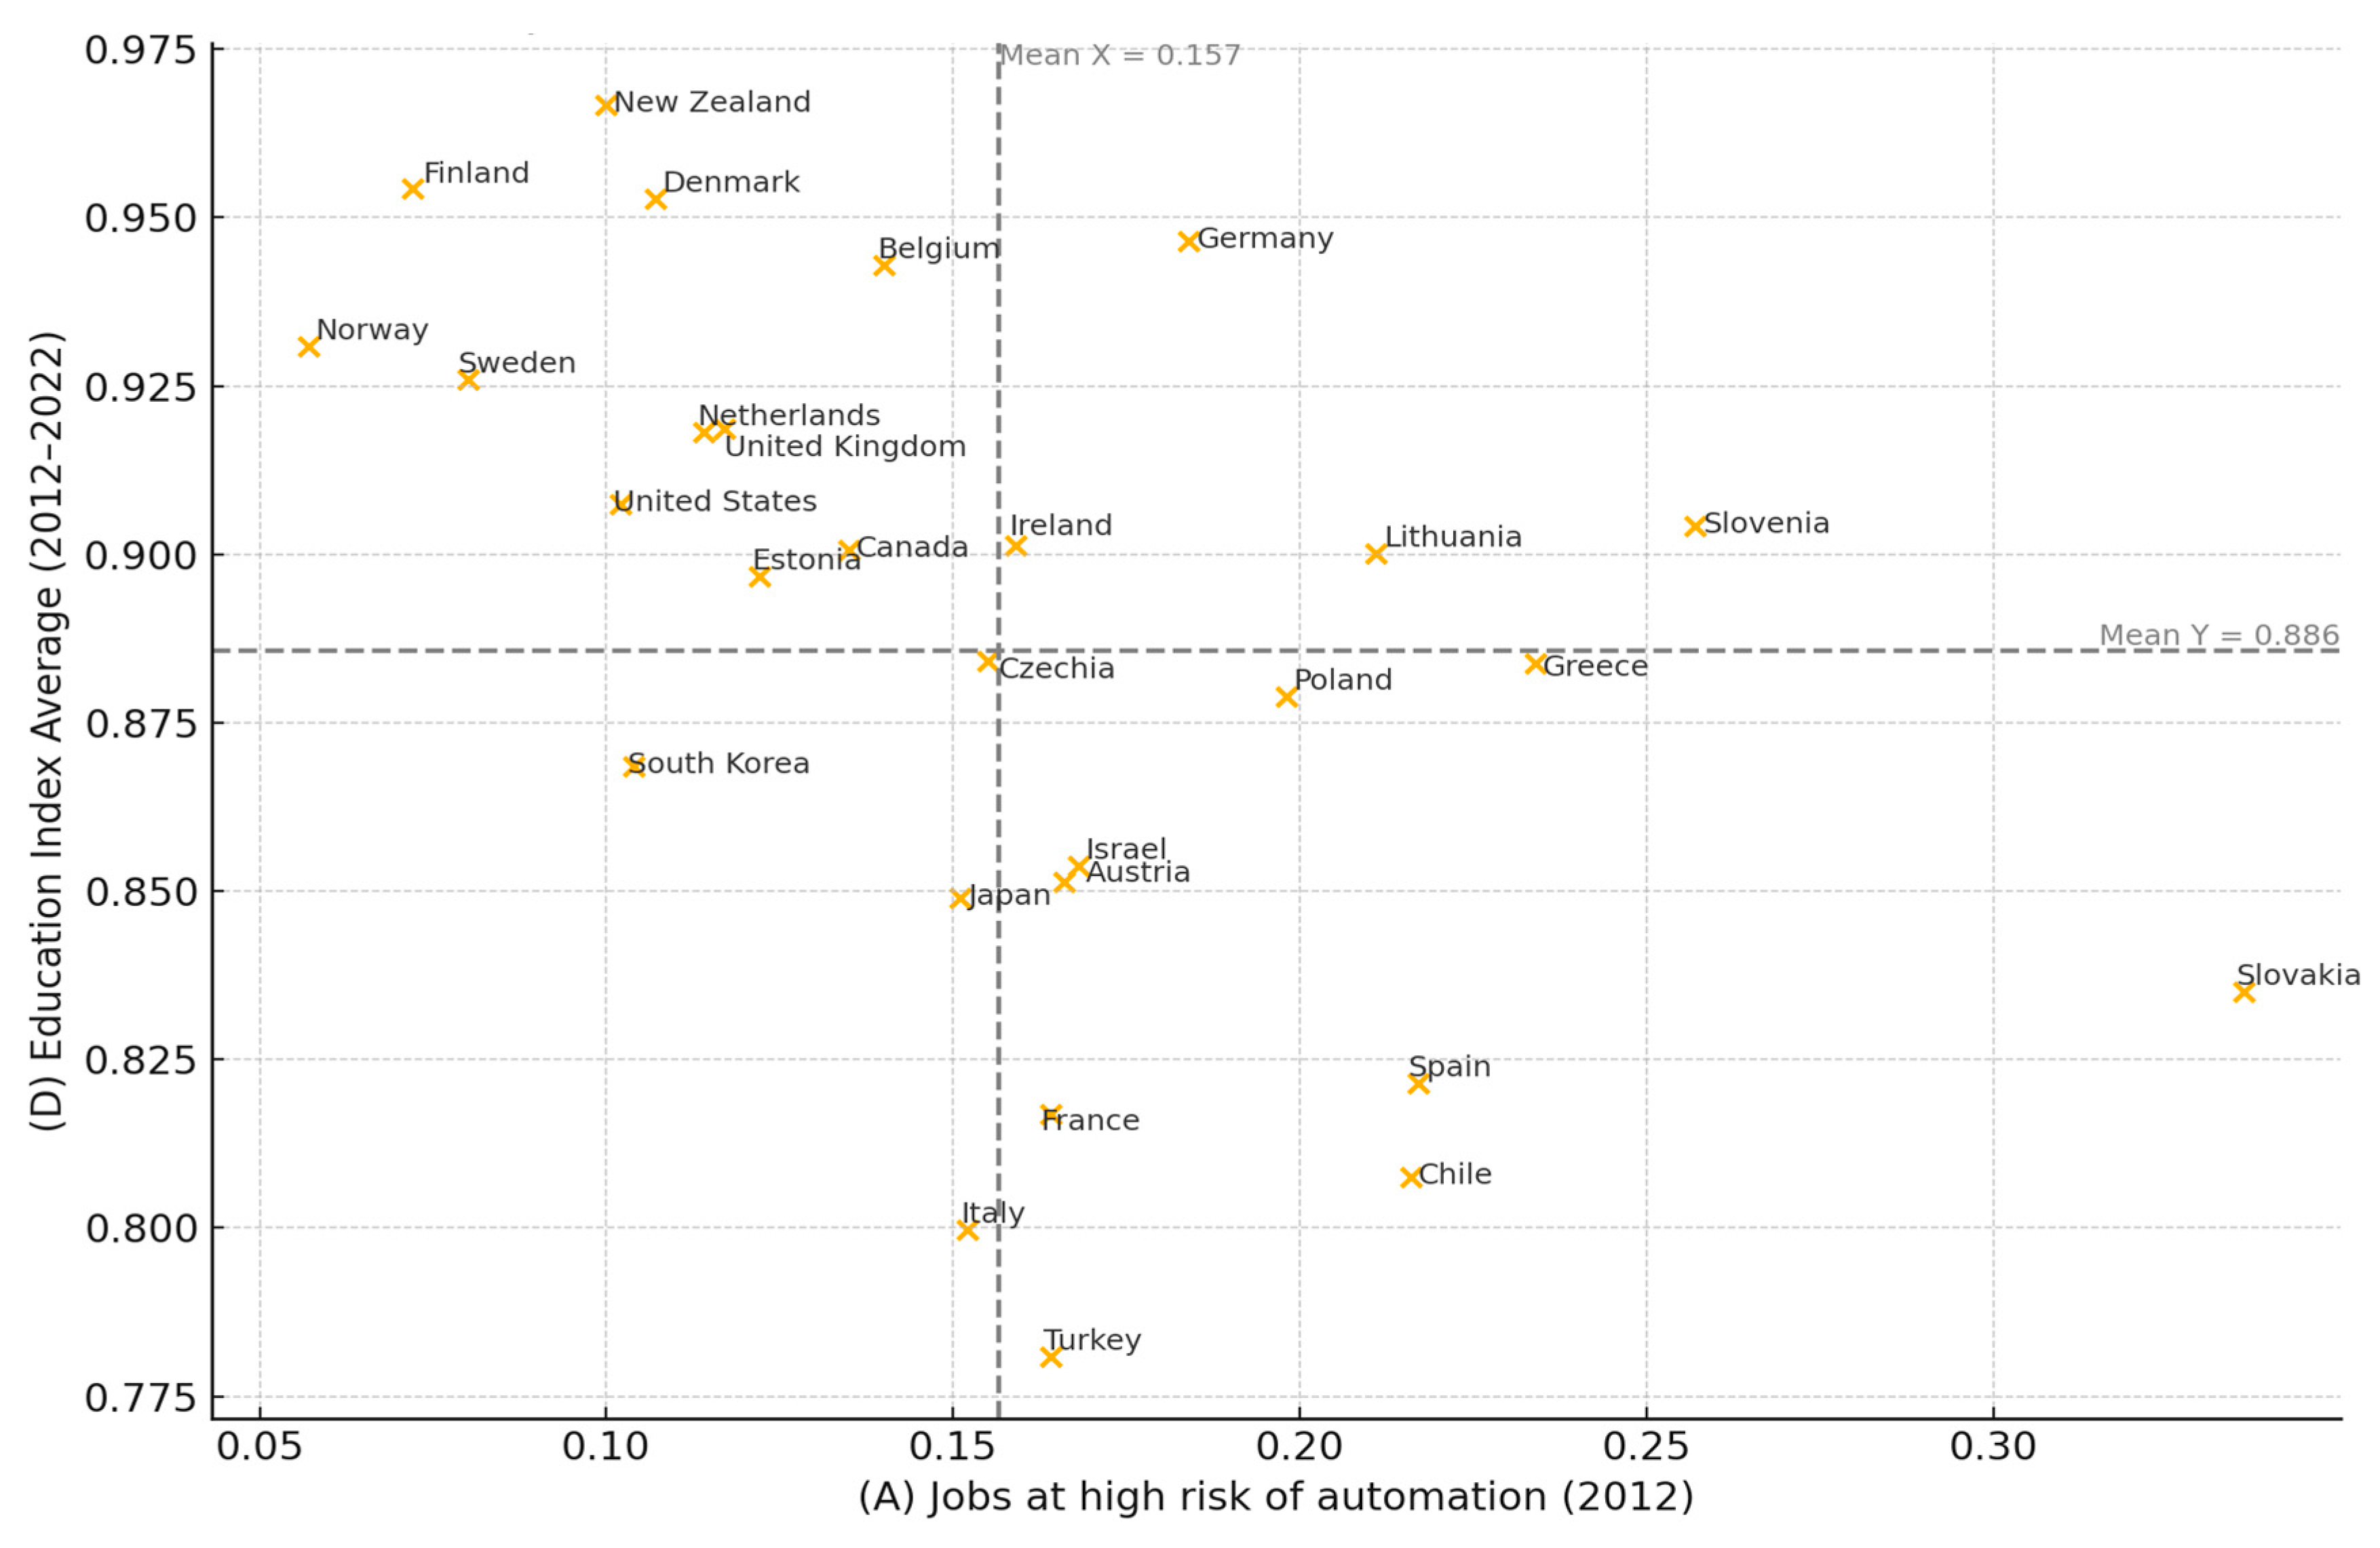
If we form clusters grouping countries by metric A, it is possible to see a pattern in the values of metrics B and D (Table 3 and Table 4). The clusters, according to Metric A, are formed with 5% numeric intervals. That is, the groups are distributed as 0–5%, 5–10%, 10–15%, 15–20%, and 20–25%. The pattern is expressed using a heat map. Using the color scales relationships, deviations and extreme values are identified. Metric B values above 5% are highlighted with a darker shade of green. Values below 5% are highlighted by lighter shades of green. For metric D, the darkest shades of green are applied to those values that are in closest proximity to 1. Further upgrading the clarity of Table 3 and Table 4, Figure 4 and Figure 5 show quadrants where we can group countries according to the degree of risk of work automation and average spending on education or average values of the Education Index. Quadrants are numbers from 1 to 4 (top left is 1, top right is 2, bottom right is 3, bottom left is 4).
Table 3.
Heat map of patterns between metrics A and B.
Table 4.
Heat map of patterns between metrics A and D.
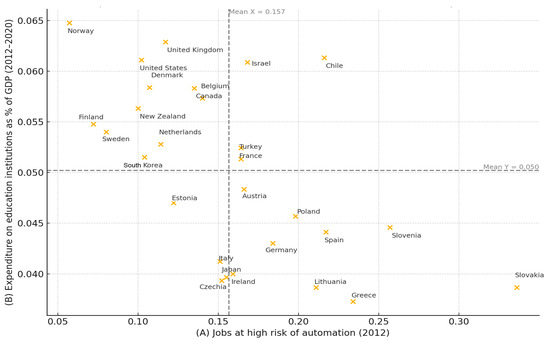
Figure 4.
Quadrant view—automation risk vs. education expenditure.

Figure 5.
Quadrant view—automation risk vs. Education Index.
Looking at Table 3, average share of jobs at high risk of automation is 15.65%, with the lowest value 5.7% and the highest reaching 33.6%. As for spending on educational institutions, the average is 5.02% of GDP, with values ranging from 3.73% to 6.48%. These data point to a relatively wide dispersion in the intensity of public investment in education, reflecting different political and economic strategies of individual countries. The heat map of Table 3 clearly shows that the upper part of the table representing those countries, whose risk of job automation is lower than average, have higher expenditures in education. The bottom part of the table does not give us a clear answer.
Figure 4 further elaborates and groups countries as follows:
- Quadrant 1: Countries with above-average education expenditures as a % of GDP (>0.05) have a below-average % of jobs at high risk of automation (<0.157). These are Norway, Finland, Sweden, New Zealand, United States, South Korea, Denmark, Netherlands, United Kingdom, Canada, and Belgium.
- Quadrant 2: Countries with above-average education expenditures as a % of GDP (>0.05) have an above-average % of jobs at high risk of automation (>0.157). These are Israel, Chile, Turkey, and France.
- Quadrant 3: Countries with below-average education expenditures as a % of GDP (<0.05) have an above-average % of jobs at high risk of automation (>0.157). These are Ireland, Austria, Germany, Poland, Spain, Slovenia, Lithuania, Greece, and Slovakia.
- Quadrant 4: Countries with below-average education expenditures as a % of GDP (<0.05) have a below-average % of jobs at high risk of automation (<0.157). These are Estonia, Italy, Japan, and Czechia.
In terms of the Education Index (Table 4), the average value is 0.886, with a minimum value of 0.78 and a maximum value of 0.97. These data again indicate significant diversity between countries in terms of exposure to automation risk and years spent schooling in education systems. Again, as is the case with data in Table 3 and Table 4, using heat map coloring, it is split into two parts. The upper part again clearly shows that countries that have a high Education Index are less susceptible to job automation. The lower part of the table is not so clear. Clarity again provides a scatter plot graph divided into quadrants (Figure 5) where quadrants are again grouped into four categories:
- Quadrant 1: Countries with above-average average values of the Education Index (>0.886) have a below-average % of jobs at high risk of automation (<0.157). These are Norway, Finland, Sweden, New Zealand, Denmark, Belgium, Netherlands, United Kingdom, United States, Estonia, and Canada.
- Quadrant 2: Countries with above-average average values of the Education Index (>0.886) have an above-average % of jobs at high risk of automation (>0.157). These are Ireland, Germany, Lithuania, and Slovenia.
- Quadrant 3: Countries with below-average average values of the Education Index (<0.886) have an above-average % of jobs at high risk of automation (>0.157). These are Turkey, France, Austria, Israel, Poland, Greece, Spain, Chile, and Slovakia.
- Quadrant 4: Countries with below-average average values of the Education Index (<0.886) have a below-average % of jobs at high risk of automation (<0.157). These are Czechia, Japan, Italy, and South Korea.
5. Discussion
The findings of this study reveal substantial disparities in countries’ readiness for digital transformation in terms of human capital and the risk of job automation. We identified a group of best-prepared countries that systematically invest significantly in education and demonstrate high educational performance (e.g., Education Index), while simultaneously exhibiting a relatively low share of jobs at high risk of automation. These include economically advanced countries such as New Zealand, Canada, Sweden, Norway, Denmark, and Finland, which consistently develop human capital and whose labor forces possess the competencies required to mitigate the disruptive effects of automation. At the opposite end of the spectrum are least-prepared countries—for example, Slovakia, Poland, and Greece—with below-average investment in education and weaker educational outcomes, which also show a high proportion of jobs susceptible to automation. This combination of insufficient human capital and high technological vulnerability suggests significant exposure to labor market shocks.
While the Automation Readiness Index (ARI) (The Economist Intelligence Unit, 2018) qualitatively highlighted that many countries had not sufficiently updated their education policies in response to the rise of AI and automation, our study quantitatively reinforces this perspective. It shows that countries with underdeveloped or underfunded education systems already exhibit higher vulnerability, with larger proportions of automatable jobs. Thus, policy recommendations include implementing large-scale upskilling programs and lifelong learning strategies targeting workers in the most exposed sectors. If neglected, automation may exacerbate regional and social inequalities—for instance, through rising long-term unemployment or the decline of entire economic sectors. Governments should prioritize increasing education investment, which includes not only raising education expenditure as a share of GDP but ensuring the effective allocation of these resources. Examples of such allocation can be focused on modernizing curricula (with emphasis on digital skills, STEM disciplines, and adaptability), improving teaching quality, and preparing educators for the digital era.
For moderately prepared countries, our findings indicate the need for better policy alignment. Nations like France or Israel, where education spending is high yet automation risk remains elevated, should assess whether resources are used effectively—for instance, whether education systems respond to labor market needs in the digital era. These countries may benefit from reforms linking education and practice (e.g., dual education, partnerships with tech firms) and promoting transferable digital skills. Others, such as Germany and Ireland, with high-quality education outcomes but persistent automation risk, should examine their economic structures. A large share of routine-intensive industrial sectors may render even well-educated workforces vulnerable. Hence, policy priorities include innovation support and job creation in sectors resilient to automation, alongside reskilling workers from industries negatively impacted by digital transformation.
Best-prepared countries should not be complacent. While currently leading, rapid technological change (e.g., AI, robotics, platform economy) may reveal future weaknesses. These countries should continue investing in human capital, regularly update educational content, and promote a culture of lifelong learning. They may serve as models of best practice for less-prepared countries. Less-prepared countries could adopt successful policies, such as early digital literacy education, investment in R&D, and active labor market policies.
From the broader literature perspective, this study extends and complements prior research on digital transformation readiness, especially by emphasizing the role of human capital and automation risk. Many existing indices (Network Readiness Index (NRI) (Dutta & Lanvin, 2023), IMD World Digital Competitiveness Ranking (IMD, 2024), Digital Adoption Index of the World Bank (World Bank, 2016), Cisco Digital Readiness Index (Cisco Systems, 2019)) emphasize current infrastructure or usage but underrepresent the future workforce dimension. Results of this research advance this perspective by linking education quality indicators with automation risk estimates. Thus, this study addresses a gap previously noted in the literature: the need to integrate automation vulnerability into national readiness assessments. Our findings from a certain point of view confirm on a macro level what previous studies (Corejova & Chinoracky, 2021; Arntz et al., 2016; Frey & Osborne, 2017; Nedelkoska & Quintini, 2018) suggested on an individual level—that the workforces of countries with a lower quality of education and thus, with lower education, face a higher automation risk. Unlike the qualitative ARI (The Economist Intelligence Unit, 2018), this study uses quantitative data to identify the most vulnerable countries. The resulting typology creates a more comprehensive picture of readiness that merges technological and human capital dimensions.
6. Conclusions
This study contributes to understanding how countries are prepared for changes driven by digital transformation from the perspective of their future workforce. By quantifying the relationship between education quality indicators and job automation risk, we identified which OECD countries are best and least prepared for impending technological changes. The analysis showed that inadequate educational investment and weak learning outcomes correlate with greater automation vulnerability. This has implications for both research and policymaking.
The study and analysis have several methodological limitations to which directions for further research are suggested:
- The study is based on risk estimates from 2012 by Nedelkoska and Quintini, 2018. Technological advances since 2012—particularly in AI and robotics—have likely shifted both the nature and scale of automatable tasks. The direction of further research should build on the study by Nedelkoska and Quintini and should produce an updated list of countries categorized according to the risk of automation of work in those countries.
- Data for the other indicators, which are PISA scores, Education Index and Average Education Expenditure as % of GDP, are from previous years. This can be seen as a form of limitation of the research, which is a suggestion for further research: depending on the availability of more recent data, the measurements need to be updated to best reflect the current situation.
- The sample of countries was limited to those with available standardized data (OECD countries). Future research should examine datasets from other countries or organizations that use similar or complementary metrics.
- Due to the availability of data for a selected sample of countries, the indicators used to measure human capital were limited to three: education expenditure, PISA scores, and the Education Index. While relevant, these metrics do not fully capture the dimensions necessary to provide a comprehensive overview of education quality. Therefore, future research could delve deeper by clustering countries based on complementary indicators specifically designed to assess the quality of education.
In conclusion, this study highlights the importance of future workforce preparedness as a key pillar of national digital readiness. Countries with weak investment in education and a vulnerable labor structure may struggle to adapt to rapid technological change. For policymakers, the findings offer a clear directive: invest in human capital, promote skill adaptability, and foster resilient labor markets to secure the benefits of digital transformation and mitigate its risks.
Author Contributions
Conceptualization, R.C. and N.S.; methodology, R.C.; validation, R.M.; formal analysis, R.C. and N.S.; investigation, R.C.; resources, R.C.; data curation, R.C.; writing-original draft preparation, R.C.; writing-review and editing, R.C., N.S. and L.M.; visualization, R.C.; funding acquisition, R.M. All authors have read and agreed to the published version of the manuscript.
Funding
This research was funded by a grant provided by the scientific research project 2020-1-MT01-KA203-074215: Integrated RPL & APEL Level 6 Accredited Online Programme for Entrepreneurs.
Institutional Review Board Statement
Not applicable.
Informed Consent Statement
Not applicable.
Data Availability Statement
The data that support the findings of this study are derived from publicly available sources (OECD, 2019c, 2023, 2025; United Nations Development Programme [UNDP], 2024) and were processed by the authors.
Conflicts of Interest
The authors declare no conflicts of interest.
References
- Acemoglu, D., & Restrepo, P. (2018). Low-skill and high-skill automation. Journal of Human Capital, 12(2), 204–232. [Google Scholar] [CrossRef]
- Aleksandrova, A., Truntsevsky, Y., & Polutova, M. (2022). Digitalization and its impact on economic growth. Brazilian Journal of Political Economy, 42(2), 424–441. [Google Scholar] [CrossRef]
- Arıkan Kargı, V. S. (2022). Determining digital readiness levels of the OECD countries with CRITIC-Based ARAS method. Akademik Yaklaşımlar Dergisi, 13(2), 363–376. [Google Scholar] [CrossRef]
- Arntz, M., Gregory, T., & Zierahn, U. (2016). The risk of automation for jobs in OECD countries: A comparative analysis. OECD Social, Employment and Migration Working Papers No. 189. OECD. [Google Scholar]
- Barra, C., Grimaldi, M., Muazzam, A., Troisi, O., & Visvizi, A. (2024). Digital divide, gender gap, and entrepreneurial orientation: How to foster technology adoption among Pakistani higher education students? Socio-Economic Planning Sciences, 93, 101904. [Google Scholar]
- Beier, G., Niehoff, S., Ziems, T., & Xue, B. (2018). Sustainability aspects of a digitalized industry—A comparative study from China and Germany. International Journal of Precision Engineering and Manufacturing-Green Technology, 4(2), 227–234. [Google Scholar] [CrossRef]
- Brennen, J. S., & Kreiss, D. (2016). Digitalization. In K. B. Jensen, R. T. Craig, J. D. Pooley, & E. W. Rothenbuhler (Eds.), The international encyclopedia of communication theory and philosophy. Wiley-Blackwell. [Google Scholar]
- Brynjolfsson, E., & McAfee, A. (2014). The second machine age: Work, progress, and prosperity in a time of brilliant technologies. W.W. Norton & Company. ISBN 978-0393239355. [Google Scholar]
- Butt, A., Imran, F., Helo, P., & Kantola, J. (2024). Strategic design of culture for digital transformation. Long Range Planning, 57(2), 102415. [Google Scholar] [CrossRef]
- Chang, J.-H., & Huynh, P. (2016). ASEAN in transformation: The future of jobs at risk of automation. Bureau for Employers’ Activities, Working Paper No. 9. International Labour Office. ISBN 9789221309659. [Google Scholar]
- Chen, M.-L., & Shih, H.-Y. (2007). Patent citations, R&D spillover and Tobin’s Q: Evidence from the semiconductor industry in Taiwan. Review of Quantitative Finance and Accounting, 28, 123–140. [Google Scholar]
- Cisco Systems. (2019). Cisco digital readiness index. Cisco Systems. [Google Scholar]
- Corejova, T., & Chinoracky, R. (2021). Assessing the potential for digital transformation. Sustainability, 13(19), 11040. [Google Scholar] [CrossRef]
- Cusolito, A. P., Lederman, D., & Peña, J. (2020). The effects of digital-technology adoption on productivity and factor demand: Firm-level evidence from developing countries. Policy Research Working Paper 9333. World Bank Group. [Google Scholar]
- de Lucas Ancillo, A., & Gavrila Gavrila, S. (2023). The impact of research and development on entrepreneurship, innovation, digitization and digital transformation. Journal of Business Research, 157, 113580. [Google Scholar] [CrossRef]
- Digital Regulation Project. (2023). National digital transformation strategy: Mapping the digital journey. DigitalRegulation.org. [Google Scholar]
- Dutta, S., & Lanvin, B. (Eds.). (2023). Network readiness index 2023: Trust in a network society—A crisis of the digital age? Portulans Institute. [Google Scholar]
- e-Estonia. (2022). How digital signatures save 2% of GDP annually. e-Estonia Briefing Centre. [Google Scholar]
- European Commission. (2021). Europe’s digital decade: Digital targets for 2030. European Commission. [Google Scholar]
- Frey, C. B., & Osborne, M. A. (2017). The future of employment: How susceptible are jobs to computerisation? Technological Forecasting and Social Change, 114, 254–280. [Google Scholar] [CrossRef]
- Georgieff, A., & Milanez, A. (2021). What happened to jobs at high risk of automation? OECD Social, Employment and Migration Working Papers, No. 255. OECD Publishing. [Google Scholar]
- Government of Singapore. (2024). Smart nation and digital government office. Smart nation Singapore: Transforming the future today. Government of Singapore. [Google Scholar]
- Ha, L. T. (2022). Effects of digitalization on financialization: Empirical evidence from European countries. Technology in Society, 68, 101851. [Google Scholar] [CrossRef]
- IMD. (2024). World digital competitiveness ranking 2024. IMD World Competitiveness Center. [Google Scholar]
- ING Think. (2022). China’s digital economy: Divided but growing. ING economic and financial analysis. Available online: https://think.ing.com/articles/china-digital-economy-divided-but-growing/ (accessed on 15 May 2025).
- Kiser, A. I. T., & Washington, R. (2015). The information gap amongst the generations and the implications for organizations. International Journal of Digital Literacy and Digital Competence, 6(2), 36–63. [Google Scholar] [CrossRef]
- Lindgren, I., Madsen, C. Ø., Hofmann, S., & Melin, U. (2019). Close encounters of the digital kind: A research agenda for the digitalization of public services. Government Information Quarterly, 36(3), 427–436. [Google Scholar] [CrossRef]
- McKinsey & Company. (2021). The future of digital innovation in China: Megatrends shaping one of the world’s fastest evolving digital ecosystems. McKinsey & Company. [Google Scholar]
- Mikalef, P., & Parmiggiani, E. (Eds.). (2022). Digital transformation in Norwegian enterprises. Springer. [Google Scholar]
- Nedelkoska, L., & Quintini, G. (2018). Automation, skills use and training. OECD Social, Employment and Migration Working Papers. No. 202. OECD Publishing. [Google Scholar]
- OECD. (2019a). Getting skills right: Future-ready adult learning systems. OECD Publishing. [Google Scholar]
- OECD. (2019b). Going digital: Shaping policies, improving lives. OECD Publishing. [Google Scholar]
- OECD. (2019c). PISA 2018 database. OECD Publishing. [Google Scholar]
- OECD. (2022). What skills and abilities can automation technologies replicate and what does it mean for workers? OECD Social, Employment and Migration Working Papers. OECD Publishing. [Google Scholar]
- OECD. (2023). PISA 2022 database. OECD Publishing. [Google Scholar]
- OECD. (2025). OECD data explorer—Education and skills. OECD.Stat. [Google Scholar]
- Ozgul, P., Fregin, M.-C., Stops, M., Janßen, S., & Levels, M. (2024). High-skilled human workers in non-routine jobs are susceptible to AI automation but wage benefits differ between occupations. arXiv, arXiv:2404.06472. [Google Scholar]
- Raj, R. (2024). National digital development strategy and its implementation in India. In D. Maiti, F. Castellacci, & A. Melchior (Eds.), Digitalization and development: India and beyond (pp. 95–112). Springer. [Google Scholar]
- Röller, L.-H., & Waverman, L. (2001). Telecommunications infrastructure and economic development: A simultaneous approach. American Economic Review, 91(4), 909–923. [Google Scholar] [CrossRef]
- Schreckling, E., & Steiger, C. (2017). Digitalize or drown. In O. Gassmann, P. Sutter, & K. Frankenberger (Eds.), Digitalization cases (pp. 1–17). Springer. [Google Scholar]
- Senor, D., & Singer, S. (2009). Start-up nation: The story of Israel’s economic miracle. Twelve. [Google Scholar]
- Suntsova, O. (2024). Digital transformation of the global economy: Challenges and opportunities. Financial and Credit Systems: Prospects for Development, 3(14), 87–100. [Google Scholar] [CrossRef]
- Škare, M., & Ribeiro Soriano, D. (2021). How globalization is changing digital technology adoption: An international perspective. Journal of Innovation & Knowledge, 6(4), 222–233. [Google Scholar]
- The Economist Intelligence Unit. (2018). The automation readiness index: Who is ready for the coming wave of automation? ABB Group. [Google Scholar]
- Tudose, M. B., Georgescu, A., & Avasilcăi, S. (2023). Global analysis regarding the impact of digital transformation on macroeconomic outcomes. Sustainability, 15(5), 4583. [Google Scholar] [CrossRef]
- United Nations Capital Development Fund. (2023). Brief: Data protection and the digital economy. UNCDF Policy Accelerator. [Google Scholar]
- United Nations Development Programme [UNDP]. (2023). From vision to action: Explaining UNDP’s digital transformation framework. UNDP. [Google Scholar]
- United Nations Development Programme [UNDP]. (2024). Human development reports—Data center: Documentation and downloads. UNDP Human Development Data Center. [Google Scholar]
- United Nations & International Labour Organization. (2024). Mind the AI divide: Shaping a global perspective on the future of work. ILO. [Google Scholar]
- Vassil, K. (2015). Estonia’s e-government ecosystem: Foundation, applications, outcomes. World Bank Group Background Paper for the World Development Report 2016: Digital Dividends. World Bank. [Google Scholar]
- Verhoef, P. C., Broekhuizen, T., Bart, Y., Bhattacharya, A., Dong, J. Q., Fabian, N., & Haenlein, M. (2021). Digital transformation: A multidisciplinary reflection and research agenda. Journal of Business Research, 122, 889–901. [Google Scholar] [CrossRef]
- Vial, G. (2019). Understanding digital transformation: A review and a research agenda. The Journal of Strategic Information Systems, 28(2), 118–144. [Google Scholar] [CrossRef]
- Vrana, J., & Singh, R. (2021). Digitization, digitalization, and digital transformation. In N. Meyendorf, N. Ida, R. Singh, & J. Vrana (Eds.), Handbook of nondestructive evaluation 4.0. Springer. [Google Scholar]
- Wachal, R. (1971). Humanities and computers: A personal view. The North American Review, 5(2), 65–71. [Google Scholar]
- World Bank. (2016). World development report 2016: Digital dividends. World Bank. [Google Scholar]
- World Economic Forum. (2024). The future of jobs report 2025. World Economic Forum. [Google Scholar]


Disclaimer/Publisher’s Note: The statements, opinions and data contained in all publications are solely those of the individual author(s) and contributor(s) and not of MDPI and/or the editor(s). MDPI and/or the editor(s) disclaim responsibility for any injury to people or property resulting from any ideas, methods, instructions or products referred to in the content. |
© 2025 by the authors. Licensee MDPI, Basel, Switzerland. This article is an open access article distributed under the terms and conditions of the Creative Commons Attribution (CC BY) license (https://creativecommons.org/licenses/by/4.0/).