
Logistic Service Improvement Parameters for Postal Service Providers Using Analytical Hierarchy Process and Quality Function Deployment


Abstract
1. Introduction
- What logistics service quality dimensions do India Post customers in southern India prioritize?
- How aligned are these customer priorities with the internal service focus of India Post?
2. Literature Review
3. Methodology
3.1. AHP and QFD
Comparative Analysis of Design and Decision-Making Frameworks
4. Results
4.1. Prioritization of Logistics Service Quality Dimensions by Customers
4.2. Prioritization of Service Parameters from the Point of View of India Post
4.3. Normalization
4.4. Consistency Check
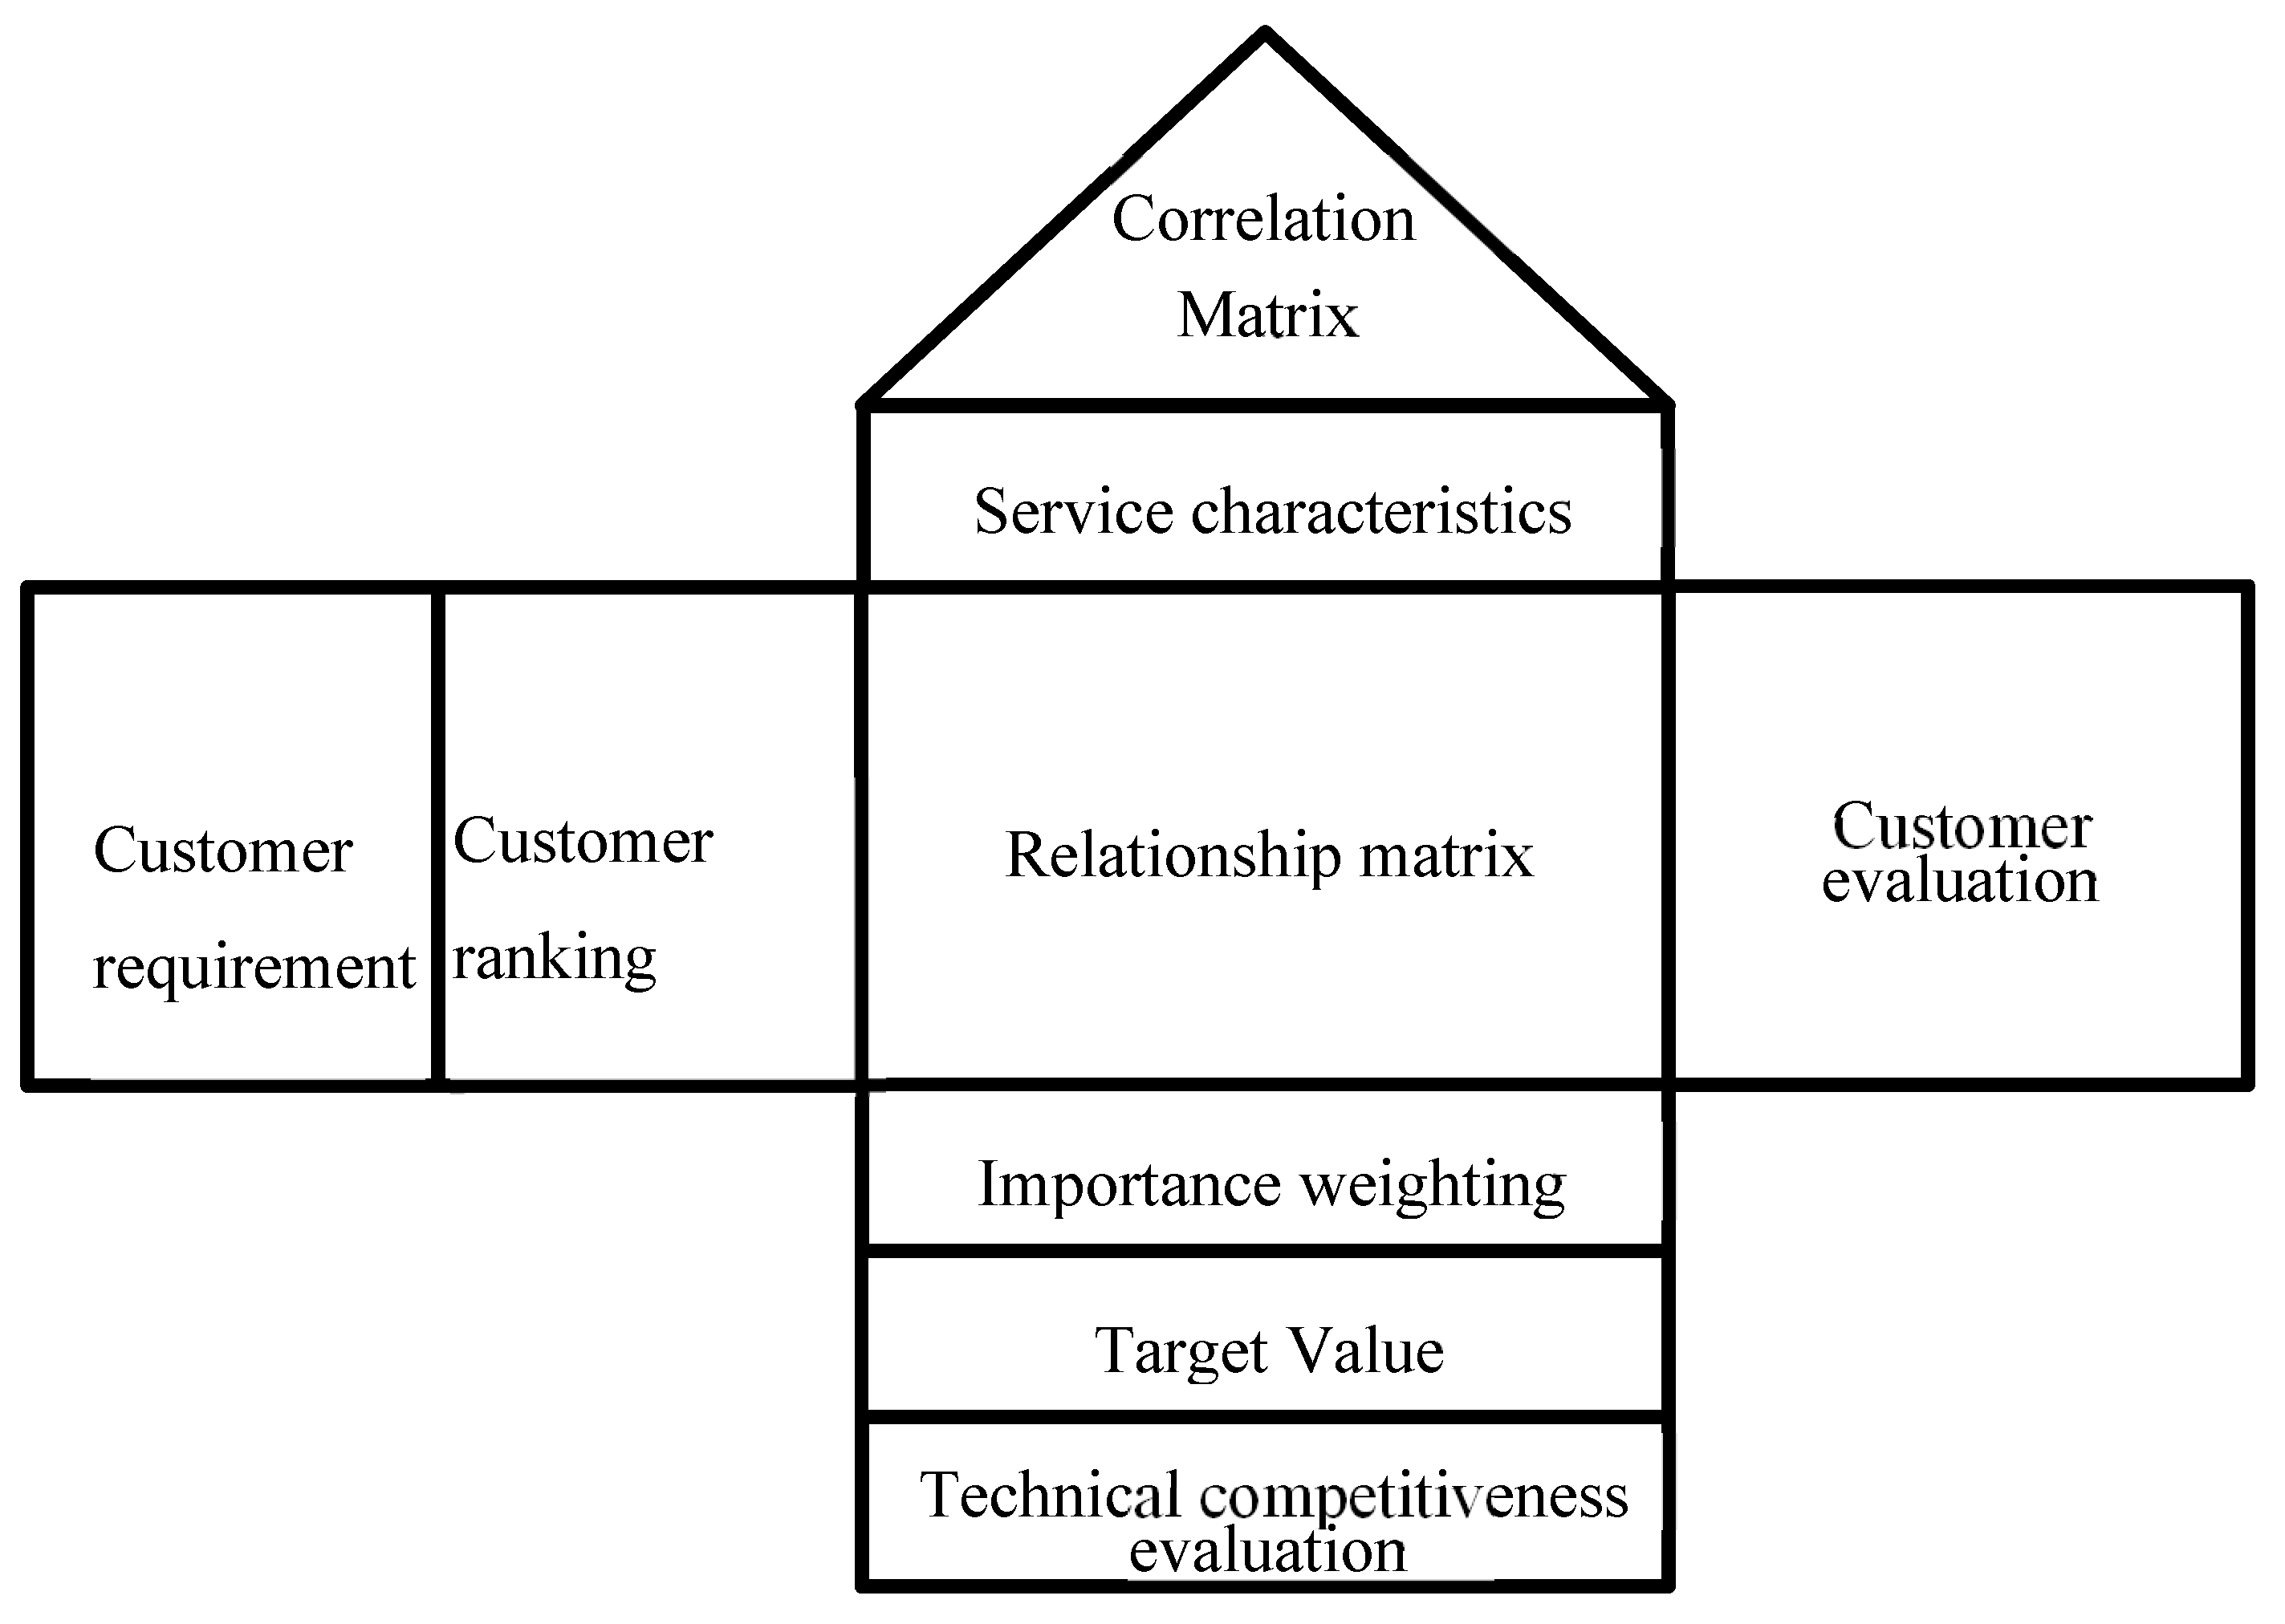
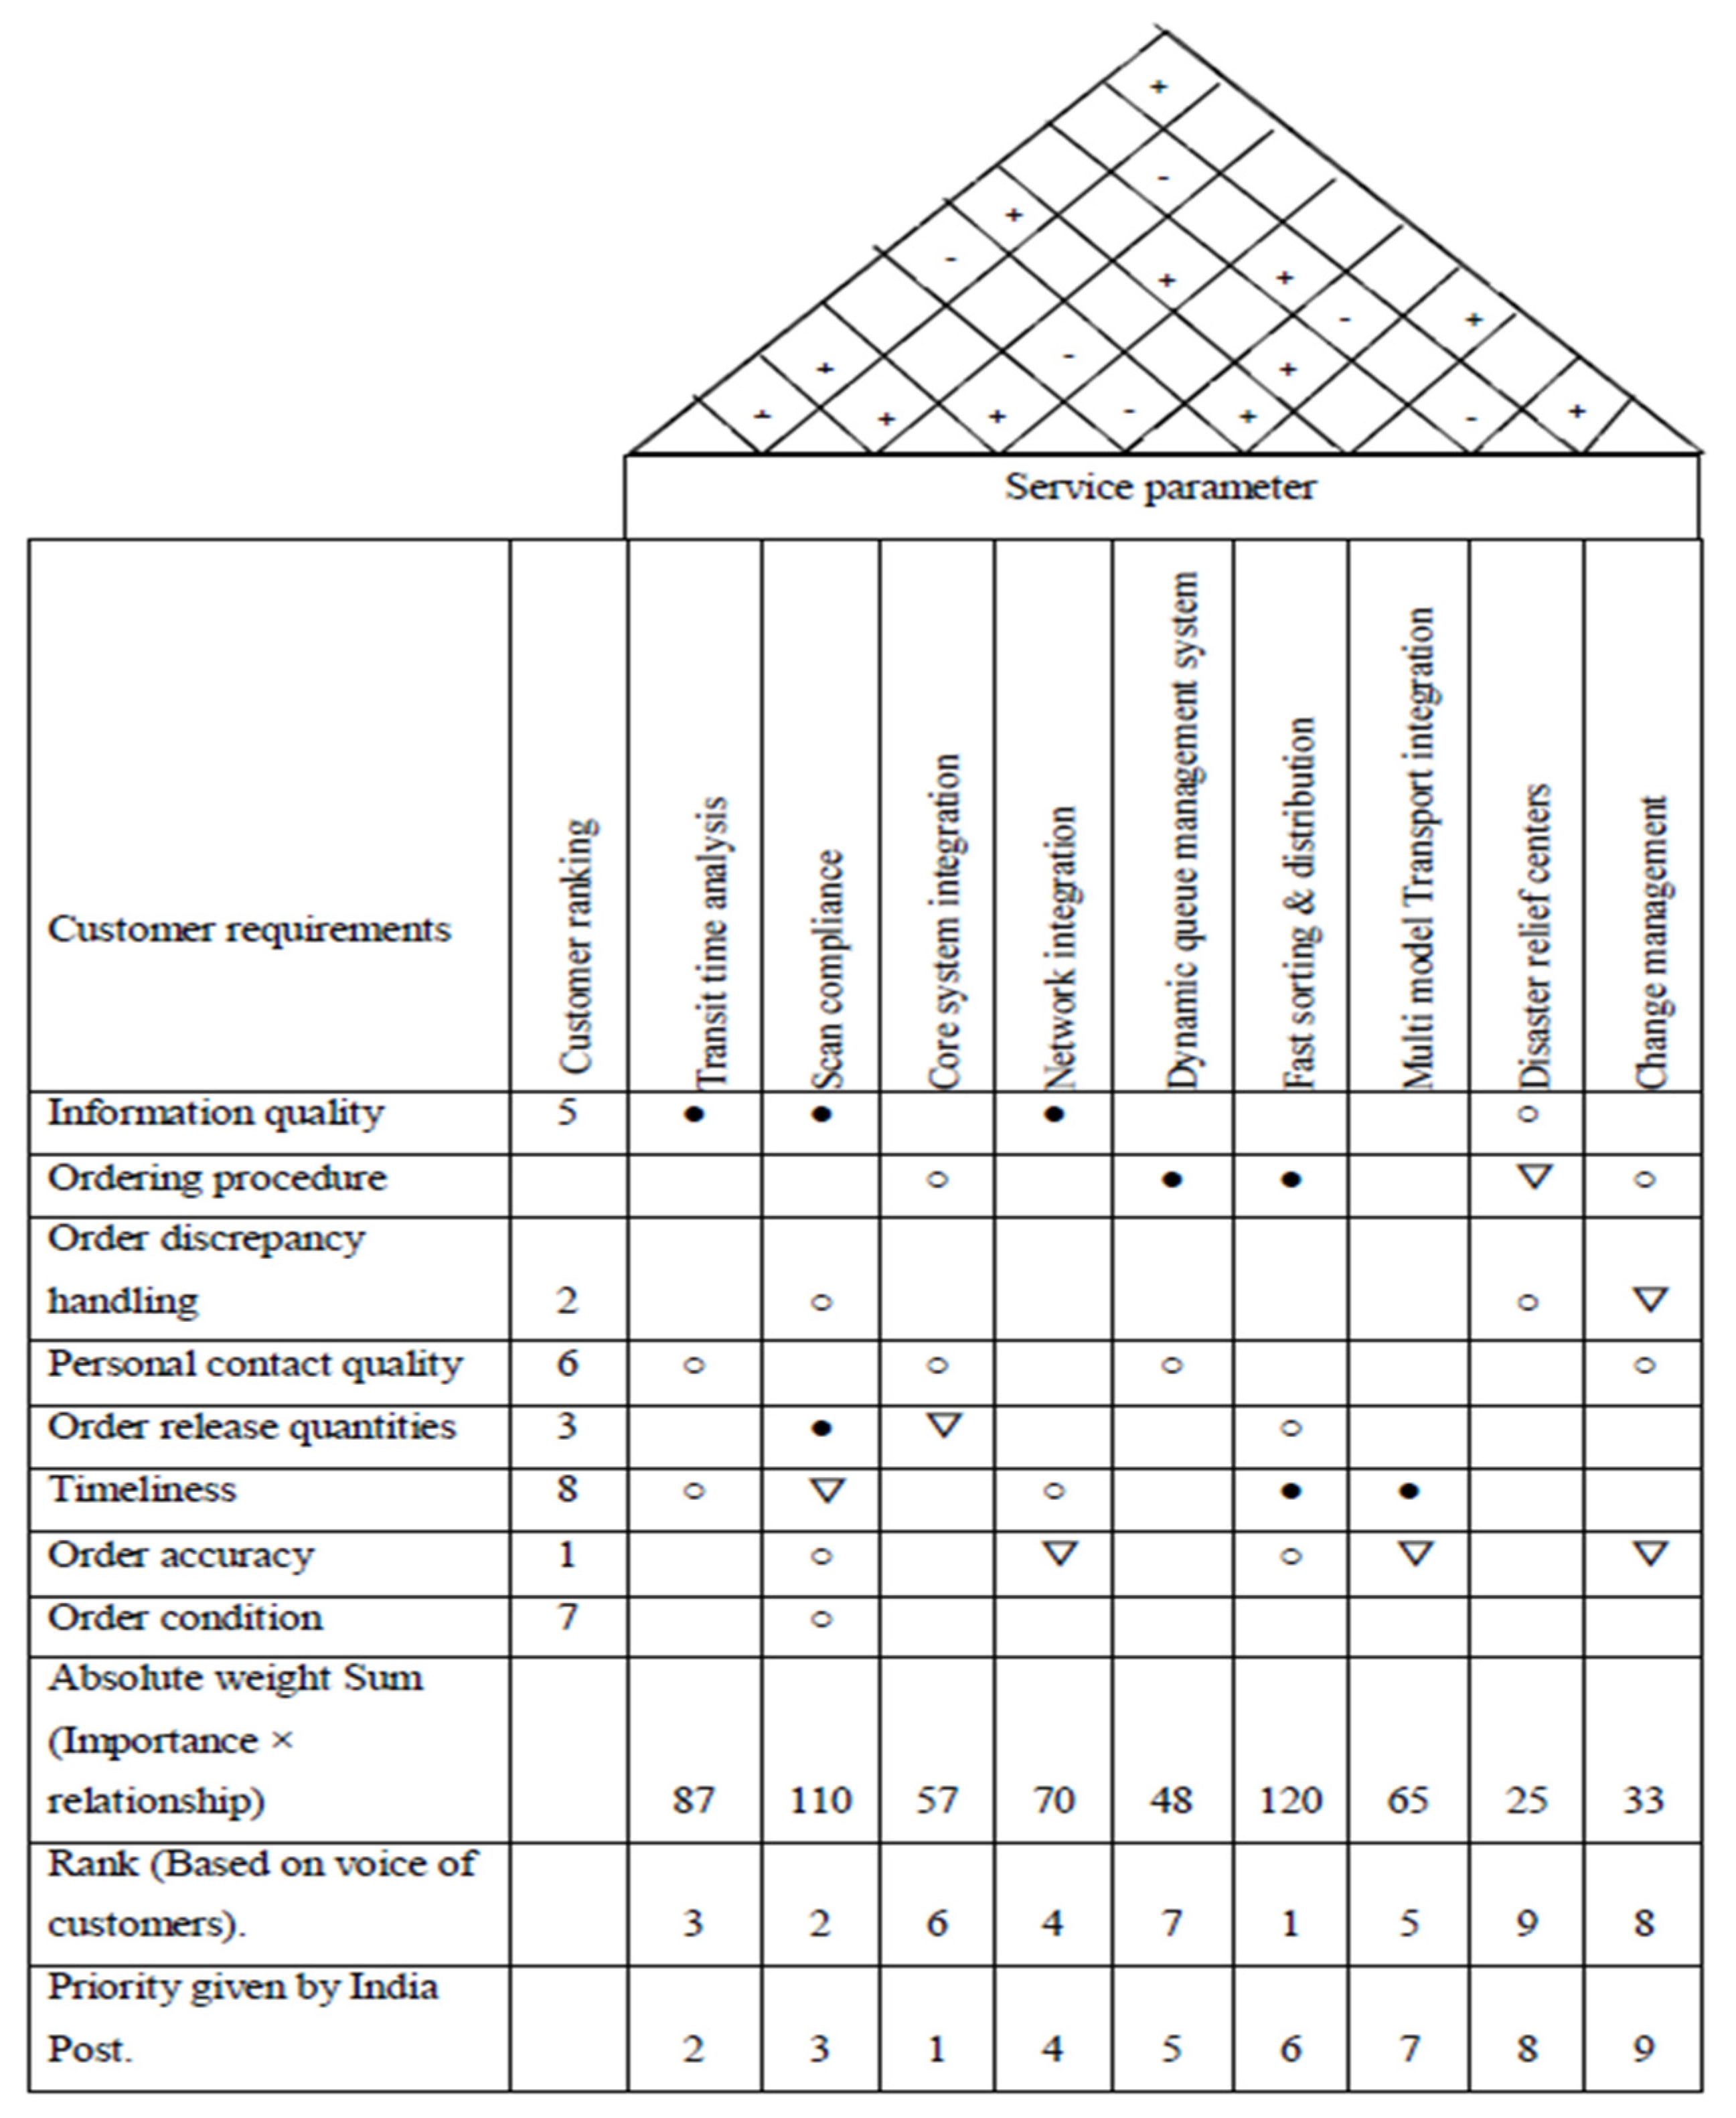
4.5. Identification of Important Service Parameters Using QFD
| ● | Strong relationship. |
| ○ | Medium relationship. |
| ▽ | Weak relationship. |
- Xi = the priority of the row item (customer need priority in the house of quality)
- aij = the strength of the relationship
5. Discussion
6. Conclusions
Author Contributions
Funding
Institutional Review Board Statement
Informed Consent Statement
Data Availability Statement
Conflicts of Interest
Abbreviations
| LSQ | Logistics service quality |
| AHP | Analytical Hierarchy Process |
| QFD | Quality Function Deployment |
| B2C | Business-to-consumer |
| B2B | Business-to-business |
| C2C | Consumer-to-consumer |
| VoC | Voice of the customer |
| IQ | Information quality |
| OP | Ordering procedures |
| OQ | Order release quantities |
| TM | Timeliness |
| OA | Order accuracy |
| OC | Order condition |
| OD | Order discrepancy handling |
| PQ | Personnel contact quality |
| CR | Consistency ratio |
| CI | Consistency index |
| RI | Random consistency index |
| HOQ | House of quality |
| FSD | Fast sorting and distribution |
| TTA | Transit time analysis |
| CSI | Core system integration |
| NI | Network integration |
| DRC | Disaster-relief centers |
| SC | Scan compliance |
| MMT | Multi-model transport integration |
| CM | Change management |
| DQM | Dynamic queue management system |
Appendix A

| Service Parameter | Definition |
|---|---|
| Fast sorting and dispatching process | The sorting process will begin as soon as the articles reach the office in which it will show the names of post offices and R.M.S. (Railway Mail Services) sections for which mail bags are to be made up and for which labelled bundles are usually prepared, and the compartments of the sorting case will be arranged and labelled accordingly. The mail bag together with the parcel bag (if any), will then be dispatched after sorting. |
| Transit time analysis | Transit time is the amount of time required for moving goods from one point to another. For India Post, it is the time taken for an item from being delivered to a post office to the time it is delivered to the addressee. Transit time analysis is performed to analyze how much time it takes for a parcel to reach the customer and to identify the reasons for the delay. |
| Core system integration | Core system integration (CSI) aims at computerizing through one central platform for all the postal, mail, and counter operations of the post offices, apart from implementing the computerization of the finance and accounts and HR functions of the department. A total of 511 divisions (499 postal and RMS divisions and 12 independent head post offices/GPOs) have been rolled out in CSI. |
| Network integration | Networking of all 155,531 post offices covering the remotest parts of the country will enable the tracking and tracing of all kinds of accountable mail and parcels in the country, in addition to providing real-time information to facilitate customer feedback and management functions. |
| Disaster-recovery centers | Disaster-recovery centers aim to help the organization to resolve data loss and recover system functionality so that it can resume its operations. Developing a plan for recovering a network becomes more complicated as the complexity of the network increases. It is important to detail the step-by-step recovery procedure, test it properly, and keep it updated. |
| Scan compliance KPI | It provides the actual number of scans available against prescribed scans and identifies the number of articles with full scans. This is being performed to reduce the flow of mail between different centers and to ensure consistency and reliability. It includes a booking scan, closing scan, bag-receiving scan at the sorting hub, bag-opening scan at the sorting hub, bag closing scan at the sorting hub, bag dispatch scan at the sorting hub, bag-receiving scan at the destination sorting hub, bag-opening scan at the destination sorting hub, bag-closing scan at the destination sorting hub, bag-dispatch scan at the destination sorting hub, bag-receiving scan at the delivery PO, and a final delivery scan for town delivery (TD) and non–town delivery (NTD). |
| Multi-model transport integration | In India Post, consignments are transmitted by road, rail, or air depending upon the requirements of the customer. As a result, the integration of various modes of transport is essential for prompt delivery. |
| Change management | The change management aims to prepare all the employees of the department to enable them to function effectively in the IT environment. Training activities are given by the department on its own. |
| Dynamic queue management system (DQMS) | The Department of Post has also installed DQMS in 263 post offices with the objective of reducing waiting time, increasing processing capacity, reducing miscommunications among customers, and matching customer needs and service, to give a comfort level to the staff and customers, to track staff performance based on reports, and to monitor customer flow. |
| N | 1 | 2 | 3 | 4 | 5 | 6 | 7 | 8 | 9 | 10 |
|---|---|---|---|---|---|---|---|---|---|---|
| RI | 0 | 0 | 0.58 | 0.9 | 1.1.2 | 1.24 | 1.32 | 1.41 | 1.45 | 1.49 |
| FSD | TTA | CSI | NI | DRC | SC | MMT | CM | DQMS | |
|---|---|---|---|---|---|---|---|---|---|
| FSD | 1 | 0.33 | 0.14 | 0.12 | 2 | 0.11 | 3 | 7 | 0.5 |
| TTA | 3 | 1 | 1 | 0.5 | 5 | 0.17 | 4 | 9 | 3 |
| CSI | 7 | 1 | 1 | 1 | 9 | 0.5 | 7 | 9 | 4 |
| NI | 8 | 2 | 1 | 1 | 7 | 1 | 4 | 6 | 5 |
| DRC | 0.5 | 0.2 | 0.11 | 0.14 | 1 | 0.12 | 1 | 5 | 0.33 |
| SC | 9 | 6 | 2 | 1 | 8 | 1 | 6 | 9 | 4 |
| MMT | 0.33 | 0.25 | 0.14 | 0.25 | 1 | 0.17 | 1 | 2 | 0.25 |
| CM | 0.14 | 0.11 | 0.11 | 0.17 | 0.2 | 0.11 | 0.5 | 1 | 0.14 |
| DQMS | 2 | 0.33 | 0.25 | 0.2 | 3 | 0.25 | 4 | 7 | 1 |
| Service Parameter | Row Total | Normalized Weight |
|---|---|---|
| Fast sorting and distribution | 0.616191 | 0.04 |
| Transit time analysis | 1.72846 | 0.13 |
| Core system integration | 2.712072 | 0.20 |
| Network integration | 2.875484 | 0.21 |
| Disaster-relief centers | 0.406775 | 0.03 |
| Scan compliance | 3.851794 | 0.28 |
| Multi-model transport | 0.397084 | 0.03 |
| Change management | 0.196833 | 0.01 |
| Dynamic queue management system | 0.960072 | 0.07 |
| Total | 13.74476 | 1 |
| Service Parameters | Maximum Eigen Value | |
|---|---|---|
| Fast sorting and distribution | 0.451 | 0.451/0.045 = 10.058 |
| Transit time analysis | 1.212 | 1.212/0.126 = 9.636 |
| Core system integration | 1.863 | 1.863/0.197 = 9.442 |
| Network integration | 2.055 | 2.055/0.209 = 9.822 |
| Disaster-relief centers | 0.285 | 0.285/0.030 = 9.641 |
| Scan compliance | 2.860 | 2.860/0.280 = 10.207 |
| Multi-model transport integration | 0.278 | 0.278/0.029 = 9.636 |
| Change management | 0.153 | 0.153/0.014 = 10.661 |
| Dynamic queue management system | 0.667 | 0.667/0.070 = 9.547 |
| FSD | TTA | CSI | NI | DRC | SC | MMT | CM | DQMS | |
|---|---|---|---|---|---|---|---|---|---|
| FSD | 1 | 0.33 | 0.11 | 2 | 7 | 0.5 | 3 | 4 | 0.5 |
| TTA | 3 | 1 | 0.33 | 7 | 9 | 5 | 6 | 9 | 1 |
| CSI | 9 | 3 | 1 | 5 | 9 | 2 | 7 | 9 | 2 |
| NI | 0.5 | 0.14 | 0.2 | 1 | 3 | 0.25 | 3 | 8 | 0.2 |
| DRC | 0.14 | 0.11 | 0.11 | 0.33 | 1 | 0.12 | 1 | 2 | 0.12 |
| SC | 2 | 0.2 | 0.5 | 4 | 8 | 1 | 4 | 8 | 0.5 |
| MMT | 0.33 | 0.17 | 0.14 | 0.33 | 1 | 0.25 | 1 | 3 | 0.2 |
| CM | 0.25 | 0.11 | 0.11 | 0.12 | 0.5 | 0.12 | 0.33 | 1 | 0.14 |
| DQMS | 2 | 1 | 0.5 | 5 | 8 | 2 | 5 | 7 | 1 |
| Service Parameter | Row Total | Normalized Weight |
|---|---|---|
| Fast sorting and distribution | 1.0480 | 0.076 |
| Transit time analysis | 2.9484 | 0.214 |
| Core system integration | 4.0696 | 0.295 |
| Network integration | 0.7175 | 0.052 |
| Disaster-relief centers | 0.2934 | 0.021 |
| Scan compliance | 1.6725 | 0.121 |
| Multi-model transport integration | 0.4179 | 0.030 |
| Change management | 0.2156 | 0.016 |
| Dynamic queue management system | 2.4156 | 0.175 |
| Total | 13.798 | 1 |
| Service Parameters | Maximum Eigen Value | |
|---|---|---|
| Fast sorting and distribution | 0.733 | 0.733/0.076 = 9.654 |
| Transit time analysis | 2.198 | 2.198/0.214 = 10.285 |
| Core system integration | 3.016 | 3.016/0.295 = 10.226 |
| Network integration | 0.524 | 0.524/0.052 = 10.074 |
| Disaster-relief centers | 0.202 | 0.202/0.021= 9.505 |
| Scan compliance | 1.175 | 1.175/0.121 = 9.695 |
| Multi-model transport integration | 0.284 | 0.284/0.030 = 9.363 |
| Change management | 0.156 | 0.156/0.016 = 10.015 |
| Dynamic queue management system | 1.621 | 1.621/0.175 = 9.262 |
| FSD | TTA | CSI | NI | DRC | SC | MMT | CM | DQMS | |
|---|---|---|---|---|---|---|---|---|---|
| FSD | 1 | 0.11 | 0.2 | 0.12 | 4 | 0.17 | 2 | 3 | 0.5 |
| TTA | 9 | 1 | 3 | 7 | 9 | 3 | 8 | 9 | 6 |
| CSI | 5 | 0.33 | 1 | 3 | 5 | 0.5 | 7 | 8 | 4 |
| NI | 8 | 0.14 | 0.33 | 1 | 6 | 0.5 | 5 | 7 | 4 |
| DRC | 0.25 | 0.11 | 0.2 | 0.17 | 1 | 0.12 | 0.5 | 2 | 0.33 |
| SC | 6 | 0.33 | 2 | 2 | 8 | 1 | 5 | 8 | 6 |
| MMT | 0.5 | 0.12 | 0.14 | 0.2 | 2 | 0.2 | 1 | 3 | 0.5 |
| CM | 0.33 | 0.11 | 0.12 | 0.14 | 0.5 | 0.12 | 0.33 | 1 | 0.14 |
| DQMS | 2 | 0.17 | 0.25 | 0.25 | 3 | 0.17 | 2 | 7 | 1 |
| Service Parameter | Row Total | Normalized Weight |
|---|---|---|
| Fast sorting and distribution | 0.5596 | 0.039 |
| Transit time analysis | 5.0677 | 0.349 |
| Core system integration | 2.4129 | 0.166 |
| Network integration | 1.7516 | 0.121 |
| Disaster-relief centers | 0.3218 | 0.022 |
| Scan compliance | 2.9152 | 0.201 |
| Multi-model transport integration | 0.4646 | 0.032 |
| Change management | 0.2284 | 0.016 |
| Dynamic queue management system | 0.8110 | 0.056 |
| Total | 14.5328 | 1 |
| Service Parameter | Maximum Eigen Value | |
|---|---|---|
| Fast sorting and distribution | 0.386 | 0.386/0.039 = 10.029 |
| Transit time analysis | 3.570 | 3.570/0.349 = 10.238 |
| Core system integration | 1.619 | 1.619/0.166 = 9.751 |
| Network integration | 1.258 | 1.258/0.121 = 10.441 |
| Disaster-relief centers | 0.214 | 0.214/0.022 = 9.651 |
| Scan compliance | 1.917 | 1.917/0.201 = 9.558 |
| Multi-model transport integration | 0.300 | 0.300/0.032 = 9.381 |
| Change management | 0.157 | 0.157/0.016 = 9.996 |
| Dynamic queue management system | 0.538 | 0.538/0.056 = 9.645 |
References
- Abdu, B., James, N., & Nathan, R. J. (2024). Reimagining last-mile delivery: Leveraging put-to-light systems in micro fulfillment centers. Polish Journal of Management Studies, 30(1), 7–23. [Google Scholar] [CrossRef]
- Alsaadi, M. R., Ahmad, S. Z., & Hussain, M. (2018). A quality function deployment strategy for improving mobile-government service quality in the Gulf cooperation council countries. Benchmarking: An International Journal, 25(8), 3276–3295. [Google Scholar] [CrossRef]
- Apichonbancha, P., Lin, R. H., & Chuang, C. L. (2024). Integration of principal component analysis with AHP-QFD for improved product design decision-making. Applied Sciences, 14(14), 5976. [Google Scholar] [CrossRef]
- Baláž, M., Vaculík, J., & Corejova, T. (2024). Evaluation of the impact of the internet of things on postal service efficiency in Slovakia. Economies, 12, 271. [Google Scholar] [CrossRef]
- Basílio, M. P., Pereira, V., Costa, H. G., Santos, M., & Ghosh, A. (2022). A systematic review of the applications of multi-criteria decision aid methods (1977–2022). Electronics, 11(11), 1720. [Google Scholar] [CrossRef]
- Bossert, J. L. (2021). Quality function deployment: The practitioner’s approach. CRC Press. [Google Scholar]
- Buakum, D., Daesa, C., Sinthavalai, R., & Noppasri, K. (2024). Designing temperature-controlled medicine bag using an integrated AHP-QFD methodology. International Journal on Interactive Design and Manufacturing (IJIDeM), 18(2), 659–670. [Google Scholar] [CrossRef]
- Cognitive Market Research. (2024). Parcel delivery market size, share & trends analysis report. Available online: https://www.cognitivemarketresearch.com/ (accessed on 12 December 2024).
- Çetin, A. Y., & Ucler, C. (2023). Customer-focused aircraft seat design: A case study with AHP-QFD. Aviation, 27(4), 225–233. [Google Scholar] [CrossRef]
- Do, A. D., Ta, V. L., Bui, P. T., Do, N. T., Dong, Q. T., & Lam, H. T. (2023). The impact of the quality of logistics services in E-commerce on the satisfaction and loyalty of generation Z customers. Sustainability, 15(21), 15294. [Google Scholar] [CrossRef]
- e Costa, C. A. B., & Vansnick, J. C. (2008). A critical analysis of the eigenvalue method used to derive priorities in AHP. European Journal of Operational Research, 187(3), 1422–1428. [Google Scholar] [CrossRef]
- Fehlmann, M., & Glenn, T. (2016, August 4–7). Using AHP in QFD—The impact of the new ISO 16355 standard. The International Symposium on the Analytic Hierarchy Process (Vol. 10, ), London, UK. [Google Scholar] [CrossRef]
- Griffin, A., & Hauser, J. R. (1993). The voice of the customer. Marketing Science, 12(1), 1–27. [Google Scholar] [CrossRef]
- Gulc, A. (2021). Multi-stakeholder perspective of courier service quality in B2C e-commerce. PLoS ONE, 16(5), e0251728. [Google Scholar] [CrossRef] [PubMed]
- Hariri, A., Domingues, P., & Sampaio, P. (2023). Integration of multi-criteria decision-making approaches adapted for quality function deployment: An analytical literature review and future research agenda. International Journal of Quality & Reliability Management, 40(10), 2326–2350. [Google Scholar]
- IBISWorld. (2024). Couriers & local delivery services in the US—Industry market research report. Available online: https://www.ibisworld.com/united-states/industry/couriers-local-delivery-services/1950/ (accessed on 3 March 2025).
- India Post. (2021). 2021 annual report of the India post. Available online: https://www.indiapost.gov.in/VAS/DOP_PDFFiles/AnnualReportEng2021_22.pdf (accessed on 6 June 2024).
- India Post. (2022). Postal manual, volume VII, railway mail service, ninth edition. Available online: https://www.indiapost.gov.in/VAS/DOP_RTI/PM_VOL_7.pdf (accessed on 6 June 2024).
- International Post Corporation. (2024). IPC global postal industry report 2024. Available online: https://www.ipc.be/ (accessed on 3 March 2025).
- James, N., Loganathan, S., Nathan, R. J., Victor, V., & Ng, P. K. (2023). Integrated fuzzy AHP and TOPSIS as innovative student selection methodology at institutions of higher learning. Human Systems Management, 42, 179–191. [Google Scholar] [CrossRef]
- Jazzaa, S. F. (2024). The role of value engineering in reducing the costs of failure and achieving competitive advantage. TechHub Journal, 7, 218–236. [Google Scholar]
- Joseph, B. M., & James, N. (2018). A hybrid AHP and Taguchi loss function method for supplier selection. Journal of Supply Chain Management Systems, 7(4), 20–30. [Google Scholar]
- Kapuria, T. K., & Karmaker, C. L. (2018). Customer driven quality improvement of jute yarn using AHP-based QFD as a case study. International Journal for Quality Research, 12(1), 63–80. [Google Scholar] [CrossRef]
- Kavitha, K., Suma, D., & Mamatha, A. (2023). Technological evolution of postal services in India. Available online: https://ssrn.com/abstract=4604584 (accessed on 6 June 2024). [CrossRef]
- Killen, C. P., Walker, M., & Hunt, R. A. (2005). Strategic planning using QFD. International Journal of Quality & Reliability Management, 22(1), 17–29. [Google Scholar] [CrossRef]
- Kováčiková, K., Baláž, M., Kováčiková, M., & Novák, A. (2023). Comparison of mobile applications of selected postal operators in Slovakia. Transportation Research Procedia, 74, 262–266. [Google Scholar] [CrossRef]
- Köksal, G., & Eğïtman, A. (1998). Planning and design of industrial engineering education quality. Computers & Industrial Engineering, 35(3–4), 639–642. [Google Scholar]
- Lam, K., & Zhao, X. (1998). An application of quality function deployment to improve the quality of teaching. International Journal of Quality & Reliability Management, 15(4), 389–413. [Google Scholar] [CrossRef]
- Li, J., Peng, X., Li, C., Luo, Q., Peng, S., Tang, H., & Tang, R. (2023). Renovation of traditional residential buildings in Lijiang based on AHP-QFD methodology: A case study of the Wenzhi Village. Buildings, 13(8), 2055. [Google Scholar] [CrossRef]
- Lin, X., Mamun, A. A., Yang, Q., & Masukujjaman, M. (2023). Examining the effect of logistics service quality on customer satisfaction and re-use intention. PLoS ONE, 18(5), e0286382. [Google Scholar] [CrossRef] [PubMed]
- Liu, W., Li, Y., & Cai, J. (2024). Research on aging design of passenger car center control interface based on Kano/AHP/QFD models. Electronics, 13(24), 5004. [Google Scholar] [CrossRef]
- Loya, D., Mate, P., & Kane, P. (2023). Service quality analysis using quality function deployment for two-wheeler service center. Materials Today: Proceedings, 82, 351–355. [Google Scholar] [CrossRef]
- Madzík, P., Shahin, A., Zimon, D., & Yadav, N. (2024). Requirements classification in Kano Model–from strict categories to satisfaction and dissatisfaction potential. Total Quality Management & Business Excellence, 35(11–12), 1418–1438. [Google Scholar]
- Maritan, D., & Panizzolo, R. (2009). Identifying business priorities through quality function deployment: Insights from a case study. Marketing Intelligence & Planning, 27(5), 714–728. [Google Scholar] [CrossRef]
- McKinsey & Company. (2023). What do US consumers want from e-commerce deliveries? Available online: https://www.mckinsey.com/industries/logistics/our-insights/what-do-us-consumers-want-from-e-commerce-deliveries (accessed on 3 March 2025).
- Mentzer, J. T., Flint, D. J., & Hult, G. T. M. (2001). Logistics service quality as a segment-customized process. Journal of Marketing, 65(4), 82–104. [Google Scholar] [CrossRef]
- Mentzer, J. T., Flint, D. J., & Kent, J. L. (1999). Developing a logistics service quality scale. Journal of Business Logistics, 20(1), 9–32. [Google Scholar]
- Natarajan, T., & Pichai, S. (2024). Behaviour-driven development and metrics framework for enhanced agile practices in scrum teams. Information and Software Technology, 170, 107435. [Google Scholar] [CrossRef]
- Naz, F., Alshaabani, A., Rudnák, I., & Magda, R. (2021). Role of service quality in improving customer loyalty towards telecom companies in Hungary during the COVID-19 pandemic. Economies, 9, 200. [Google Scholar] [CrossRef]
- Noordin, A., Hasnan, N., & Osman, H. (2012). Service innovation of postal and courier services in Malaysia: Will it lead to customer responsiveness. International Proceedings of Economics Development & Research, 42, 205–209. [Google Scholar]
- Paltayian, G., Georgiou, A., & Gotzamani, K. (2024). A combined QFD-AHP decision-making tool for the investigation and improvement of e-banking usage. International Journal of Quality & Reliability Management, 41(1), 150–172. [Google Scholar]
- Parasuraman, A., Zeithaml, V. A., & Berry, L. L. (1985). A conceptual model of service quality and its implications for future research. Journal of Marketing, 49(4), 41–50. [Google Scholar] [CrossRef]
- Rafiq, M., & Jaafar, H. S. (2007). Measuring customers’ perceptions of logistics service quality of 3PL service provider. Journal of Business Logistics, 28(2), 159–175. [Google Scholar] [CrossRef]
- Rajendran, S., Srinivas, S., & Pagel, E. (2023). Mining voice of customers and employees in insurance companies from online reviews: A text analytics approach. Benchmarking: An International Journal, 30(1), 1–22. [Google Scholar] [CrossRef]
- Restuputri, D. P., Indriani, T. R., & Masudin, I. (2021). The effect of logistic service quality on customer satisfaction and loyalty using Kansei engineering during the COVID-19 pandemic. Cogent Business & Management, 8(1), 1906492. [Google Scholar] [CrossRef]
- Revelle, J. B., Moran, J. W., & Cox, C. A. (1998). The QFD handbook. John Wiley & Sons. [Google Scholar]
- Rong, H., Liu, W., Li, J., & Zhou, Z. (2024). Product innovation design process combined Kano and TRIZ with AD: Case study. PLoS ONE, 19(3), e0296980. [Google Scholar] [CrossRef]
- Saaty, T. L. (1970). Optimization in integers and related external problems. McGraw-Hill. [Google Scholar]
- Saaty, T. L. (1980). The analytic hierarchy process. In Agricultural economics review (Vol. 70, p. 34). McGraw Hill. [Google Scholar] [CrossRef]
- Sangeetha, T., & Subatra, B. (2023). A machine learning-based assessments of customer satisfaction levels in Indian postal services (ML-ACSLIPS) for selected Tamilnadu districts from social media content. International Journal of Financial Engineering, 10(04), 2350029. [Google Scholar] [CrossRef]
- Schlott, C. K. (2024). Design thinking and teamwork—Measuring impact: A systematic literature review. Journal of Organization Design, 13, 163–196. [Google Scholar] [CrossRef]
- Sharma, J., & Tripathy, B. B. (2023). An integrated QFD and fuzzy TOPSIS approach for supplier evaluation and selection. The TQM Journal, 35(8), 2387–2412. [Google Scholar] [CrossRef]
- Statista. (2024). Logistics industry—Market size 2028. Available online: https://www.statista.com/statistics/943517/logistics-industry-global-cagr/ (accessed on 17 March 2025).
- Tang, R. Q., Tan, Y. J., Tan, Z. X., Tan, Y. T., Almawad, G., & Alosaimi, A. (2022). A study of courier service quality and customer satisfaction. International Journal of Applied Business and International Management, 7(1), 137–150. [Google Scholar] [CrossRef]
- Universal Postal Union. (2024). State of the postal sector 2024. Available online: https://www.upu.int/ (accessed on 17 March 2025).
- Vairaktarakis, G. L. (1999). Optimization tools for design and marketing of new/improved products using the house of quality. Journal of Operations Management, 17(6), 645–663. [Google Scholar] [CrossRef]
- Zhou, J., Shen, Y., Pantelous, A., & Liu, Y. (2022). Quality function deployment: A bibliometric-based overview. IEEE Transactions on Engineering Management, 71, 1180–1201. [Google Scholar] [CrossRef]
| Source | Projected CAGR (2023–2030) |
|---|---|
| Cognitive Market Research (2024) | 4.6% |
| Statista (2024) | 4.8% |
| McKinsey & Company (2023) | 4.5–5.0% |
| IBISWorld (2024) | 4.7% |
| Parameters of Logistics Service Quality | Definition |
|---|---|
| Timeliness | Whether orders arrive at the customer location as promised |
| Information quality | The usefulness of the information the consumer can obtain from the personnel of the courier and even from the couriers |
| Ordering procedures | Efficiency and effectiveness of the procedure followed by the organization in making a delivery to the customer |
| Personnel contact quality | Interaction between customers and courier personnel |
| Order accuracy | Precision of how the items will arrive to the hands of the customer |
| Order condition | Lack of damage to orders |
| Order discrepancy handling | How well the courier services address any discrepancies in products after they arrive |
| Order release quantities | Alternative options given by the courier services in sending a different quantity of goods |
| Model | Key Features | Suitability for This Study |
|---|---|---|
| Design Thinking | Empathy-driven, iterative, human-centric | Moderate—good for ideation, not prioritization |
| Kano Model | Classifies customer preferences into categories | Complementary but not comprehensive |
| AHP-QFD (Selected Model) | Prioritizes and translates customer needs into technical requirements | High—aligns directly with study objectives |
| Value Engineering | Systematic approach to improving value by analyzing function and cost | Low—less applicable to LSQ |
| TRIZ | Problem-solving based on patterns of invention | Low—good for innovation, not prioritization |
| Agile/Scrum | Iterative product development methodology | Low—not aligned with postal service context |
| Weight | 8 | 7 | 6 | 5 | 4 | 3 | 2 | 1 | Weighted Average Score |
|---|---|---|---|---|---|---|---|---|---|
| LSQ Dimensions | Rank 1 | Rank 2 | Rank 3 | Rank 4 | Rank 5 | Rank 6 | Rank 7 | Rank 8 | |
| IQ | 26 | 27 | 17 | 90 | 45 | 15 | 21 | 14 | 4.824 |
| OP | 20 | 28 | 37 | 18 | 15 | 95 | 27 | 15 | 4.243 |
| OD | 30 | 24 | 14 | 13 | 24 | 19 | 28 | 103 | 3.408 |
| PQ | 16 | 35 | 83 | 23 | 29 | 40 | 17 | 12 | 4.973 |
| OQ | 21 | 14 | 24 | 25 | 91 | 27 | 20 | 33 | 4.129 |
| TM | 91 | 33 | 21 | 35 | 21 | 15 | 19 | 20 | 5.675 |
| OA | 19 | 20 | 11 | 27 | 11 | 29 | 96 | 42 | 3.365 |
| OC | 32 | 74 | 48 | 24 | 19 | 15 | 27 | 16 | 5.384 |
| Intensity | Definition |
|---|---|
| 1 | Equal importance |
| 3 | Moderate importance |
| 5 | Strong importance |
| 7 | Very strong importance |
| 9 | Extreme importance |
| 2, 4, 6, 8 | Intermediate values |
| Service Parameter | Geometric Mean of Normalized Weights | Ranks |
|---|---|---|
| Fast sorting and distribution (FSD) | 0.051 | 6 |
| Transit time analysis (TTA) | 0.211 | 2 |
| Core system integration (CSI) | 0.213 | 1 |
| Network integration (NI) | 0.109 | 4 |
| Disaster-relief centers (DRC) | 0.024 | 8 |
| Scan compliance (SC) | 0.190 | 3 |
| Multi-model transport integration (MMT) | 0.030 | 7 |
| Change management (CM) | 0.015 | 9 |
| Dynamic queue management system (DQM) | 0.088 | 5 |
Disclaimer/Publisher’s Note: The statements, opinions and data contained in all publications are solely those of the individual author(s) and contributor(s) and not of MDPI and/or the editor(s). MDPI and/or the editor(s) disclaim responsibility for any injury to people or property resulting from any ideas, methods, instructions or products referred to in the content. |
© 2025 by the authors. Licensee MDPI, Basel, Switzerland. This article is an open access article distributed under the terms and conditions of the Creative Commons Attribution (CC BY) license (https://creativecommons.org/licenses/by/4.0/).
Share and Cite
James, N.; Kumar, A.K.P.; Nathan, R.J. Logistic Service Improvement Parameters for Postal Service Providers Using Analytical Hierarchy Process and Quality Function Deployment. Economies 2025, 13, 120. https://doi.org/10.3390/economies13050120
James N, Kumar AKP, Nathan RJ. Logistic Service Improvement Parameters for Postal Service Providers Using Analytical Hierarchy Process and Quality Function Deployment. Economies. 2025; 13(5):120. https://doi.org/10.3390/economies13050120
Chicago/Turabian StyleJames, Nisa, Anish K. P. Kumar, and Robert Jeyakumar Nathan. 2025. "Logistic Service Improvement Parameters for Postal Service Providers Using Analytical Hierarchy Process and Quality Function Deployment" Economies 13, no. 5: 120. https://doi.org/10.3390/economies13050120
APA StyleJames, N., Kumar, A. K. P., & Nathan, R. J. (2025). Logistic Service Improvement Parameters for Postal Service Providers Using Analytical Hierarchy Process and Quality Function Deployment. Economies, 13(5), 120. https://doi.org/10.3390/economies13050120