1. Introduction
Over the last 20 years, the rapid pace of technological change has transformed labor markets, reshaping skill requirements and workforce dynamics in an unprecedent way. Nonetheless, the impact of technology adoption on workforce demand at the company level can result in job loss due to automation. However, it can also create new jobs through the uptake of new technologies, development of new products and services and increased demand for products and services, or due to the emergence of heavy industries (
Acemoglu & Restrepo, 2020).
As new technologies become much more affordable, organizations remained competitive, yet their ability to align workforce capabilities with these technological demands varies significantly from country to country, from one sector of activity to another, and from company to company. Although existing research has addressed the effects of digitalization on labor markets, there is a gap in understanding the association between company-level technology adoption and employment outcomes.
This study aims to address this gap in research by using latent class analysis (LCA) to identify the distinct typologies of companies based on their level of technology adoption, innovation practices, employment patterns and other key characteristics. LCA is a powerful methodological instrument for revealing hidden subgroups within a population, thus allowing us to explore simple correlations to identify complex, multidimensional patterns of behavior within European companies.
Drawing on data from the European Company Survey (2019), conducted by the European Foundation for the Improvement of Living and Working Conditions (Eurofound) and European Center for the Development of Vocational Training (Cedefop), our analysis is based on 21,869 managers’ responses to a standardized survey from subsidiary sites of multi-site companies across the EU-27 and the United Kingdom. This rich dataset provides valuable understanding of employment patterns, innovation strategies and approaches to skill development and digitalization, offering a great outlook into European companies’ behaviors in the digital era.
Our research questions are the following:
- Q1.
What are the key typologies of companies that can be identified based on their approach to digitalization, innovation and international market exposure and combined characteristics such as size, sector and country of residence?
- Q2.
How do the identified typologies interact with the companies’ approaches to present and future employment changes and staff training?
Since the beginning of the First Industrial Revolution in 1750, jobs and people’s lifestyles have been threatened by machines, which have the potential to replace them. Job loss and the lack of the capacity to adapt to technological advancements are among the greatest fears individuals face (
Kozak et al., 2020).
Every industrial revolution has brought high uncertainty and fears related to jobs becoming obsolete. John Maynard Keynes even predicted that jobs automation would lead to the famous ‘technical unemployment’ (
Keynes, 1931). Nevertheless, these fears have been rapidly abandoned, as evidence shows that technology and innovation have great potential to create new industries and jobs while making older sectors obsolete. The scientific literature was dominated by these concepts, built around the well-known theories of ‘creative destruction’ (
Schumpeter, 1942) and ‘compensation theory’ (
Marx, 1867).
Within the context of the Fourth Industrial Revolution, which brought about an exponential pace of technological development, various questions arose: Is this time any different? Will robots steal jobs (
Acemoglu & Restrepo, 2020)? Will advances in artificial intelligence and automation lead to important job losses (e.g.,
Brynjolfsson & McAfee, 2014;
Ford, 2015)?
The emerging scientific literature highlights that organizations with higher levels of technology adoption often demonstrate a greater propensity for increased productivity, innovation and workforce skilling (
Bartel et al., 2007). Conversely, low levels of technological integration have been associated with job polarization, favoring the allocation of low-paid routine tasks to the service sector (
Autor & Dorn, 2013;
Obadic, 2020).
While the future of labor is uncertain (
World Bank, 2019), research highlights that the increased use of digital technologies in companies is associated with a growth in the number of employees or positive future employment prospects (
García-Romanos & Martínez-Ros, 2024). Various scientific opinions have emerged in this regard. On the one hand, according to creative destruction theory, innovation is considered to eliminate old jobs but creates new, higher-value roles, resulting in a net positive impact (
Mastrostefano & Pianta, 2009). Likewise, innovation leads to job creation through increased firm productivity and expansion (
Blanchflower & Burgess, 1999;
Van Reenen, 1997). In addition, the rise of digital industries creates jobs in new sectors; thus, digitalization has contributed to the emergence of entirely new industries, creating millions of jobs in fields such as programming and data analysis (
Acemoglu & Restrepo, 2020). Finally, digitalization is flexible, facilitating job creation across diverse industries, including services, by enabling efficiency and new tasks (
Brynjolfsson & McAfee, 2014). For instance, digitalization has a small but positive net effect on employment when it is evaluated across the German economy using structural models (
Arntz et al., 2016). More specifically, non-machine-based digital technologies such as Enterprise Resource Planning (ERP) and e-commerce positively affect employment by enabling task efficiency and creating complementary human roles (
Aubert-Tarby et al., 2018). However, digitalization has the potential to influence the workforce structure differently at the company level. That is, increased investment in digitalization is associated with increased employment of highly skilled workers and reduces employment of low-skilled workers (
Autor & Dorn, 2013;
Balsmeier & Woerter, 2019). Thus, automation and digitalization are unlikely to result in substantial job losses. Workers with lower qualifications may need to adapt more because of their higher risk of automation. The main challenge remains regarding the capacity to address rising inequality and ensure worker retraining (
Arntz et al., 2016).
Further research reveals that innovation at the firm level, including digitalization, generally leads to employment growth by creating new job opportunities (
Blanchflower & Burgess, 1999). Innovation, particularly through research and development (R&D) investments, fosters job creation within firms and across industries, contributing to positive employment effects (
García-Romanos & Martínez-Ros, 2024;
Van Reenen, 1997). This belief continues to dominate the concept of employment growth over time. Ten years later, based on Schumpeter’s theory of “creative destruction”, it was argued that innovation, including digitalization, continues to have a net positive impact on jobs at the industry level (
Mastrostefano & Pianta, 2009). However, firm strategies continue to be essential, as product innovations associated with digitalization often have more positive employment effects than process innovations (
Mastrostefano & Pianta, 2009).
The positive synergies between product and process innovations, digital technology adoption and use and the learning capacity of the organization have been largely explored by researchers over the last half of the century. Adopting innovation boosts both product and process improvements, enhancing firm competitiveness through digital technologies that streamline production and improve customer engagement (
Rogers, 1983;
Tornatzky & Klein, 1982). Digital technology can undoubtedly promote important processes and product innovation at the company level (
Ayoko, 2021).
Digital technologies also facilitate organizational learning, which is important for the implementation of new processes. Technologies such as ERP systems and electronic data interchange assist organizations in developing dynamic capabilities, allowing them to create new workflows and products (
Cohen & Levinthal, 1989,
1990). Bibliometric analysis concludes that digital innovation adoption is prevalent in industries focusing on product and process advancements, while high R&D industries, such as technology and manufacturing, heavily adopt digital tools, leading to innovative products and process redesign (
Van Oorschot et al., 2018).
More recently, analyses conducted at the EU level have shown that investments in digital technology and learning capacities can positively influence product and process innovation and innovation overall (
Curzi & Ferrarini, 2024;
Greenan & Napolitano, 2024).
Digitalization creates a landscape in which larger firms and tech-savvy industries lead the charge. Larger companies and those in technology-intensive sectors (e.g., information and communications) are more likely to adopt digitalization (e.g., e-commerce, robots, or data analytics).
Undoubtedly, company size matters for larger firms, and exporters demonstrate higher levels of digitalization, suggesting a correlation between firm size and technology adoption. Larger firms are more likely to adopt digital technologies. For instance, in Switzerland, adoption rates are notably higher among firms with more than 20 employees (
Balsmeier & Woerter, 2019). The size of an organization, as well as its readiness, affects the adoption of digital technology and its impact on innovation. The presence of barriers to innovation and digitalization in small and medium enterprises negatively affects efficiency (
Mitropoulos et al., 2024). However, larger organizations and those with higher technological readiness are more inclined to adopt digital tools that contribute to innovative processes and products (
Damanpour & Schneider, 2006).
Large firms in advanced industries prefer machine-based digital technologies that combine data access, computation and hardware. Smaller firms and less advanced sectors focus more on non-machine-based technologies (
Aubert-Tarby et al., 2018;
Arntz et al., 2016).
Moreover, industry type is equally important: manufacturing sectors, which are more technologically advanced, adopt complex digital technologies more frequently than the service sectors. For example, complex digital technologies are associated with sectors that require high technical sophistication. Technologies such as robotics are primarily adopted in sectors with significant manufacturing or technological components, highlighting the role of industry type in digitalization levels (
Balsmeier & Woerter, 2019). Nevertheless, technological advancements have an important influence on knowledge-intensive and highly technologized sectors, and conversely, a negative influence on employment growth in less technologically intensive manufacturing sectors (
Obadic, 2020).
Additionally, competitiveness stimulates digitalization, as exposure to international competition stimulates firms in export-driven industries to embrace digital technologies. The level of digitalization within a firm’s industry is closely linked to its competitiveness. Switzerland’s significant exposure to international competition stimulates firms, especially those in the manufacturing and export-dominant sectors, to embrace digital technologies more extensively. This indicates that an industry’s competitiveness plays a crucial role in determining its degree of digitalization (
Bris & Cabolis, 2017). When focusing on inter-regional trade in Europe, researchers found that routine-replacing technological change had an important displacement effect on jobs during 1999 and 2010 and also led to net growth in job creation due to increased product demand (
Gregory et al., 2022).
Human capital plays a significant role, as high salaries and skills in advanced industries support the adoption of digital technology. Switzerland’s skilled workforce and high salaries have led firms in advanced industries to invest in digital technologies to enhance efficiency and reduce costs. This trend is particularly noticeable in larger companies and those in the manufacturing sector (
Siegenthaler & Stucki, 2015). From an employment perspective, the skill level of an employee is particularly important, as IT can be a substitute for, but can also complement, human labor in Europe (
Peng & Zhang, 2020).
The economic theories presented above suggest that the relationship between digitalization, innovation and employment outcomes operates through a layered mechanism. Technological inputs—such as the adoption of robots, e-commerce platforms and specialized software and IT systems, along with product and process innovation—are first correlated as firms’ internal capacities and strategies. These inputs are linked to how companies organize production, introduce new products and services to the market and adapt their workforce. In our research, we use LCA to capture this multidimensional complexity by identifying latent company, based on observable patterns in firms’ technology adoption and innovation behavior. These profiles—ranging from digitally advanced companies to traditional, low-innovation firms—are used as an analytical lens through which we explore how European organizations respond strategically to digital transformation. Although the LCA method does not allow us to establish causal relationships, we use it as proxy to understand the economic adjustment mechanisms underlying company-level responses such as recent employment changes, future employment expectations and training investment. We use this as an organizational mediator to link innovation and digitalization to employment outcomes such as stability, job growth or decline. This approach integrates the theoretical perspectives on the creative destruction economic model into an empirical framework that reflects the variations in firm behavior.
Fueled by renewed European Union (EU) interest to rebuild the EU companies’ competitiveness globally by funding investments that should close the innovation gap with China and United States of America, especially by relaunching advanced technologies and closing the skills gap, the present analysis could contribute to better understanding of where EU innovative and digitalized companies stand in terms of employment prospects and what can be done further (
Draghi, 2024).
2. Materials and Methods
The data source for responding to the research questions was the European Company Survey (ECS) for the year 2019, conducted by Eurofound in collaboration with Cedefop (
Eurofound & Cedefop, 2020). ECS 2019 focuses on workplace organization, innovation and companies’ approaches to skills and digitalization. Data were collected from 21,869 subsidiary sites of multi-sites companies across Europe, covering all 27 EU member states and the UK. The target population of the survey was companies with more than ten employees. The data refer to managers’ responses to the survey. ECS 2019 employs a push-to-web methodology combined with fieldwork. Companies were initially contacted by phone to designate a senior manager for the survey. The designated individuals were invited to complete an online questionnaire. The purpose of the ECS 2019 edition was to analyze workplace organization and innovation at the company level, as well as companies’ approaches to skills and digitalization (
Eurofound & Cedefop, 2020). A multistage stratified random sampling method was used, and procedures varied across countries. The sample was stratified by company size (number of employees) and sector of activity (manufacturing, construction and services). This approach aimed to ensure high-quality data and to collect representative data at both the national and EU levels. A total of 21,869 interviews were conducted with management personnel.
To respond to the research questions, this study uses a comprehensive latent class analysis aimed at identifying latent employment behaviors in EU companies grouped mainly based on their level of technology adoption and innovation patterns.
To explore how different patterns of digital technology adoption at the company level are associated with employment trends in the European Union (EU), we applied a Latent Class Analysis (LCA), considering its broad use in scientific research in multiple domains pertaining to social sciences research (
Santos et al., 2015;
Zhu, 2024), psychology (
Petersen et al., 2019) and health (
Zhou et al., 2018;
Kongsted & Nielsen, 2017). The essence of the LCA method involves finding underlying groups in a population using categorical data based on probabilistic modeling, resulting in intra-classes homogeneity and inter-class heterogeneity.
Starting from the two research questions (company typologies related to their approach to digitalization, innovation and international market exposure and companies’ approach to present and future changes in employment and staff training), this research aimed to identify groups in firm populations with similar features.
The dataset is peculiar, as the data are categorical. This disqualifies other methods designed for use on numerical datasets, such as cluster analysis (deterministic method used for continuous numerical data) or neural network analysis for clustering (which is adequate for analyzing large datasets with many numerical variables and complex nonlinear relationships).
LCA was utilized, since it is a modern, powerful modeling technique that responds to the typology of the variables (qualitative data resulting from a large survey) and the scope of the analysis. More specifically, to identify hidden company profiles, LCA proved helpful in revealing latent subgroups of companies that share similar patterns in technology adoption, innovation activities and employment behaviors, considering the type of ECS 2019 variables (mainly categorical). Traditional methods (e.g., linear regression) often mask such heterogeneity, whereas LCA helps uncover nuanced profiles (
Weller et al., 2020).
Similarly, LCA brings a multidimensional perspective to the analysis. As the dataset includes various measures (technology adoption, training, innovation and workforce evolution), LCA allows us to perform a simultaneous analysis of these variables. It groups companies with statistically similar response patterns into classes and provides a comprehensive view of how technology spreads across different company types.
From a practical viewpoint, LCA results reveal new perspectives on employment trends in the EU that are useful to various stakeholders, such as policy makers or company management. By understanding the specific classes of companies, decision makers have better tools to adjust policies and management strategies to the specific needs of each profile, especially in the context of the overall behaviors uncovered by the LCA.
Finally, we used LCA for innovation purposes, considering the uniqueness of the approach. While many studies on the intersection between digitalization and employment use descriptive statistics or econometric models, LCA is relatively underutilized to explore how technology shapes workforce dynamics at the company level across Europe. The method’s ability to segment companies based on multiple dimensions simultaneously provides novel insights and complements existing macroeconomic and case-based research.
The variables used for the scope of this analysis (see
Appendix A) were selected based on the outcomes of the literature review.
Employment trends are measured using two ordinal variables that focus on how the total number of employees in the company evolved since the beginning of 2016 (CHEMP) and the evolution of the total number of employees in the company over the next three years (CHEMPFUT) (
Acemoglu & Restrepo, 2020). Professional training (organized inside or outside the company) offered by the company to employees during paid working hours was captured by an ordinal variable (PAIDTRAIN).
Digitalization in companies was measured using specific ECS 2019 ordinal variables, showcasing the degree of digital adoption in the company. These variables are e-commerce (investigating whether the company buys or sells goods or services online (e.g., through business-to-business portals, e-commerce, etc.); robot usage (ICTROB, exploring whether the company uses robots, which in this context are defined as programmable machines that can perform a series of complex actions automatically, including interactions with humans); and usage of software designed or customized for its needs over the last three years (ICTAPP) (
Acemoglu & Restrepo, 2020;
Aubert-Tarby et al., 2018;
Brynjolfsson & McAfee, 2014).
Innovation at the company level was measured using two dichotomous variables, in line with other studies that have used the European Company Survey 2019 (
Della Torre et al., 2021;
Curzi & Ferrarini, 2024), by focusing both on innovation in products (INNOPROD) and processes (INNOPROC) over a period of three years before the survey (starting in 2016) (
Mastrostefano & Pianta, 2009).
Exposure to international markets was captured by an ordinal variable (SALESINT), which measures the percentage of sales to international clients over a three-year period starting in 2016 (
Bris & Cabolis, 2017).
A set of variables regarding the company profile and country of residence was also used (see
Appendix A), such as the size of the company (WPSIZE_MM_N), the main sector of activity following the NACE 2-Digit codes level (MAINACT) and country of residence, the latest covering the EU 27 Member States and United Kingdom (
Aubert-Tarby et al., 2018;
Arntz et al., 2016;
Balsmeier & Woerter, 2019).
The Latent Class Analysis (LCA) was performed using the R programming language with a code designed by the authors. Subsequent steps were followed, starting with the preparation of the environment, including by loading the necessary libraries. Furthermore, the data were cleaned, and missing values were handled (by filling gaps in categorical variables using the mode and numerical variables using the mean). As LCA can only be performed on categorical data, the numerical variables were discretized. The variables were coded as factors to make them fit the statistical model. For the LCA modeling, we identified four underlying latent groups for the data considered.
The LCA method is probabilistic, and it models the probability that an observation is in a certain latent class C
k on the basis of the formula below:
where
represents the probability that a set of X answers will be included in a latent class C
k; in our case, it represents the probability that a company will be part of a C
k class with the answers X = x·
represents the product of the probabilities for each observed variable; we assume that the variables are independent inside a latent class.
represents the probability that variable X
j will take the value x
j, considering class C
k. This shows how each variable contributes to a latent class definition.
Additionally, we set up the data frames used in the model, as well as the three covariates pertaining to employment and training, and we encoded them as factors.
Furthermore, we conducted an LCA analysis.
Within the analysis, the Bayesian Information Criterion (BIC) for several scenarios considering two, three, four, five, six, or seven classes was also calculated. The number of classes was determined based on the BIC.
The BIC can be calculated as follows:
where:
The BIC was chosen as the indicator because it strikes a balance between model fit and complexity (
Wagenmakers, 2007). The model with the lowest BIC was selected as the most suitable for interpretation (see
Table 1).
The quality of the clustering was ensured by selecting the number of classes based on the lowest BIC. The BIC was run for several possible numbers of clusters, resulting in the values given below (see
Table 1):
Although the BIC showed that the 5-class solution would be optimum from the method point of view, the team opted for a 4-class model for clearer interpretability and practical relevance for this research. The slight statistical improvement of the 5-class over the 4-class did not justify adding more complexity. Based on a comparison of the resulting BIC values, it was determined that the most appropriate number of classes was four. The results were then visualized through several graphical representations, such as the probabilities for each class, the heat map, the countries’ heat map and the covariate effect on class membership.
In order to estimate the quality of the class clarity, the team calculated the entropy for this LCA model. The entropy was evaluated using the following formula (
Celeux & Soromenho, 1996):
where:
The value of the entropy is between 0 and 1, with values closer to 1 indicating better classification. The calculated entropy was 0.6837. This value shows moderate clarity for the latent class model. There are several reasons for why this value is not higher, and perhaps the most important is that the BIC value for a 5-class model is very close. The calculated entropy if we consider 5 classes is 0.7275; close to the first 4-class situation (chosen by the team for analysis reasons).
3. Results
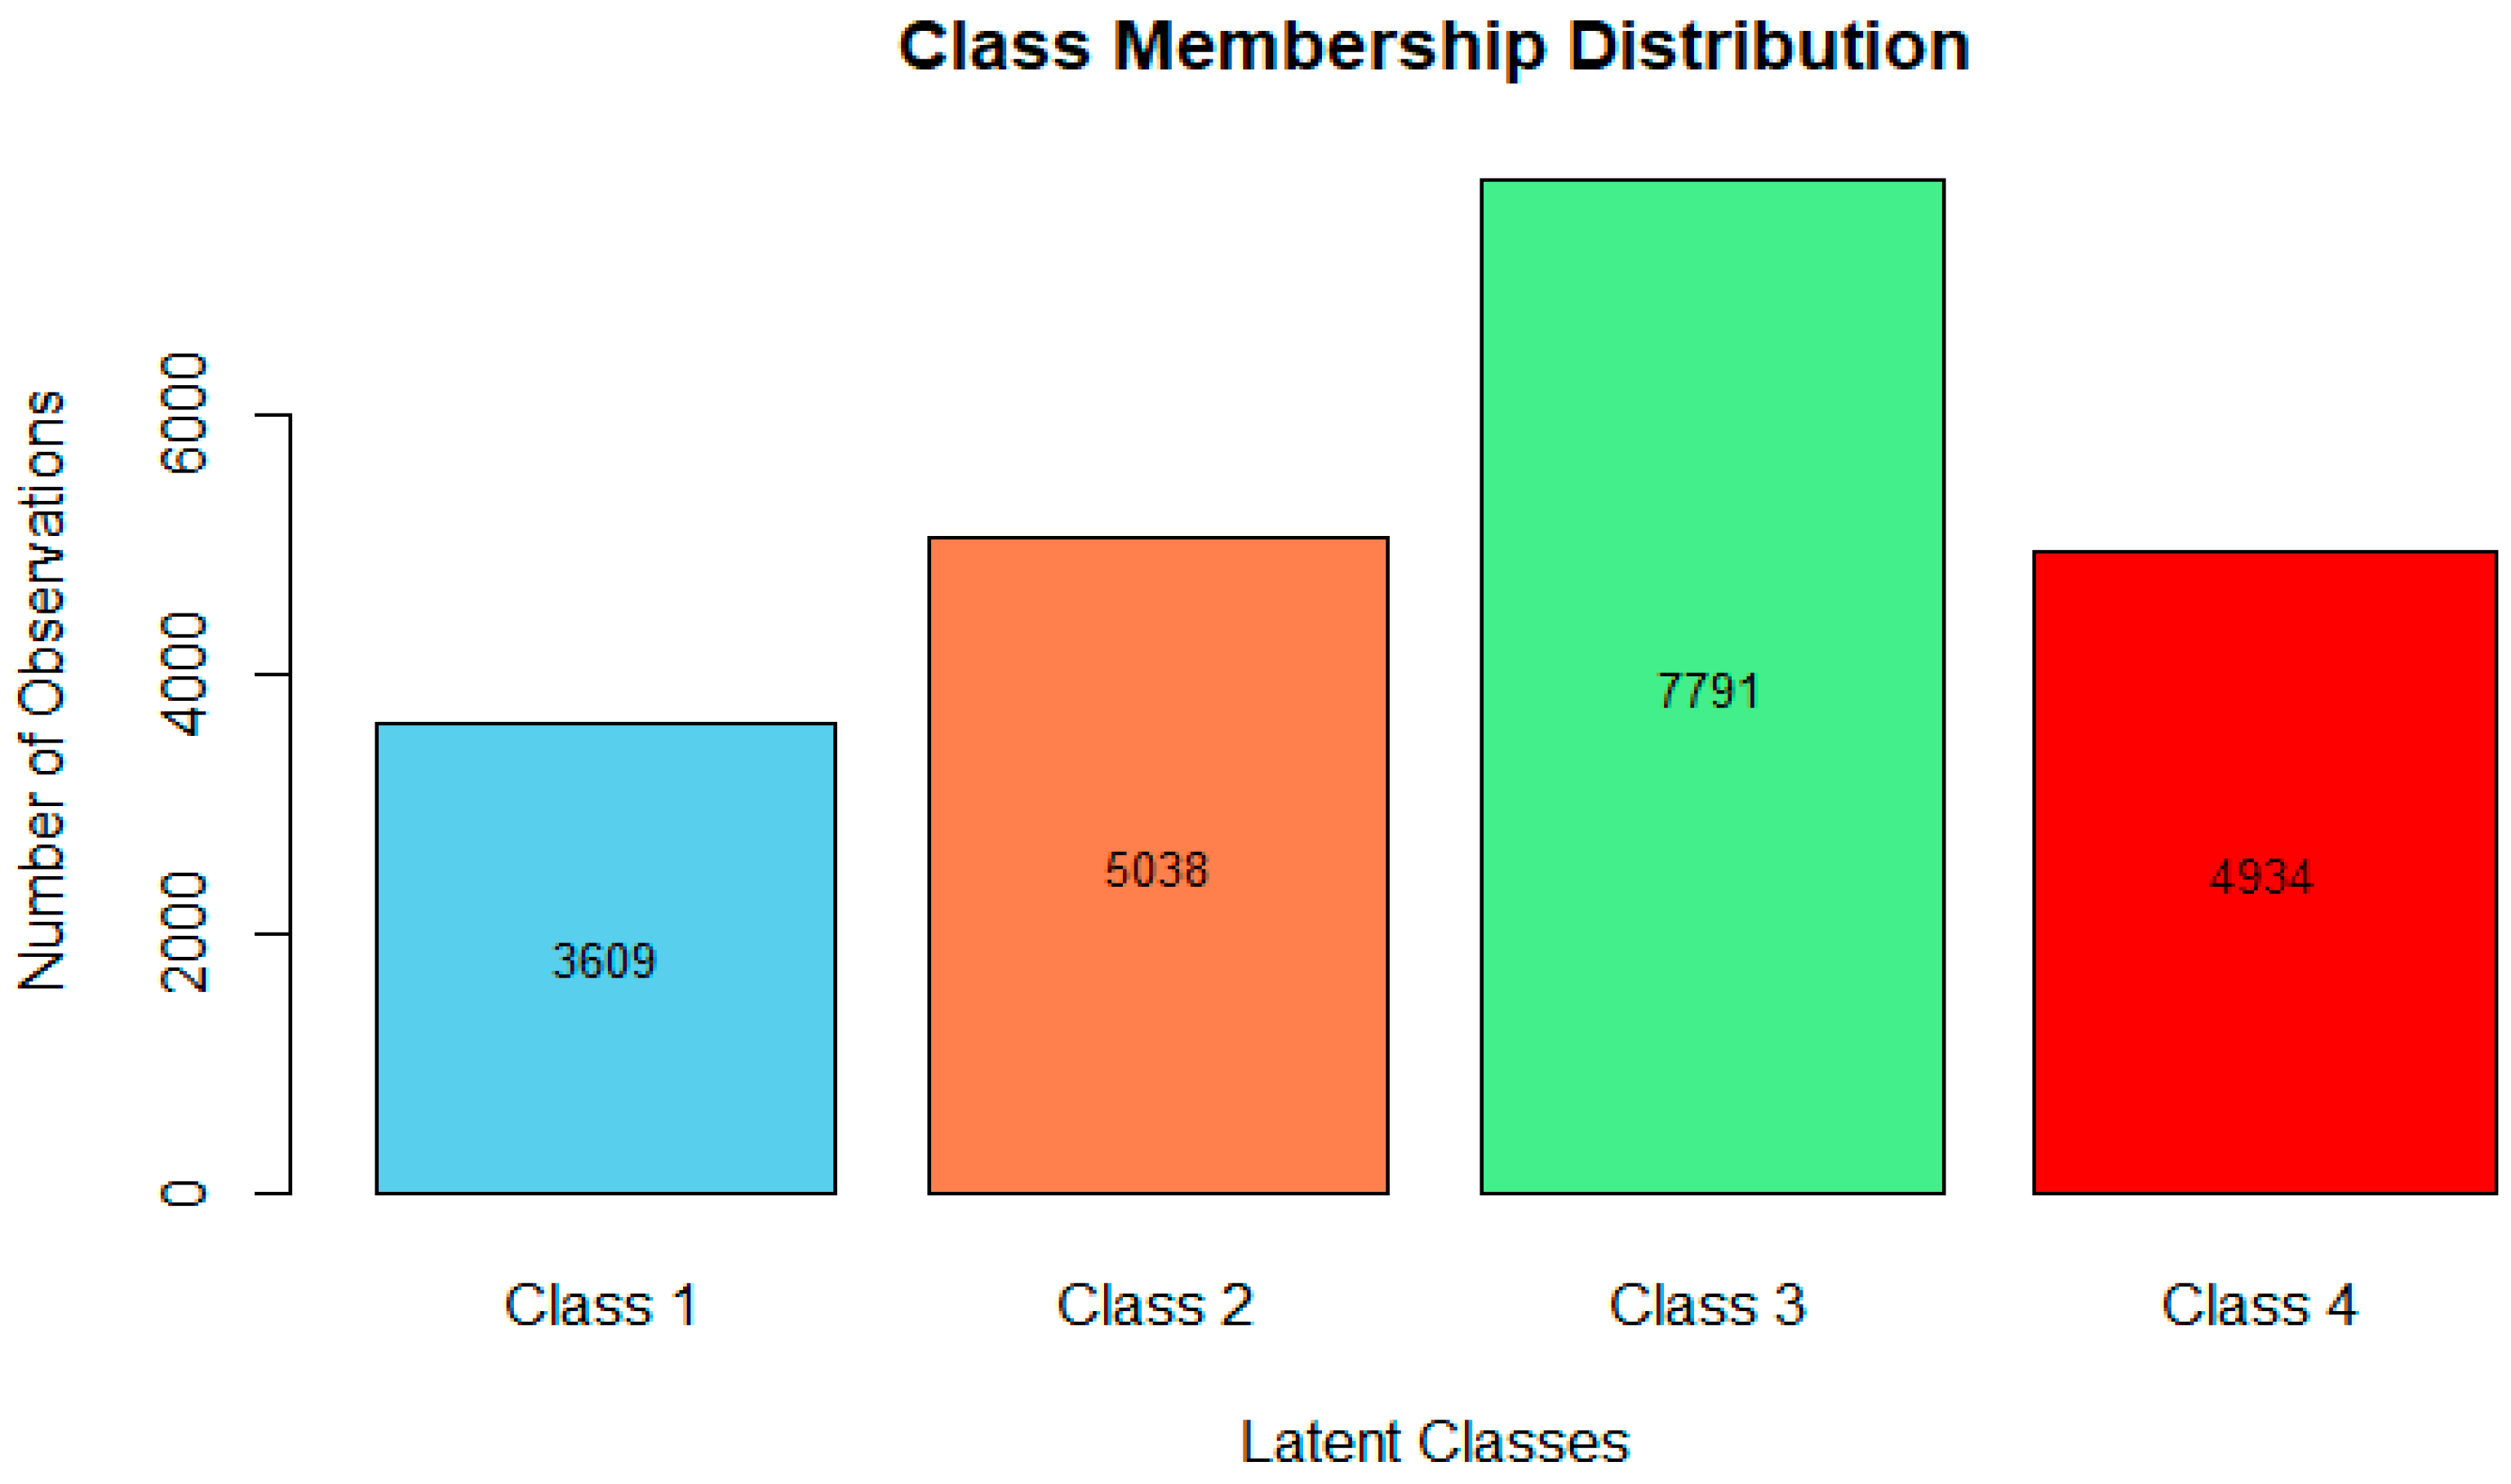
The results of the LCA, considering the optimal BIC for choosing the number of classes, show that ECS 2019 companies are classified into four classes based on their latent profiles of digitalization and innovation determinants. When investigating the class membership distribution of the participants in the survey (See
Figure 1), we observed that Class 3 was the most numerous one (7791 companies), followed by Class 2 (5038 companies), Class 4 (4934 companies) and Class 1 (3609 companies).
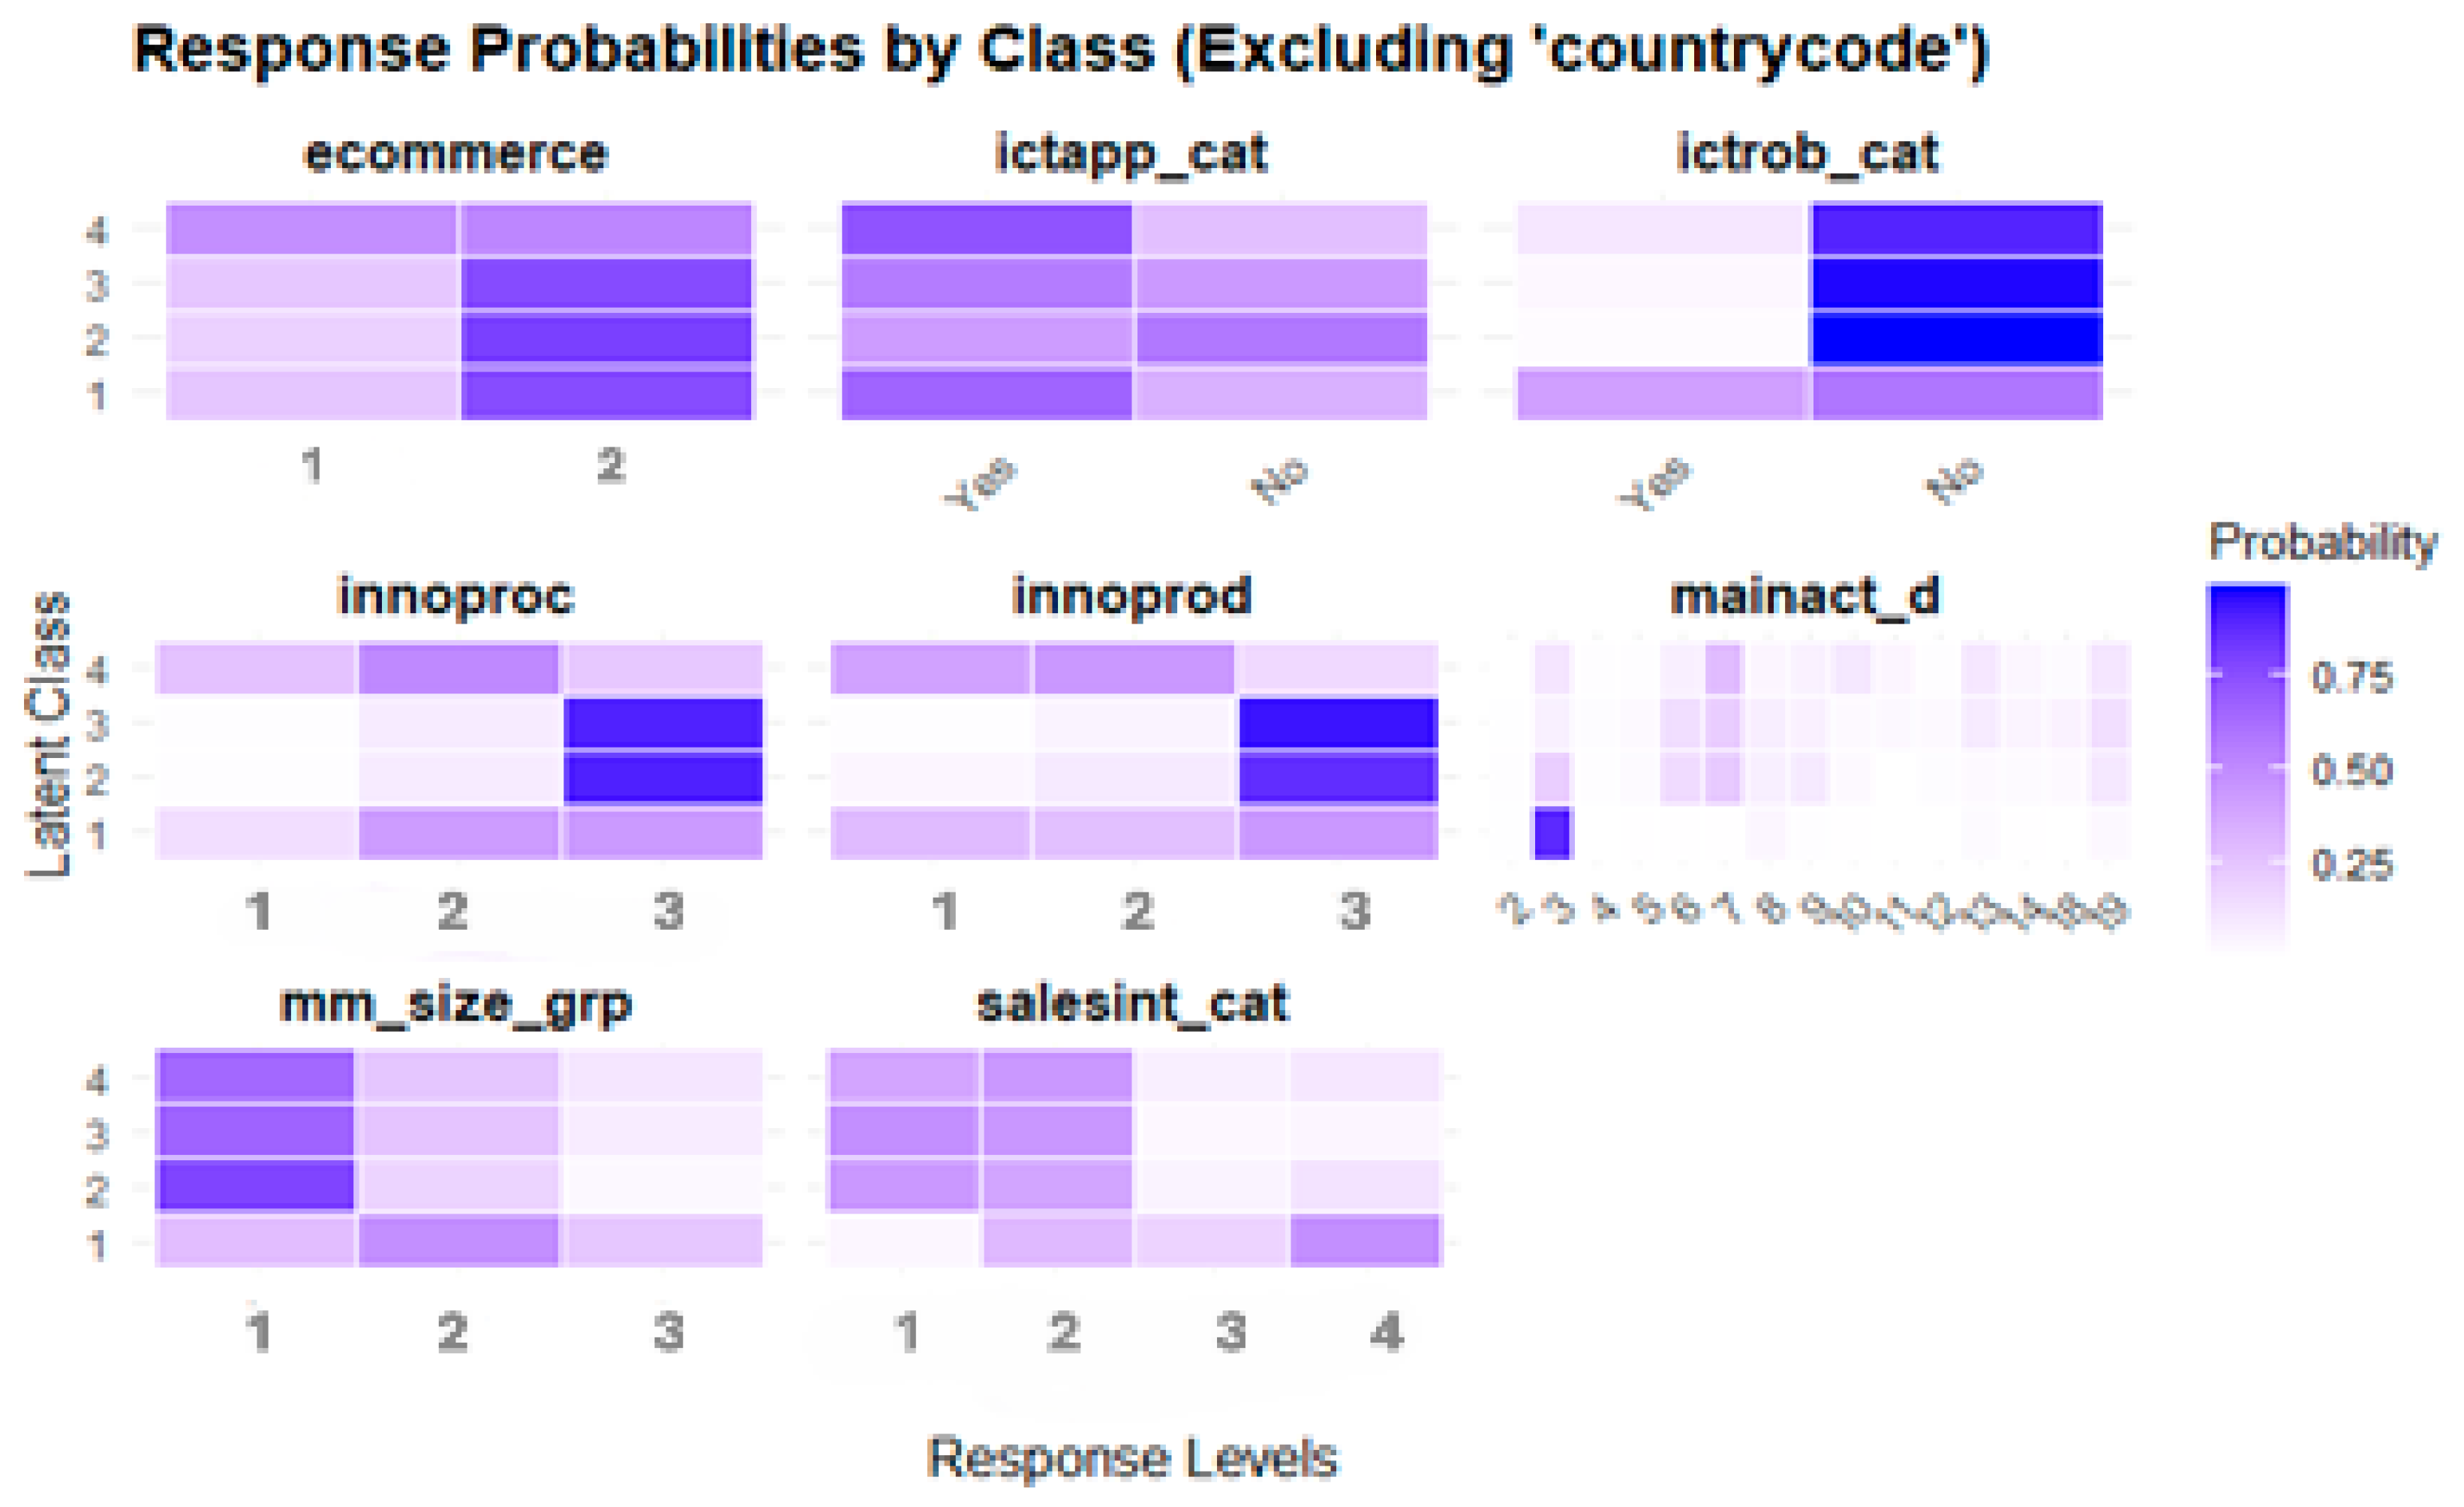
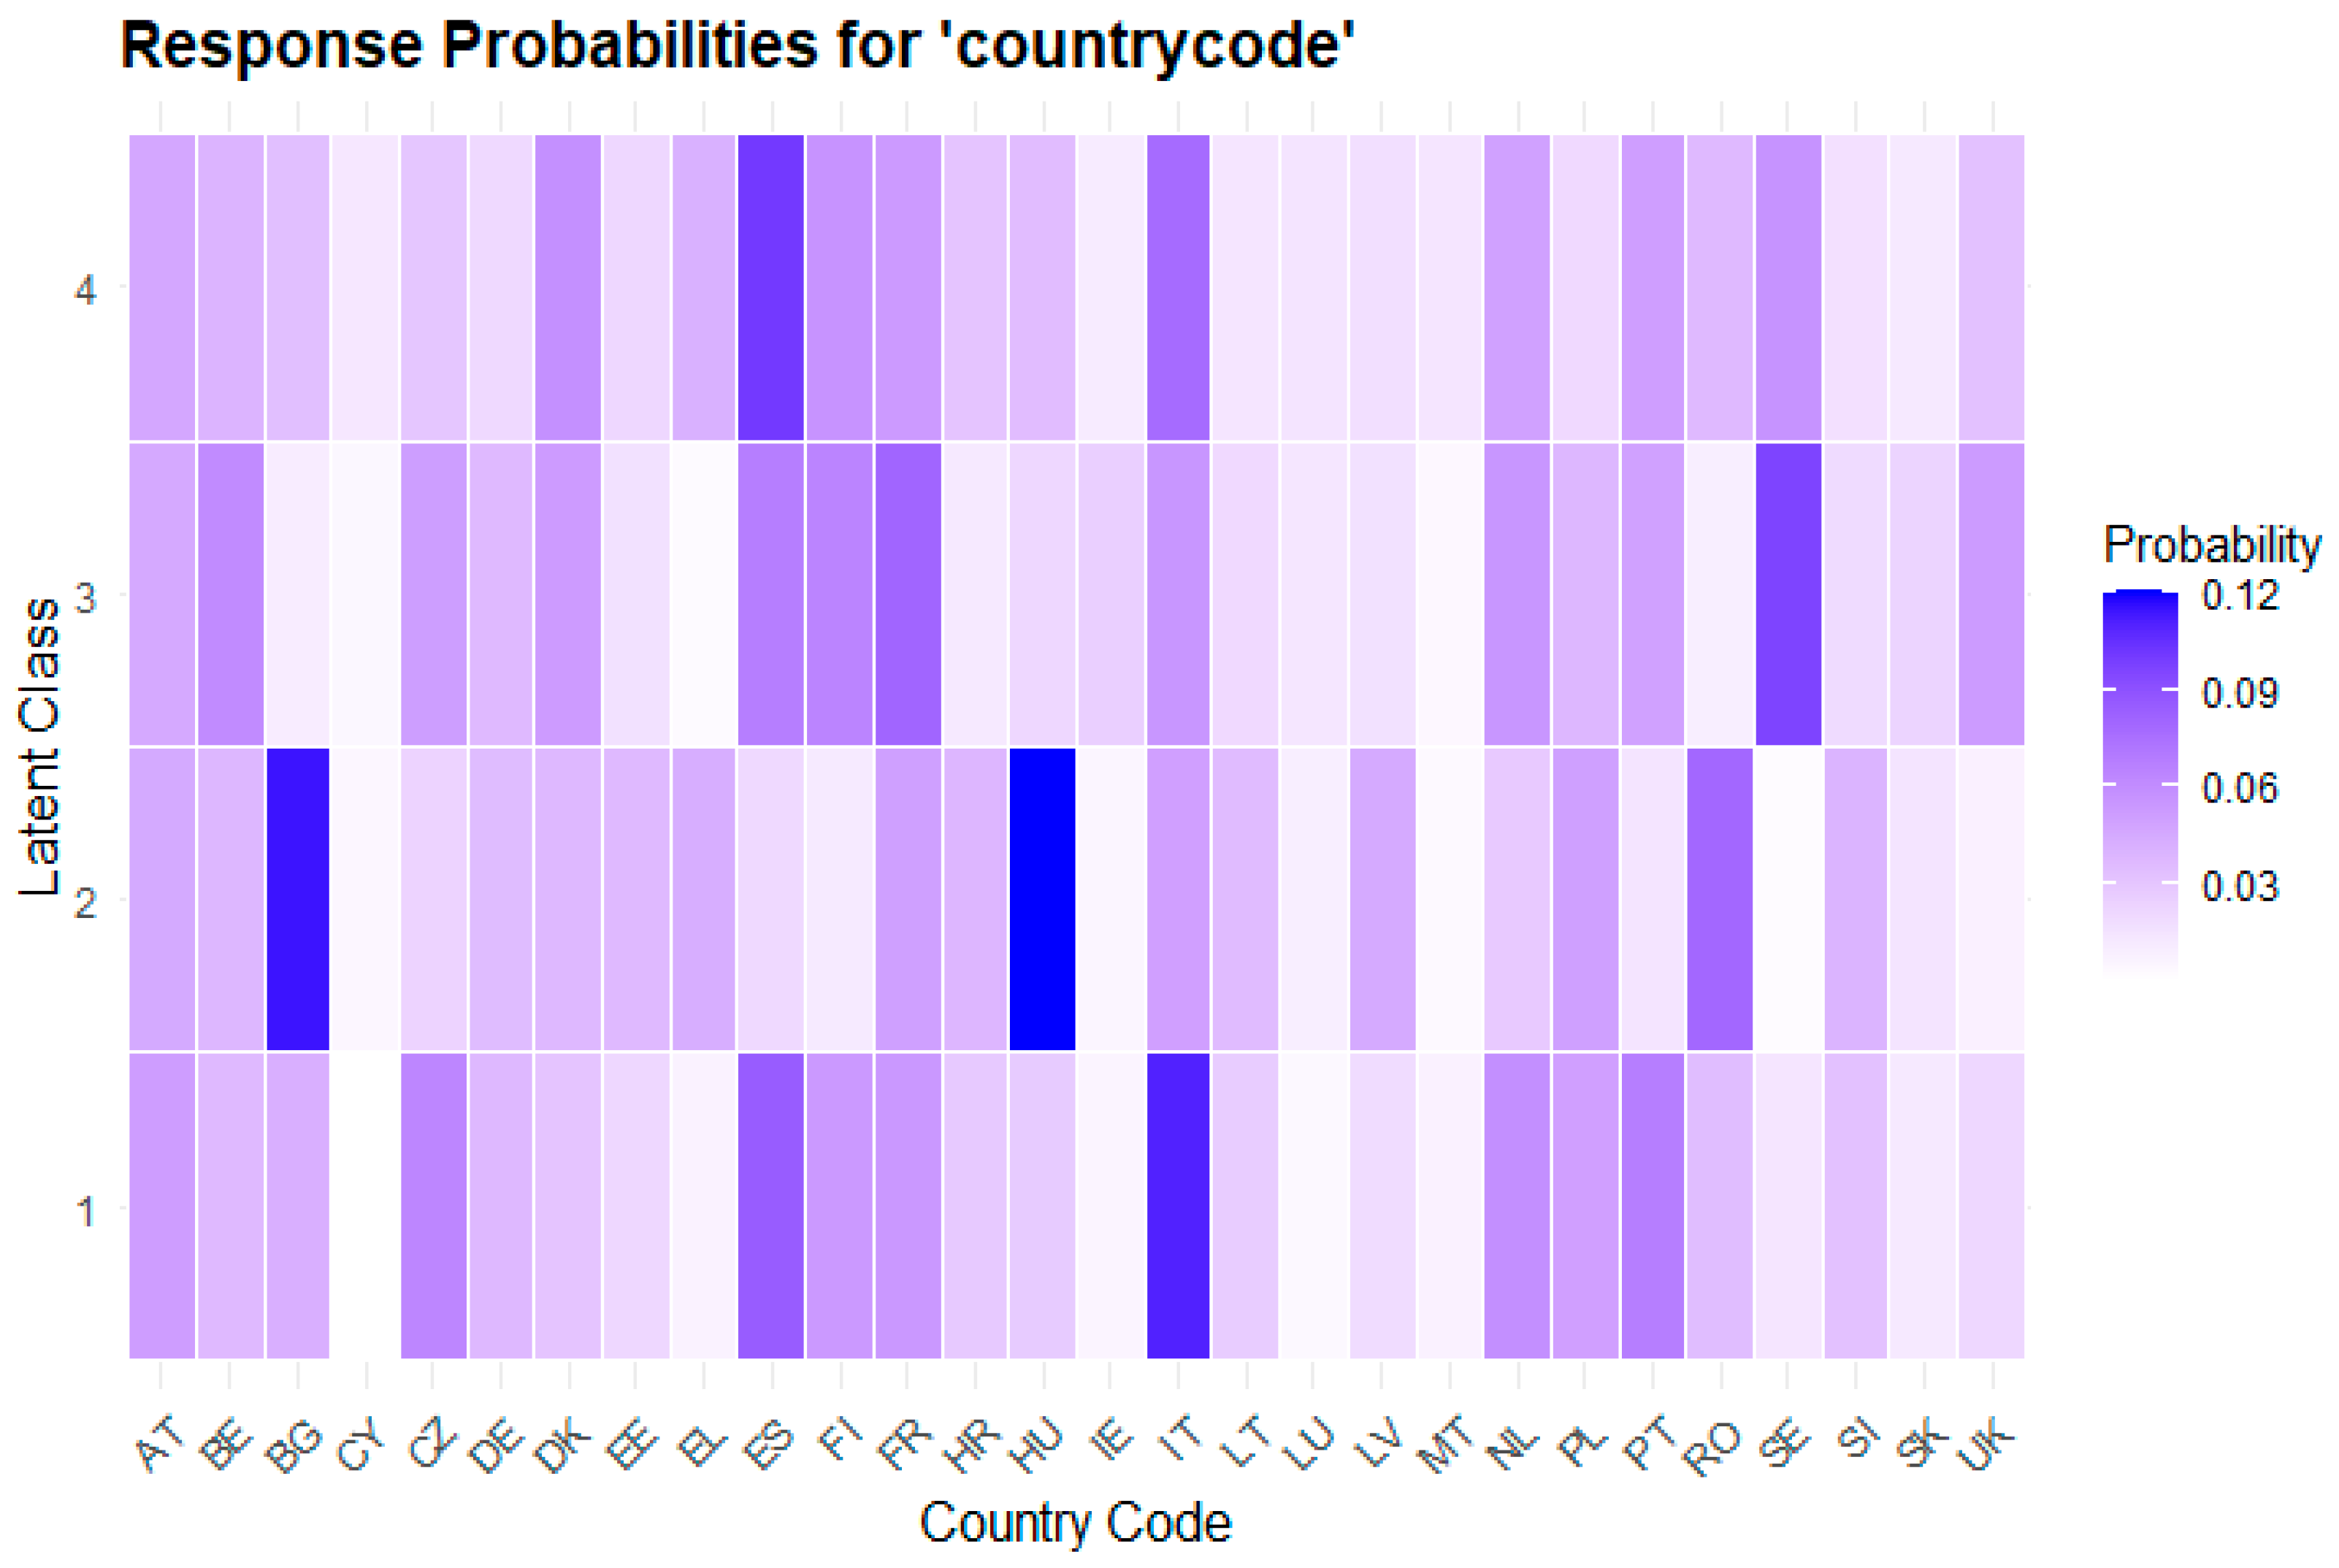
Using the probability heatmap tool to represent the likelihood of different outcomes within our categories, we have illustrated response probability extraction across latent classes and countries, revealing patterns in digital adoption, innovation and company characteristics (
Figure 2 and
Figure 3). This approach is useful for identifying hidden (latent) classes within data and understanding how things differ among these groups. By employing color intensity to represent probabilities, we were able to find dominant responses in each latent class, flagged in darker colors.
Class 1 pertains to companies showcasing “moderate adoption of digital technology and strong international orientation”. In this class, we found companies from Italy, Spain, Portugal, Czechia, the Netherlands and France (See
Figure 3). These companies belong to the class that ranks second in terms of digitalization, considering both the use of IT apps (66%) and robot penetration (41%). E-commerce usage was moderate (24%). Innovation was also present, as Class 1 ranked second in terms of innovation in both products and processes (with 29% probability of introducing new products to the market). Medium-sized companies comprise the majority of this class (48%). These companies have the strongest international presence (48%). The economic sector is heavily dominated by manufacturing (88% of companies within this class).
Class 2 pertains to “traditional and local companies”. Companies in this class are predominantly found in Bulgaria, Hungary and Romania (See
Figure 3). These companies had the lowest adoption rates of IT applications (42%) and robot usage (1.5%) (See
Figure 2). E-commerce utilization was the lowest among all classes (20% of the companies engaged in online sales). Innovation was almost nonexistent (87% of companies did not introduce any new products). Most of these companies were small (78%). They primarily served local markets (44% did not engage in any export activities). The economic sectors most represented in this class were trade (22%) and construction (15%).
Class 3 is the class of “medium digitalization, process innovation, with local focus companies”, which was the most prominent class in the ECS survey (See
Figure 1). The companies in this class were predominantly from, France, Spain, Belgium and Finland (See
Figure 3). These companies exhibited a moderate level of ICT app adoption (56%) and robot usage (3%), which was slightly higher than that of traditional companies. Their e-commerce usage was moderate (23%). Innovation presence was similar to Class 2, with a slight increase in process innovation (8% of the companies in all classes introduced new processes to the establishment). Predominantly small firms made up this class (66%); they primarily served local markets (48% did not engage in export activities). The most prominent economic sectors are trade (21%) and transport (14%).
“The digital leaders and innovator companies” are found in Class 4. The companies in this class were predominantly found in Spain, Italy, Finland and France. These companies showed the highest adoption rates of IT applications (72%) and high robot usage (10%). They also utilized e-commerce (48% of online sales). Innovation was a key focus; many companies introduced new products to the market (40%) and new processes both to the market (26%) and to the establishment (50%). This class showed a balanced number of different company sizes, with small (64%) and medium (24%) companies. These firms were active in diverse economic sectors such as trade (29%) and manufacturing and technical services (10%). Despite their advanced digitalization, 38% of these companies did not engage in export activities. However, foreign exports were present to varying degrees, suggesting that Class 4 aligns with Class 1.
In order to approach our second research question (Q2), a visual analysis of the past employment dynamics (CHEMP) was related to the identified latent classes, which revealed distinct employment trends (See
Figure 4), with a median of around three, showing that the employment trend was stable. We observed that Class 1 showed a tendency to slightly increase the number of employees (36% of companies show an increased number in employees of more than 10%). Classes 2 and 4 prioritized stability throughout the majority of the companies, as the situation remained largely unchanged. Class 3, which included the highest number of companies, displayed a slight increase in employee numbers, also showcasing high variability, with some companies experiencing more significant changes.
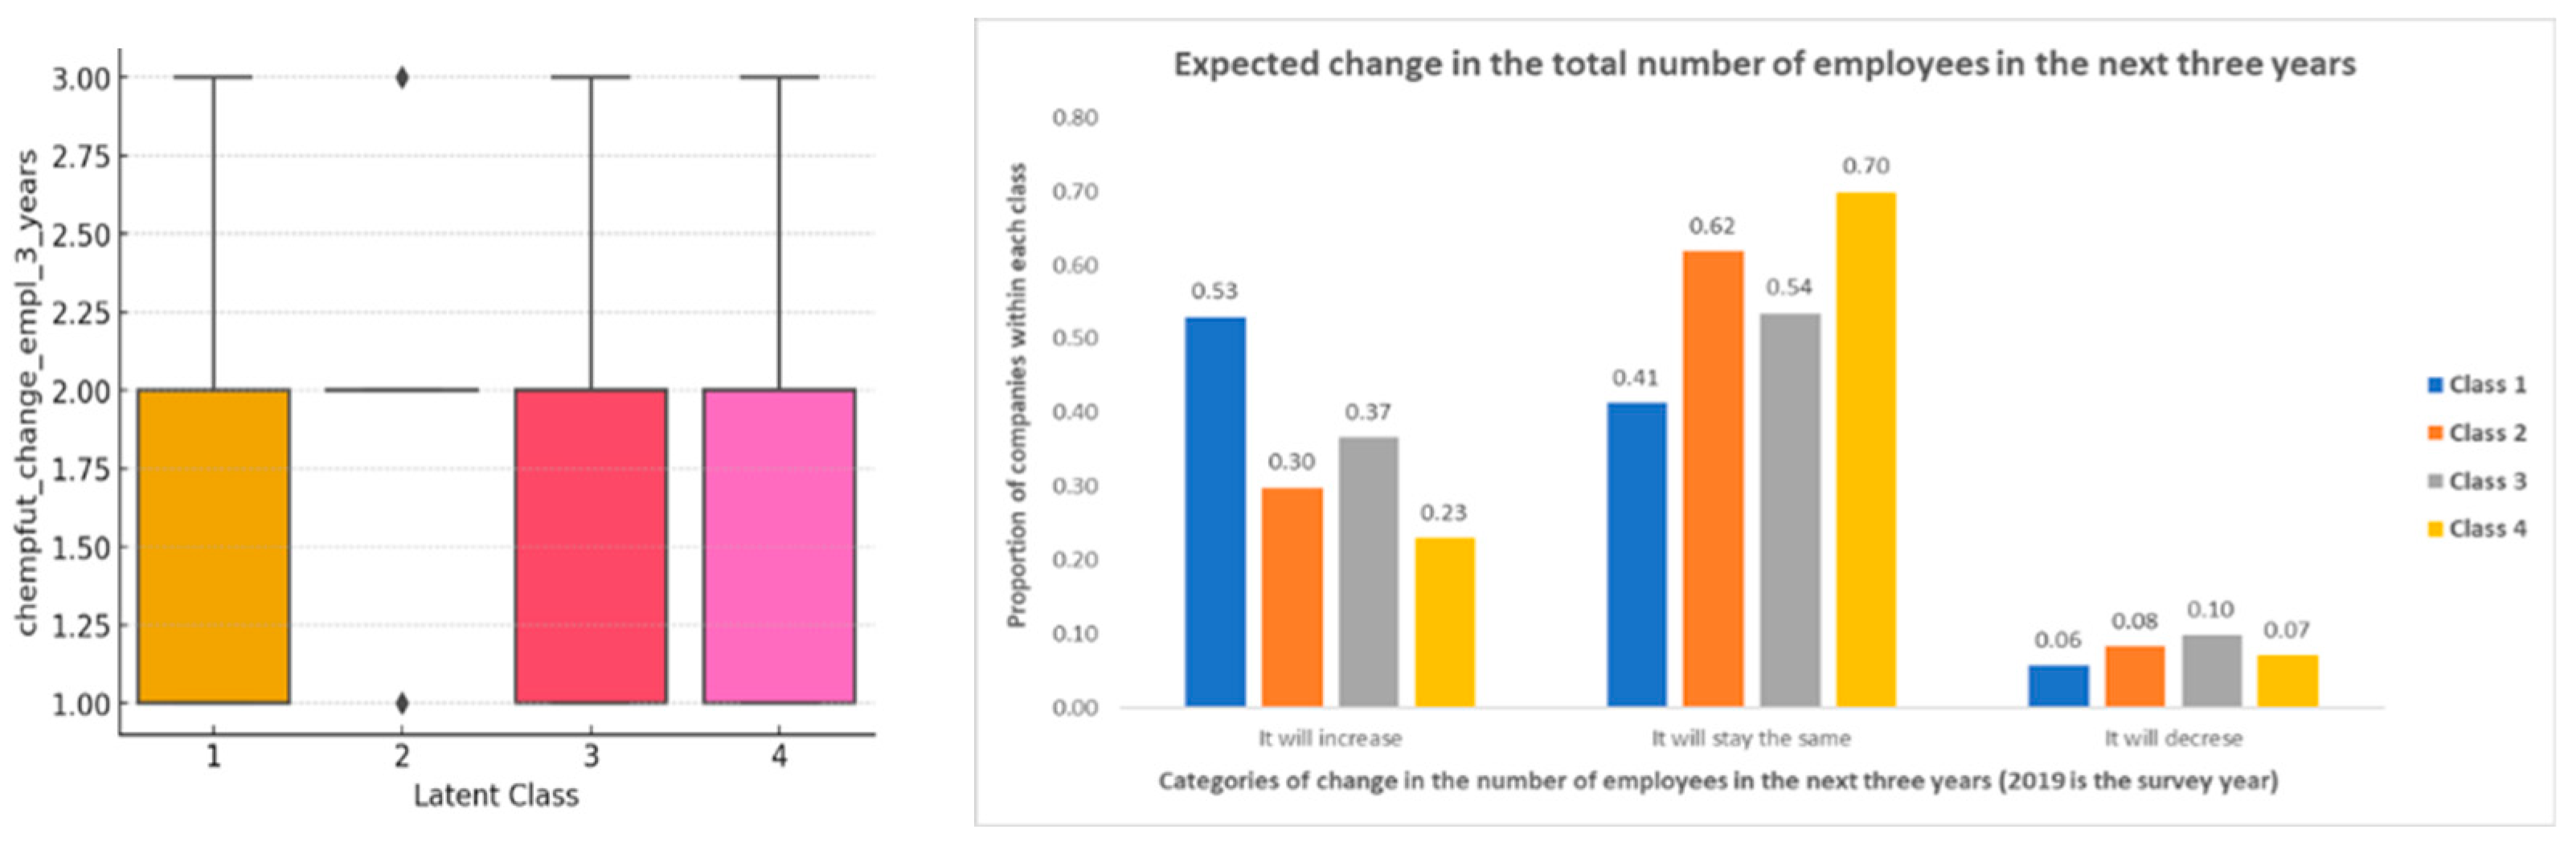
Analyzing the future employment expectations covariate (CHEMPFUT), we observed various outlooks across the latent classes (See
Figure 5), with a median of around 2, showcasing that, in this case, employment prospects were stable. Class 1 is optimistic about the future, as the “It will increase” bar is dominant (53%). Classes 2 and 3 expect more stability in employment, as the bar “It will stay the same’ dominates the two classes. Interestingly, Class 4, pertaining to the digital leaders and innovator companies, showcased rather stable perspectives on future employment growth, as the “It will stay the same” bar is by far the largest (0.70).
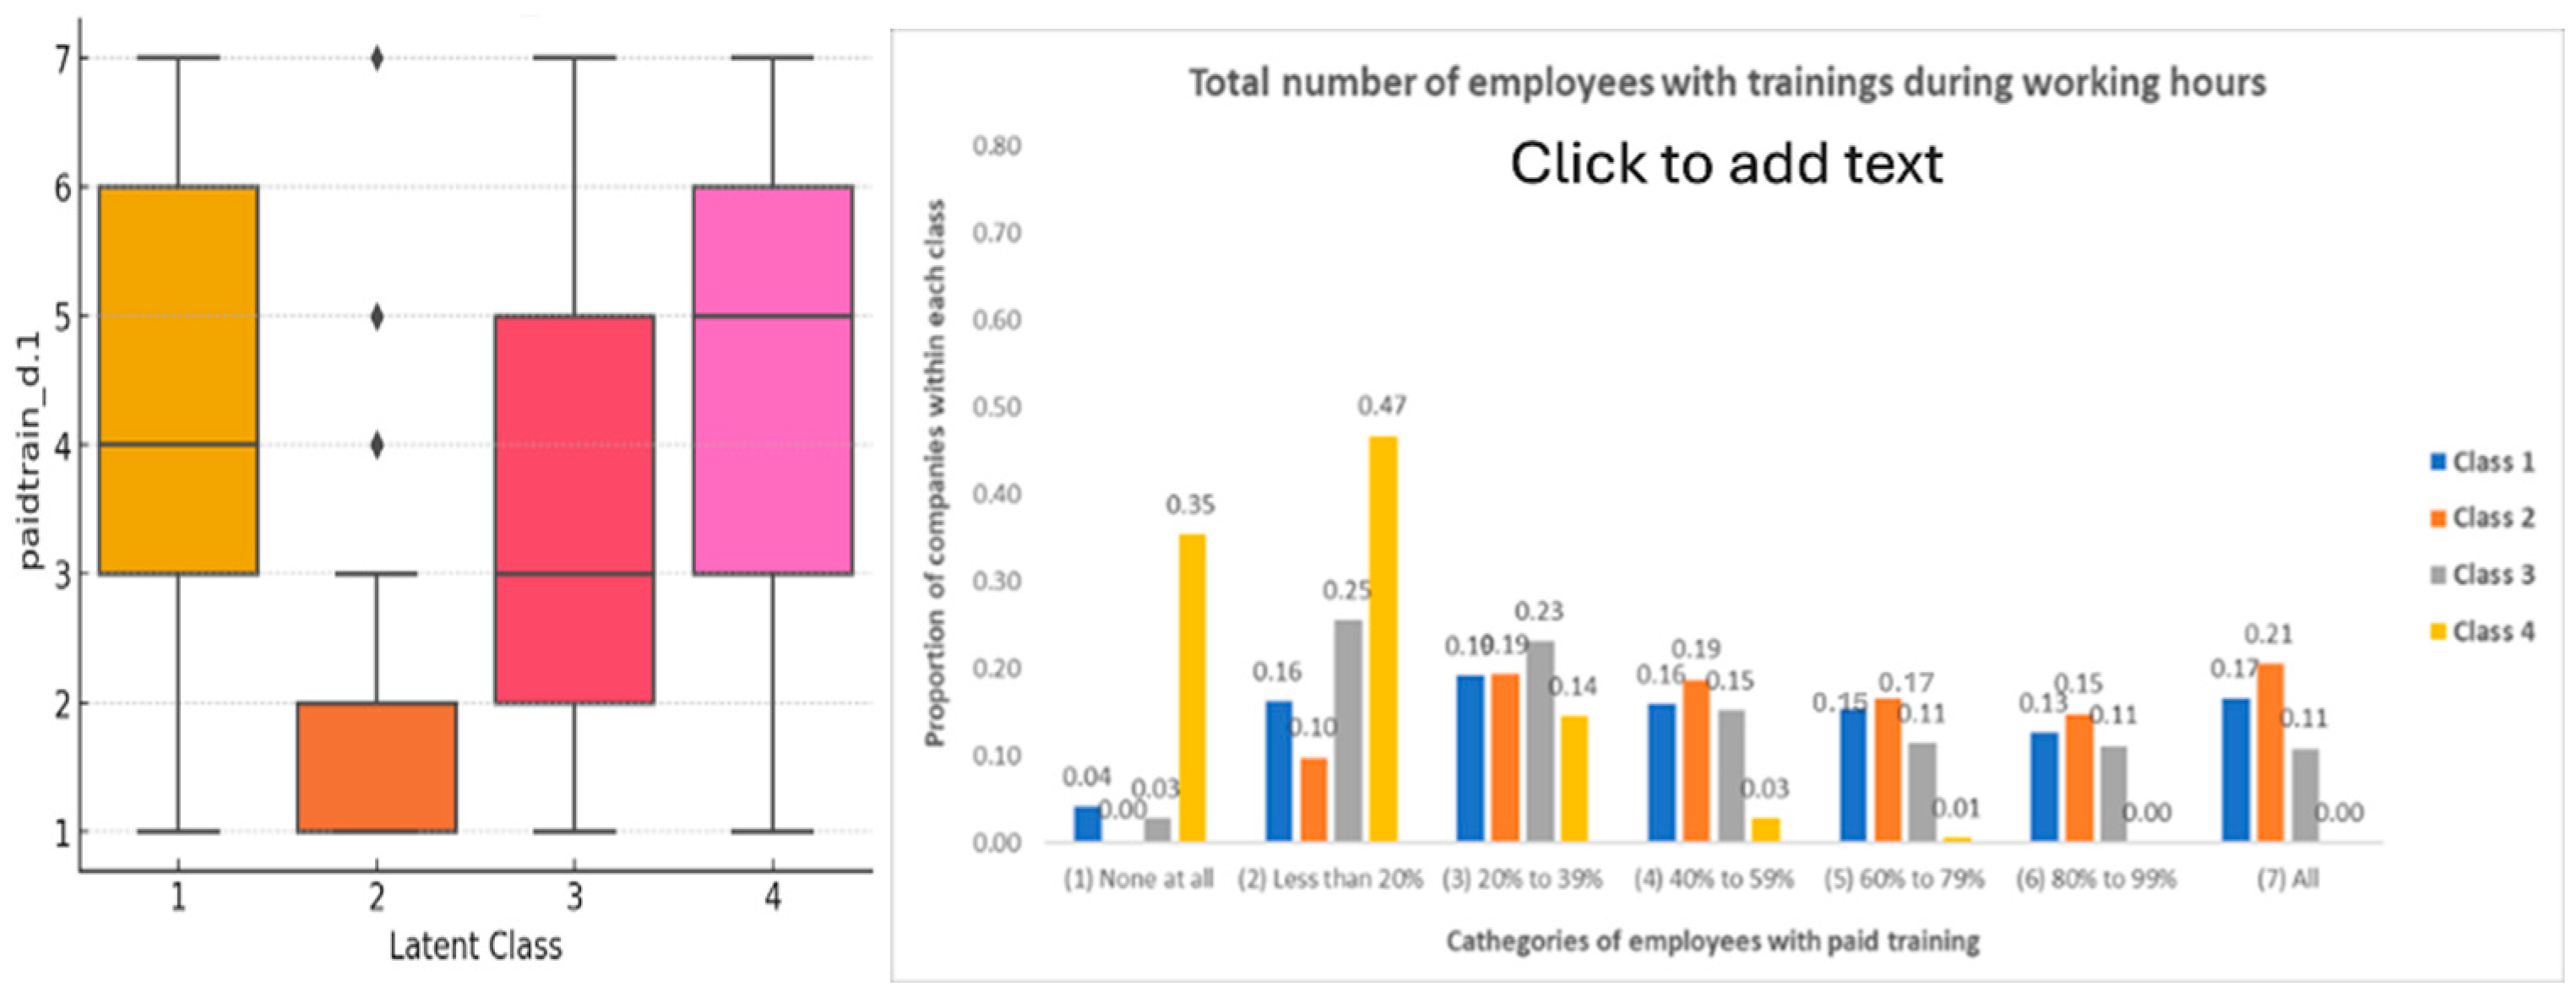
Companies’ investments in staff training (PAIDTRAIN_D) vary across latent classes (See
Figure 6), complementing previous findings. Class 1 displays a wide variety, with moderate investments in training; Class 2 indicates a low level of training participation; and Class 3 exhibits slightly low tendencies, with medium training participation. Class 4, on the other hand, was about learning, exhibiting high training participation.
Based on the conceptual framework outlined above, we analyzed how firms’ technological and innovation characteristics are reflected in their strategic responses and employment outcomes. The LCA revealed four distinct profiles:
- -
Class 4 includes the most digitally advanced and innovative firms. These companies showcase significant investments in technology and staff training yet show only moderate or no employment growth, suggesting that internal transformation is not matched by broader job creation, suggesting a partial substitution trend.
- -
Class 1 combines high innovation and internationalization with moderate training and favorable expectations on employment but also lacks evidence of substantial recent employment growth.
- -
Class 2, composed of low-digitalization, low-innovation firms, displays clear signs of employment stagnation or decline, with minimal investment in upskilling.
- -
Class 3 appears more transitional, with mixed innovation strategies and relative openness towards training. The tendency is towards relatively stable employment.
These patterns suggest that the association of innovation and digitalization with employment is uneven across firm profiles, and that the expected compensatory mechanisms in employment do not clearly materialize, even in the most technologically advanced classes.
4. Discussion
The distribution of European companies by class suggests distinct patterns of digitalization and innovation in conjunction with employment and companies’ investments in training.
The analysis reveals a nuanced relationship between digitalization and employment, innovation and training participation across different company archetypes. The identification of four distinct latent classes highlights that digital transformation is not a monolithic phenomenon, and company profiles vary significantly depending on their characteristics and market behavior.
Class 1 (“moderate adoption of digital technology and strong international orientation”) and Class 4 (“digital leaders and innovators”) showcased a positive association between digitalization and employment, innovation and training. These companies exhibit higher levels of IT adoption, innovation activity and investment in employee training, with employment showing a stable positive trend; therefore, digitalization creates opportunities for growth, improved skills and increased competitiveness (
Bartel et al., 2007;
Greenan & Napolitano, 2024).
The varying levels of innovation activity across the four classes suggest that innovation is indeed a key driver of digitalization, and vice versa (
Ayoko, 2021;
Van Oorschot et al., 2018). While Class 4 leads in both product and process innovation and Class 1 follows shortly, Classes 2 and 3, containing mainly small and traditional companies, are lagging behind in both areas. This highlights that innovation is not simply about adopting new technologies but also about adapting and improving business processes and developing new products and services.
Training plays a critical role in ripping the benefits of innovation and digitalization. This is particularly evident when comparing Classes 1 and 4 with Classes 2 and 3 (
Curzi & Ferrarini, 2024;
Greenan & Napolitano, 2024). The “digital leaders and innovators” class tended to invest heavily in employee’s training, followed by Class 1 with relatively high training participation rates, while Class 3 exhibited limited tendency to skilling, and Class 2 showed very limited usage of education opportunities. The lack of investment in training at the Class 2 level may be one reason these companies are less competitive and less able to digitalize and innovate (
Cirillo et al., 2023). This suggests that companies at the forefront of innovation and digitalization understand that training is essential to effectively utilize digital technologies and drive innovation, highlighting the importance of upskilling and reskilling programs to ensure that digitalization translates into improved performance.
Contrary to the literature review of dominant perspectives (
Acemoglu & Restrepo, 2020), LCA analysis suggests that the relationship between digitalization, innovation and job creation is not straightforward. While Class 4 stands out for its high investment in training, innovation and digitalization, it does not exhibit a massive increase in employee numbers, either for the present or the future. This could indicate a trend towards process automation and employment substitution, but this may also reflect sector-specific dynamics or productivity-driven changes, or that companies opt for automation-driven supply chain changes. Likewise, Class 1, which shared almost the same profile as Class 4 in terms of digitalization and innovation, but with the highest exposure to international markets, showed slightly positive employment trends, but not significantly higher than Class 4.
On the other hand, the situation is different in the case of traditional companies: Class 2 is characterized by stable to negative employment trends, potentially explained by the low adoption rate of digitalization and innovation and low training investments, and Class 3 follows the same trend. These findings support the idea that the relationship between digitalization and employment is complex and depends on factors such as the type of innovation, sector of activity and broader economic context. Moreover, the concentration of Class 2 firms (“traditional and local companies”) in Bulgaria, Hungary and Romania signals potential regional disparities in digitalization.
These results reflect the layered mechanism described in the literature review: technological inputs are linked to internal strategies, which in turn shape employment outcomes.
However, our findings challenge the assumption that innovation-driven digital transformation leads to widespread employment gains. As the LCA showed, some companies (such Class 4) have embraced digitalization and invested in staff training, but this transformation appears to be largely internal, without generating sufficient new jobs to offset losses in other classes.
This is consistent with Schumpeter’s creative destruction theory, where innovation displaces older economic structures, but in contrast to the compensation effect, there is limited evidence of job creation in the most advanced firms. Conversely, firms in Class 2 are lagging behind both technologically and in terms of workforce development and, revealing employment decline. This divergence in firm pathways showcases how digitalization highlights structural asymmetries on the labor market, with limited redistribution of gains.
The practical implications of these findings are related to how to approach public policies. Decision makers should try to find the right balance between investments in innovation and digitalization on the one hand and job creation and skilling on the other, as no one should be left behind. Public policies should aim to support traditional companies’ efforts to digitalize and innovate and at the same time promote continuous training programs for the employees. This results in less negative effects of digitalization on employment through upskilling, reskilling and digital skill development. Additionally, it is necessary to design differentiated policies to support both small companies and those with internationalization potential to remain competitive in the market, thus preserving jobs. Highly digitalized companies should also be supported by stimulating further innovation, especially by incentivizing partnerships with innovation hubs, especially in universities and tech unicorns. The latter should also be incentivized to develop further and innovate, including by promoting social innovation programs on how to create more and better jobs in emerging industries.
This analysis has several important social implications. As the results reveal that employment trends in Europe are not substantially optimistic, both decision-makers and companies’ management should be aware that, in the context of exponential technological development and innovation, jobs are about to become increasingly scarce, thus putting a high social pressure on them. This leads to the need to create additional employment opportunities for job seekers, either by increasing traineeship or apprenticeship offers or by creating more part-time job opportunities to newcomers to the market.
5. Conclusions
The purpose of this study was to analyze the behavior of European companies related to the adoption of digitalization and innovation and to identify specific similar classes based on a number of specific qualitative variables (Q1). In addition, employment patterns were studied across these classes (Q2). Based on the analysis of the four latent classes of companies, we conclude that the relationship between digitalization and employment shows a complex interaction linked to the level of technology and innovation adoption and key company characteristics.
Class 1 and Class 3 companies demonstrated moderate levels of digitalization and the tendency to maintain stable employment trends. Conversely, Class 2 companies, characterized by low digitalization, displayed declining employment trends. The highly digitalized Class 4 companies presented signs of automation that could hamper employment growth in the future. Notably, none of these categories demonstrated a significant increase in job creation, thereby questioning the applicability of the primary theory of ‘creative destruction’, which has been highlighted by various authors throughout all technological revolutions.
This study empirically traces the link between firms’ technological profiles, strategic behavior and employment outcomes. While LCA does not allow for causal inference, the consistent patterns observed across latent classes provide valuable insight into how firms adapt or fail to adapt to digital transformation. Our results indicate that digitalization and innovation, even when accompanied by training investment, do not automatically translate into job creation. The expected pattern of compensation, where job losses due to automation are compensated by new roles in digitally mature firms, is not clearly present. This has important implications for policy: if technological transformation remains confined to a narrow segment of firms and does not translate into broader employment gains, more targeted interventions may be required to ensure inclusive labor market outcomes in the digital era.
In conclusion, the findings of the four latent class analyses highlight that public policies need to promote the benefits of digitalization while mitigating potential negative employment outcomes. Public policies should aim to support the efforts of Class 2 less digitalized, traditional companies, and to adopt digitalization and innovation strategies observed in more advanced firms, such as those in Classes 1 and 4, by offering financial incentives to encourage digital adoption and innovation (
Crisan et al., 2023). Likewise, proactive measures to create diverse employment opportunities for jobseekers should be incentivized. Nevertheless, professional training should become a priority both for companies and governments, as informed by the success of Class 4 firms. Therefore, governmental funds, including European investments, should be directed towards upskilling, reskilling and improving the digital skills of European employees to increase their adaptability to labor markets (
Caravella et al., 2023). While advanced digitalization does not necessarily reduce jobs, the observed behavior of Class 4 companies, which showed a tendency towards automation and training over workforce expansion, suggest the need for strategies that balance digitalization and automation with employment sustainability.
This study has important limitations. These include the lack of longitudinal data and various macroeconomic variables. The data concerning future employment tendencies are based on HR representatives’ subjective responses and expectations, introducing a certain degree of subjectivity, while the potential impact of the COVID-19 pandemic was also missed. Nevertheless, other limitations stem from missing data on investments in R&D across Europe, productivity, technological investments and skill mismatch.
Using LCA to identify specific features and typologies of digitalized companies in conjunction with employment is an innovative approach that should be further explored and replicated. Further research is essential to develop a deeper understanding of the underlying conditions under which digitalization leads to inclusive and sustainable economic growth and sustainable job creation. Conducting a similar analysis on the latest ECS data could help shape EU policies and investments in digitalization, innovation, training and employment programs, particularly in light of the Draghi report (
Draghi, 2024).


