Abstract
Comprehending intermarket relationships among asset classes/commodities and the changing dynamics among the gold, bitcoin, and oil markets under high or low-volatility indexes is now imperative for investors. This paper presents a qualitative study to elicit expert views on the relationships between two major commodities (gold and oil) and bitcoin, specifically emphasizing the pre- and post-COVID-19 era. The thematic analysis of 30 finance experts revealed gold as a safe haven and portfolio diversifier; however, it has lost importance as an inflation hedge post-COVID-19 (2020–2022). Moreover, findings indicated that bitcoin was not a substitute for gold and that there was a positive correlation between gold and oil and the gold volatility index (VIX). Furthermore, there was a negative correlation between the oil VIX and the bitcoin VIX, with no correlation between the gold–bitcoin or oil–bitcoin nexus. These findings are pertinent for investors and scholars in the context of portfolio allocation/portfolio design that comprise these vital asset classes/commodities.
1. Introduction
The intermarket relationships among asset classes/commodities are changing and becoming more complex (Y. Zhou et al., 2023). Hence, it is vital to appreciate the asset class/commodity dynamics that play a significant role in portfolio design, which include gold, oil, and bitcoin. The proper determination and forecast of asset volatility is extremely important for investors (Souto & Moradi, 2023). Gold was one of the first metals used by humans, and the history of gold use goes back 5000 years or more to Egypt and Nubia. The gold-centric monetary standard or the “Gold Standard”, which links the economic unit of account to a fixed quantity of gold, was followed from the 1870s to 1971. Gold is important not just to central banks but also to governments, households, and institutional investors. Gold also provides diversification benefits owing to its negative correlation with equity markets (Artigas, 2010). Thus, it provides downside protection during economic downturns and works as an inflation hedge in a bull market (McCown & Zimmerman, 2006). The COVID-19 pandemic in 2020 caused gold prices to soar, peaking at USD 2075 an ounce in August 2020 and USD 2135 an ounce in 2023 as per the figures by Bloomberg. Currently, because of global inflation and the consequence of several rate hikes by various central banks (Federal Reserve, European Central Bank, Bank of England, etc.), gold has again started to play an important role.
With respect to oil, in the post-World War II era, countries like Iran and Saudi Arabia attempted to nationalize oil production. Although this was partly achieved, the main power over the market initially remained with the USA and the Soviet Union. Later, in 1960, the Organization of Petroleum Exporting Countries (OPEC) was formed by Iran, Iraq, Kuwait, Saudi Arabia, and Venezuela. This was later expanded to 13 members and aimed to have more control over prices and to strengthen collaboration among the oil-producing countries1. Today, the oil price is one of the indicators of economic expansion (Mlaabdal et al., 2020). The peak oil price was recorded for West Texas Intermediate (WTI) crude on 11 July 2008 at USD 147.27 per barrel. In April 2020, during the COVID-19 pandemic, WTI was negative for the first time in history (USD −37/per barrel) owing to a severe shortage of storage capacity that outweighed the benefits of price (Chiaramonti & Maniatis, 2020). Considering oil scarcity, early studies (e.g., Kober et al., 2020) opined that by 2060, the reserves would be depleted, and the world would move into more sustainable alternative energy sources.
Bitcoin, a recent and unconventional asset, is a part of the crypto-asset family and arguably the most important one. Bitcoin is a digital token created by a code (protocol) running on multiple computer hubs to form a decentralized network. The bitcoin network creates and moves around bitcoin digital tokens. Increasingly, bitcoin is being accepted by investors like any other government- or central bank-controlled fiat currency (e.g., USD, EURO, GBP, etc., which are issued by the government and not backed by a commodity). The fundamental difference is that a single person, institution, central bank, or government does not own bitcoin. There is a bitcoin cap of a maximum of 21 million (Chohan, 2022). Countries like China, Russia, India, Vietnam, Bolivia, Columbia, and Ecuador have strong regulations against bitcoin. However, the USA, Canada, Australia, and the European Union have shown a positive tilt towards bitcoin.
Looking at the interrelationships between these three major assets which belong to the asset classes of commodities and cryptocurrencies, the pre-COVID-19 era was a period of low correlation between gold and bitcoin, and there was also a relatively weak correlation between oil and gold and oil and bitcoin (Maghyereh & Abdoh, 2022). Post-COVID-19, the relationship has become more dynamic. The oil price has increased owing to more demand after the opening of the global economy and to the geopolitical crisis caused by the Russia–Ukraine conflict. If we analyze recent studies, Tanin et al. (2022) concluded that the gold–oil relationship holds true in the short term and oil can be used to predict gold. However, this finding was contradicted by Benlagha and El Omari (2022), who found a significant relationship between gold and oil during COVID-19. Ji et al. (2020), Mensi et al. (2020), and Syuhada et al. (2022) compared gold and bitcoin, and concluded that gold was more consistent and was a superior hedge in terms of reducing portfolio risk. Moreover, Jareno et al. (2021) concluded that the relationship between oil price shocks and crypto currency returns was higher during the COVID-19 crisis period compared with the pre-COVID-19 period.
Equity is another important asset class that may be incorporated to analyze against the above-mentioned asset classes. However, selecting one index may not represent the whole equity market. Instead, the movements of the above asset classes may be analyzed using equity volatility. Whaley (2009) remarks that the Chicago Board Options Exchange’s ‘CBOE Volatility Index’ (VIX), which gauges the anticipated volatility of S&P 500 index options, is the most accurate indicator of equity volatility.
The concept of the VIX2 (Sigma Index) was coined by Menachem Brenner and Dan Galai in Financial Analyst Journals in 1989. The VIX is frequently referred to as the fear index or fear gauge because many investors use it to quantify risk, anxiety, or tension in the equities market (Carr, 2017). Using options-based theory (Fernandes et al., 2014) and up-to-date options market data, the current VIX index value is the anticipated annualized change in the S&P 500 index over the next 30 days. On 16 March 2020, the VIX closed at 82.69, the highest since its inception. Looking at the relationships between these asset classes pre- and post-COVID-19, oil was relatively stable and was influenced by supply and demand and geopolitical events. During COVID-19, there was a low correlation between gold and bitcoin and a relatively weak correlation between oil and gold and oil and bitcoin (P. Wang et al., 2021). Post-COVID-19, the relationship has become more dynamic. Gold retreated initially, then showed a steady growth trajectory as an inflation hedge and counter to potential dollar (USD) weakness. In contrast, bitcoin initially surged because of risk-on sentiments, signaling a declining trend due to risk-off sentiment and regulatory tightening. Prior research has attested to the return unpredictability in cryptocurrency markets, and this is still drawing attention in the research arena (Karasiński, 2023).
Extending the recent and previous work of these scholars, the current paper aims to answer the research question ‘What are the intermarket relationships between the gold, bitcoin, and oil markets under different economic scenarios using the health of the economic situation or the volatility?’ The VIX tracks economic uncertainty or volatility. The non-standard features of VIX are fruitful for long-term investors searching for profitable portfolio diversification (Latoszek & Ślepaczuk, 2020). The key contributions of the paper are multi-fold. First, it explores the changes in intermarket relationships in asset classes before and after COVID-19. Second, to the best of our knowledge, this is the first comprehensive study to analyze three assets—gold, oil, and bitcoin—together. This is important because few papers highlight the relationships among these asset classes and link them to the VIX, especially over varied time horizons like pre- and post-COVID-19. Volatility as an asset class is a relatively new concept in financial theory, but due to its rapid development and new investment possibilities, the interest of academia and professionals has increased remarkably. Third, the paper addresses the gap in knowledge regarding the behavioral aspects of finance. Fourth, this is the first paper of its kind to highlight the role of information theory in the domain of applied finance. Fifth, this is the first paper, to the best of our knowledge, to conduct a qualitative study, a design that has garnered limited attention in research (Y. Kim, 2011, p. 191), to unveil the views of mixed expert groups practically and frequently contributing to the domain. Finally, the paper accommodates a multi-theoretical approach by integrating behavioral theory, information theory, and entropy theory when addressing the interrelationships of the asset classes like gold, oil, bitcoin, and VIX.
The remainder of the paper is organized as follows: Section 2 covers the theoretical foundations while Section 3 contains the literature review. The data and methodology used for the study are shown in Section 4. Section 5 reports the findings, while Section 6 and Section 7 contain the discussion and the limitations, implications, and recommendations, respectively.
2. Theoretical Foundation
The behavior and the performance of asset classes need to move beyond fundamental or technical analysis (Chandra & Thenmozhi, 2017). For example, the bias of investors and experts plays a major role in defining the performance of the assets. However, behavioral aspects are a missing link in the arbitrage of financial assets, and these are not captured by mathematical models (Leković, 2019). In addition, the growing abundance of information in recent years poses a challenge for rational investment decision-making. This paper employed a novel entropy and information theory approach as well as the more commonly used behavioral finance theory to investigate the behavioral aspects of investment.
2.1. Entropy and Information Theory
Information theory (Shannon, 1948) is a mathematical theory of communication, and it has only recently begun to be applied in economies and finance. The theory is based on developing a “usable measure” from the information communicated. Here, the net received information can be defined as total information generated minus information asymmetry (Chen, 2004). However, the amount of information received may vary across investors. Shannon’s entropy theory (Shannon, 1948), which was originally considered in relation to technical problems of information transmission across channels, has been used by economists to connect the information theories for economics and finance. Entropy is used in a mean-variance model to replace variance for options pricing and asset probability distributions (R. Zhou et al., 2013). Another critical theory is the Rényi entropy (Rényi, 1960) which is considered the generalized version of Shannon’s entropy (Lahmiri & Bekiros, 2020). A study that used Rényi entropy to assess the return time series of bitcoin, S&P 500, WTI, Brent, gas, gold, silver, and VIX revealed some important observations. For example, any portfolio composed of two assets which included bitcoin reflected more disorder or randomness during low probability extreme events. However, an exception was found in assets comprising bitcoin and gas. In contrast, the lowest levels of disorder or more diversification during the COVID-19 pandemic were experienced by two asset-balanced portfolios like “gas and silver”, “gold and silver”, “gold and gas”, “Brent and silver”, “Brent and gold”, or “gas and VIX” (Lahmiri & Bekiros, 2020).
Another multiscale entropy study was conducted regarding the market efficiency of the S&P 500, gold, bitcoin, and the USD index during COVID-19 by J. Wang and Wang (2021). A contagion effect and reduced market efficiency were observed in all assets during the COVID-19 pandemic; however, the S&P 500 was the worst impacted asset class and bitcoin showed more resilience compared with the other assets.
2.2. Behavioral Finance Theory
As the name suggests, behavioral finance theory is based on the rationality of conventional finance but goes beyond the modern portfolio theory by Markowitz (1952) or the efficient market hypothesis (Fama, 1965). Kahneman and Tversky (1979) are considered to be the founders of behavioral finance with their prospect theory which is based on human bias. According to the prospect theory (also known as the loss aversion theory), investors have different values for an equivalent amount of gain and loss. Since losses have a greater emotional impact on investors, the amount of gain must be greater than the amount of loss.
Subsequently, Peter and Tversky (1993) revised the prospect theory to the cumulative prospect theory where investment assessments were linked with biases. Likewise, Statman (1995) opined that the financial decisions for investors and portfolio managers were based on risk management and the way of presenting the information. Simon (1997) developed a concept of bounded rationality where the investor decision is based on satiety, though the results may not be optimal. Then, Barber and Odean (1999) explained the “gender bias” whereby male traders are more confident than females while trading. However, at times male traders make erroneous judgements due to overconfidence. Also, Shefrin (2000) suggested that investors should be aware of their mistakes and counterparty errors and that the loss of one party may be the gain of the other party. Hence, the evolution of behavioral finance cannot be ignored when analyzing the intermarket relationships of various assets.
3. Empirical Review
3.1. Gold and Oil
First, this investigation investigated the connection between oil and gold. When compared with equities across all markets, gold was a safe haven, but not when compared with bonds (Baur & Lucey, 2010). Due to their inverse relationship with stock markets, Sujit and Kumar (2011) determined that investments tied to oil were the best risk hedge during periods of uncertainty in oil prices. However, these studies are relatively outdated, and the market volatility and previously unheard-of external factors that influence the link have changed. Moreover, the appreciation of gold has recently served as a hedge against geopolitical crises in relation to the yield augmentation (price depreciation) of 10-year US Treasury notes following Russia’s invasion of Ukraine (Neely, 2022).
Thus, it may be concluded that gold has served as a safe haven throughout times of crisis, even when bonds were on the decline. M. H. Kim and Dilts (2011) found that the USD–oil and USD–gold relationships had an inverse connection. Later, Ciner et al. (2013) looked at five main assets: the USD, equities, bonds, oil, and gold. They discovered that gold was a safe haven for investors compared with oil. Again, because both gold and the USD have appreciated, M. H. Kim and Dilts’ (2011) conclusions are less applicable in the present geopolitical environment. Similarly, Reboredo (2013) stated that gold served as a hedge against sharp fluctuations in the price of oil. Nevertheless, in order to understand the intermarket relationship between these two asset classes before and after COVID-19, as well as up to Q1 2022 to account for the recent Russia–Ukraine war and related geopolitical crisis, we contend that more research is necessary to test the findings of both Ciner et al. (2013) and Reboredo (2013).
The study on crude oil’s capacity to forecast stock market conditions using implied volatility data was extended by Al-Khazali et al. (2018). The study used a bi-variate cross-quantilogram approach and focused on the efficient frontier hypothesis (Han et al., 2016). Their methodology, which worked best in a non-crisis financial time, showed that directional prediction was weak when crude oil implied volatility was at a medium or high level. In contrast, sustained predictability was high when it was low. Gharib et al. (2021) employed Granger causality tests to deduce the bilateral contagion bubble effects in oil and gold markets during the initial phase of the pandemic.
Similarly, Salisu et al. (2020) used a VARMA-GARCH model to determine the function of gold as an appropriate hedging mechanism against crude oil price anomalies during the early pandemic; however, Mensi et al. (2020) observed an asymmetrical multifractality behavior in gold and oil prices. The VAR-BEKK-AGARCH model was also used by Huang and Wu (2021) to demonstrate strong asymmetric spillover effects from the oil to the gold market during the pandemic. They specifically concluded that negative information shocks in the oil market significantly impacted the volatility of gold returns during the pandemic.
More recently, Tanin et al. (2022) conducted a thorough analysis of the link between oil and gold before and after COVID-19 in five major stock markets. The findings indicated that there was only a short-term association (to differing degrees depending on the market); oil prices could not forecast gold prices. However, in five major stock markets, Benlagha and El Omari (2022) concluded that gold and oil were related, with gold as a favorable receiver and oil as the shock transmitter during COVID-19.
3.2. Gold, Oil and Bitcoin
Second, a particular school of thinking examining the connections between bitcoin, oil, and gold has just surfaced. While Gajardo et al. (2018) found that bitcoin had a higher cross-correlation with the WTI, Selmi et al. (2018) found that both gold and bitcoin demonstrated hedging qualities against oil fluctuation. According to Das et al. (2020), gold proved to be a better safe haven in dire circumstances, even though bitcoin was more effective at hedging the oil volatility index (OVX). In addition, Yin et al. (2021) reported on the relationship between the oil market and cryptocurrency. They highlighted the significance of fluctuations in the oil price as indicators of uncertainty in the cryptocurrency market because of the latter’s relationship to macroeconomic variables, including monetary policy, global interest rates, and inflation.
More recently, Wen et al. (2022) concluded that gold was a superior option to protect against the volatility of the stock market and oil during the pre-COVID-19 era. However, bitcoin had a decent hedging effect against oil. Jiang et al. (2022) used the Markov Chain Monte Carlo technique and the TVP-VAR model to measure volatility spillovers. They found that gold showed consistently positive spillovers, confirming its status as a safe haven. Conversely, they proposed that bitcoin might be considered an investment hedge, with oil being marginalized as a hazardous asset. However, over time, it might be wiser to back up Das et al.’s (2020) claims about gold’s superior safe haven qualities over bitcoin. Similarly, Syuhada et al. (2022) stated that adding gold to their energy portfolio clearly reduced risk because bitcoin’s safe haven qualities in the portfolio were inconsistent in their capacity to reduce risk (see also Ji et al., 2020; Mensi et al., 2020).
3.3. Gold and Bitcoin
Third, the existing body of research has examined the connection between bitcoin and gold, with conflicting findings to date. Earlier, Glaser et al. (2014) identified bitcoin as a speculative asset rather than a currency or a means of payment, while Yermack (2015) found that bitcoin was a poor diversifier and had little association with gold and other currencies. According to Dyhrberg (2016), who positioned bitcoin between gold and the USD (commodities and currencies), it had many characteristics of both the USD and gold’s hedging capabilities. At the same time, Urquhart (2016) concluded that bitcoin was inefficient from 2010 to the middle of 2016 (Caporale et al., 2018; Kristoufek, 2018), after which it progressively became more efficient. Wei (2018) and Nadarajah and Chu (2017) also concluded that bitcoin was now nearly efficient.
Nonetheless, according to Klein et al. (2018), gold was a better hedge than bitcoin during market stress, while Al-Yahyaee et al. (2018) proposed that gold, stocks, and cash had higher efficiency than bitcoin. Similar findings were made by Al-Khazali et al. (2018), who discovered that bitcoin was less impacted by surprises than gold, which consistently responded to macroeconomic news surprises in line with its historical function as a safe haven. Taking a broader view, Aggarwal et al. (2018) looked at six asset classes: commodities, real estate, gold, fixed income, equity, and alternative investments. They concluded that bitcoin had significant potential to improve risk-adjusted returns.
Market characteristics became a determining role in the risk-safety aspects of bitcoin. Dorfleitner and Lung (2018) concluded that cryptocurrency was only a safe haven when the market was mature, with positive markets being the only relevant times. According to Bouoiyour et al. (2019), bitcoin was more effective at transferring values, while gold was a superior diversifier. They also claimed that there were clear distinctions between gold and bitcoin in dire circumstances. Wu et al. (2019) developed this idea and further concluded that uncertainty at lower and higher quantiles made bitcoin more unstable. Similarly, Symitsi and Chalvatzis (2019) found that bitcoin showed little return when combined with other assets, and that economic factors like uncertainty surrounding trade policy had a negative effect on bitcoin acceptance. Times of crisis also caused significant co-movements and undulations in bitcoin (Kang et al., 2019). However, the former authors’ pre-COVID-19 study period begs the question of whether the risk-adjusted higher return is still relevant.
In order to hedge the bitcoin spot price in the post-COVID-19 period, Zhang et al. (2021) compared gold and bitcoin futures during the COVID-19 phase. They concluded that bitcoin futures were a stronger hedge than conventional gold futures and that there was a strong correlation between bitcoin spot and futures using the VAR-DCC-GARCH and VAR-BEKK-GARCH models. Additionally, they proposed that there was bidirectional volatility spillover between bitcoin futures and spot. In the same spirit, Shehzad et al. (2021) assessed the safe haven qualities of gold over bitcoin. They asserted that throughout the epidemic, gold became the most favored asset in the Asian, US, and European stock markets.
Gold was also mentioned by Parvini et al. (2022) as a more accurate indicator of bitcoin movements from 28 June 2018 to 4 April 2020. In contrast, Chemkha et al. (2021) used the A-DCC model to study the US, UK, Japanese, and European markets. They concluded that gold and bitcoin could be effective hedges during periods of stability and external shocks. Gold had a weak advantage in maintaining safe haven properties, except for the Nikkei 225, while bitcoin could not withstand contingencies. It is interesting to note that Wen et al. (2022) examined the various dimensions of these asset classes and used the TVP-VAR model to suggest that these two assets were better hedging tools before COVID-19, with gold continuing to be a significant hedging tool against stock and oil markets during the early and peak COVID-19 periods while bitcoin lost its prominence. Conversely, Barbu et al. (2022) show a positive association between bitcoin and gold, suggesting that cryptocurrencies were a safe haven during the COVID-19 pandemic, demonstrating the maturity of the cryptocurrency market.
3.4. Bitcoin–Oil and Bitcoin–S&P 500
Fourth, Jareno et al. (2021) established the relationship between oil and cryptocurrency using the NARDL model to explore more unusual commodities. They discovered that, in comparison with the pre-COVID-19 period (20 November 2018 to 28 February 2020), the degree of interconnection between oil price shocks and cryptocurrency returns peaked during the COVID-19 crisis period (2 March to 30 June 2020). With the exception of Tether, every cryptocurrency exhibited a strong positive correlation with oil price demand shocks, a strong negative correlation with oil price risk shocks, and no association with supply side shocks at any point in time.
Results also evinced that throughout the pandemic, cryptocurrency returns were correlated with oil price variations. A related study was conducted by Vukovic et al. (2021) to investigate bitcoin as a hedge against risky investments. With the exception of Tether, which was more stable than other cryptocurrencies, the analysis found that risky assets like the S&P 500 had a direct impact on all cryptocurrencies using OLS and quantile regression estimations. The wavelet coherence analysis verified no contagion effect and poor coherence in crypto pairings, including Tether. As a result, Tether—but not bitcoin—may take the role of gold as a hedging instrument.
These investigations conclude that bitcoin might not be a good hedge against the S&P 500 and oil shocks. The Tether investigation highlights future research prospects, even though it is outside the purview of this publication. Furthermore, research could also be expanded to determine whether the correlations between bitcoin, oil, and the S&P 500 still exist in the present context.
3.5. Gold, Bitcoin, and the Volatility Index (VIX)
The last body of literature involves studies highlighting the different aspects of the gold, bitcoin, and volatility index nexus to demonstrate their multipath interactions. To determine the safe haven qualities of gold and VIX for the US stock market, Matthew and Farooq (2013) used data from November 1995 to November 2010; both gold and VIX displayed a negative association with the stock market. Compared with gold, VIX displayed a weaker correlation and, thus, better safe haven qualities. Using a GARCH and Exponential GARCH model to assess the pattern of bitcoin volatility, López-Cabarcos et al. (2021) more recently investigated investor sentiments in their study to determine the impact of social network sentiment, the S&P 500, and VIX on bitcoin volatility. The findings showed that investors were knowledgeable about the volatility of bitcoin and that when stock markets were stable, they became more speculative.
Despite being pertinent to the pre-COVID-19 era, Matthew and Farooq’s (2013) findings are outdated. To create novel asset-commodity connections, hitherto unheard-of socioeconomic and political shocks must be taken into account. Furthermore, in light of the elevated uncertainties and high VIX, the characteristics of gold and bitcoin must be contrasted.
The empirical review justifies our examination of safe haven assets amidst the pandemic fears, investigating investors’ preference for gold in comparison with oil and bitcoin during high and low stock market volatility in the pre- and post-COVID-19 eras. This approach is backed by Markowitz’s modern portfolio theory of optimal selection and behavioral theories, where the former focuses on the expected risk–return relationship and the latter attributes herd behavior among investors who make heuristics-based decisions rather than fact-based or rationale-based decisions.
4. Methodology
The paper utilized a qualitative research design to expand the theoretical studies. Few papers have explored the influence of the behavioral aspect on the relationship between the different asset classes/commodities (Peter & Tversky, 1993). There is little guidance about the sample size required for a qualitative study (Hertzog, 2008). Browne (1995) suggested a sample size of 30, while Julious (2005) suggested 12 samples per group as a rule of thumb, and Teare et al. (2014) considered 70 as the acceptable size. The current study conformed with Browne (1995) and adopted 30 as the sample size. The respondents in this study were chosen using convenience sampling techniques. We targeted candidates with CFA or CA qualifications, an MBA in Finance, and/or relevant experience and expertise in economics and finance. The group comprised wealth management experts, bankers, relationship managers, investment advisors, and product specialists in economics and finance.
Semi-structured interviews were conducted in-person and online between Q4 2022 and Q1 2023, each lasting roughly 45 min. Potential subjects received an email inviting them to participate in the study. A consent form with details on the subjects’ voluntary involvement, confidentiality, anonymity, and ability to withdraw at any time, as well as information relevant to the goals and objectives of the current research study, were distributed. The corresponding participants received the transcripts to review and comment on the details they had supplied during the interview. This increases the reliability and validity of participatory and collaborative research strategies (Thomas, 2017). We approached 100+ experts and received responses from 30 experts. Building on the work of Jones et al. (2011), we adopted an inductive, evaluation-centered approach to identify inherent themes and subthemes within the dataset. Thematic analysis, a technique grounded in psychology, is acknowledged as a valuable method for “analysing and reporting patterns in data” (Braun & Clarke, 2006), where a theme captures the essential ideas generated from the information analyzed.
The thematic analysis used in this study was based on the analysis of qualitative data described by Braun and Clarke (2006). Qualitative thematic analysis was selected to identify, analyze, and report patterns and themes in the interview data from 30 finance experts about intermarket correlations of gold, oil, and bitcoin. The six steps of the analysis process included familiarization with data, initial coding, searching for themes, reviewing themes, defining and naming themes, and producing the final report. Respondent validation was employed, in which participants were asked to review the accuracy of their individual interview transcripts to enhance the credibility of the thematic analysis. The themes were further corroborated using triangulation with the extant literature on intermarket relationships. Researcher reflexivity was an integral component of the team process, with the research team recording potential biases and assumptions to facilitate a balanced interpretation of the data.
5. Results
5.1. Demographic Profile
Of the respondents, 70% were male, while 30% were female (Table 1). The age groups of the experts were between 25–50, with 66% of the respondents being between 36–45 years. Indian nationals dominated the expert group (67%). Sixty percent of the respondents were either CFA or studying CFA or held dual professional qualifications like CA and CFA. Thirty percent of the respondents belonged to wealth management. The respondent profile showed that the group was dominated by males, mid-career professionals, with most of them in their late 30s to early 40s and with significant experience in the financial and investment sectors. The high proportion of Indian and Arabic nationals suggests a regional dominance, possibly of the demographic of the financial industry in such markets. The high percentage of CFA certification holders, complemented by a high proportion of CA and higher academic degree holders, indicated that the respondents were well-qualified professionals with sound technical background in finance, investment, and wealth management. The fact that they were diversified across industries with a focus in advisory, treasury, and product management roles indicated their role as decision-makers and strategists in financial planning and investment management areas. The availability of CFOs, CIOs, and finance educators also showed a combination of leadership, technical knowledge, and knowledge transfer in the sector.

Table 1.
Characteristics of respondents.
5.2. Interview Findings
The audio recordings of the interviews were transcribed, and the transcripts were reviewed several times to familiarize with the data. This was followed by separate coding processes. Key extracts were highlighted using NVivo software (version 12) for qualitative analysis and then coded descriptively. The codes included “safe haven”, “portfolio diversification”, “high volatility impact”, and “post-COVID shifts”. The coding was iterative, with new codes developed as patterns were identified in the data. Figure 1 below shows the word cloud generated from the analysis.
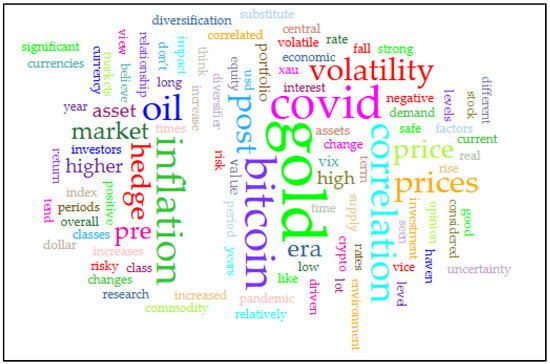
Figure 1.
Thematic analysis word cloud.
Following the analysis, key themes that corresponded closely with the study’s focus were identified and described in the findings section. The following were identified as the key themes and subthemes:
- Gold as a safe haven and hedge;
- Bitcoin’s role in portfolios;
- Intermarket relationships;
- Volatility dynamics.
The correlations between these core themes and subthemes emerging from the analysis are illustrated in a mind map (Figure 2).
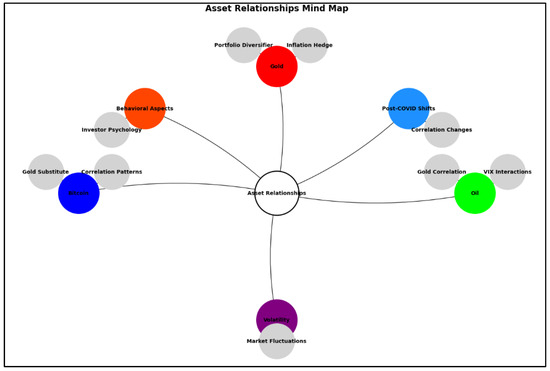
Figure 2.
Mind map of asset relationships.
5.3. Analysis of Themes
5.3.1. Gold as a Safe Haven and Hedge
Out of 30 interviewees, 19 experts claimed that gold was a portfolio diversifier, with one expert disagreeing with the majority by stating that the asset had no intrinsic value or cash flow. Hence, it could not be considered a diversifier. Most experts opined gold as a safe haven investment that hedged geopolitical risks and weathered extreme market fluctuations but exhibited high volatility. Moreover, its negative correlation with the USD was an important diversification against the USD as a currency not only to investors but also to central banks.
For example, Expert 1 mentioned that historically, gold had been a hedge when the VIX increased due to volatility. However, this commodity was driven by sentiment and had no industrial use. In the medium-term, gold was a strong diversifying asset class but its correlation with traditional assets increased with time, especially with the emergence of other alternative options. Expert 7 identified that participation in gold diversification could be broadly in two forms: through gold shares and bullion. However, depending on the choice of diversification, gold could be an erratic diversifier. The volatility levels of gold shares were far higher than other assets, while gold bullion risked being stagnant with no gains to be made for long periods of time. For example, gold shares were stable for 15 years from 1986 until approximately 2000–2001, then grew eight-fold in the following 10 years. They grew by a further 40% in a month during the COVID-19 pandemic in 2020.
Therefore, depending on the market crisis and the extent of the downturn (with other possible safe havens also not yielding much), gold could be a relevant store of wealth. For instance, during COVID-19, the S&P 500 dropped by 34% in a month. Market players switched from riskier options, like stocks and emerging currencies, to assets typically considered safe havens, like precious metals, in this atmosphere of widespread fear and uncertainty. The reliance structure between the many assets that make up a portfolio was the most important component of a diversification strategy. Because gold and stock markets have an inverse relationship, investors could lower their overall risk exposure because possible losses in stocks could be offset by gains in gold, or at the very least, the effect of the losses could be lessened.
Gold was an excellent diversifier during the 2008 global financial crisis (GFC) because there was a severe market downturn, with most assets in the negative, and even alternate sources that might typically be considered safe havens also yielding low or zero returns due to the drastic cut in interest rates by the US Federal Bank. However, during times when other safe haven assets (e.g., US Treasuries) start to offer yield or income, gold could lose its diversifier impact because gold is an asset that does not yield any income, unlike Bonds or Treasuries. If, within a portfolio of equities and bonds, equity shares of gold companies rather than gold bullion were used (approximately 10% of the portfolio), then the portfolio showed better outcomes in terms of returns. However, higher returns came with a higher risk as well.
With respect to gold as an inflation hedge, 16 out of the 30 experts pointed out that gold had lost its value as an inflation hedge, with a few experts stating that gold might remain an inflation hedge against low and stable inflation under “normal” market conditions. For example, Expert 10 mentioned that “inflation over 2012–2019 averaged at under the 2% target whereas XAU (gold) saw a 45% swing from high to low and ended that period 15% down from its 2012 high. With inflation albeit low but positive during the period and XAU depreciating in USD value, it cannot be argued that XAU was an inflationary hedge over the whole period between 2012 to 2019. Looking more minutely, from 2015 to July 2016, however, inflation went from 0% to around 1.5% while XAU sharply appreciated 31.11%, giving a net appreciation in USD value ~28.6%”.
To elaborate further, if we looked at the correlation between the XAU and inflation, they clearly tracked each other. As inflation rose, the XAU rose in value with the XAU percentage increases being greater than that of inflation. Thus, it can be argued that the XAU is a valid hedge against inflation although this depended on inflation stability and the market condition. However, if there was an exogenous shock in the economy in the form of extremely loose monetary policies or a large fiscal response, gold would lose its value to the USD or USD-denominated assets like the US Treasury. Also, during different time periods, the price change of gold did not necessarily match the change in inflation; hence, it is difficult to call gold a complete inflation hedge. Some of the experts pointed out that during lockdown and post-COVID-19, especially during geopolitical tensions such as the Russia–Ukraine war, governments had settled expensive energy prices in USD. Thus, the USD acted as a better inflation hedge than gold or any other commodities. Expert 23 opined that two factors held back a rise in the gold price. First, because gold did not pay interest, during inflation, consumer product price increases affected the disposable income of the household. Thus, consumers wanted their investments to provide returns periodically to meet the price increase. During inflation, the bond yield increased; for example, the current 10-year yield rate is 3.50%, which increased from 1.5% between 2021 and 2022. Thus, investors would incur an opportunity cost if they held onto gold compared with 10-year bonds. Second, the USD had appreciated rapidly and had reached its highest point in two decades. Because the gold price was also quoted in USD, it was more expensive for foreign investors who used currencies other than USD to invest in gold. During inflation, the adverse impact of the USD strengthening was further magnified. Therefore, gold tended to perform poorly when the USD strengthened.
5.3.2. Bitcoin’s Role in Portfolios
Out of 30 interviewees, 24 categorically rejected bitcoin as a substitute for gold in terms of an inflation hedge or portfolio diversifier. Expert 3 elaborated that, pre-COVID-19, bitcoin had the potential to be a substitute for gold in the portfolios due to the simplicity of holding and buying it. It was mainly adopted by the millennial generation rather than by other investors and traders due to a lack of regulations and high uncertainty. However, post-COVID-19, the significant drop in bitcoin value showed the poor hedging and diversification properties of bitcoin. Expert 3 also highlighted that bitcoin had other limiting factors, such as no intrinsic value, a high correlation with the technology sector, higher volatility, relatively less historical track record, and regulatory nonacceptance. The rise of bitcoin is probably noteworthy for the three years from 2017 when the Chicago Mercantile Exchange (CME) announced that it would launch bitcoin futures, and there were many more advocates of cryptocurrencies. With prolonged shutdowns and several rounds of government economic stimulus payouts, the COVID-19 epidemic in 2020 left many people with extra cash and free time, which contributed to a late 2020 spike in bitcoin values.
There was one strong voice in support of cryptocurrency. Expert 11 elaborated that they thought bitcoin would emerge as a substitute for gold due to factors such as: (a) gold storage versus bitcoin network security. The bitcoin network, by design, is very secure and cannot be easily hacked. It requires substantial computing power to perform a 51% network attack, which may indeed be impossible. The cost to store bitcoin is very cheap. In contrast, gold is a safe haven asset that has to be stored in a secure location, and this incurs a cost; (b) transferability: bitcoin can be transferred more easily than gold; (c) scarcity: the total production of bitcoin is fixed, and it is not abundant like gold. While bitcoin may be driven by speculation today, as adoption and regulation increase, it will continue to gain an allocation within investment portfolios as an asset class. Bitcoin may become a valuable addition as a diversifier and inflation hedge once regulatory acceptance increases.
Expert 23 mentioned that bitcoin was meant to work well as an inflation hedge only when the inflation was caused by monetary policy inflation, i.e., when a central bank reduced the interest rates to increase the liquidity in the market, which in turn increased people’s spending power. When inflation was caused by other reasons, such as the current economic environment due to war, energy crises, and food supply shortages like wheat because of sanctions imposed on Russia, and the Federal Reserve rapidly increased interest rates to tighten monetary policy, there was a sense of fear within the public that the economy may be heading towards recession. During these times, people reflected a flight to safety behavior and invested in safe assets such as government bonds rather than volatile assets such as bitcoin.
5.3.3. Intermarket Relationships
Correlation of Gold and Bitcoin, Pre- and Post-COVID-19
Out of 30 interviewees, 19 experts found no or a weak correlation between gold and bitcoin. They based their opinions on Horstmeyer and Kowalski (2022), which observations on bitcoin–gold associations (see Table 2 below). In contrast, five experts found a positive correlation between the assets, and two experts reported negative correlations. Expert 4 elaborated that bitcoin was not a diversifier against equities because both were highly correlated. Gold offered diversification over the long term. Bitcoin and gold had less correlation with each other. Therefore, in the case of equity being sold off, bitcoin might also be sold off, and gold might help diversify, both only in normal times. In situations like COVID-19 or a financial crisis, diversification might not work. Expert 7 reported a slight positive connection of 0.057 between bitcoin and gold amid an upswing in the stock market. The correlation only marginally increased to 0.064 during a stock market meltdown. As a result, the correlation between gold and bitcoin was nearly zero regardless of the status of the equities markets.
Table 2.
Crash correlations: bitcoin and gold. Source: (Horstmeyer & Kowalski, 2022).
According to Expert 20, the correlation was purely based on press coverage on gold, the USD, bitcoin, and government adaptation of cryptocurrencies. At times, gold and bitcoin have shown correlation and similar price movements. During highly volatile market movements different speculation can arise around the safety of the major developed market currencies in terms of their real value vs. a basket of goods.
Correlation of Gold and Oil, Pre- and Post-COVID-19
Of 30 interviewees, 18 experts commented on the positive correlation between gold and oil. The experts pointed out some crucial commonalities like both assets being priced in USD and correlated with geopolitical concerns. However, many of them observed that the strong positive correlation of the assets pre-COVID-19 changed to a negative correlation during COVID-19 and a weak positive correlation post-COVID-19. Expert 12 commented that there was a positive correlation between gold and oil in the long run, which broadly stayed true in the pre-COVID-19 era. The post-COVID-19 era has been more driven by oil from a demand and supply disruption perspective, with oil coming back very sharply due to the demand bump and supply constraints while gold had experienced a bounded range. The correlation has declined in the post-COVID-19 world. According to Expert 16, the moderately positive pre-COVID-19 correlation (range 0.40–0.48) between gold and oil changed to a weak positive correlation (range 0.19–0.22). Because gold is normally considered a safe haven in volatile times, in the COVID-19 times the gold price rose above 2000 levels while the oil price dropped due to an increase in oil supply and lower demand in the contracted COVID-19 economy. This reduced the overall correlation between gold and oil, which historically was moderately strong.
In contrast, two experts reported a negative correlation between gold and oil, and eight experts found no correlation or no consistent correlation because of the different nature of the two assets. Expert 15 stated that the oil price was more a function of geopolitics and speculation (price driven by traders) than pure demand and supply. OPEC+ largely controls the oil price by adjusting the production levels; this adjustment is not entirely based on demand and supply but also on geopolitics. Gold, in contrast, is a demand and supply-driven price. For example, the XAUUSD rises when central bankers accumulate gold or when the festive season occurs in countries like India. The XAUUSD is also sensitive to US Treasury yields and the USD strength. Higher US Treasury yields lead to a fall in the XAUUSD price because the XAUUSD is a non-income-yielding asset. Therefore, Expert 15 did not think there was a meaningful correlation between the XAUUSD and oil. Similarly, Expert 28 stated that the correlation between gold and oil historically was complex, with fluctuations in the price of one asset sometimes affecting the price of the other. During the pre-COVID-19 era, from 2012 to 2019, the correlation between gold and oil was relatively low, suggesting that they were not strongly linked. However, in the post-COVID-19 era, from 2020 to the present, the correlation between gold and oil increased somewhat, likely due to the economic uncertainty brought on by the pandemic. It is important to note that the correlation may change depending on market conditions and geopolitical events.
Correlation of Bitcoin and Oil, Pre- and Post-COVID-19
Out of 30 interviewees, 15 experts found no correlation between bitcoin and oil. Although both prices are driven by demand and supply, bitcoin is more speculative. Oil, however, reflects the economic outlook, and there was no difference between pre-COVID-19 and post-COVID-19. Bitcoin is a software code, while oil requires physical production. These asset classes are attractive to different investors and traders, and it is unlikely that any correlation will be seen unless there is a major move on the USD because both assets are priced against the dollar. Bitcoin was a hedge that could help reduce crude oil’s portfolio risk. However, post-pandemic, the correlation has come under question. Moreover, Expert 7 opined if individuals had more money, they would invest more in bitcoin. As a result, while oil and gas costs may not directly affect bitcoin prices, the cryptocurrency would likely increase or fall less if consumers did not have to spend more on necessities.
In contrast, 10 experts found a positive correlation between bitcoin and oil. It may be possible in the post-COVID-19 era to see oil being priced and paid for in bitcoin, which will have a direct impact on the oil–bitcoin correlation. As explained by Expert 12, a positive correlation between oil and bitcoin is visible in the long run, thus revealing their volatility. Post-COVID-19, the correlation has been reduced because bitcoin has shown a higher correlation with risky equity-like tech/semiconductors/commercial services, while oil has been data and demand-driven. Some of the correlation metrics may revert once the supply issues are normalized. According to Expert 16, there was a negative correlation between bitcoin and oil in pre-COVID-19 times in the range of −0.19 to 0.18. However, the correlation increased to +0.47–0.50 levels during the COVID-19 and post-COVID-19 era.
Nevertheless, Expert 26 mentioned that the correlation between bitcoin and oil in the pre-COVID-19 era was lower, at approximately 0.20, and it would have gone higher to approximately 0.40 in the post-COVID-19 era. Similar views were echoed by Expert 28, who said that, during the pre-COVID-19 era, from 2012 to 2019, the correlation between bitcoin and oil was relatively low, suggesting that they were not strongly linked. However, in the post-COVID-19 era, from 2020 to the present, the correlation increased somewhat, likely due to the economic uncertainty brought on by the pandemic. It is important to note that the correlation may change depending on market conditions and investor preferences.
5.3.4. Volatility Dynamics
Correlation of Gold and the Volatility Index (VIX), Pre- and Post-COVID
Eighteen interviewees out of thirty agreed on the positive correlation between gold and the VIX. During COVID-19, between February to June 2020, the VIX was very high. Similarly, the price movement of gold was also high because the gold price followed an upward trend during periods of uncertainty for equity. When the VIX is relatively low, the fluctuation of the gold price tends to be relatively lower or stable. The fluctuation of the gold price also depends on many other factors like inflation, the interest rate level and the USD. During pre-COVID-19, gold was considered a safe haven, and prices were assumed to spike during high volatility. During and after the pandemic, many central banks reassessed their economic prospects and increased their allocation towards gold as a safe haven asset, including gold as a reserve holding. This reiterates the reported correlation between gold and volatility. However, the VIX was much higher post-COVID-19 due to various events and geopolitical crises. Expert 7 clarified that during periods of significant market volatility, there could be strong correlations between gold and the VIX. Gold typically appreciates after a major market downturn, such as the 2008 GFC, because it is a safe asset. Because it offers a safety net against risk, investors frequently seek refuge in non-yield-bearing gold during market downturns. Although the relationship between gold and the VIX may not always be stable in times of severe uncertainty, historically, the two have been in sync. When price volatility increases, gold often performs better than US stocks. The gold:S&P 500 ratio tends to rise in tandem with each market shock. Conversely, a low volatility regime is typically linked to gold’s poor performance (relative to stocks). During the COVID-19 crisis, there was a significant co-movement between the two-time series. In Q1 2020, gold prices increased by 3.6% while US stocks fell by 20% (the S&P 500 fell 35% from peak to trough during that time).
Interestingly, the relationship does not seem to have changed between VIX and gold, post-COVID-19 compared with the COVID-19 era. As identified by Expert 28, gold has historically been seen as a safe haven asset, with its price tending to rise during economic volatility and uncertainty. During the pre-COVID-19 era, from 2012 to 2019, the gold price tended to rise during periods of high market volatility, suggesting that it was seen as a safe haven asset during such times. However, in the post-COVID-19 era, from 2020 to the present, gold’s price movements have been more complex, with both increases and decreases in price occurring during periods of high volatility. It is important to note that the relationship between the gold price and volatility may change depending on market conditions and individual investor preferences.
Ten interviewees out of thirty expressed a different opinion to the majority. Most of these experts reported a negative correlation, and a few found no correlation in the long run. According to the experts, all assets have a separate volatility. In fact, other risk assets showed more volatility compared with gold when the VIX was high. The gold price was inversely correlated with the VIX. If volatility was high, then liquidity flowed out from risky assets and moved to safer haven assets like gold. However, it was vital to watch the movement of the USD against its peers because gold exhibited the strongest positive correlation with the USD. If risk-off sentiments triggered asset flows into USD, then gold would most likely see a fall and vice versa. According to Expert 16, the gold price showed some volatility during higher VIX periods. For example, during the COVID-19 period, when the VIX was highest from February to June 2020, the gold price went down to 1470 and up to 2000 in August 2022. Pre-COVID-19, when the VIX was high in 2017, the gold price did not show much volatility. Bitcoin is being traded as a risky asset and has a high positive correlation with other risky assets. Risky assets tend to have a high negative correlation with the VIX, and that correlation tends to be higher under a higher volatility regime. However, as bitcoin emerges as a substitute for gold, we would expect to see a positive correlation with volatility rather than a negative correlation.
Correlation of Bitcoin and the Volatility Index (VIX), Pre- and Post-COVID
Fifteen experts out of thirty interviewees agreed that the bitcoin price went down when the VIX was higher, which meant that the assets showed a negative correlation. Bitcoin does not have an intrinsic value, and when the equity uncertain level or VIX is higher, investors tend to sell off risky assets, including bitcoin. There was no change in this relationship for pre- or post-COVID-19. Post-COVID-19, bitcoin, a risky asset, has been highly correlated with riskier assets. Also, as a substitute for gold, investors would expect to see a positive correlation with volatility than a negative correlation. Also, post-COVID-19, the volatility is higher. Therefore, the change in prices across different asset classes is stronger. It should be noted that this relationship is not only due to COVID-19 but also to events like current geopolitical crises, which increase volatility. The event type determines the price change. As stated by Expert 23, bitcoin reached a new high during 2021 and 2022, while the VIX reached a new low during those years. In 2018, when the VIX started to rise, bitcoin fell. The VIX generally performs well when the markets start to fall, and when markets fall, bitcoin also falls because bitcoin is an expensive investment. During a market fall, people have money constraints, and thus do not invest in bitcoin, which drives prices down. Therefore, bitcoin falls when the VIX rises and vice versa.
Three experts found no or low correlation between these assets. Bitcoin has a volatility of its own, which is exacerbated by overall equity market volatility. However, it did not follow a pattern similar to that of the VIX over the coverage period. A number of factors determine bitcoin volatility, such as demand and supply, the financial market, market sentiment, macroeconomic conditions, and the bitcoin environment. The speculation about price changes has played a major role in bitcoin’s value at any given moment, causing a rise in commodity market value.
Correlation of Oil and the Volatility Index (VIX), Pre- and Post-COVID-19
Fifteen experts out of thirty interviewees concluded there was a negative correlation between oil and the VIX. Many factors impact the oil price, for example, oil supply and demand, and political stability or instability (because oil producers are highly concentrated in a few countries in the world). When the volatility level is higher, the economic outlook is expected to be uncertain. The volatility in the post-COVID-19 era is even higher than in the pre-COVID-19 period due to the unpredictable demand patterns of the oil. Lockdowns and COVID-19 spikes across the bigger economies had a direct bearing on demand. Geopolitical concerns and war have added to the volatility in the demand and price. Experts have also indicated a negative oil price under high VIX during the COVID-19 period due to higher supply, lack of demand and storage capabilities. Post-COVID-19, with the emergence of close substitutes such as nuclear power, solar power, ethanol, and wind power, demand for oil in the commodity market has dropped. This was highlighted by Expert 27 who stated that oil prices were notoriously volatile, and there was a well-established relationship between oil prices and market volatility. Oil prices tend to be more volatile during high volatility and vice versa. During the pre-COVID-19 era, oil prices were positively correlated with market volatility. This was largely due to the significant supply disruptions and geopolitical tensions that drove oil prices higher. However, the COVID-19 pandemic caused a sharp drop in oil prices as demand for oil plummeted due to the economic slowdown. Since then, oil prices have rebounded somewhat, but the future relationship between oil prices and volatility remains unclear. There are concerns that the ongoing pandemic and the increasing shift towards renewable energy sources could further dampen demand for oil and make it a less reliable hedge against market volatility.
Five experts reported positive correlations. One important fact, suggested by Expert 14, was an inverse correlation in the VIX and oil price in general but with idiosyncratic factors (like the present Ukraine–Russia conflict) temporarily resulting in a positive correlation between the two. As stated by Expert 7, the relationship between the two is multifaceted. Regardless of the price connection, one cannot ignore the positive relationship between oil and stock market volatility. The OVX is the equivalent of the VIX for oil markets, and the two have tended to move in lockstep. The relationship between oil and stock price volatility was relatively stable during the 2008 GFC period, possibly because it was restricted to the financial markets. Prior to 2020, the most extreme levels for this measure were during the OPEC price war that started in November 2014. Looking at market volatility during that time, we know this was more of an oil crisis. In and post-2020, it seemed that oil might be responsible for the volatility that investors saw throughout asset markets after the initial COVID-19 period. As long as oil volatility remains high, there will be a flow to the many asset classes tied to oil prices. Many high-yield bonds are energy-related, issued by US companies that could struggle at these low-price levels. Stock portfolios following a classic value sector approach will usually be tilted toward energy stocks. In many cases, a multi-asset portfolio with asset classes or even direct commodity investments must calibrate volatility exposures in an extremely difficult environment.
Three experts found no correlation between oil and the VIX. Oil is an inelastic essential whose price is mostly supply-side driven. As a tool for hedging purposes, the returns skew to the left-over time. Given the substantial influence of OPEC on oil prices, it is not an asset whose price is determined by the market.
In summary, Figure 3 below visualizes the relative frequency of key terms—oil, inflation, gold, COVID, and bitcoin—across ten document segments from an expert interview schedule analysis. The segments are divisions within the text used to track topic frequency variations over sections of the documents. The trends show varying focus on these topics over the segments. For instance, oil (blue line) sees a peak in the later segments (around segments 8–9), while inflation (green) demonstrates more activity early on and again in the middle. Gold (light green) shows peaks at segments 4 and 8, while COVID-19 (pink) has consistent moderate relevance across segments. Bitcoin (purple) fluctuates, with notable spikes in segments 5 and 9. These variations indicate shifting topical emphasis within the analyzed interviews.
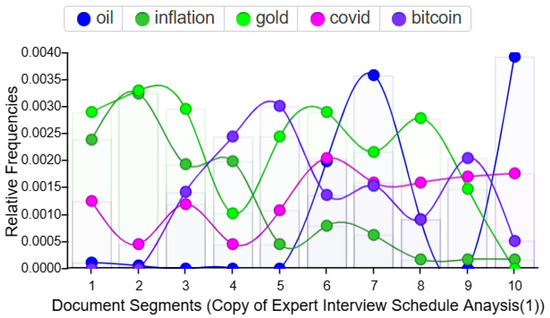
Figure 3.
Relative frequencies of key terms.
6. Discussion
Using the VIX, the current study aimed to identify the intermarket relationships among the gold, bitcoin, and oil markets under different scenarios (e.g., before, during, and after recent economic shocks such as COVID-19 and the war between Ukraine and Russia). Gold, oil, and bitcoin are major portfolio assets but their roles as hedgers and diversifiers have changed in recent times because of global events. Therefore, the research contributes to a clearer understanding of the characteristics of different asset classes in different market conditions or entropy levels (Lahmiri & Bekiros, 2020). Importantly, it compares and contrasts the findings of empirical studies with expert opinion. The behavioral aspects of investment and portfolio management may have a significant role in defining the performance of different asset classes, as identified by behavioral finance theory (Peter & Tversky, 1993) and deciphering the relevant information (Information theory, Shannon, 1948) for the informed decision-making process.
Previous quantitative studies and the experts in the qualitative study both generally concurred that gold was a portfolio diversifier and safe haven asset of the class commodities before and after the COVID-19 pandemic (e.g., Ciner et al., 2013; Jiang et al., 2022; Salisu et al., 2020; Wen et al., 2022). Gold was strongly favored in times of high uncertainty (Das et al., 2020) and was an effective hedge against volatility in bitcoin (Bouoiyour et al., 2019; Klein et al., 2018) and in oil prices during and after the pandemic. A few experts stated that gold was not as effective a hedge as the USD or Federal bonds in times of high inflation because it did not pay interest. Both types of study generally agreed on the positive correlation between gold and oil before the pandemic but found a reversal in this relationship during the pandemic. For example, Huang and Wu (2021) and Benlagha and El Omari (2022) found an inverse relationship with negative shocks in the oil market leading to positive effects on the gold price during the COVID-19 pandemic, where the gold price reached a high of USD 2075 per ounce while oil prices were low and even negative (Chiaramonti & Maniatis, 2020). However, Tanin et al. (2022) studied the oil–gold nexus pre- and post-COVID-19 in five leading stock markets and found that oil prices could not predict gold prices.
As an example of cryptocurrency assets, the role of bitcoin showed some strong variations when comparing its pre- and post-COVID-19 status. Most experts in the qualitative study and recent empirical studies rejected bitcoin as a better substitute for gold as a diversifier. It was viewed as a risky asset, which meant that it tended to have a negative correlation with the VIX and, hence, a negative or no correlation with the gold price. In a bull market, bitcoin tended to do well, as identified by López-Cabarcos et al. (2021). Their study reported that investors were aware of bitcoin volatility, which became more speculative in stable stock markets. Expert opinion was somewhat divided on this asset. A substantial minority saw bitcoin as a niche asset less attractive to mainstream investors and traders because of its high uncertainty and lack of intrinsic value. The significant drop in bitcoin value post-COVID-19 showed its poor hedging and diversification properties. Generally, most experts reported little or no correlation between bitcoin and oil. However, the relationship between bitcoin and oil changed between pre- and post-COVID-19 times, and a higher correlation was found post-COVID-19 (Jareno et al., 2021). Yin et al. (2021) examined the oil market–crypto nexus and reported that oil price undulations were precursors of uncertainties in the crypto market.
In summary, both the empirical studies and experts in the qualitative study supported Markowitz’s portfolio theory of optimal selection and behavioral theories. The change in portfolio share from bitcoin to gold during times of high risk reflected the expected risk–return relationship shown by portfolio theory as well as herd behavior among investors who made heuristic rather than fact-based or rationale-based decisions, according to the volatility of the stock market in the pre- and post-COVID-19 era.
7. Conclusions, Limitations, Implications, and Recommendations
This study used a qualitative study of 30 experts in the finance and economics fields, but this approach has certain strengths and limitations. A qualitative study is an initial step for exploring a concept. It is useful to identify the feasibility and clarify potential amendments in the design; however, it cannot be used for hypothesis testing (Leon et al., 2011).
The strength of our study also led to limitations because the work was based on expert opinion, and hence was not free from expert bias. Moreover, the generalizability of convenience sampling is limited because it tends to produce a non-representative sample, hence leading to selection bias and reduced diversity. This limits the generalizability of findings to a larger population and can threaten external validity. Researchers can diversify participant recruitment strategies, increase sample size, use stratified sampling, and include multiple data sources to enhance the generalizability of findings and capture various subgroups within the population for more balanced insights. Future studies can highlight the significance of other asset classes to provide a more comprehensive picture. Although there are many other asset classes like Central Bank Interest Rate, Developed Markets Investment Grade Bonds Indices, and Credit Default Swap (CDS) that may be incorporated in future studies, those asset/classes are beyond the scope of the current paper. Assets like US Treasury bonds, the USD Index, and Developed Market Property Indices may also be explored in the future studies. Future studies can employ quantitative analysis and compare the actual results with the current qualitative study to arrive at more holistic conclusions.
It is also recommended to incorporate longitudinal studies that can determine the stability of the correlations that have been observed between gold, oil, and bitcoin over different time horizons and investigate how macroeconomic shocks, such as geopolitical crises or monetary policy shifts, affect these correlations. Researching market sentiment and behavioral finance can also provide useful insights into how investor speculations, social media influences, and cognitive biases affect the intermarket relationships under both high- and low-volatility regimes. The application of artificial intelligence and machine learning-based models can enhance the accuracy of volatility spillover prediction and dynamic correlations and make it easier to compare conventional econometric models with deep learning models. In addition, analysis of regional and sectoral differences can detect heterogeneity across emerging and developed markets in these intermarket relationships as well as industry-specific effects, especially in energy-intensive industries. Lastly, the effects of regulatory policies, including central bank interventions and cryptocurrency regulations, must be considered to determine their contribution to the safe-haven quality of bitcoin and gold and broader implications for portfolio management and risk management strategies. The methodology could also be strengthened by involving respondents with asset management experience and varied positions within finance. Investment managers, traders, and other finance practitioners often have special vantage views of the world due to their roles. They could offer a more holistic vision of the assets being researched.
The results have widespread implications for portfolio managers who adopt dynamic adaptive investment strategies by maintaining a robust allocation of gold, particularly during periods of geopolitical tension/economic instability. This is because gold has retained its position as a safe-haven asset that can mitigate portfolio risk and preserve value during market downturns. Moreover, given bitcoin’s diminishing role as an inflation hedge due to its volatile risk–return profile, investors should be cautious about its proportion held in their portfolios as this approach can optimize portfolio resilience while potentially improving risk-adjusted returns. In contrast, investors should be cognizant that while gold exhibits relatively lower volatility and ensures stable long-term returns during periods of economic uncertainty, bitcoin, with its high volatility, may serve as a high-risk, high-return component. However, the degree of its inclusion should be balanced with the investor’s risk tolerance and investment horizon to avoid unwanted exposure to market turbulence.
Author Contributions
Conceptualization, S.S.B.; methodology, R.P. and S.S.B.; software, S.S.B.; validation, S.S.B., R.P. and M.I.T.; formal analysis, S.S.B. and R.P.; investigation, S.S.B., R.P., M.I.T. and M.S.M.A.-A.; resources, S.S.B., R.P., M.I.T. and M.S.M.A.-A.; data curation, S.S.B. and R.P.; writing-original draft preparation, S.S.B. and R.P.; writing—review and editing, S.S.B., R.P., M.I.T. and M.S.M.A.-A.; visualization, S.S.B. and R.P.; supervision, M.I.T. and M.S.M.A.-A.; project administration, S.S.B., M.I.T. and M.S.M.A.-A. All authors have read and agreed to the published version of the manuscript.
Funding
This research received no external funding.
Informed Consent Statement
Informed consent was obtained from all subjects involved in the study.
Data Availability Statement
The data presented in this study are available on request from the corresponding author.
Conflicts of Interest
The authors declare no conflict of interest.
Notes
| 1 | There are many oil classifications used globally; however, West Texas Intermediate (WTI) crude and Bent crude are the largest global indicators. Brent is drilled in the North Sea and controlled by the UK and Norway, while WTI is extracted in the US. |
| 2 | The CBOE VIX for the CBOE S&P 100 Index (OEX) option pricing was accommodated and customized by the Chicago Board Options Exchange on 19 January 1993 (Osterrieder et al., 2019). In 2003, Goldman Sachs worked with the CBOE VIX to modify it. The CBOE S&P 500 Index (SPX) replaced the underlying CBOE S&P 100 Index (OEX). |
References
- Aggarwal, S., Santosh, M., & Bedi, P. (2018). Bitcoin and portfolio diversification: Evidence from India. In A. Kar, S. Sinha, & M. Gupta (Eds.), Digital India. Advances in theory and practice of emerging markets (pp. 99–115). Springer. [Google Scholar] [CrossRef]
- Al-Khazali, O., Bouri, E., & Roubaud, D. (2018). The impact of positive and negative macroeconomic news surprises: Gold versus Bitcoin. Economic Bulletin, 38(1), 373–382. [Google Scholar]
- Al-Yahyaee, K. H., Mensi, W., & Yoon, S. M. (2018). Efficiency, multifractality, and the long-memory property of the Bitcoin market: A comparative analysis with stock, currency, and gold markets. Finance Research Letters, 27, 228–234. [Google Scholar] [CrossRef]
- Artigas, J. C. (2010). Rediscovering gold as an asset class. Journal of Indexes, 13(6), 26–33. Available online: https://www.etf.com/docs/magazine/2/2010_176.pdf?iu=1#page=27 (accessed on 22 October 2022).
- Barber, B., & Odean, T. (1999). Do investors trade too much. American Economic Review, 89(5), 262. Available online: https://www.safalniveshak.com/wp-content/uploads/2012/07/Why-Do-Investors-Trade-Too-Much.pdf (accessed on 12 March 2023).
- Barbu, T. C., Boitan, I. A., & Cepoi, C. O. (2022). Are cryptocurrencies safe havens during the COVID-19 pandemic? A threshold regression perspective with pandemic-related benchmarks. Economics and Business Review, 8(2), 29–49. [Google Scholar] [CrossRef]
- Baur, D. G., & Lucey, B. M. (2010). Is gold a hedge or a safe haven? An analysis of stocks, bonds and gold. Financial Review, 45, 217–229. [Google Scholar] [CrossRef]
- Benlagha, N., & El Omari, S. (2022). Connectedness of stock markets with gold and oil: New evidence from COVID-19 pandemic. Finance Research Letters, 46(B), 102373. [Google Scholar] [CrossRef]
- Bouoiyour, J., Selmi, R., & Wohar, M. (2019). Bitcoin: Competitor or complement to gold? Economics Bulletin, 39(1), 186–191. Available online: https://hal.science/hal-01994187v1/document (accessed on 11 November 2023).
- Braun, V., & Clarke, V. (2006). Using thematic analysis in psychology. Qualitative Research in Psychology, 3(2), 77–101. [Google Scholar] [CrossRef]
- Browne, R. H. (1995). On the use of a pilot sample for sample size determination. Statistics in Medicine, 14(17), 1933–1940. [Google Scholar] [CrossRef]
- Caporale, G. M., Gil-Alana, L., & Plastun, A. (2018). Persistence in the cryptocurrency market. Research in International Business and Finance, 46, 141–48. [Google Scholar] [CrossRef]
- Carr, P. (2017). Why is VIX a fear gauge? Risk and Decision Analysis, 6(2), 179–185. [Google Scholar] [CrossRef]
- Chandra, A., & Thenmozhi, M. (2017). Behavioural asset pricing: Review and synthesis. Journal of Interdisciplinary Economics, 29(1), 1–31. [Google Scholar] [CrossRef]
- Chemkha, R., BenSaïda, A., Ghorbel, A., & Tayachi, T. (2021). Hedge and safe haven properties during COVID-19: Evidence from bitcoin and gold. The Quarterly Review of Economics and Finance, 82, 71–85. [Google Scholar] [CrossRef] [PubMed]
- Chen, J. (2004). Generalized entropy theory of information and market patterns. Corporate Finance Review, 9(3), 21–32. Available online: https://web.unbc.ca/~chenj/papers/GETI.pdf (accessed on 15 April 2022).
- Chiaramonti, D., & Maniatis, K. (2020). Security of supply, strategic storage and COVID-19: Which lessons learnt for renewable and recycled carbon fuels, and their future role in decarbonizing transport. Applied Energy, 271, 115216. [Google Scholar] [CrossRef]
- Chohan, U. W. (2022, February 5). A history of bitcoin. Available online: https://ssrn.com/abstract=3047875 (accessed on 29 December 2022).
- Ciner, C., Gurdgiev, C., & Lucey, B. M. (2013). Hedges and safe havens: An examination of stocks, bonds, gold, oil, and exchange rates. International Review of Financial Analysis, 29, 202–211. [Google Scholar] [CrossRef]
- Das, D., Le Roux, C. L., Jana, R. K., & Dutta, A. (2020). Does bitcoin hedge crude oil implied volatility and structural shocks? A comparison with gold, commodity and the US dollar. Finance Research Letters, 36, 101335. [Google Scholar] [CrossRef]
- Dorfleitner, G., & Lung, C. (2018). Cryptocurrencies from the perspective of euro investors: A re-examination of diversification benefits and a new day-of-the-week effect. Journal of Asset Management, 19, 472–494. [Google Scholar] [CrossRef]
- Dyhrberg, A. H. (2016). Bitcoin, gold and the dollar—A GARCH volatility analysis. Finance Research Letters, 16, 85–92. [Google Scholar] [CrossRef]
- Fama, E. (1965). The Behavior of Stock Market Prices. Journal of Business, 38, 34–105. [Google Scholar] [CrossRef]
- Fernandes, M., Medeiros, M. C., & Scharth, M. (2014). Modeling and predicting the CBOE market volatility index. Journal of Banking & Finance, 40, 1–10. [Google Scholar] [CrossRef]
- Gajardo, G., Kristjanpoller, W. D., & Minutolo, M. (2018). Does bitcoin exhibit the same asymmetric multifractal cross-correlations with crude oil, gold and DJIA as the Euro, Great British Pound and Yen? Chaos, Solitons & Fractals, 109, 195–205. [Google Scholar] [CrossRef]
- Gharib, C., Mefteh-Wali, S., & Jabeur, S. B. (2021). The bubble contagion effect of COVID-19 outbreak: Evidence from crude oil and gold markets. Finance Research Letters, 38, 101703. [Google Scholar] [CrossRef] [PubMed]
- Glaser, F., Zimmermann, K., Haferkorn, M., Weber, M. C., & Siering, M. (2014, June 9–11). Bitcoin-asset or currency? Revealing users’ hidden intentions. Twenty Second European Conference on Information Systems, Tel Aviv, Israel. [Google Scholar]
- Han, H., Linton, O., Oka, T., & Whang, Y. J. (2016). The cross-quantilogram: Measuring quantile dependence and testing directional predictability between time series. Journal of Econometrics, 193(1), 251–270. [Google Scholar] [CrossRef]
- Hertzog, M. A. (2008). Considerations in determining sample size for pilot studies. Research in Nursing & Health, 31(2), 180–191. [Google Scholar] [CrossRef]
- Horstmeyer, X. J., & Kowalski, M. (2022). Digital gold or fool’s gold: Is crypto really a hedge against equity risk? Available online: https://blogs.cfainstitute.org/investor/2022/07/12/digital-gold-or-fools-gold-is-crypto-really-a-hedge-against-equity-risk/ (accessed on 28 December 2022).
- Huang, W., & Wu, M. (2021). Are spillover effects between oil and gold prices asymmetric? Evidence from the COVID-19 pandemic. Energy Research Letters, 2(4), 28127. [Google Scholar] [CrossRef]
- Jareno, F., Gonzalez, M. D. L. O., Lopez, R., & Ramos, A. R. (2021). Cryptocurrencies and oil price shocks: A NARDL analysis in the COVID-19 pandemic. Resources Policy, 74, 102281. [Google Scholar] [CrossRef]
- Ji, Q., Zhang, D., & Zhao, Y. (2020). Searching for safe-haven assets during the COVID-19 pandemic. International Review of Financial Analysis, 71, 101526. [Google Scholar] [CrossRef]
- Jiang, S., Li, Y., Lu, Q., Wang, S., & Wei, Y. (2022). Volatility communicator or receiver? Investigating volatility spill over mechanisms among bitcoin and other financial markets. Research in International Business and Finance, 59, 101543. [Google Scholar] [CrossRef]
- Jones, M. V., Coviello, N., & Tang, Y. K. (2011). International entrepreneurship research (1989–2009): A domain ontology and thematic analysis. Journal of Business Venturing, 26(6), 632–659. [Google Scholar] [CrossRef]
- Julious, S. A. (2005). Sample size of 12 per group rule of thumb for a pilot study. Pharmaceutical Statistics, 4(4), 287–291. [Google Scholar] [CrossRef]
- Kahneman, D., & Tversky, A. (1979). Prospect theory: An analysis of decision under risk. Econometrica, 47, 263–291. [Google Scholar] [CrossRef]
- Kang, S. H., McIver, R. P., & Hernandez, J. A. (2019). Co-movements between bitcoin and gold: A wavelet coherence analysis. Physica A: Statistical Mechanics and Its Applications, 536, 120888. [Google Scholar] [CrossRef]
- Karasiński, J. (2023). The adaptive market hypothesis and the return predictability in the cryptocurrency markets. Economics and Business Review, 9(1), 94–118. [Google Scholar] [CrossRef]
- Kim, M. H., & Dilts, D. A. (2011). The relationship of the value of the dollar, and the prices of gold and oil: A tale of asset risk. Economics Bulletin, 31(2), 1151–1162. [Google Scholar]
- Kim, Y. (2011). The pilot study in qualitative inquiry: Identifying issues and learning lessons for culturally competent research. Qualitative Social Work, 10, 190–206. [Google Scholar] [CrossRef]
- Klein, T., Thu, H. P., & Walther, T. (2018). Bitcoin is not the new gold—A comparison of volatility, correlation, and portfolio performance. International Review of Financial Analysis, 59, 105–116. [Google Scholar] [CrossRef]
- Kober, T., Schiffer, H. W., Densing, M., & Panos, E. (2020). Global energy perspectives to 2060—WEC’s world energy scenarios 2019. Energy Strategy Reviews, 31, 100523. [Google Scholar] [CrossRef]
- Kristoufek, L. (2018). On bitcoin markets (in) efficiency and its evolution. Physica A: Statistical Mechanics and Its Applications, 503, 257–262. [Google Scholar] [CrossRef]
- Lahmiri, S., & Bekiros, S. (2020). Renyi entropy and mutual information measurement of market expectations and investor fear during the COVID-19 pandemic. Chaos, Solitons and Fractals, 139, 110084. [Google Scholar] [CrossRef]
- Latoszek, M., & Ślepaczuk, R. (2020). Does the inclusion of exposure to volatility into diversified portfolio improve the investment results? Portfolio construction from the perspective of a Polish investor. Economics and Business Review, 6(1), 46–81. [Google Scholar] [CrossRef]
- Leković, M. (2019). Behavioral portfolio theory and behavioral asset pricing model as an alternative to standard finance concepts. Economic Horizons, 21(3), 255–279. [Google Scholar] [CrossRef]
- Leon, A. C., Davis, L. L., & Kraemer, H. C. (2011). The role and interpretation of pilot studies in clinical research. Journal of Psychiatric Research, 45(5), 626–629. [Google Scholar] [CrossRef] [PubMed]
- López-Cabarcos, M. Á., Pérez-Pico, A. M., Piñeiro-Chousa, J., & Šević, A. (2021). Bitcoin volatility, stock market and investor sentiment. Are they connected? Finance Research Letters, 38, 101399. [Google Scholar] [CrossRef]
- Maghyereh, A., & Abdoh, H. (2022). COVID-19 and the volatility interlinkage between bitcoin and financial assets. Empirical Economics, 63, 2875–2901. [Google Scholar] [CrossRef] [PubMed]
- Markowitz, H. (1952). The utility of wealth. Journal of Political Economy, 60(2), 151–158. [Google Scholar] [CrossRef]
- Matthew, H., & Farooq, M. (2013). Is gold the best hedge and a safe haven under changing stock market volatility. Review of Financial Economics, 22(2), 47. [Google Scholar] [CrossRef]
- McCown, J. R., & Zimmerman, J. R. (2006, July 24). Is gold a zero-beta asset? Analysis of the investment potential of precious metal. Available online: https://ssrn.com/abstract=920496 (accessed on 28 December 2022).
- Mensi, W., Sensoy, A., Vo, X. V., & Kang, S. H. (2020). Impact of COVID-19 outbreak on asymmetric multifractality of gold and oil prices. Resource Policy, 69, 101829. [Google Scholar] [CrossRef]
- Mlaabdal, S., Chygryn, O., Kwilinski, A., Muzychuk, O., & Akimov, O. (2020, November 4–5). Economic growth and oil industry development: Assessment of the interaction of national economy indicators. Proceedings of the 36th International Business Information Management Association (IBIMA), Granada, Spain. [Google Scholar]
- Nadarajah, S., & Chu, S. (2017). On the inefficiency of bitcoin. Economics Letters, 150, 6–9. [Google Scholar] [CrossRef]
- Neely, C. J. (2022). Financial market reactions to the Russian invasion of Ukraine. Federal Reserve Bank of St. Louis Review, 104(4), 266–296. [Google Scholar] [CrossRef]
- Osterrieder, J., Vetter, L., & Röschli, K. (2019, January 7). The VIX volatility index—A very thorough look at it. Available online: https://ssrn.com/abstract=3311727 (accessed on 28 December 2022).
- Parvini, N., Abdollahi, M., Seifollahi, S., & Ahmadian, D. (2022). Forecasting bitcoin returns with long short-term memory networks and wavelet decomposition: A comparison of several market determinants. Applied Software Computing, 121, 108707. [Google Scholar] [CrossRef]
- Peter, W., & Tversky, A. (1993). An axiomatization of cumulative prospect theory. Journal of Risk and Uncertainty, 7(2), 147–175. [Google Scholar] [CrossRef]
- Reboredo, J. C. (2013). Is gold a hedge or safe haven against oil price movements? Resources Policy, 38(2), 130–137. [Google Scholar] [CrossRef]
- Rényi, A. (1960). On measures of information and entropy. In Proceedings of the 4th Berkeley symposium on mathematics, statistics and probability (pp. 547–561). University of California. [Google Scholar]
- Salisu, A. A., Vo, X. V., & Lawal, A. (2020). Hedging oil price risk with gold during COVID-19 pandemic. Resource Policy, 70, 101897. [Google Scholar] [CrossRef]
- Selmi, R., Mensi, W., Hammoudeh, S., & Bouoiyour, J. (2018). Is bitcoin a hedge, a safe haven or a diversifier for oil price movements? A comparison with gold. Energy Economics, 74, 787–801. [Google Scholar] [CrossRef]
- Shannon, C. E. (1948). A mathematical theory of communication. The Bell System Technical Journal, 27(3), 379–423. [Google Scholar] [CrossRef]
- Shefrin, H. (2000). Recent developments in behavioral finance. The Journal of Wealth Management, 3(1), 25–37. [Google Scholar] [CrossRef]
- Shehzad, K., Bilgili, F., Zaman, U., Kocak, E., & Kuskaya, S. (2021). Is gold favourable than bitcoin during the COVID-19 outbreak? Comparative analysis through wavelet approach. Resources Policy, 73, 102163. [Google Scholar] [CrossRef] [PubMed]
- Simon, H. A. (1997). Models of bounded rationality: Empirically grounded economic reason (Vol. 3). MIT Press. [Google Scholar]
- Souto, H. G., & Moradi, A. (2023). Forecasting realized volatility through financial turbulence and neural networks. Economics and Business Review, 9(2), 133–159. [Google Scholar] [CrossRef]
- Statman, M. (1995). Behavioral finance versus standard finance. In AIMR conference proceedings. CFA Institute. [Google Scholar]
- Sujit, K. S., & Kumar, R. (2011). Study on dynamic relationship among gold price, oil price, exchange rate and stock market returns. International Journal of Applied Business and Economic Research, 9(2), 145–165. [Google Scholar]
- Symitsi, E., & Chalvatzis, K. J. (2019). The economic value of bitcoin: A portfolio analysis of currencies, gold, oil and stocks. Research in International Business and Finance, 48, 97–110. [Google Scholar] [CrossRef]
- Syuhada, K., Suprijanto, D., & Hakim, A. (2022). Comparing gold’s and bitcoin’s safe-haven roles against energy commodities during the COVID-19 outbreak: A vine copula approach. Finance Research Letters, 46(B), 102471. [Google Scholar] [CrossRef]
- Tanin, T. I., Sarker, A., Brooks, R., & Do, H. X. (2022). Does oil impact gold during COVID-19 and three other recent crises? Energy Economics, 108, 105938. [Google Scholar] [CrossRef] [PubMed]
- Teare, M. D., Dimairo, M., Shephard, N., Hayman, A., Whitehead, A., & Walters, S. J. (2014). Sample size requirements to estimate key design parameters from external pilot randomised controlled trials: A simulation study. Trials, 15, 264. [Google Scholar] [CrossRef] [PubMed]
- Thomas, D. R. (2017). Feedback from research participants: Are member checks useful in qualitative research? Qualitative Research in Psychology, 14(1), 23–41. [Google Scholar] [CrossRef]
- Urquhart, A. (2016). The inefficiency of bitcoin. Economic Letters, 148, 80–82. [Google Scholar] [CrossRef]
- Vukovic, D., Maiti, M., Grubisic, Z., Grigorieva, E. M., & Frömmel, M. (2021). COVID-19 pandemic: Is the crypto market a safe haven? The impact of the first wave. Sustainability, 13(15), 8578. [Google Scholar] [CrossRef]
- Wang, J., & Wang, X. (2021). COVID-19 and financial market efficiency: Evidence from an entropy-based analysis. Finance Research Letters, 42, 101888. [Google Scholar] [CrossRef]
- Wang, P., Zhang, H., Yang, C., & Guo, Y. (2021). Time and frequency dynamics of connectedness and hedging performance in global stock markets: Bitcoin versus conventional hedges. Research in International Business and Finance, 58, 101479. [Google Scholar] [CrossRef]
- Wei, W. (2018). The impact of tether grants on bitcoin. Economics Letters, 171, 19–22. [Google Scholar] [CrossRef]
- Wen, F., Tong, X., & Ren, X. (2022). Gold or bitcoin, which is the safe haven during the COVID-19 pandemic? International Review of Financial Analysis, 81, 102121. [Google Scholar] [CrossRef] [PubMed]
- Whaley, R. E. (2009). Understanding the VIX. The Journal of Portfolio Management, 35(3), 98–105. [Google Scholar] [CrossRef]
- Wu, S., Tong, M., Yang, Z., & Derbali, A. (2019). Does gold or bitcoin hedge economic policy uncertainty? Finance Research Letters, 31, 171–178. [Google Scholar] [CrossRef]
- Yermack, D. (2015). Is Bitcoin a real currency? An economic appraisal. In Handbook of digital currency (pp. 31–43). Academic Press. [Google Scholar] [CrossRef]
- Yin, L., Nie, J., & Han, L. (2021). Understanding cryptocurrency volatility: The role of oil market shocks. International Review of Economic Finance, 72, 233–253. [Google Scholar] [CrossRef]
- Zhang, Y., Zhu, P., & Xu, Y. (2021). Has COVID-19 changed the hedge effectiveness of bitcoin? Frontiers in Public Health, 9, 704900. [Google Scholar] [CrossRef] [PubMed]
- Zhou, R., Cai, R., & Tong, G. (2013). Applications of entropy in finance: A review. Entropy, 15(11), 4909–4931. [Google Scholar] [CrossRef]
- Zhou, Y., Xie, C., Wang, G.-J., Zhu, Y., & Uddin, G. S. (2023). Analysing and forecasting co-movement between innovative and traditional financial assets based on complex network and machine learning. Research in International Business and Finance, 64, 101846. [Google Scholar] [CrossRef]
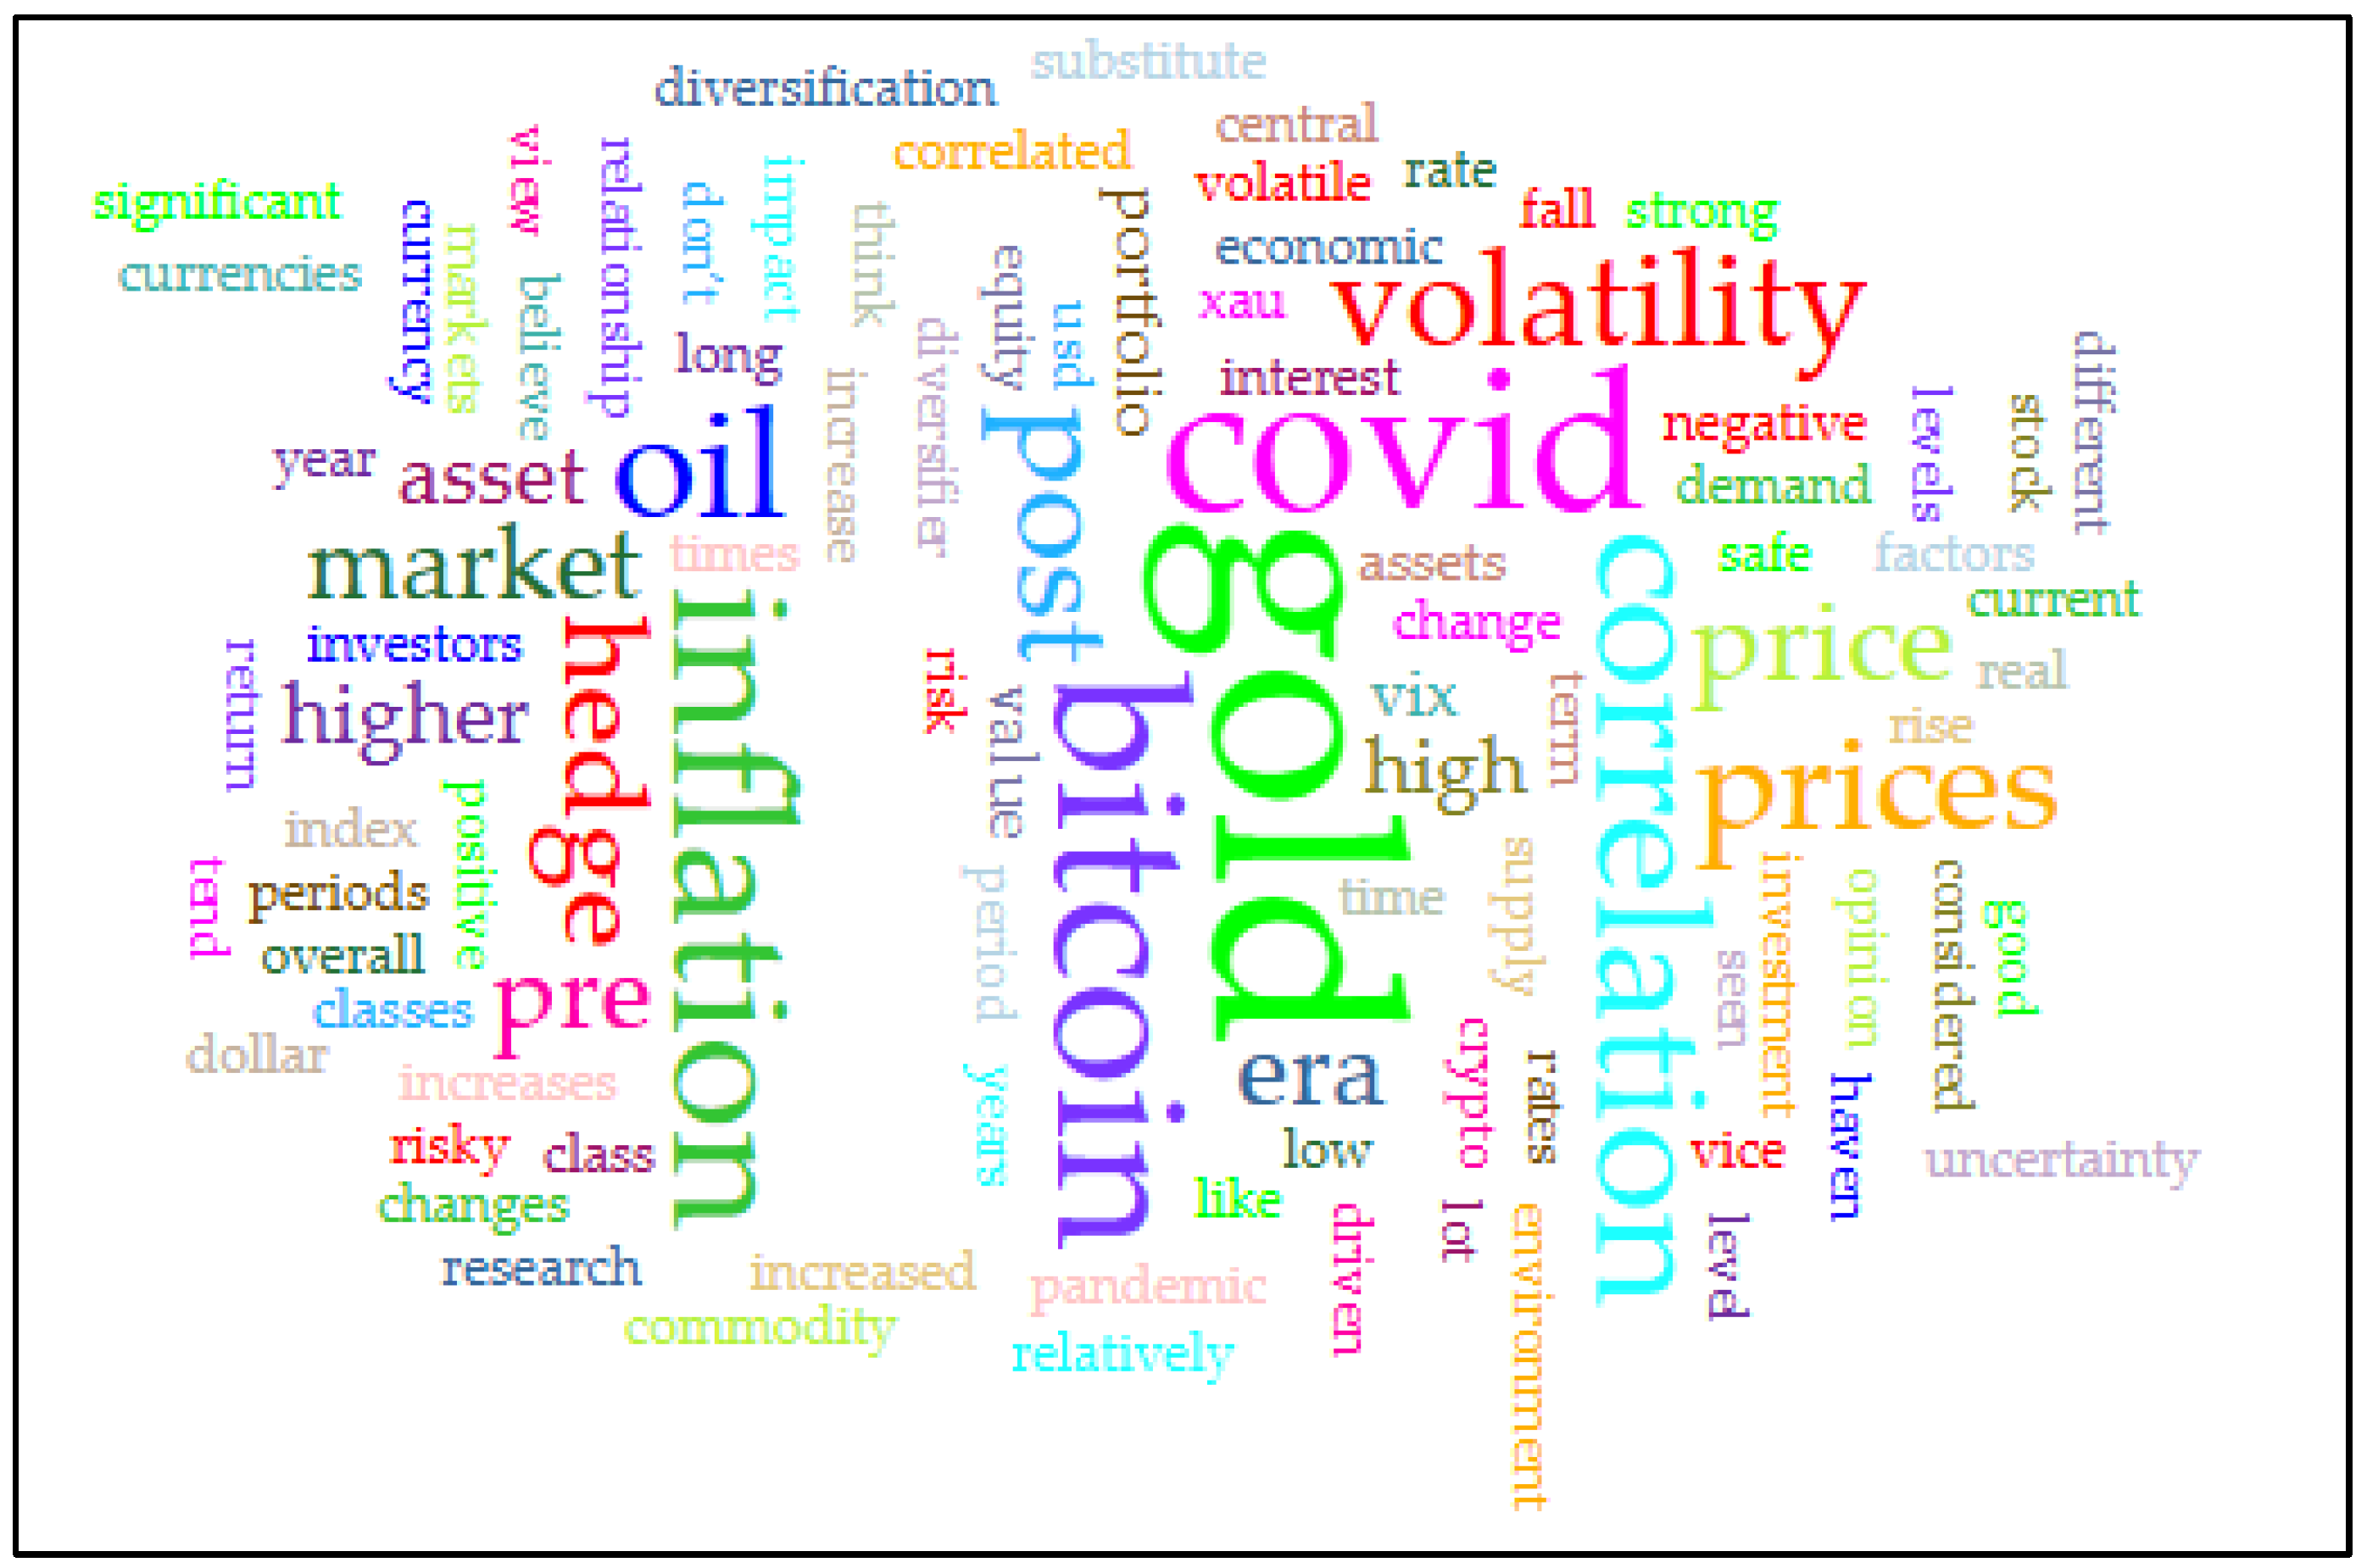
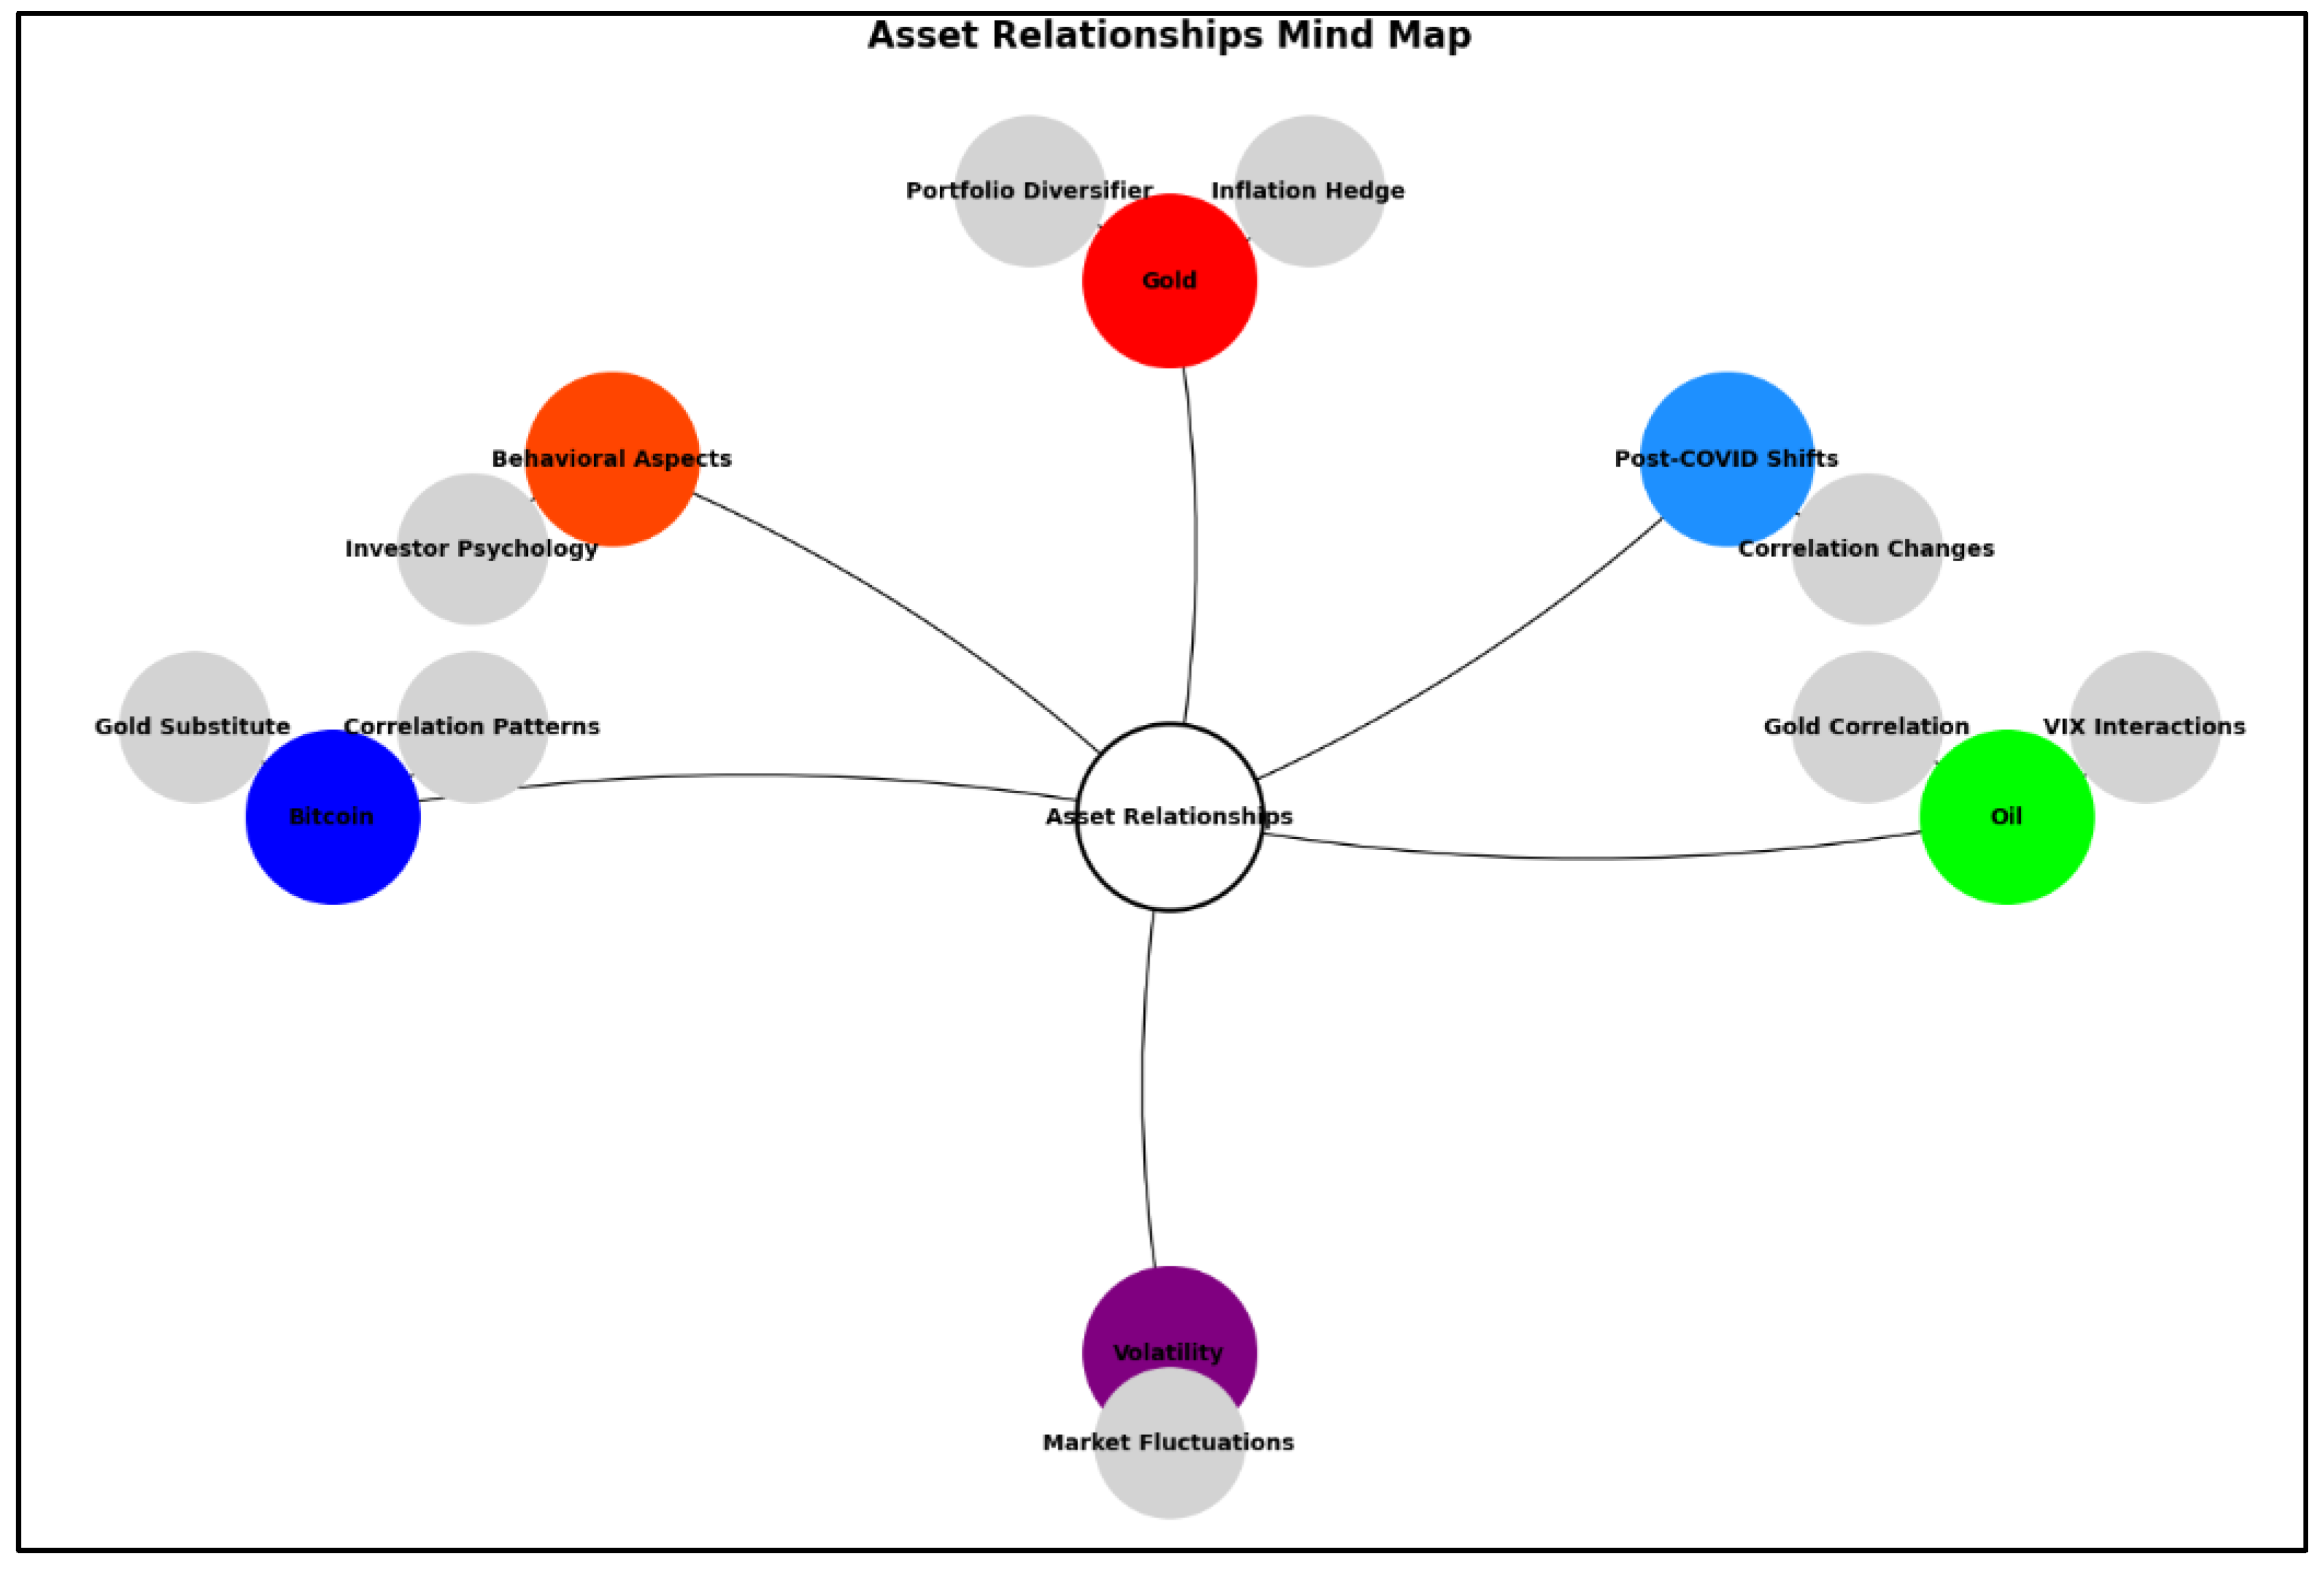
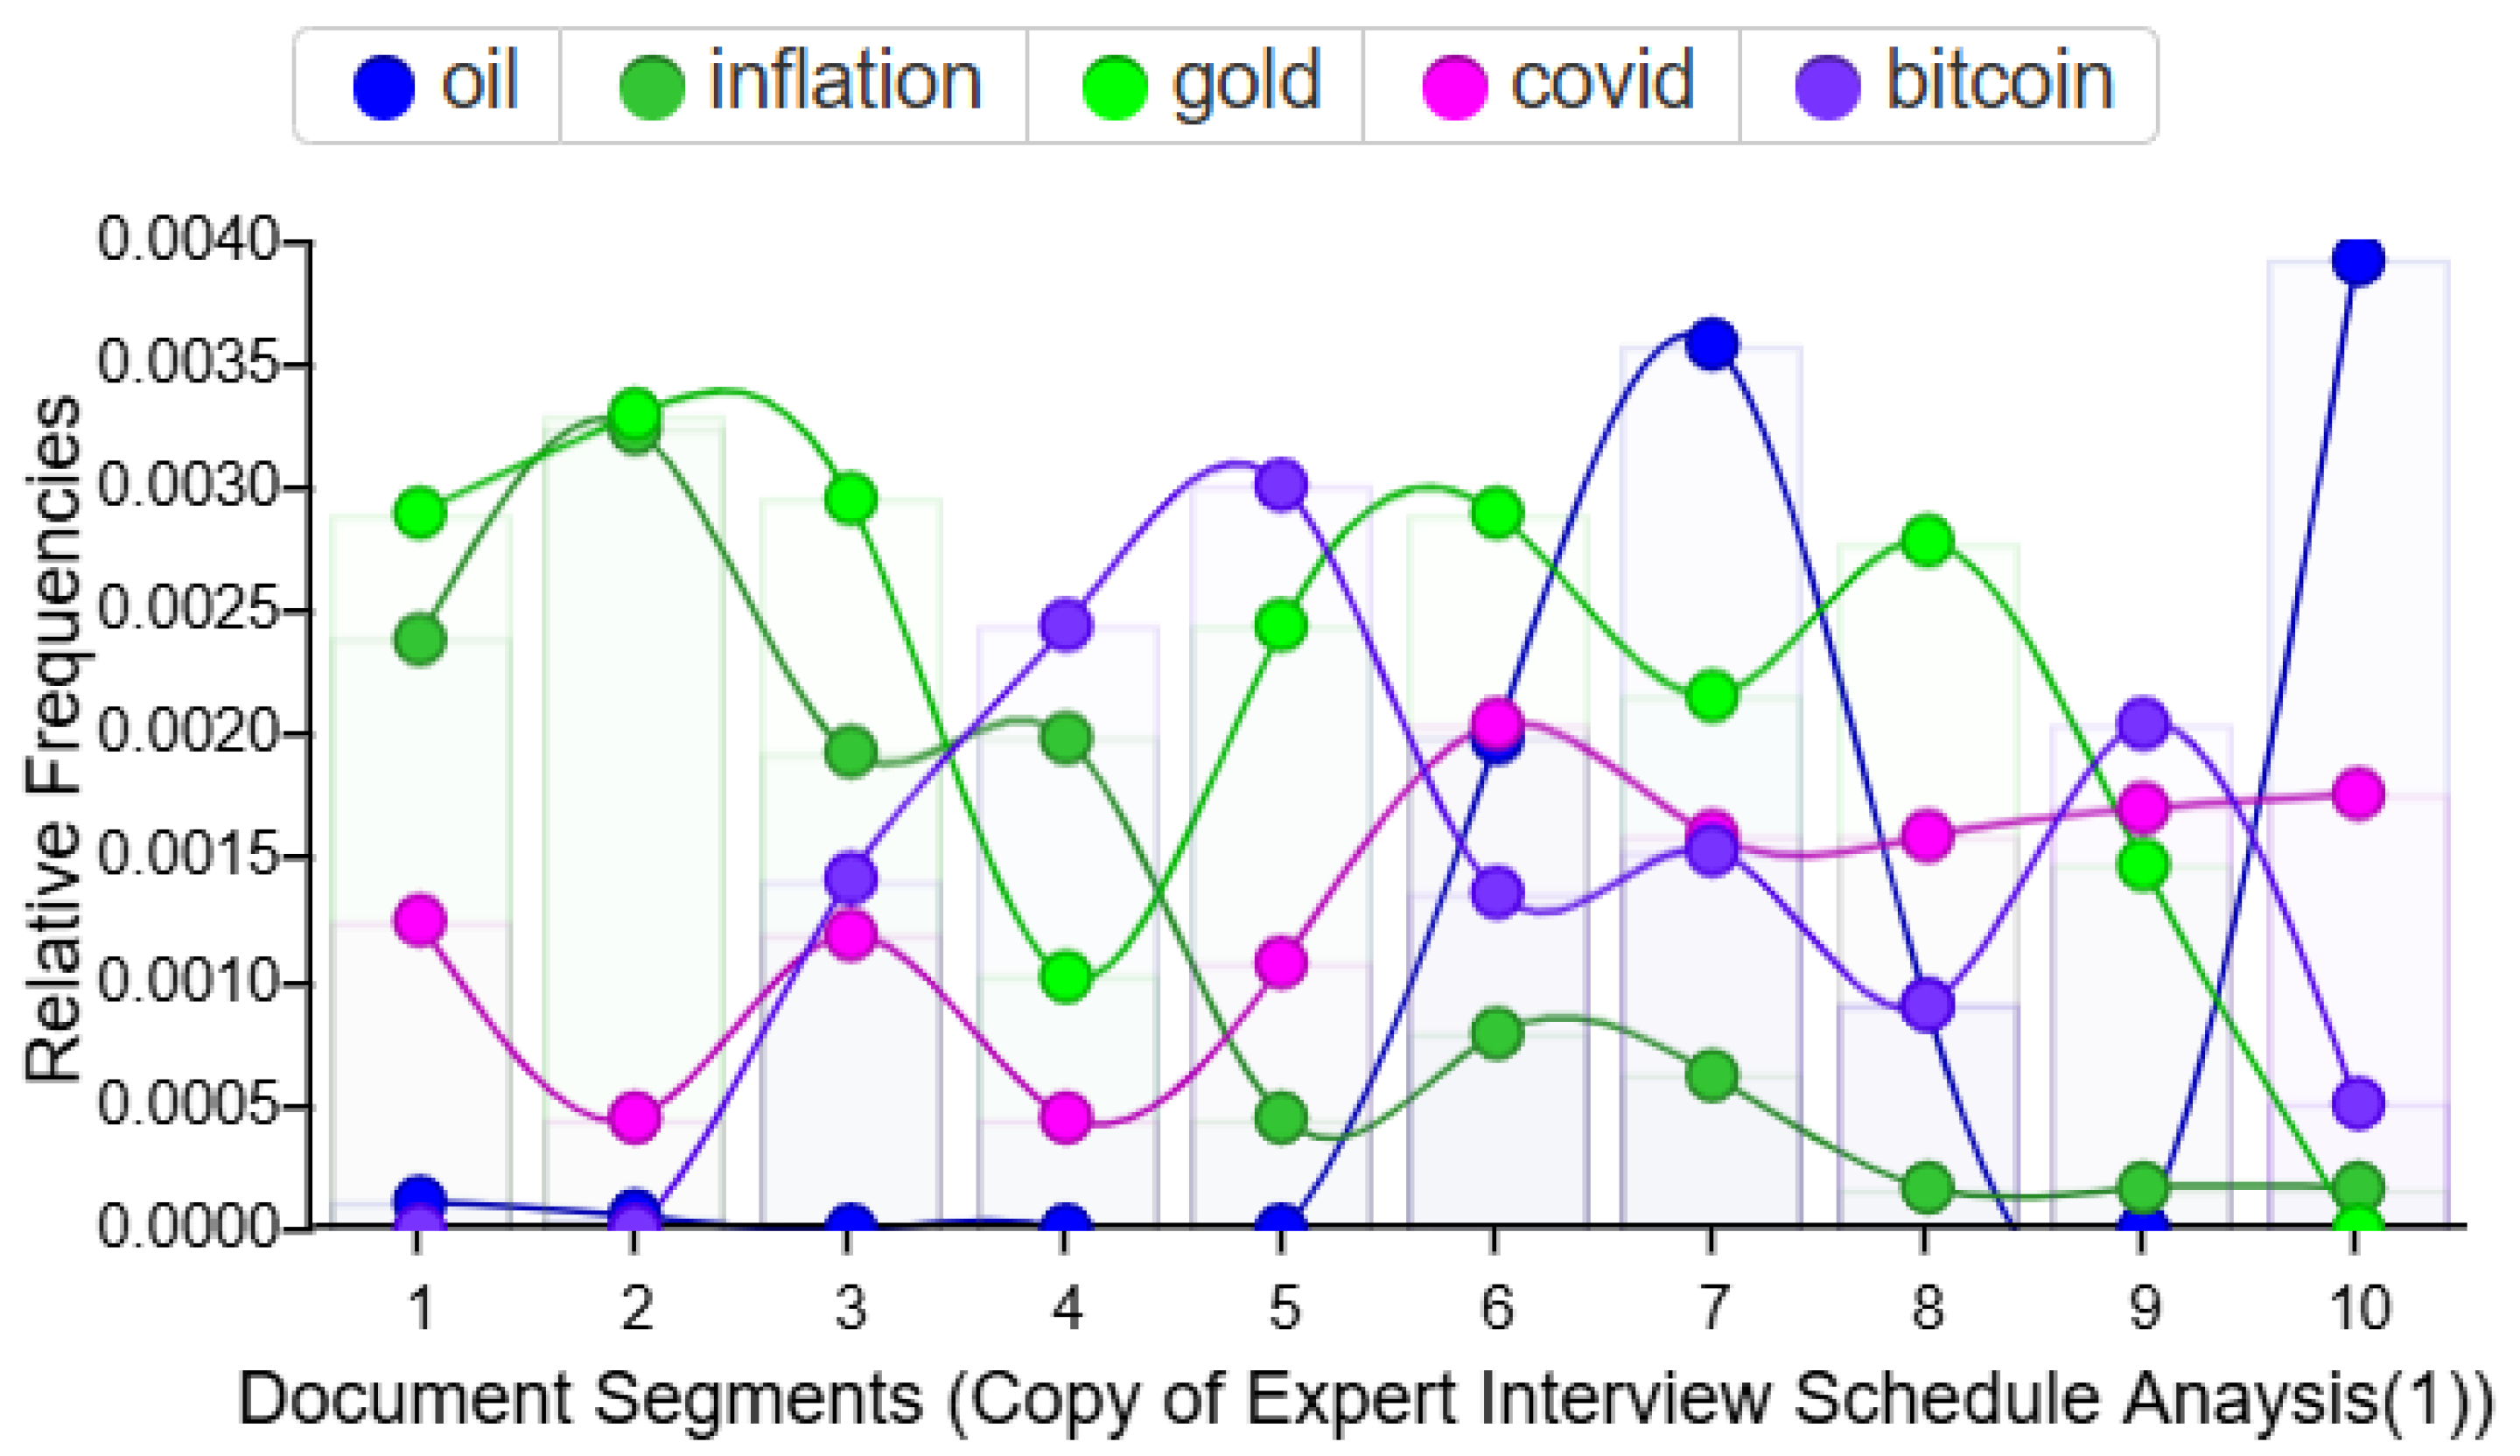
Disclaimer/Publisher’s Note: The statements, opinions and data contained in all publications are solely those of the individual author(s) and contributor(s) and not of MDPI and/or the editor(s). MDPI and/or the editor(s) disclaim responsibility for any injury to people or property resulting from any ideas, methods, instructions or products referred to in the content. |
© 2025 by the authors. Licensee MDPI, Basel, Switzerland. This article is an open access article distributed under the terms and conditions of the Creative Commons Attribution (CC BY) license (https://creativecommons.org/licenses/by/4.0/).