Abstract
This study investigates the relationship between philanthropy and regional economic growth, with a focus on the role of social capital as a mediator between these two factors. Employing an econometric model based on Italian regional panel data collected between 2015 and 2019, this study investigates the impact of nonprofit organisations and volunteering on regional GDP growth. The results confirm the contribution of philanthropy to the growth of social capital. The analysis also highlights the disparities between the northern and southern regions: in the former, which are richer, there is a greater willingness to philanthropy. The study shows empirical evidence in the Italian context, underlining the importance of encouraging volunteering by strengthening public–private partnerships. The study recommends policies that promote philanthropy to support regional economic and social development.
1. Introduction
Philanthropy, also referred to as “passion for the human good,” has contributed to the development of societies. Since ancient civilisations, forms of mutual aid have contributed to a more equitable social fabric (Cunningham, 2016). However, it was during the industrial era that philanthropy assumed systematic and structured roles (Rodgers, 1998). The contributions of philanthropists such as Andrew Carnegie (Nasaw, 2006) and John D. Rockefeller (Chernow, 1998) have emphasised the importance of redistributing wealth to promote the common good, including through donations and investments in education, culture, and innovation (Frumkin, 2003b). In recent years, philanthropy has evolved from purely charitable models to more structured and strategic ones. Today, philanthropy is no longer a simple act of generosity, but a complex industry that interacts with public policies, businesses, and, primarily, nonprofit organisations (Bishop & Green, 2008).
The greater value of philanthropy has increased attention to the effectiveness of interventions and the application of social impact assessment methods. Among them, “venture philanthropy” has become important, combining investment logic with social objectives to maximise the resources’ impact. This approach, like others, uses innovative measurement tools and unconventional financing models such as “social impact investing” (Nicholls et al., 2015).
The increased availability of statistical data also enables the application of advanced quantitative techniques to evaluate the effectiveness of philanthropic interventions, with a focus on measuring social capital and its associated economic growth (S. Katz & Page, 2014).
The Italian reality favours studies on the links between philanthropy and economic expansion due to its solid tradition of solidarity, also induced by widespread Christian morality (Vogt, 2002), often supported by institutionalised financial structures, such as banking foundations, which are fundamental for financing social charitable initiatives (Barbetta, 2004). These institutions, established to balance wealth and social responsibility, have progressively evolved and have become leading actors in territorial development, social cohesion, and economic resilience, with funding for educational, cultural and inclusion programmes (Anheier & Leat, 2006). However, the real verification of the impact of philanthropic activities on regional economic development requires an in-depth quantitative analysis based on econometric methods.
This study, therefore, aims to answer two fundamental questions:
- RQ1: How do philanthropic activities influence regional economic growth?
- RQ2: What mechanisms link social capital generated through philanthropy to economic development?
The answer to these questions is provided by an econometric model applied to regional panel data, which examines the possible relationships between GDP per capita (GDP) and social capital using data specific to each territory. Specifically, the study aims to test three hypotheses to assess the socioeconomic effectiveness of philanthropic initiatives.
H1.
Philanthropy strengthens social capital.
The best empirical literature (Putnam, 2000; Andreoni, 1990) has already documented a positive correlation between prosocial activities, such as volunteering and donations, and the generation of social capital, as manifested through trust and social cohesion networks. These elements are endogenous variables fundamental to the systemic stability of community structures. Empirical evidence suggests that philanthropic initiatives act as catalysts for civic participation and a sense of belonging, contributing to the evolution of a social fabric characterised by greater equity and propensity for interpersonal collaboration. The quantitative measurement of these positive externalities can be quantified using social capital indices, such as the number of voluntary associations per capita and the degree of civic participation, which can be detected through standardised institutional opinion polls. This investigation verifies the validity of these assertions. Defining and measuring philanthropy and social capital present considerable conceptual and methodological challenges. Beyond donations or volunteering, philanthropy encompasses a broad spectrum of activities that combine private resources with public goals (Anheier & Leat, 2006). However, the operationalisation of philanthropy often relies on proxies—such as the number of active NGOs or volunteer engagement—that can only partially capture its scope and depth. Similarly, social capital is notoriously difficult to quantify due to its intangible nature. It is sometimes conflated with other forms of capital, such as cultural capital (Bourdieu, 1986) or human capital (Becker, 1964), although these refer to distinct mechanisms of social advantage and transmission.
A further distinction must be made between actor-oriented definitions of social capital, which emphasise individual access to resources through networks (Bourdieu, 1986; Lin, 2001), and system-oriented views, which focus on social cohesion, trust, and norms at the collective level (Putnam, 2000; Coleman, 1990).
Our study adopts a hybrid approach. Indicators like the number of volunteers or religious organisations capture both individual access to social networks and, more broadly, civic engagement within regional communities.
H2.
Social capital is a catalyst for regional economic growth.
Guiso et al. (2004) had already highlighted positive correlations between social capital and economic efficiency. The latter contributes to reducing transactional costs and increasing aggregate productivity. The continuous and organised activity of well-structured social networks facilitates the efficient allocation of credit, the exchange of information, and the coordination among economic agents. These mechanisms create a favourable environment for productive investment. Starting from these established doctrinal positions, to verify this second hypothesis, the present survey uses econometric models to quantify the impact of social capital on the regional gross domestic product per capita, incorporating in the analytical framework several control variables, including human capital indicators, the concentration of entrepreneurial activities and the territorial infrastructure endowment.
H3.
Philanthropic activities generate sustainable economic and social benefits.
According to Salamon and Anheier (1997a, 1997b), the nonprofit sector enhances economic resilience, making public resources more efficient and fostering sustainable development. Integrating philanthropy and economic strategies can encourage inclusive growth that respects the environment. In this study, the verification of this hypothesis is entrusted to a fixed-effects regression model to evaluate the possible connection between philanthropic and regional spending and per capita income growth.
This research seeks to enrich the academic and policy debate on philanthropy as a driver of economic growth. It does so by providing empirical evidence and theoretical insights into the relationship between charitable activity and socioeconomic well-being. Additionally, through an in-depth analysis of territorial dynamics and interactions between philanthropy and public policies, this study proposes new models of more equitable and efficient development, grounded in a rigorous econometric methodology.
2. Literature Review
This section aims to provide a structured and critical overview of the academic literature addressing the relationship between philanthropy, social capital, and economic growth. The review was structured into three parts: a bibliometric analysis, a discussion of the main theoretical and empirical contributions, and a final summary highlighting research gaps and future directions. Although philanthropy had become increasingly visible in shaping socioeconomic strategies worldwide, the academic discourse remained fragmented, particularly within the fields of economics and econometrics. An exploratory query of the Scopus database revealed that, over the past five decades, only 125 scholarly publications had explicitly addressed the link between philanthropy and economic growth—most of which were rooted in the social sciences and business studies. This imbalance suggested the need for a more rigorous and interdisciplinary approach. The review, therefore, mapped key contributions, identified the predominant geographic and disciplinary clusters, and analysed the methodological frameworks that had been adopted to inform future research in light of pressing global challenges such as pandemics, inequality, and geopolitical instability.
2.1. A First Bibliometric Approach
The subject matter of this study had not been adequately analysed in mainstream literature. In an exploratory survey conducted on the Scopus platform in March 2025, using the search string “economic AND growth AND philanthropy,” only 125 documents were identified as having been published over the previous 50 years (Figure 1).
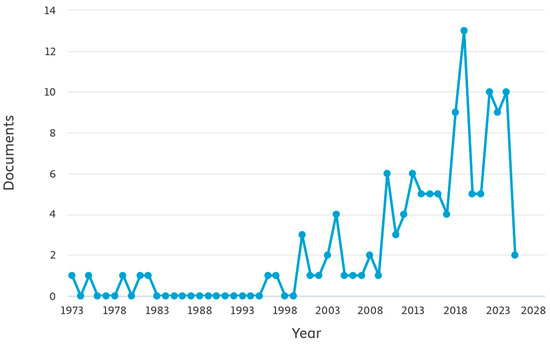
Figure 1.
Documents by year. Source: Scopus.
In the last century, the topic had been substantially neglected. However, interest in the new millennium grew, albeit with fluctuations. Overall, there was clear room for more in-depth study, especially considering the pandemic and war-related challenges of recent years. More detailed research enabled the identification of which disciplinary areas have addressed the relationship between philanthropy and economic growth (Figure 2).
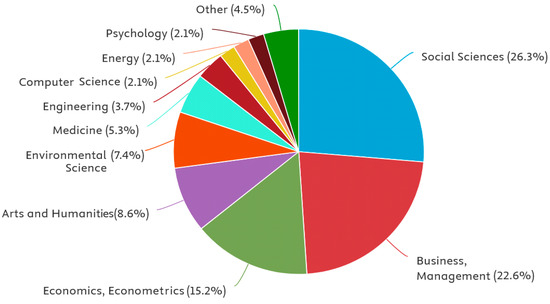
Figure 2.
Documents by subject area. Source: Scopus.
The social sciences, therefore, prevailed, followed by the business economics disciplines. The fields of economics and econometrics remained relatively marginal despite their potential to play a central role in analysing the relationships between philanthropic generosity and economic and social growth. Only 37 documents had been indexed in Scopus under the “Economics, Econometrics and Finance” category, with most of them concentrated in the previous decade, as shown in Figure 3. These documents were subsequently examined more closely due to their greater relevance to the approach adopted in this study.
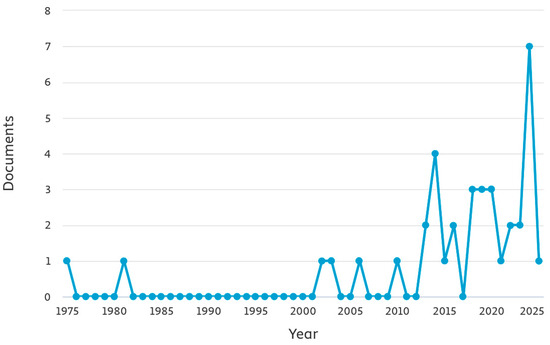
Figure 3.
Documents by year. Source: Scopus.
Mapping the scientific production on the subject was considered particularly interesting (Figure 4).
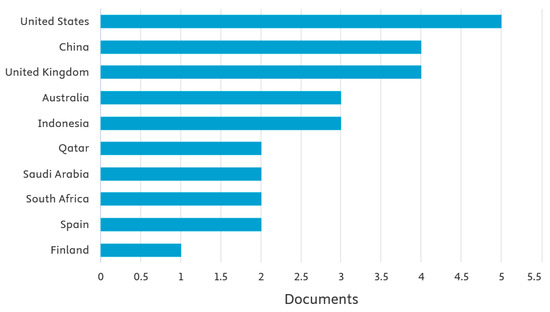
Figure 4.
Documents by country or territory. Source: Scopus.
Anglophone countries dominated the literature. However, smaller contributions from China, Indonesia, and other nations suggested that interest in the economic and social effects of philanthropy was spreading globally. The most cited documents that were likely to have influenced subsequent studies were listed in Table 1 and were identified by the first author’s surname and year of publication.

Table 1.
Most cited documents.
Of the 37 documents that were surveyed, 23 had received at least one citation. The earliest publication, by Acs and Phillips (2002), was dedicated to “Entrepreneurship and Philanthropy in American Capitalism,” clearly dominated the field, and represented a necessary cognitive step for subsequent studies. One of the two authors, Acs, later published a 2013 study in which he investigated the motivations behind philanthropy, including latent ones, and evaluated its economic effects. This second document was also highly cited, although significantly less than the first. All the other, less-studied contributions followed. The bibliographic framework is mapped in Figure 5, where the size of each node indicates the number of citations, and the colours refer to the year of publication.
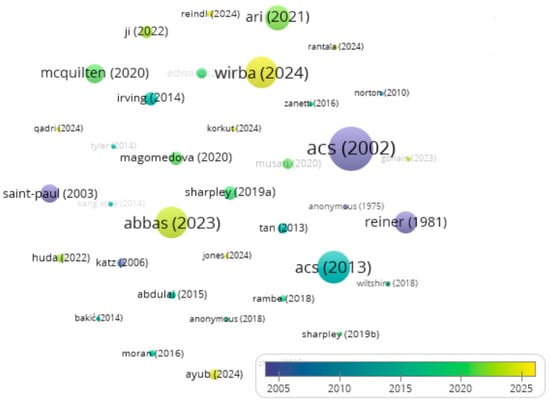
Figure 5.
Map of the most cited documents. Source: VOSviewer processing.
The keywords the authors chose usually reflected the prevalence of the topics they covered. The 28 most frequent among the 85 that were used were presented in Table 2, along with the specification of the “Total Link Strength” (TLS), which was defined as the sum of the “strength” of all the connections of a node. A node might have had few links but still exhibited a high link strength if its ties to other nodes were significant1.
Table 2.
Keywords: Frequency and TLS.
The connections between the keywords were mapped in Figure 6, and only 43 of the 85 were linked to one another.
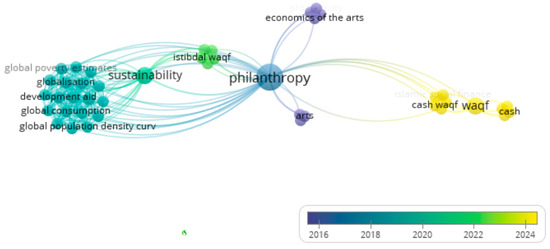
Figure 6.
Connections between keywords. Source: VOSviewer processing.
Finally, the 16 primary sources that were most frequently cited and were relevant to the topic under analysis were listed in Table 3.
Table 3.
The main sources.
No privileged source had hosted studies on the economic impact of philanthropy within the international bibliographic landscape.
The 37 documents were distributed across 37 different sources; however, their impact on the scientific community varied considerably.
The article by Acs and Phillips (2002) received the highest number of citations.
2.2. The Main Themes
The main contributions were ranked according to their focus, allowing for the identification of at least three central themes that had characterised the scholarly literature. This section was intended to provide a critical synthesis rather than a mere enumeration of sources, integrating theoretical and empirical perspectives to clarify how philanthropy had interacted with social capital and regional economic growth.
2.2.1. Philanthropy and Social Capital
In the economic and sociological literature, the concept of social capital has been extensively developed by Bourdieu (1986), Coleman (1990), and Putnam (2000). Bourdieu conceived social capital as the aggregate of actual or potential resources linked to a durable network of institutionalised relationships. Coleman, focusing on its functional aspects, defined it as a variety of entities with two common elements: they all consisted of some aspect of social structure and facilitated specific actions of individuals. Putnam, in contrast, adopted a system-oriented view, emphasising social trust, norms of reciprocity, and civic engagement as facilitators of collective action and regional development.
Quantifying social capital remained complex, given its multidimensional nature and overlap with related constructs such as human capital (Becker, 1964) and cultural capital (Bourdieu, 1986). Nevertheless, the empirical literature has proposed various proxies. Through a panel analysis in China, Ji and Lv (2022) demonstrated how corporate philanthropy enhanced trust and cohesion, two key components of social capital. Similarly, Zamagni (2005a) demonstrated that Italian banking foundations made significant contributions to rebuilding relational capital in economically lagging regions.
Volunteerism was another crucial factor in the formation of social capital. The IV Biennial Report on Volunteering (ISFOL, 2011) and the National Report on Volunteer Organisations (CSVnet, 2015) underlined the positive externalities generated by civic participation, primarily through nonprofit organisations. ISTAT (2023) reported that philanthropic density had a positive correlation with civic and political engagement, reinforcing a virtuous cycle of participation and social cohesion.
2.2.2. Philanthropy and Economic Growth
The link between social capital and economic performance was well established in the literature. Guiso et al. (2004) found that regions with higher civic capital exhibited greater financial development and institutional quality. More recent contributions have expanded the analysis of philanthropy’s role as an engine of inclusive growth. Musari (2020) explored Islamic microfinance as a tool for poverty alleviation, while Reindl (2024) investigated how strategic corporate donations enhanced local productivity through the “creating shared value” framework.
Despite growing interest, there remained a lack of econometric studies that had rigorously isolated the causal impact of philanthropy on regional GDP. Many contributions relied on correlation-based approaches without adequately addressing concerns about endogeneity. This study aimed to bridge that gap by employing a fixed-effects model supplemented with instrumental variables (2SLS) and spatial econometric techniques, in response to the call for more refined identification strategies (Angrist & Pischke, 2009; Wooldridge, 2010). Alternative approaches, such as difference-in-differences or change-on-change models (Finkel, 1995), could have offered promising paths for future research, particularly in dynamic or policy-evaluation contexts.
2.2.3. Philanthropy in the International Arena
Globally, the evolution of philanthropic models reflected differing institutional ecosystems. In the United States, “venture philanthropy”—a combination of entrepreneurial tools and social objectives—has gained prominence (Frumkin, 2003a). Tyler (2014) highlighted how social entrepreneurship had fostered innovation through hybrid financing. In Europe, the model was often embedded in the welfare state, complementing public initiatives (Salamon et al., 2014; Salamon & Sokolowski, 2014).
Comparative econometric studies have highlighted the impact of institutional arrangements—such as legal systems, civic traditions, and fiscal incentives—on philanthropic dynamics. Barman (2017) emphasised that cultural and networked contexts had shaped donor behaviours.
Furthermore, structural equation modelling (SEM) has emerged as a valuable tool for capturing latent constructs, such as philanthropic orientation or community embeddedness, thereby refining our understanding of causality.
Integrating machine learning into philanthropic evaluation was a nascent yet promising area, capable of predicting the socioeconomic impact of interventions across diverse territorial settings. However, the field would have benefited from a closer alignment between theory and empirics. Researchers could have fully grasped philanthropy’s potential in regional development by grounding econometric designs in robust conceptual frameworks.
2.3. Summary of the Literature Review
The literature review highlighted the fragmented yet growing interest in the nexus between philanthropy, social capital, and economic growth.
While conceptual contributions had clarified the multifaceted nature of social capital and its theoretical links to economic performance, empirical research—particularly in economics and econometrics—remained limited and often lacked rigorous identification strategies.
Recent studies emphasised the relevance of institutional context, volunteering, and strategic philanthropy, but more systematic, causal analyses were still needed. This study aimed to bridge these gaps by offering a theoretically grounded and methodologically robust econometric investigation focused on the Italian regional context.
3. Methods
This study aims to analyse the relationship between regional economic growth and philanthropy in Italy, using econometric statistical methodologies to assess the nonprofit sector’s impact on economic dynamics at the national and local levels. In particular, the study aims to:
- Examine the distribution of philanthropic institutions in Italy and analyse how their concentration in different regions affects economic growth and the creation of social capital, considering territorial differences between the North, the Centre, and the South.
- Analyse the effect of philanthropy on employment, social cohesion and regional economic growth, using variables such as unemployment rate, educational participation and GDP per capita.
The work is part of a context in which philanthropy is acquiring an increasingly central role as a lever for economic and social development. It contributes significantly to the creation of social capital and reducing territorial inequalities. Statistical analyses can provide helpful empirical evidence to confirm or refute these hypotheses and are based on theoretical foundations established by previous studies on philanthropy and social capital (Putnam, 1993; Guiso et al., 2004; Calcagnini et al., 2016). The dataset used was quantitative (official source: ISTAT) from 2015 to 2019 (the years following the COVID-19 pandemic were not considered to avoid distortions related to its effects).
The main variables analysed in the study are:
- Number of nonprofit institutions by region, divided by sector of activity (culture, health, education, social assistance, economic development, volunteering).
- The number of employees in the nonprofit sector has an impact on the labour market.
- Regional economic indicators, such as GDP per capita and economic growth rate.
- Socioeconomic variables include volunteer participation rate, crime index, and a measure of social capital (Guiso et al., 2004).
The survey on philanthropic realities was conducted on a regional basis, with a further aggregation into macro-areas (North, Centre, South) to highlight territorial dynamics and control regional heterogeneity, as well as the specific effects of each geographical area. Especially:
- The change in GDP per capita indicates the regional economic trend over time.
- The variable “Volunteering” represents the number of citizens active in volunteering initiatives in each region.
- The share capital is expressed through an index developed at the regional level.
- The variables Crime and Education are measured in percentage terms.
The topic of philanthropy and its growing diffusion within the Italian economic landscape represents a relatively recent but rapidly expanding field that is also arousing considerable interest in the academic context. In this context, the principles and beliefs that inspire philanthropic action were highlighted due to what happened during the COVID-19 pandemic, where awareness emerged that human beings were heading in a direction that was too selfish and disrespectful of the surrounding nature. The real challenge, therefore, could lie in the ability to renew organisational systems, enhance human resources, and adopt a more sustainable and responsible approach to entrepreneurship. This paradigm shift could represent a crucial step in transforming organisations and improving governance models.
An empirical survey was conducted to gauge the awareness of entrepreneurs and managers regarding the role of philanthropy in development and to identify future trends in Italy.
While this study adopts a panel fixed-effects model combined with instrumental variable estimation and spatial diagnostics to mitigate endogeneity and account for unobserved heterogeneity, it does not directly implement a change-on-change or difference-in-differences (DiD) design.
Future research could overcome this limitation by using quasi-experimental settings or policy shocks to achieve more precise identification. Examples include analysing the effects of regulatory reforms or changes in public funding on philanthropic dynamics.
Summary of the Empirical Strategy and Methods Adopted
This study used a 2015–2019 regional panel (ISTAT, with three Eurostat checks) to estimate the effect of volunteering and religious infrastructure on per capita GDP. The main model is a one-way ‘within’ FEM (individual effects) with robust errors (clusters by region; Driscoll–Kraay variant), selected using Hausman and Mundlak (the preference is for an FE model). Stationarity tests (Maddala–Wu) were performed, and non-stationary series were differentiated. Subsequently, checks were performed for multicollinearity (VIF), heteroscedasticity (Breusch–Pagan test), autocorrelation (Wooldridge test), cross-section dependence (Pesaran CD test), and the significance of time dummies (Wald test). From a robustness point of view, a two-way FE model, an IV-FE (2SLS) with internal instruments (LAUREAperc, PARTEPOL; lag of VOLpro/RELpro) and a GMM with Arellano–Bond (Arellano & Bond, 1991) differences were estimated. Spatial autocorrelation (Moran’s I) was also verified, and a SARAR panel estimate with queen weights was performed, with no evidence of significant spatial dependencies.
4. Descriptive Econometric Analyses
Table 4 shows (in the five years considered) the numbers of nonprofit institutions (NPIs) in absolute value, broken down by region and with the addition of the two autonomous provinces of Trento and Bolzano and the aggregate data by macro-areas, North, Centre, South and Islands. As can be seen from the data, during the period 2015–2019, the number of NPIs in Italy increased (it was found that one in five institutions was established during this period). According to the ISTAT Permanent Census of NPIs, employment increased, most notably in sectors related to philanthropy and the promotion of volunteering (+12.2%). Table 5, which reports data on NPIs and their employees, shows that since 2015, the number of NPIs has increased by 8.1%, while employment has grown by 10.4%. Between 2018 and 2019, NPIs grew by 0.9%, less than what was recorded between 2017 and 2018 (which recorded an increase of 2.6%), while the growth in the number of employees was slight and remained around 1% in both years (Source: ISTAT).
Table 4.
Nonprofit institutions in the Italian regions (2015–2019).
Table 5.
Nonprofit institutions and their number of employees (2015–2019).
Figure 7 illustrates the joint evolution of nonprofit institutions and employment in the sector between 2015 and 2019.
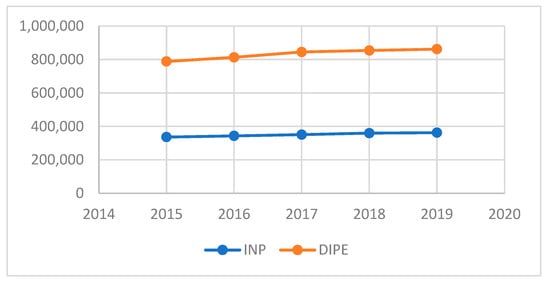
Figure 7.
INP and employees (DIPE) performance.
The nearly parallel growth of both lines suggests that the expansion of philanthropic organisations has been accompanied by a proportional increase in jobs, reinforcing the view that philanthropy contributes not only to social cohesion but also to regional labour-market dynamics.
The NPIs have a concentrated territorial distribution, with over 50% active in the North, 22.2% in the Centre, and 8.2% and 9.4%, respectively, in the South and the Islands.
The territorial concentration is even more evident among employees, as 57.2% are employed in the northern regions, compared to 20% in the South.
In the philanthropy and volunteer promotion sector, 84.6% of organisations involve volunteers—a percentage higher than the national average of 72.1% (Source: ISTAT).
Table 6 presents an aggregate analysis by macro-areas, using 2015 as the base year to illustrate overall growth.
Table 6.
The development of philanthropy in Italy—numbers, indices, fixed base 2015.
From the data, it can be seen that in the South, there is a more sudden increase in the phenomenon, an indication of the fact that the development of philanthropic activities in areas with more fragile socioeconomic conditions (Felice, 2007, 2016; Gabrielli & Lee, 2009) is a symptom of a less efficient public administration, and/or even of southern populations likely to be more inclined to generosity (Placanica, 1998).
Table 7 shows descriptive statistics for the number of nonprofit institutions by region (mean, standard error, median, minimum, maximum) calculated over the five years 2015–2019. The entries North/Centre and South are macro-regional aggregations (Trento and Bolzano are included in Trentino-Alto Adige). The units are the number of institutions. The “standard error” is σ/√T (T = 5).
Table 7.
Descriptive statistics related to nonprofit institutions.
Data distributions are generally symmetrical and are only slightly affected by anomalous data. The means and medians exhibit a marginal difference, and the interval ranges (the difference between the maximum and minimum values) do not have high values. The driving regions for the North (which has the most significant number of nonprofit institutions) are Liguria, Veneto and Piedmont. In the South and the Islands (which have greater variability in the data), the regions with the most relevant data are Sicily and Campania, while Molise and Basilicata presented the smallest values overall.
Table 8 presents the percentage distribution of companies across various sectors identified by macro-areas, along with the corresponding employee counts. In particular, the twelve sectors in which nonprofit organisations operate are culture, sport and recreation; education and research; health; social assistance and civil protection; environment; economic development and social cohesion; protection of rights and political activity; philanthropy and promotion of volunteering; international cooperation and solidarity; religion; trade union relations and representation of interests; other activities.
Table 8.
Geographical distribution of philanthropic activities (% values).
The culture, sport, and recreation sector involves most nonprofit institutions in all three geographical areas, with values ranging from approximately 61% to 65%. This figure reflects Italy’s leading role in the world in terms of artistic and cultural heritage, enabling it to access funding from international bodies to enhance and promote its cultural riches, thereby constituting a significant source of economic income. Organisations operating in the sports and recreational field also fall within the same scope. As can be seen from the data, for the three geographical areas, the second group of activities carried out by philanthropic entities is represented by social assistance and civil protection, with values ranging around 10%. Next, the other nonprofit activities with high percentages are those in the sectors of trade union relations and representation, as well as religion, education, and research. The lowest percentage values correspond to international cooperation and solidarity, philanthropy and promotion of volunteering, protection of rights and political activity, economic development and social cohesion, and environmental protection.
Employees are concentrated in a few sectors. In a decreasing sense, these include social assistance, health, education, research, economic development, and social cohesion. The remaining sectors have fewer employees, in proportion to fewer initiatives.
5. Regional Economic Growth and Philanthropy: Relationships?
This section evaluated the relationship between regional economic growth and philanthropy in Italy. To this end, the ISTAT source dataset was considered, containing each Italian region, identified with an “id” and, for the 2015–2019 interval, 17 variables (indicators) representing the GDP per capita, an indicator of political participation (PARTEPOL), the number of visitors to museums (MUSEIpro), the population who have a bachelor’s degree (LAUREAperc), the number of people who have done at least one hospitalisation (RICOVERIpro), elderly treated in-home care (ASSANZperc), an indicator of the environment related to recycling collection (RACCDIFFperc), the residence permits as of January 1 (PERSOGGpro), the injured in traffic accidents (INCIDperc), the employed (OCCUPperc), the number of volunteers and the religious presence per capita (VOLpro e RELpro), the mortality and crime rate as a percentage (TASSOMORTperc e INCIDperc), the per capita unemployment rate (DISOCpro), the number of economic establishments (ESERCpro) and the resident population (popol).
The other three variables were downloaded directly from Eurostat’s website: (RDcap), as a proxy for innovation capacity; transportation infrastructure density (INFRA), which captures market accessibility; and manufacturing share of gross value added (MANUFshare), which controls sectoral mix.
Given the panel structure of the data—spanning multiple years and longitudinal regions—an unconditional fixed effects model (FEM) was estimated:
where αi are the regional fixed effects, γt are the annual dummies, and Zit are the variables RDcap, INFRA and MANUFshare.
yit = αi + γt + βxit + δ’Zit + ϵit
This model aims to analyse the effect of philanthropy on per capita GDP across Italian regions. This means that this model does not estimate a global intercept because each region has its own specific intercept, which captures constant characteristics over time. Region-specific intercepts are absorbed in the data transformation and are often not explicitly reported in the results. The software for the analysis is RStudio (version 2025.09.2-418) (using libraries, some of which are plm, nlme, lmtest, panelvar, tseries, dplyr); the variable GDP per capita (PILPRO) or PILPROlog (log of GDP) was identified as a potential dependent variable for estimating economic growth. The independent variable is a measure of philanthropy chosen from one or more variables in the dataset (e.g., the number of volunteers per capita, the presence of religious bodies, etc.).
5.1. Diagnostic Tests
Before estimating such a model, it is essential to conduct a series of diagnostic tests to confirm the choice (which will allow one to control for unobserved time-constant heterogeneity across regions, e.g., local culture institutions).
First, Fisher’s unit root test was performed on each dataset variable to confirm its stationarity. The tests were run with Maddala–Wu (χ2) p-values to ensure the procedure’s full reproducibility. Many variables were found to be non-stationary: DISOCperc, LAUREAperc, OCCUperc, PERSOGGpro, popol and INCIDperc (p > 0.05). The variables for which the unit root test rejects the null hypothesis are VOLprop, RELpro, RDcap, INFRA and MANUFshare (p < 0.0001). Differentiation was performed for the non-stationary variables.
As the number of variables is high compared to the number of observations, a stability analysis was also conducted to restrict the number of variables used as explanatory. In particular, VOLpro (volunteers per capita) and RELpro (religious participation) can be considered indicators of philanthropy. As available controls, the variables MUSEIpro, LAUREAperc, RICOVERIpro, OCCUPperc, PARTEPOL, CRIMperc, etc., can be used.
The Hausman test, which allows a fixed-effects model to be compared with a random-effects model, was conducted by considering the following explanatory variables: the number of volunteers, the religious presence per capita, the proportion of the population with bachelor’s degrees, and the per capita unemployment rate. The selection of explanatory variables was deliberately restricted to mitigate multicollinearity. Including the complete set of candidate variables yielded an extremely high condition number, indicating severe multicollinearity among the regressors. Moreover, an automated stepwise regression procedure (MA) identified essentially the same subset of variables as the most important predictors of GDP per capita. Thus, focusing on this limited set of covariates addresses concerns about multicollinearity and aligns with data-driven variable selection results.
Hausman’s test provides a χ2 = 109.62 (p < 0.0001), confirming the use of a fixed-effects model; the unobservable differences between regions (e.g., culture, institutions) are correlated with the variables in the model (e.g., education, unemployment, religiosity), and this reassures us as it is being affirmed that every region is different and cannot be ignored. It should be noted that the Hausman test alone cannot address broader model specification problems, such as omitted variable bias, simultaneity (when an explanatory variable is jointly determined with the dependent variable), or general endogeneity. To mitigate these risks, the model was further refined through additional specification checks.
This included testing alternative specifications—such as adopting the logarithm of GDP per capita as the dependent variable—and re-evaluating the explanatory variables. The analysis included a rigorous assessment of multicollinearity through the calculation of the Variance Inflation Factor (VIF) for each regressor. All variables exhibited VIF values below 10, indicating that multicollinearity is not severe in the final model. The highest VIF was 5.43 for the variable DISOCpro, indicating a moderate correlation with the other regressors and remaining within acceptable limits.
The F-test for individual fixed effects yielded a highly significant result (F = 334.89, p < 0.0001), indicating that unobserved heterogeneity across regions is statistically significant. This strongly supports the use of a fixed-effects model (FEM) over a pooled OLS specification. Second, the Breusch–Pagan Lagrange Multiplier (LM) test for random effects also refuted the null hypothesis of no panel effects (χ2 = 81.807, p < 0.0001). This confirms the presence of significant panel-level variance, suggesting that both the random effects model (REM) and the fixed effects model are preferable to pooled OLS. However, the Hausman test decisively rejected the random effects model. A Wald test (more potent than the F-test) was also performed to assess whether years systematically impact GDP per capita once socioeconomic variables are controlled. The Chi-square test statistic of 23.23 (p < 0.0001) shows that the model’s time effects are statistically significant. Therefore, a two-way model, i.e., with individual and time-fixed effects, was also estimated and compared with the one-way model with fixed effects. The one-way model explains much more variance within units (regions) than the two-way model, where the adjusted R2 is very low and negative (−0.2454); most coefficients are reduced in absolute value, and some variables lose significance. Thus, a one-way fixed effects model (individual effects only) is the most appropriate specification for this analysis. Furthermore, an analysis of standardised coefficients within the fixed-effects model indicates that education level (LAUREAperc) and employment status (DISOCpro) have a strong influence on per capita GDP.
The Mundlak test complements the Hausman test for determining between fixed-effects and random-effects models, when heteroskedasticity is suspected or the Hausman test is unreliable due to restrictive assumptions. It was conducted by including the averages between the units and the intra-individual components of the explanatory variables in the random-effects model. The significance of the DISOCpro means (p < 0.0001) confirms the correlation between explanatory variables and individual effects, reinforcing the choice of the fixed-effects model. This result is consistent with the Hausman test, providing robust validation of the model specification.
5.2. Model Estimation
The estimation of the fixed-effects model in Table 9, using GDP per capita as a dependent variable and volunteering, the presence of religious bodies, the population who have a bachelor’s degree, and the per capita unemployment rate (differentiated) as explanations, shows a significant relationship with economic growth (measured both as GDP per capita and as a log of GDP per capita) in the Italian regions and leads to an adjusted index of determination that explains 60% of the model.
Table 9.
Estimation of the fixed effects model.
Fisher’s F statistic (30.75, p < 0.0001) indicates that the regressors are significant. The residuals have a narrow range, indicating a good fit to the data. An increase in GDP is proportional to social capital as measured by the number of volunteers, while an increase in religious presence per capita produces a reduction in GDP. The higher presence of college graduates (which induces an inverse relationship with GDP) could reflect an employment mismatch or intellectual unemployment. As expected, unemployment has a substantial negative impact on economic growth.
Figure 8 illustrates, from a descriptive perspective, the graph of the relationship between LAUREaperc, DISOCpro, and GDP per capita. The data appear to be distributed in clusters, which could indicate regional or temporal groups. Some outliers (e.g., a few points with high unemployment and low GDP) might indicate regions in crisis or critical years.
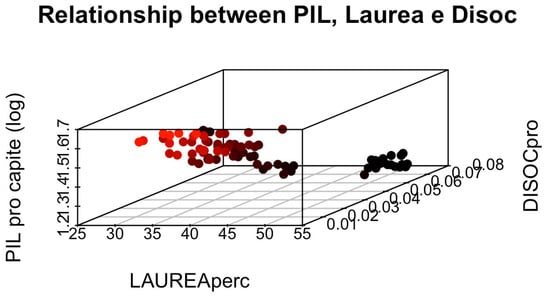
Figure 8.
Relationship between LAUREaperc, DISOCpro and the logarithm of GDP per capita. Darker shades correspond to higher values of LAUREaperc or DISOCpro, while lighter shades represent lower values.
Figure 9 shows the graph (facet plot) of the relationship between GDP per capita (log) and each of the four independent variables (DISOCpro, LAUREAperc, RELpro, VOLpro) for each Italian region.
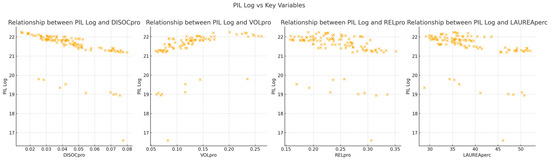
Figure 9.
Relationship between GDP per capita (log) and the four independent variables (DISOCpro, LAUREAperc, RELpro, VOLpro).
Considering unemployment, most regions show a negative relationship with GDP per capita (log). A higher percentage of college graduates is not associated with higher GDP in many areas (confirming an employment mismatch). The effects related to religious presence per capita are very weak; however, a potentially favourable link between GDP per capita and the number of volunteers is observed.
5.3. Choice of Control Variables and Relevant Indicators
The model was refined by adding three theory-driven control variables that vary substantially within regions to minimise the risk of omitted variable bias: RDcap, INFRA and MANUFshare.
The inclusion of these variables reduces the within-sample variance inflation factors (all VIF < 2) and leaves the philanthropy coefficients virtually unchanged (Table 10). This confirms that a set of controls that are too narrow does not determine the basic results. In particular, the output suggests that R&D investment is associated with higher growth, infrastructure accessibility stimulates economic development, and the negative but significant coefficient of MANUFshare indicates the effects of industrial decline or sectoral imbalances.
Table 10.
Extended FEM with Additional Controls.
In conclusion, the results in Table 9 and Table 10 indicate that the estimates are consistent with regional fixed effects; the coefficients remain stable over time and are identified by the temporal variation in the variables. Fixed effects absorb characteristics that remain unchanged over time.
An expanded set of controls was considered, incorporating institutional variables (e.g., regional government quality, public spending per capita) and alternative measures of human capital, such as PISA test performance. Unfortunately, the results were unsatisfactory because these indices changed minimally over the 5 years, inducing problems of reverse endogeneity and multicollinearity.
For these theoretical and empirical reasons, inclusion does not improve, and in fact, worsens the identification of central parameters (VOLpro, RELpro).
A PISA indicator would be helpful, but it is only available for the 2015 and 2018 rounds and is not captured for all Italian regions. As a result, it would require a drastic loss of observations (<50) and statistical power.
The share of college graduates (LAUREAperc) thus remains the largest and most comprehensive proxy in the panel.
5.4. Endogeneity and Multilevel Analysis: 2SLS Approaches and Robustness Models
Diagnostic tests on the FEM reveal the presence of heteroskedasticity (Breusch–Pagan test: χ2 = 16.91, p < 0.0001) and first-order serial correlation in the idiosyncratic errors (Wooldridge test: F = 10.825, p < 0.0001), suggesting that standard OLS-based inference would be inconsistent. A “pooled” OLS was also estimated, with GDP per capita (log) as the dependent variable and VOLpro, RELpro, LAUREAperc, and DISOCpro as regressors (a constant was included). The White (1980) heteroskedasticity-robust test (LM = 53.74, p < 0.0001) refutes the hypothesis of homoskedasticity and confirms the use of the estimate for subsequent models with robust covariances (regional clusters or Driscoll–Kraay). However, the Pesaran CD test (z = 1.586, p = 0.113) does not refute the null hypothesis of cross-sectional independence, supporting the assumption of independence across regional units.
A two-way fixed-effects model (Region × Year) for log GDP per capita was estimated using Driscoll–Kraay standard errors, which allow for the simultaneous control of heteroskedasticity, serial correlation, and cross-section dependence. All four core regressors are highly significant and keep the expected sign (Table 11). An extra volunteer per 1000 inhabitants is associated with a 0.11% increase in regional GDP per capita, whereas an additional religious body per 1000 inhabitants predicts a 0.13% decline. Education (LAUREAperc) and unemployment (DISOCpro) enter negatively, the latter with the most considerable standardised effect. Overall, within-fit is solid (Adjusted R2 ≈ 0.56), and the joint significance of year dummies (Wald χ2 = 22.02, p < 0.001) justifies the two-way specification. After the Driscoll–Kraay correction, all the issues no longer have biased inference.
Table 11.
Fixed-effects model with standard errors corrected according to Driscoll–Kraay.
Given the plausible endogeneity of the employment rate (OCCUPperc), the model was re-estimated using LAUREAperc and PARTEPOL as instruments within an IV-FE 2SLS framework. Instrument relevance is strong (first-stage F = 96.2), and the over-identification test is borderline but acceptable (Sargan test p = 0.055). The second-stage coefficient on employment is β = 0.488 (SE = 0.065), confirming that higher employment causally boosts regional income even after controlling for philanthropy and other covariates (see Table 12). The model is:
Table 12.
IV-Fixed effects (2SLS) with cluster-regional standard errors.
A two-step Arellano–Bond (Arellano & Bond, 1991) difference-GMM model was estimated (Table 13), using deeper lags as internal instruments to address reverse causality and short-panel bias. The lagged dependent variable is positive and marginally significant (γ = 0.75, p = 0.09), indicating moderate growth persistence, while the philanthropic variables lose significance (VOLpro, p = 0.13; RELpro, p = 0.83). The Sargan/Hansen test remains marginal (p ≈ 0.06), but AR(2) is rejected, indicating no second-order serial correlation. The weaker results primarily reflect the sharp decline in usable observations (N = 35) following the first differencing.
Table 13.
One-way (individual) effect, Two-step model, Difference GMM.
- Stability across estimators. The positive effect of volunteering and the adverse effect of religiosity are highly robust in static FE models (cluster-robust and Driscoll–Kraay) but become statistically fragile once dynamic bias is removed by GMM.
- Endogeneity safeguards. Instrumenting employment leaves the philanthropy coefficients virtually unchanged, mitigating concerns that labour-market performance alone drives the baseline results.
- Time-specific shocks. Year dummies are jointly significant, yet the substantive coefficients are virtually identical in one-way and two-way FE, suggesting that regional heterogeneity dominates temporal shocks.
- Spatial spillovers. A linear mixed model with a random intercept for each region yields a regional variance component, σ2_u, of 0.074 (SE = 0.029). Likelihood-ratio testing reveals that the mixed model does not outperform the FEM specification (p = 0.31), suggesting that fixed effects effectively capture unobserved heterogeneity.
- Contiguity network and spatial weight matrix. A first-order “queen” contiguity weight matrix W was used for regions. Two regions are neighbours if they share at least one boundary point. The corresponding spatial weights matrix is row-standardised: for region , when and are contiguous (and otherwise), where is the number of neighbours of . As the island regions have no land neighbours, the rows for Sicily and Sardinia are set to zero, consistent with the study design. This network, as shown in Figure 10 below, provides the basis for both autocorrelation tests and the (optional) SARAR specification. For robustness, distance-based variants (inverse distance and k-nearest neighbours) were also tested. Because these alternatives did not materially change the results, they are not reported.
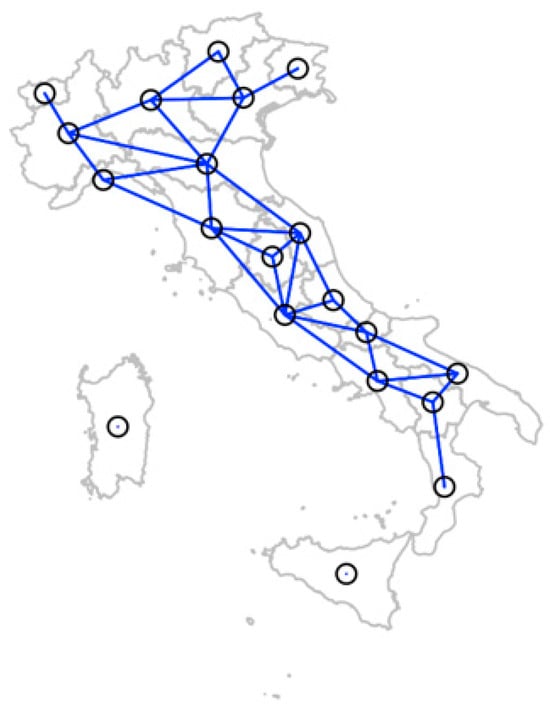 Figure 10. Map of Italian regions with spatial contiguity network (queen). The blue lines represent the adjacencies used to construct the proximity matrix W; the regional polygons serve only as a cartographic basis (the fill colour has no metric significance). The dotted circle highlights the island regions of Sicily and Sardinia, which have no land contiguity and therefore have a null row in W.
Using this matrix , Moran’s on the fixed-effects (FE) residuals is (), close to the threshold, and does not confirm significant autocorrelation. Estimating a SARAR panel model with spatial lag and spatial error terms yields () and (). The lack of significance for both parameters implies that a pure SAR or SEM would not improve explanatory power; consequently, the FE specification without spatial terms remains appropriate.
SAR residuals are used only as a graphical diagnostic (Figure 10) to illustrate the absence of systematic spatial patterns.
Implementation details: all spatial objects and estimators were computed in RStudio using the spdep/sf and splm packages. was employed (i) to compute Moran’s on FE residuals and (ii) to define the spatial-lag component and the spatial-error structure in the SARAR checks. Overall, the queen-contiguity design is well-suited to Italy’s irregular, sub-national regional geometry and was consistently applied across all spatial diagnostics.
Using the most stringent specification that retains statistical power (two-way FE with robust errors), volunteering shows a small but economically meaningful pro-growth association, while a denser religious infrastructure correlates with slower income growth. Dynamic GMM (Table 13) suggests these links are not immune to specification changes, justifying caution and future work with longer panels or external instruments for philanthropy. However, the consistency between cluster-robust, Driscoll–Kraay and IV-FE estimates strengthen the argument that civic volunteering may foster—and intensive religious presence may hinder—regional economic performance in Italy during 2015–2019.
Finally, the implementation of a 2SLS (two-stage IV-FE) model using the t-1 lags of VOLpro and RELpro as instruments, along with the baseline exogenous variables (Table 14), shows that the effects of the variables remain significant and of the same sign.
Table 14.
Two-stage IV-Fixed effects (2SLS) with lagged instruments.
Figure 10 represents the map of Italian regions with the spatial contiguity network obtained using the queen contiguity criterion, which considers regions with at least one border point neighbour. The connections (represented with blue lines) highlight the spatial proximity matrix (W) structure used for spatial autocorrelation tests and for estimating possible spatial patterns. The network appears well-connected for the regions of the peninsula, but highlights the presence of isolated regions, particularly Sardinia and Sicily, which, due to their insularity, are not connected to the others. Such cases generate empty neighbour sets when constructing the spatial weights matrix, adopting specific expedients, including observations among neighbours or using alternative definitions based on geographical distances. Visualisation confirms the structural validity of the W matrix for continental regions and constitutes a valuable tool for identifying potential distortions arising from geographically isolated regions. The map (Figure 11) shows the spatial distribution of the SAR model residuals, calculated as the difference between the observed and predicted value of the regional GDP per capita logarithm. The regions of the North and the North-East show positive residuals (indicating the presence of local factors, such as high productivity). The model performs very well for the regions of the Centre-North and the Tyrrhenian Ridge. The South and the islands exhibit harmful residues. This confirms the absence of significant spatial autocorrelation and that the FE model estimates remain reliable, and a more complex model (such as SEM) would not bring improvements. SAR/SARAR panel estimates are used only as robustness checks; the lack of significance of ρ and λ justifies the adoption of FEM as the main specification.
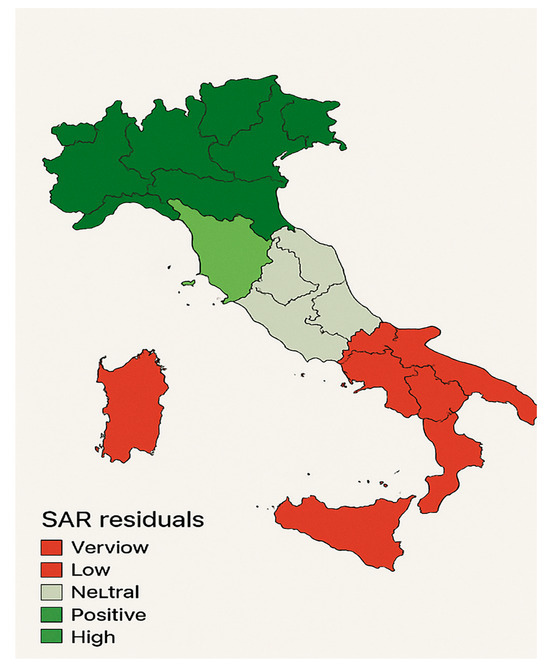
Figure 11.
SAR model residuals by region. The map is a divergent scale choropleth centred on 0: warm colours indicate positive residuals (overestimation of expected GDP) and cool colours indicate negative residuals (underestimation), with colour intensity proportional to the absolute value of the residual; neutral colours indicate values close to zero.
5.5. Analysis of Residuals
A comprehensive diagnostic check was carried out on the within-fixed-effects residuals. In particular, the residual histogram (Figure 12) is symmetric and centred near zero; therefore, the Shapiro–Wilk statistic (W = 0.978, p = 0.209) supports the assumption of normality. The Q–Q plot (Figure 13) supports this conclusion, showing a close alignment between the theoretical and empirical quantiles, except for mild deviations in the tails. A Breusch–Pagan test detects heteroskedasticity (χ2 = 16.91, p < 0.01), and both the Wooldridge autocorrelation (F = 10.83, p < 0.01) and Durbin–Watson (DW ≈ 2.05, p ≈ 0.011) test reveal first-order AR(1) serial correlation. Conversely, the Pesaran CD test does not reject cross-sectional independence (z = 1.59, p = 0.11); the residuals appear to be independent across regions. Accordingly, all inference is based on Arellano’s (1987) region-clustered standard errors, which remain consistent under heteroskedasticity and serial correlation. The residual-vs-fitted plot (Figure 14) reveals no funnel shape or systematic trend, suggesting that the linear functional form is appropriate. Together, these diagnostics support the statistical adequacy of the fixed-effects specification.
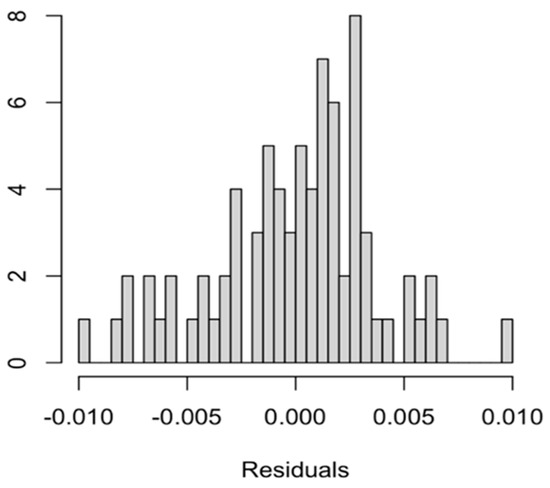
Figure 12.
Histogram of residuals.
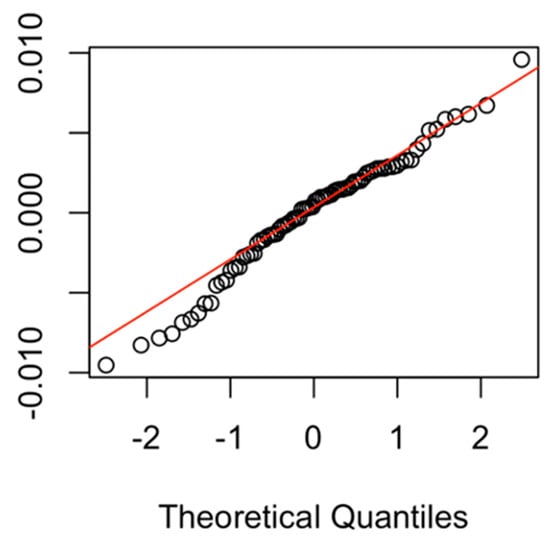
Figure 13.
Normal Q-Q plot. The red line represents the theoretical normal distribution, while the circles indicate the empirical quantiles of the residuals. The alignment of the points along the line suggests a good approximation to normality.
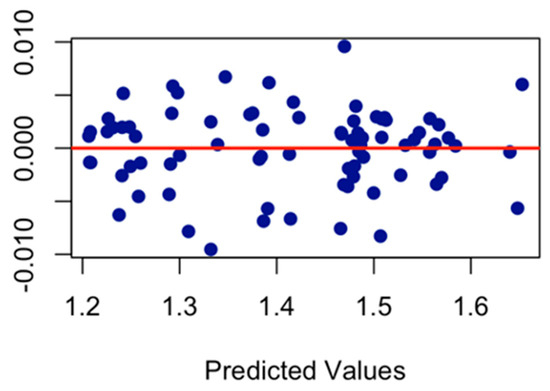
Figure 14.
Residuals vs. Fitted Values. The red line represents the ideal distribution of residuals. The circles indicate the observed residuals relative to the fitted values; a random distribution around the red line suggests good model fit, while any systematic patterns indicate possible problems in the model.
After correcting the covariance matrix, residuals exhibit approximate normality, homoscedasticity in the robust sense, no cross-sectional dependence, and no unaddressed serial pattern. Consequently, the fixed-effects estimator—with cluster-robust inference—remains reliable for substantive interpretation.
6. Discussion and Conclusions
This study aimed to empirically test three core hypotheses: (H1) that philanthropy—measured through proxies such as volunteering and nonprofit density—positively affects regional economic growth; (H2) that the impact of philanthropic variables is mediated by the quality of social capital and institutional context; and (H3) that regional disparities in economic development correlate with the territorial distribution and configuration of philanthropic infrastructure. The findings support H1 and H2 with strong consistency across model specifications, while partially supporting H3 with some exceptions at the regional level.
The positive and statistically significant effect of volunteering on GDP per capita aligns with Putnam’s (2000) civic community thesis and extends the econometric evidence base suggested by Guiso et al. (2004), who emphasised the role of civic capital in financial development. This relationship is further confirmed by Ji and Lv (2022), who showed how corporate philanthropy in China enhances trust and social cohesion, prerequisites for long-term economic performance. On the contrary, the negative correlation with religious organisation density suggests that not all forms of philanthropic infrastructure generate inclusive economic outcomes. This paradox may reflect cultural conservatism or substitution effects between informal civic networks and formal religious structures, as discussed in Barman (2017) and Anheier and Leat (2006).
The econometric strategy—based on fixed-effects, 2SLS estimators, and Driscoll–Kraay corrections—strengthens the reliability of the results by addressing endogeneity and cross-sectional dependence. Including spatial econometric tests, such as Moran’s I and SARAR models, contributes to a deeper understanding of territorial autocorrelation. Although no significant spatial spillovers were detected, the attention to spatial structure represents a methodological innovation aligned with recommendations by Elhorst (2014) and LeSage and Pace (2009).
The significance of governance quality supports hypothesis H2 as an interaction factor: philanthropic activity yields higher returns in regions with stronger institutional environments. This complements theoretical models of philanthropic embeddedness (Frumkin, 2003a; Salamon et al., 2014; Salamon & Sokolowski, 2014) and reinforces the idea that institutional capital multiplies the effects of social capital. The role of human capital, proxied by tertiary education, presented an unexpected negative sign, possibly indicating labour market mismatches or structural inefficiencies—a theme explored by Becker (1964) and more recently by Rodríguez-Pose (2013) in the context of European regional disparities.
While the analysis confirms H1 and H2, H3 receives only partial validation: although macro-regional patterns are observable, the heterogeneity within Italian regions suggests that Meso-level institutional and cultural dynamics play a more decisive role than broader geographical clusters. This resonates with findings from the literature on regional innovation systems (Cooke, 2001) and multilevel governance.
Methodologically, the paper addresses a gap in the literature by providing a theoretically grounded empirical framework that complements previous correlation-based studies (Zamagni, 2005b). Nevertheless, further research should explore difference-in-differences (DiD) and change-on-change designs (Finkel, 1995) to strengthen causal inference, particularly in contexts involving policy interventions. Moreover, the integration of machine learning tools suggested by B. Katz and Ronfeldt (2018) could provide predictive insights and identify regional resilience patterns in response to philanthropic stimuli.
In conclusion, this paper contributes to the growing field of philanthropic economics by demonstrating that civic infrastructure and volunteering are not merely social goods but can generate measurable economic returns. The findings hold implications for regional development policies, particularly in lagging areas were fostering a culture of giving and institutional trust may catalyse broader socioeconomic transformation.
Author Contributions
This article is the result of a collaboration between the two authors, who together oversaw the following aspects: software use, validation, formal analysis, investigation, original draft preparation, review and editing, and visualization and supervision. G.M. oversaw Conceptualization, resources, and project administration. S.P. oversaw methodology and data curation. Regarding the content of the article, it is worth noting that G.M. introduced the topic and oversaw the literature review, drafting the discussion and conclusions. Consequently, the sections “Introduction,” “Literature Review,” and “Discussion and Conclusions” are attributed to him. Simona Pacillo, however, processed the data and drafted the related observations. The other sections are therefore attributable to her. All authors have read and agreed to the published version of the manuscript.
Funding
This research received no external funding.
Institutional Review Board Statement
Not applicable.
Informed Consent Statement
Not applicable.
Data Availability Statement
The data used as the primary source are from the Istat website (www.istat.it, accessed on 1 November 2025).
Acknowledgments
The authors thank Diletta Migliaccio for her valuable input and collaboration in collecting and processing the data.
Conflicts of Interest
The authors declare that they have no conflicts of interest.
Note
| 1 | A high TLS value indicates, for example, that an article is highly connected and therefore has central relevance in the network. |
References
- Abbas, J., Al-Sulaiti, K., Lorente, D. B., Ale Raza Shah, S., & Shahzad, U. (2023). Reset the industry redux through corporate social responsibility: The COVID-19 tourism impact on hospitality firms through business model innovation. In Economic growth and environmental quality in a post-pandemic world: New directions in the econometrics of the environmental kuznets curve (pp. 177–201). Routledge. [Google Scholar] [CrossRef]
- Abdulai, D. (2015). From charity to mutual benefit: A new and sustainable look at CSR in Africa. In New perspectives on corporate social responsibility: Locating the missing link (pp. 427–442). Emerald Group Publishing Limited. [Google Scholar] [CrossRef]
- Acs, Z. J. (2013). Why philanthropy matters: How the wealthy give, and what it means for our economic well-being. Princeton University Press. [Google Scholar]
- Acs, Z. J., & Phillips, R. J. (2002). Entrepreneurship and philanthropy in American capitalism. Small Business Economics, 19(3), 189–204. [Google Scholar] [CrossRef]
- Andreoni, J. (1990). Impure altruism and donations to public goods: A theory of warm-glow giving. The Economic Journal, 100(401), 464–477. [Google Scholar] [CrossRef]
- Angrist, J. D., & Pischke, J. S. (2009). Mostly harmless econometrics: An empiricist’s companion. Princeton University Press. [Google Scholar]
- Anheier, H. K., & Leat, D. (2006). Creative philanthropy: Toward a new philanthropy for the twenty-first century. Routledge. [Google Scholar]
- Arellano, M. (1987). Computing robust standard errors for within-groups estimators. Oxford Bulletin of Economics & Statistics, 49(4). [Google Scholar] [CrossRef]
- Arellano, M., & Bond, S. (1991). Some tests of specification for panel data: Monte carlo evidence and an application to employment equations. The Review of Economic Studies, 58(2), 277–297. [Google Scholar] [CrossRef]
- Ari, I., & Koc, M. (2021). Towards sustainable financing models: A proof-of-concept for a waqf-based alternative financing model for renewable energy investments. Borsa Istanbul Review, 21, S46–S56. [Google Scholar] [CrossRef]
- Ayub, M., Khan, K., Khan, M., & Ismail, M. (2024). Waqf for accelerating socioeconomic development: A proposed model with focus on Pakistan. Qualitative Research in Financial Markets, 16, 937–961. [Google Scholar] [CrossRef]
- Barbetta, G. P. (2004). Le fondazioni bancarie: Dall’assistenza allo sviluppo locale. Il Mulino. [Google Scholar]
- Barman, E. (2017). Why and how to study philanthropy. In P. Wiepking, & F. Handy (Eds.), The palgrave handbook of global philanthropy. Palgrave Macmillan. [Google Scholar]
- Becker, G. S. (1964). Human capital: A theoretical and empirical analysis, with special reference to education. National Bureau of Economic Research. [Google Scholar]
- Bishop, M., & Green, M. (2008). Philanthrocapitalism: How giving can save the world. Bloomsbury Press. [Google Scholar]
- Bourdieu, P. (1986). The forms of capital. In J. G. Richardson (Ed.), Handbook of theory and research for the sociology of education (pp. 241–258). Greenwood. [Google Scholar]
- Calcagnini, G., Giombini, G., & Perugini, F. (2016). Bank foundations, social capital, and the growth of italian provinces (Working Paper No. 131). Available online: http://docs.dises.univpm.it/web/quaderni/pdfmofir/Mofir131.pdf (accessed on 21 May 2022).
- Chernow, R. (1998). Titan: The life of John D. Rockefeller, Sr. Penguin Press. [Google Scholar]
- Coleman, J. S. (1990). Foundations of social theory. Harvard University Press. [Google Scholar]
- Cooke, P. (2001). Regional innovation systems, clusters, and the knowledge economy. Industrial and Corporate Change, 10(4), 945–974. [Google Scholar] [CrossRef]
- CSVnet. (2015). Report nazionale sulle organizzazioni di volontariato censite dal sistema dei CSV. Fondazione IBM Italia. Available online: https://www.volontariatotrentino.it/sites/default/files/download/Report%20delle%20organizzazioni%20di%20volontariato.pdf (accessed on 1 November 2025).
- Cunningham, H. (2016). Philanthropy and charity in the past: A historical perspective. Taylor & Francis. [Google Scholar]
- Edward, P., & Sumner, A. (2019). The end of poverty: Inequality and growth in global perspective (pp. 1–89). Palgrave Macmillan. [Google Scholar] [CrossRef]
- Elhorst, J. P. (2014). Spatial econometrics: From cross-sectional data to spatial panels. Springer. [Google Scholar]
- Felice, E. (2007). Divari regionali e intervento pubblico. Per una rilettura dello sviluppo in Italia. Il Mulino. [Google Scholar]
- Felice, E. (2016). Perché il sud è rimasto indietro. Il Mulino. [Google Scholar]
- Finkel, S. E. (1995). Causal analysis with panel data. Sage. [Google Scholar]
- Frumkin, P. (2003a). Inside venture philanthropy. Society, 40(4), 7–15. [Google Scholar] [CrossRef]
- Frumkin, P. (2003b). On being nonprofit: A conceptual and policy primer. Harvard University Press. [Google Scholar]
- Gabrielli, L., & Lee, S. (2009). The relative importance of sector and regional factors in Italy. Journal of Property Investment & Finance, 27(3), 277–289. [Google Scholar] [CrossRef]
- Guiso, L., Sapienza, P., & Zingales, L. (2004). The role of social capital in financial development. American Economic Review, 94(3), 526–556. [Google Scholar] [CrossRef]
- Huda, M., & Santoso, L. (2022). Implementation of corporate waqf core principles in the development of waqf in Indonesia. Academic Journal of Interdisciplinary Studies, 11, 114–124. [Google Scholar] [CrossRef]
- Irving, P. H., & Beamish, R. (2014). The upside of aging: How long life is changing the world of health, work, innovation, policy, and purpose. John Wiley & Sons. [Google Scholar]
- ISFOL. (2011). IV Rapporto biennale sul volontariato. Ministero del Lavoro e delle Politiche Sociali. Available online: www.ilmondounito.com/012%201%C2%B0Isfol_Rapporto%20Biennale%20Volntariato%202011.pdf (accessed on 1 November 2025).
- ISTAT. (2023). Rapporto annuale 2023. ISTAT. Available online: https://www.istat.it/storage/rapporto-annuale/2023/Rapporto-Annuale-2023.pdf (accessed on 1 November 2025).
- Ji, M., & Lv, W. (2022). Demonstration zones reform and corporate philanthropy: Evidence from China. Economic Modelling, 115, 105954. [Google Scholar] [CrossRef]
- Katz, B., & Ronfeldt, D. (2018). The rise of networked philanthropy: Digital platforms and social impact investing. Stanford Social Innovation Review, 16(3), 34–41. [Google Scholar]
- Katz, S., & Page, K. (2014). The Impact Investor: Lessons in leadership and strategy for collaborative capitalism. Wiley. [Google Scholar]
- Katz, S. N. (2006). Chapter 37 Philanthropy. In V. A. Ginsburgh, & D. Throsby (Eds.), Handbook of the economics of art and culture (Vol. 1, pp. 1299–1321). Elsevier. [Google Scholar]
- LeSage, J. P., & Pace, R. K. (2009). Introduction to spatial econometrics. CRC Press. [Google Scholar]
- Lin, N. (2001). Social capital: A theory of social structure and action. Cambridge University Press. [Google Scholar]
- Magomedova, N., Roig, L. C., & Bastida-Vialcanet, R. (2020). La innovación aplicada a la financiación de las empresas de la economía social. El caso de las inversiones de impacto [Innovation applied to financing of enterprises of social economy. A case of impact investment]. CIRIEC-Espana Revista de Economia Publica, Social y Cooperativa, 98, 127–151. [Google Scholar] [CrossRef]
- McQuilten, G., Warr, D., Humphery, K., & Spiers, A. (2020). Ambivalent entrepreneurs: Arts-based social enterprise in a neoliberal world. Social Enterprise Journal, 16, 121–138. [Google Scholar] [CrossRef]
- Moran, M., & Branigan, E. (2016). The contested terrain of corporate philanthropy and social responsibility: Theories, approaches and challenges. In K. Prewitt, D. R. Young, & V. Zurita (Eds.), The Routledge companion to philanthropy (pp. 375–390). Routledge. [Google Scholar]
- Musari, K. (2020). Islamic nano-finance for the very poor by women: Hopes for addressing the Islamic microfinance gap. In M. Z. A. Karim, & I. M. Sani (Eds.), Economic empowerment of women in the Islamic world: Theory and practice (pp. 265–286). Palgrave Macmillan. [Google Scholar]
- Nasaw, D. (2006). Andrew carnegie. Penguin Press. [Google Scholar]
- Nicholls, A., Emerson, J., & Paton, R. (2015). Social finance. Oxford University Press. [Google Scholar]
- Placanica, A. (1998). L’identità del meridionale. Meridiana, (32), 153–182. [Google Scholar]
- Putnam, R. D. (1993). Making democracy work: Civic traditions in modern Italy. Princeton University Press. [Google Scholar]
- Putnam, R. D. (2000). Bowling alone: The collapse and revival of American community. Simon & Schuster. [Google Scholar]
- Rambe, P. (2018). Reconciling business social responsibility goals, activities and practices in hospitality SMMES in an emerging economy. African Journal of Business and Economic Research, 13, 177–218. [Google Scholar] [CrossRef]
- Reindl, S. (2024). Creating shared value in China: The case of Austrian businesses. Business Strategy and Development, 7(1), e335. [Google Scholar] [CrossRef]
- Reiner, T. A., & Wolpert, J. (1981). The non-profit sector in the metropolitan economy. Economic Geography, 57, 23–33. [Google Scholar] [CrossRef]
- Rodgers, D. T. (1998). Atlantic crossings: Social politics in a progressive age. Harvard University Press. [Google Scholar]
- Rodríguez-Pose, A. (2013). Do institutions matter for regional development? Regional Studies, 47(7), 1034–1047. [Google Scholar] [CrossRef]
- Saint-Paul, G. (2003). Growth effects of nonproprietary innovation. Journal of the European Economic Association, 1, 429–439. [Google Scholar] [CrossRef]
- Salamon, L. M., & Anheier, H. K. (1997a). Defining the nonprofit sector: A cross-national analysis. Manchester University Press. [Google Scholar]
- Salamon, L. M., & Anheier, H. K. (1997b). The third sector in Europe: Five theses. International Journal of Voluntary and Nonprofit Organizations, 8, 109–122. [Google Scholar] [CrossRef]
- Salamon, L. M., & Sokolowski, S. W. (2014). The third sector in Europe: Towards a consensus conceptualization. TSI Working Paper Series No. 2. Third Sector Impact. [Google Scholar]
- Salamon, L. M., Sokolowski, S. W., & Haddock, M. A. (2014). The state of global civil society and volunteering. Johns Hopkins University. [Google Scholar]
- Sharpley, R., & Harrison, D. (2019). A research agenda for tourism and development: Elgar research agendas. Edward Elgar Publishing. [Google Scholar]
- Tan, E. K. B. (2013). Molding the nascent corporate social responsibility agenda in Singapore: Of pragmatism, soft regulation, and the economic imperative. Asian Journal of Business Ethics, 2, 185–204. [Google Scholar] [CrossRef]
- Tyler, J. (2014). Enabling, promoting and protecting the entrepreneur, philanthropist, entrepreneur-philanthropist, and the American way of life. In Handbook of research on entrepreneurs’ engagement in philanthropy: Perspectives. Edward Elgar Publishing. [Google Scholar]
- Vogt, C. P. (2002). Patronage and philanthropy in the early church: The transformation of piety. Cambridge University Press. [Google Scholar]
- Wirba, A. V. (2024). Corporate social responsibility (CSR): The role of government in promoting CSR. Journal of the Knowledge Economy, 15, 7428–7454. [Google Scholar] [CrossRef] [PubMed]
- Wooldridge, J. M. (2010). Econometric analysis of cross section and panel data. MIT Press. [Google Scholar]
- Zamagni, S. (2005a). Economia civile. Il Mulino. [Google Scholar]
- Zamagni, S. (2005b). Per una nuova teoria economica della cooperazione. Il Mulino. [Google Scholar]


Disclaimer/Publisher’s Note: The statements, opinions and data contained in all publications are solely those of the individual author(s) and contributor(s) and not of MDPI and/or the editor(s). MDPI and/or the editor(s) disclaim responsibility for any injury to people or property resulting from any ideas, methods, instructions or products referred to in the content. |
© 2025 by the authors. Licensee MDPI, Basel, Switzerland. This article is an open access article distributed under the terms and conditions of the Creative Commons Attribution (CC BY) license (https://creativecommons.org/licenses/by/4.0/).