Abstract
This study analyzes how sectoral stock volatility in the GCC region responds to global financial uncertainty shocks originating from the U.S. (CBOE VIX), Europe (VSTOXX-50), Bitcoin investors’ Sentiment Indices (BSI), and disaggregated global Financial Stress Indicators (FSI) by using both the “Frequency” and “Time” domain TVP-VAR based connectivity approaches. The “Time” and “Frequency” domain TVP-VAR results indicate that the Energy, Financials, Materials and REIT sectors experience the highest shock spillover from the U.S. and European equity market uncertainty (VIX and VSTOXX-50) for the overall and long-term investment horizons. Whereas, all the five disaggregated global financial stress indicators and BSI transmit higher shocks spillovers towards the sectoral stock conditional volatility of Energy and Materials sectors for the overall and long-term investment horizons. Furthermore, the “Frequency” domain TVP-VAR approach shows that overall shocks spillovers are higher in long-term and intensified during the COVID-19 period. The Energy, Materials, and REIT sectors’ high sensitivity to U.S.VIX and Euro.VSTOXX-50 shocks calls for sector-specific hedging—such as sectors remain least susceptibility to long-term U.S. and European equity risk shocks such as Utility. Over the long-term and overall investment horizons, the Energy and Material sectors’ position as the main shock recipient from all five global financial stress components and the BSI underscores its role as a volatility hub. Policymakers should enforce stress tests and capital buffers for energy and material focused firms, while proactive liquidity management and commodity hedging are vital during global financial stress and BSI spikes to limit funding and operational risks.
1. Introduction
The GCC financial systems experienced spillover effects during the 2008 global downturn despite limited exposure to subprime mortgages (Espinoza et al., 2013). B. Chen and Sun (2024) also classified that optimal portfolio divarication by including asset classes with imperfect correlation characteristics can improve portfolio optimization. The global credit market disruptions and funding restrictions also lead towards the financial asset devaluation and cause financial structural imbalances within the GCC financial system. Furthermore, GCC financial system is also exposed to the spillover of shocks from the U.S. and European financial systems because of the increased emerging economies’ financial integration with the developed financial systems The spread of contagion has intensified due to financial globalization. The domestic macroeconomic and financial variables, including trade and policy issues, influence the volatility of external shocks in developing countries (Shi & Wang, 2023). Through capital flows, financial openness can intensify these shocks. For example, Endri et al. (2024) discovered that, with the exception of China, Indonesia’s equities market had good short-term integration but weak long-term integration with significant partners. Oil volatility, geopolitical risk, trade policy uncertainty, and oil shock decomposition have been the primary subjects of research on GCC financial systems. External factors such as global Financial Stress Indicators (FSI), Bitcoin sentiment (BSI), European uncertainty (VSTOXX-50), and U.S. market uncertainty (VIX) have received less attention.
The stronger worldwide financial integration makes a persuasively strong motivation factor to explore the shock propagation from European and U.S. implied stock volatility (VSTOXX-50 and VIX) in both the temporal and frequency domains. Cross-border market turbulence swiftly erodes investor sentiment, slows growth, and erodes resilience. About 20% of worldwide output, energy consumption, and foreign investment, 10% of commerce, and one-third of international stock capitalization are all attributed to the United States. Likewise, the EU-GCC cooperation accounts for more than 50% of worldwide foreign direct investment, 17.5% of global commerce, and 20% of global GDP (European Commission, 2022). In 2024, the EU was the second-biggest trading accomplice of the GCC, accounting for 7.9% of GCC exports, 15.7% of imports, and 11.7% of goods trade (European Commission, 2025). With the help of €180 billion in EU investment stock, commerce reached €174 billion two years prior (European Union External Action Service, 2021). The volatility spillovers across border are further amplified within the EU by close trade, capital, and inflation ties (Baele, 2005).
One of the motivational factor for exploring the shock transmission from the global Financial Stress Indicators (FSI) towards the GCC sectoral stock volatility lies in the fact that credit constraints increase borrowing expenses, limit financing, and increase default risks, which exacerbate macroeconomic instability and worse stock performance (Gilchrist et al., 2009). Investors demand greater risk premiums and move to safer assets during times of stress, which lowers liquidity and stock prices (Tronzano, 2020). Lack of funding restricts company operations, exacerbates shocks to commodity prices, particularly in metals, and reduces profitability. Clustering of volatility exacerbates uncertainty, depresses mood, and puts pressure on stock prices. The GCC is still quite vulnerable to global financial crisis because of its reliance on hydrocarbons and fixed currency rates.
The motivational factor for exploring the shock absorption capability of GCC sectoral stock volatility from the Bitcoin investors’ fear and greed sentiment indices (BSI) is the region’s increasing interest in digital assets. The first cryptocurrency was authorized by Bahrain’s Sharia Review Board in 2021, and Ripple teamed up with Saudi Arabia’s National Commercial Bank to provide blockchain-based remittances. Bitcoin was considered possibly acceptable as “customary currency” in early discussions about Islamic banking (Mensi et al., 2020). Investors in the UAE made around $200 million from cryptocurrencies in 2023, which reflects this acceptability (Bandyopadhyay, 2024). While Bahrain’s central bank extended its 2019 digital asset laws by piloting JPMorgan’s block chain, Oman recognized Bitcoin under Islamic law and started $1.1 billion in mining activities to enhance variety (Zupan, 2021). Gambling, alcohol, and tobacco are among the prohibited businesses that cannot be included in investments in Islamic finance (Hasan et al., 2021). Similar to this, using cryptocurrencies is permissible as long as it is morally upright and devoid of fraud or speculation. Thus, this study investigates the relationship between volatility in GCC Islamic equities sectors and investor emotion toward Bitcoin, namely fear (loss aversion) and greed (profit-seeking). By making three original contributions to the body of existing literature, the current study enhances academic debate.
Firstly, previous research has mainly analyzed the predictive power of investor sentiment—such as cryptocurrency fear and greed indices—for forecasting crypto prices (Güler, 2023). Bouteska et al. (2022) showed that adding sentiment measures enhances return forecast accuracy. Ali et al. (2024) examined Sharia-compliant Bitcoin–equity links, while W. M. A. Ahmed (2021a) analyzed Bitcoin’s asymmetric volatility relative to Islamic stocks. Other works explored return interconnectedness between Bitcoin and developed markets like the U.S. (Nguyen, 2022) and G7 (L. Xu & Kinkyo, 2023). However, no study has yet assessed how Bitcoin investor fear (selling pressure) and greed (buying optimism) sentiment shocks transmit to GCC sectoral stock volatility across overall, short-, and long-term horizons.
Secondly, existing research mainly explores how shocks from U.S. economic conditions (Smales, 2020), trade policies, and climate policy uncertainties (Tedeschi et al., 2024) affect developed markets, with limited focus on how U.S. (VIX) and European (VSTOXX-50) uncertainties influence GCC sectoral volatility. Prior studies examined volatility transmission among the equity returns of U.S. and China (B. Chen & Sun, 2024), G20 (Naeem et al., 2024), and G7 (Lang et al., 2024), finding stronger interconnectedness during crises such as COVID-19, Brexit, and recessions. More recent work has addressed country-specific contexts for equity market shock transmission—e.g., Shen et al. (2022) on Chinese sectors and Iqbal et al. (2022) on European markets, showing how asset allocation can adjust to transmission patterns. Extending this logic, if U.S. or European instability disproportionately impacts certain GCC sectors, investors could mitigate risk through portfolio reallocation. However, no study has yet examined how shocks from the U.S. VIX and VSTOXX-50 transmit to GCC sectoral stock volatility across different frequency bands.
Thirdly, this study is the first to analyze how shocks from disaggregated global Financial Stress Indicators (FSI)—including “Credit” disruptions, “Equity Valuation,” “Funding” constraints, shifts to “Safe Assets,” and “Volatility” in global commodity, stock, and forex markets—affect GCC sectoral stock volatility. It employs a Time- and Frequency-domain TVP-VAR connectedness framework (Antonakakis et al., 2020; Chatziantoniou et al., 2023) to assess shock transmission across short-, medium-, and long-term horizons. Previous research has mainly used aggregated FSI to study spillovers in U.S., European, and developed markets (see Lang et al., 2024; He et al., 2021). An exception, Cipollini and Mikaliunaite (2020) examined European FSI and macroeconomic uncertainty but not sectoral effects in the GCC. No prior study has explored how disaggregated FSI shape GCC volatility. Stronger FSI spillovers can erode investor confidence, shift sentiment, and influence trading and investment strategies. The findings offer policymakers insights to anticipate and mitigate external shocks, supporting fiscal and monetary stability during global stress.
The remainder of the paper is organized as follows. Section 2 reviews the literature and theoretical background. Section 3 describes the data and methodology. Section 4 presents the results and their economic implications. Robustness checks and sensitivity analyses are conducted in Section 5. Section 6 discusses the findings in light of theoretical rationality and practical implications. Finally, Section 7 concludes the paper, highlighting limitations and suggesting directions for future research.
2. Literature Review and Economic Rationality
The literature review provides a theoretical framework for investigating the interactions between conditional volatility in GCC equities and disaggregated financial stress indicators (FSI), Bitcoin sentiment indices (BSI), and implied volatility measures from the U.S. (VIX) and Euro (VSTOXX-50) equity markets. It also summarizes earlier empirical studies to draw attention towards the research gaps.
2.1. The Spillover of Shock Propagation Towards the GCC Sectoral Stock Conditional Volatility from Global Financial Stress Indicators (FSI)1
Taking insights from the contagion theoretical perspective, investors’ willingness to invest in “safe heaven” asset classes due to the “flight-to-quality” phenomenon explains the excessive shock transmission from the U.S. and European financial uncertainty towards the GCC financial system. Investors’ sentiments played a contributory factor in transmitting the uncertainty shocks from U.S. and European financial markets. With the increase in risk premium in the developed financial systems, investors become more willing to invest in safe-haven financial asset classes and disinvesting in riskier financial asset classes of the emerging economies. Therefore, behavioral financial perspective and “guilt by association bias” also stated that investors during the financial recession extrapolate bearish conditions in the developed financial systems to all other emerging financial markets and because of this generalization, the volatility shock spillovers towards the emerging financial system increases. Therefore, building upon the capital shift amid financial recession and volatility shock transmission mechanism, GCC sectoral stock conditional volatility series experienced heightened shocks from FSI.
The liquidity constraints and margin calls are generally due to the increased financial stress in developed financial systems, whereas institutional investors take into account the short-term positioning in unconnected and uncorrelated asset classes. Even in markets that were not immediately impacted by the initial shock, such forced reductions in leverage result in synchronized increases in unpredictability throughout financial systems (Rösch & Kaserer, 2013). This is conceptually consistent with the liquidity spiral model proposed by Brunnermeier and Pedersen (2009), which holds that systemic instability and broad asset sell-offs result from funding limitations exacerbated by drops in market liquidity. Therefore, investors’ inability and unwillingness to hold risky asset classes, funding constraints, illiquidity and credit market disruptions in the wake of economic crisis lead towards the higher shock transmission towards the conditional volatility of the GCC sectoral stock returns.
The combined impact of commodity price volatility and financial market fragility, which both heighten investor reluctance and speculative behavior, results in a higher transmission of shocks from global financial stress indicators (FSI) to GCC sectoral stocks (Bouri et al., 2023). Resource-dependent industries are disproportionately impacted by global energy market instability, which is caused by shifts in demand-supply dynamics and general macroeconomic uncertainty (Bakas & Triantafyllou, 2020). Through portfolio reallocations and the increasing financialization of the energy industry, elevated financial stress exacerbates the volatility of commodities prices. Due to the GCC economies’ reliance on hydrocarbon exports, negative shocks intensify changes in the price of gas and oil, reducing sectoral competitiveness and causing instability in non-energy sectors. Increased global stress usually makes people less willing to take risks, which leads them to move away from developing financial markets’ stocks and into safe-haven investments. Additionally, hedging strategies, restrictions on cross-border capital flows, and reduced market liquidity can all contribute to these dynamics (Cavallaro & Cutrini, 2019). Unfavorable international circumstances can lead to capital outflows, reduced holdings, and local equities sell-offs, all of which exacerbate market volatility (Pavabutr & Yan, 2007). Reduced foreign inflows and liquidity constraints hence cause equity market devaluation and conditional volatility to rise in GCC markets during times of global financial crisis.
The majority of the existing literature focuses on economies outside of the GCC region and considers how shocks are transmitted from aggregated financial stress indices to financial asset classes (C. Liang et al., 2023; Apostolakis et al., 2021a; Hoque et al., 2024; Ilesanmi & Tewari, 2020; Y. Xu et al., 2023; Y. Liu & Wang, 2024). Such an approach, however, ignores the variety of sources of financial stress and their perhaps unique effects. Asset prices may be impacted by disaggregated stress components in quite varied ways, including disruptions to the “credit” market, “liquidity” constraints, higher investment positioning towards “safe-haven” assets, drops in “equities valuations”, and increased “volatility” in the global commodities, equity, and foreign exchange markets. Moreover, their impacts may change throughout short-, medium-, and long-term timeframes, reflecting variations in the rate and durability of shock transmission.
Y. Liu and Wang (2024) analyzed whether the shock transmission from aggregated measure of financial stress towards sustainable stock remain homogenous across different quantiles. Overall findings suggested that financial stress consistently had a large effect on green assets at all quantile levels. The potential predictive efficacy of aggregated financial stress variables for returns on the Chinese stock market was examined by Y. Xu et al. (2023). Their results show that these indices are better at describing market fluctuations during an upward trend than during a downward one. Furthermore, Apostolakis et al. (2021a) investigated the relationships among stock market dynamics in the G7 nations, financial stress, and oil market uncertainty. Changes in the level of uncertainty around the oil market have a substantial impact on financial stress in these wealthy countries. Similarly, C. Liang et al. (2023) analyses the response of equity markets due to the fluctuations in the composite financial stress indices. During the COVID-19 pandemic, the FSI demonstrated a remarkable capacity to predict the long-term realized volatility of stock markets.
According to study findings reported by Singh and Singh (2016), increasing financial stress is more likely to cause capital outflows and less likely to cause capital inflows in the Indian and American financial systems. Using the quantile dependent VAR technique, Hoque et al. (2024) examined the extent to which financial stress influences conditional risk in U.S. sectoral equities across higher and lower quantiles. They found that when bullish volatility is high, sectoral stocks are more susceptible to financial stress shocks than when volatility is moderate or median. In a related study, Ilesanmi and Tewari (2020) evaluated the impact of financial stress on investment and economic output in South Africa using a VAR framework. Their empirical results indicate that economic growth and capital formation are negatively impacted by elevated financial stress.
2.2. The Spillover of Shock Propagation Towards the GCC Sectoral Stock Conditional Volatility from Bitcoin Investors’ Fear and Greed Sentiment Indices (BSI)2
The digital currency adoption in the Gulf Cooperation Council (GCC) has exploded, with the region’s cryptocurrency market estimated to be worth USD 744.3 million in 2024 and expected to grow at a compound annual growth rate of 16.8% to reach USD 3.49 billion by 2033 (IMARC Group, 2024). The realized gains highlight the level of regional involvement; in 2023, investors taking positioning in Bitcoin investments in the United Arab Emirates made around USD 204 million in bitcoin profits, while Saudi investors made even more, USD 351 million (The National, 2024). With almost 70% of actual investment profits in the United Arab Emirates coming from Bitcoin, Ethereum comes in second with 24% and XRP comes in third (Gulf Insider, 2024). Bitcoin is still the most popular digital asset. With about USD 34 billion in inflows between July 2023 and June 2024—a 42% annual increase—the United Arab Emirates (UAE) has become the primary hub for crypto-related activity among the member nations (Mining Grid, 2024). With over half a million traders participating daily, of whom about 72% have a clear preference for Bitcoin, investor activity in the area is also growing (Bitget Research, 2024).
The shock transmission from BSI to sectoral stocks is theoretically consistent with cross-asset contagion processes in the setting of portfolio rebalancing (Kodres & Pritsker, 2002). Due to perceived wealth effects, positive shocks in the Bitcoin market might cause reallocations into stocks, but negative shocks cause “flight-to-safety” reactions that lower investment in developing market stocks. Furthermore, digital currencies and Islamic financial instruments are both becoming more widely acknowledged as vehicles for hedging and diversification, which implies that Bitcoin sentiment may be able to spread peculiar shocks throughout the GCC through risk-management choices and reallocation. Behavioral finance theory also emphasizes how trading psychology increases the spread of disruptions unique to cryptocurrencies. Markets with different macroeconomic structures may become interconnected through sentiment-driven channels due to investor overreactions, herd behavior, and uncertainty aversion (W. M. A. Ahmed, 2021a). Furthermore, significant depreciation in the Bitcoin prices lead towards the heightened fear amongst bitcoin investors and this would lead towards the anxiety and loss of confidence in the Bitcoin market. Therefore, a shock in the BSI lead towards the higher GCC sectoral stock volatility.
Building upon the behavioral financial theoretical approach, investor attitude played a contributory role as non-fundamental factor that impacts asset price. Abrupt sell-offs due to increased anxiety lead towards the volatility across inter-connected financial markets. Conversely, bitcoin investors’ fear and greed are frequently the driving forces behind speculating bubbles. Changes in shareholders’ attitude, as indicated by indices of fear and greed, are anticipated to result in equity markets’ shock spillovers because of Bitcoin’s substantial involvement in GCC investment portfolios and its impact on wealth effects. Thus, GCC sectoral stock conditional volatility’s shock spillover absorption capability may be exacerbated by both macroeconomic variables and shifts in investor sentiment brought on by cryptocurrencies. According to W. M. A. Ahmed (2021b), psychological makeup of investors is crucial in facilitating the introduction of shocks unique to Bitcoin into the stock market. Economies with different economic and structural characteristics may monetarily integrate through emotional channels. For example, BSI depreciation may have caused bitcoin investors to experience extreme emotional stress, which would erode their sense of security and raise their risk perceptions. This implies that the mood dynamics around Bitcoin may have a substantial impact on conditional volatility in GCC sectoral equities. This demonstrates how emotion contagion might have caused local financial systems to become unbalanced. Consequently, changes in attitudes toward Bitcoin have a direct impact on risk appetite throughout financial asset classes; severe pessimism leads to large liquidations, while excessive optimism encourages speculative accumulation. When cryptocurrency prices are unclear, investors tend to minimize their exposure to riskier assets, including GCC stocks, which makes conditional volatility in these markets worse (W. M. A. Ahmed, 2021b).
Interestingly, no research has examined the impact of Bitcoin investors’ fear and greed sentiment related shocks on the conditional volatility of GCC sectoral stocks from a variety of investment horizons, including lower- and higher-frequency bands. Aside from the aforementioned facts, previous empirical research has mostly focused on the spillover of shocks from Bitcoin returns to different financial asset classes (S. Li, 2022; P. Liu & Yuan, 2024; Guo & Zhong, 2025; Bazán-Palomino, 2023; Younis et al., 2025; Jia et al., 2024; Khalfaoui et al., 2023). However, little focus has been placed on investigating the shock transmission from Bitcoin Investor Sentiment Indices (BSI), specifically fear and greed measures, on equity market volatility. This distinction is crucial because, whereas sentiment-based shocks represent behavioral and psychological phenomena that can impact trading activity beyond basic valuation movements, return-based shocks capture changes induced by actual market performance.
In a comparable manner, P. Liu and Yuan (2024) used TVP-VAR domain shock spillover technique to evaluate Bitcoin’s hedging potential against foreign exchange and other financial asset classes. Their investigation found that Bitcoin served as an oasis of security investment during times of severe financial crises and decreased long-term investment risks in the currency and equities markets. Guo and Zhong (2025) investigated the relationships and shock spillovers between various cryptocurrencies and traditional financial asset classes for the purpose of investigating whether they enhance investment portfolios’ capacity to mitigate financial market risks. The empirical findings demonstrate the superior hedging capabilities of cryptocurrencies, especially with regard to stock market exposures. Using the VAR-BEK-GARCH (1,1) approach, S. Li (2022) examined the dynamic relationships between meme stock risks and cryptocurrencies. According to the findings, Bitcoin’s negative volatility shocks had a greater and more substantial effect on meme stocks.
More recently, the transmission of volatility shocks between Bitcoin and stocks markets was studied by Bazán-Palomino (2023) in Europe, the US, and Asia-Pacific. The findings indicated that although Bitcoin’s long-term influence on the majority of Asia-Pacific economies remained substantial, its influence gradually diminished in North America and a few European countries. Similar to this, Younis et al. (2025) examined whether GCC economies have more spillover effects from Bitcoin’s volatility using the Diebold and Yilmaz (2012) connection approach inside a GVAR framework. The results indicated that while Bitcoin-induced volatility spikes mostly traveled to Qatar, Kuwait, and Oman, both Saudi Arabia and the United States were the primary providers of shocks to all other markets, albeit with larger magnitude and intensity. Khalfaoui et al. (2023) analyzed the asymmetrical quantile-based interactions between returns on conventional (non-Sharia) and Sharia-compliant stocks in BRICS nations and cryptocurrencies. The results showed that different quantiles exhibited unique patterns of shock transmission, which intensify during times of severe market circumstances. Bazán-Palomino (2023) examined the transmission of volatility shocks between Bitcoin and stock markets using data from Europe, the US, and Asia-Pacific. In 2024, Jia et al. carried out a similar examination of the connections between Bitcoin and a number of financial asset classes. Significant relationships between Bitcoin and international stock markets were discovered by their analysis, suggesting that Bitcoin might be a helpful tool for foreign investors looking to diversify and hedge against risk.
2.3. The Spillover of Shock Transmission Towards the GCC Sectoral Stock Conditional Volatility from U.S. and European Financial Market Uncertainty (U.S. CBOE VIX and Euro VSTOXX-50)
According to Balli et al. (2021), economies that have weaker fiscal systems, high levels of financial openness, and close commercial ties to developed markets are more susceptible to the uncertainty that is transferred from U.S. markets. Compared to realized volatility or model-based measures, volatility indices like the VIX and VSTOXX integrate more thorough information and function as forward-looking assessments of market expectations. These impacts are strengthened by the United States’ worldwide position, which in 2017 constituted an integral position within the international portfolio assets and continued to be a major source of foreign direct investment (Balli et al., 2021). As a result, shocks that start in the U.S. and European markets have a greater impact on global equities systems, including the GCC’s (Smales, 2020). Therefore, from the perspective of behavioral finance, periods of increased global stress, especially during spikes in the level of uncertainty in the U.S. and European equities markets as indicated by the VIX and VSTOXX, often lead to extensive sell-offs by foreign investors (Yadav et al., 2023). Even in the absence of unfavorable regional shocks, this trend is true for GCC stocks. Herding behavior, which occurs when traders mimic the tactics of others in such situations, is a phenomenon that increases the transmission of volatility shocks from financial stress indicators (FSIs) such as VIX, VSTOXX, and others to GCC sectoral equities markets (Kirimhan et al., 2024). As part of larger risk management strategies, institutional investors also help by adjusting their international portfolios and usually reducing their exposure to GCC assets. This procedure increases the GCC’s absorption of external volatility.
Äijö (2008) assessed the degree of equity market integration by examining the term structure of implied volatility across German, Swiss, and Pan-European blue-chip companies represented by the VSTOXX-50. Y.-J. Zhang et al. (2017) looked more closely at the role that the VIX and VSTOXX, two volatility indexes used in the United States and Europe, play in causing disruptions to global commodities markets. A risk-neutral, model-free benchmark, the Chicago Board Options Exchange Volatility Index (VIX) gauges market expectations of stock price movements over a 30-day period (Wu et al., 2023). As a measure of investor mood, the VIX is an implied volatility indicator; high values are frequently linked to heightened pessimism and downward pressure on asset prices (B. Chen & Sun, 2022).
Increased volatility in the U.S. financial markets (CBOE VIX) or the European financial markets (VSTOXX-50) encourages foreign investors to reevaluate their expected risk-return trade-off in the context of risk premia adjustment. As GCC financial institutions expand their connections to global capital markets, these reevaluations are mirrored in shifts in regional equity risk premia. Another perspective is offered by the contagion mechanism, which shows how volatility disturbances initiated in developed financial system spread throughout the global financial system (Longstaff, 2010). This process is accelerated by international portfolio reconfiguration, which causes sell-offs in GCC markets as investors shift their funds from riskier assets like GCC stocks to more conventional safe havens like US Treasuries and precious metals. The fundamental tenets of the asset pricing theoretical approach emphasize that taking on systematic risk is outweighed by expected returns, which are often reflected by implied volatility indexes such as the VIX and VSTOXX-50 as well as more broad indications of established financial market uncertainty indicators. Strong evidence of volatility spillovers has been presented by empirical research employing conditional correlation frameworks and regime-switching models; shocks originating in the United States and Europe have a particularly significant impact on regional and global markets (Baele, 2005). Together, these findings imply that through interrelated pathways of risk repricing, contagion, and portfolio rebalancing, financial turmoil in the United States and Europe, exacerbated by global financial stress indicators, can considerably increase conditional volatility in GCC sectoral equities. For instance, the historical evidence supports the idea that systemic financial recessions, such as the subprime mortgage crisis of 2007, European debt crisis of 2012 and the failure of Lehman Brothers in 2008, quickly intensified into a global recession with significant cross-market effects. Similar to this, during periods of significant shocks, periods of intense stock market volatility usually have an impact on whole financial systems. According to Bekaert et al. (2005), contagion is theoretically defined as “excessive correlation,” which denotes atypical cross-market co-movements during crises.
The literature on the transmission of shocks from the implied volatility of the U.S. and European equity markets into the GCC financial system, however, is still noticeably lacking, especially when examined across a variety of frequency horizons. It is important to address this gap because doing so would help investors and policymakers create resilience plans for the sectors markets of the GCC in a variety of market scenarios. It will also improve our knowledge of cross-regional volatility links. For instance, previous research has predominantly concentrated on the ways in which trade, climate, and macroeconomic disruptions originating in the U.S. financial system cascade into financial asset classes (Tedeschi et al., 2024; D. Li et al., 2022). Much of this work has examined volatility and shock spillovers from international equity market disturbances to the African financial system (Dankwah et al., 2025), from the U.S. to the Asia–Pacific region (Cheng et al., 2024), among the G7 economies (Akhtaruzzaman et al., 2021b), between the U.S. and China (Y. Zhang & Mao, 2022), and from European sectoral equities to commodity-linked asset classes (Cheng et al., 2024).
In a related study, X. Chen et al. (2024) examined the transmission channels between the commodities and equity markets using Diebold and Yilmaz’s (2012) conventional connectedness model. It also examined the role of the VIX as a key determinant of the overall interdependence of the financial and commodity markets. The findings demonstrated that the moderating influence of the VIX on the connections between commodities and financial markets depends on the prevailing investment regime. Dankwah et al. (2025) investigated the transmission of shocks from global equities returns to developing markets in African nations using a connection paradigm based on Quantile Vector Auto-regression (QVAR). According to their results, there are better connections between the African financial system and traditional asset classes; however, the degree of these connections varies depending on the state of the stock market. Using the QVAR connection technique, Cheng et al. (2024) also examined asymmetric shock spillovers in the quantile domain among traditional asset classes in Asia, the US, and Europe. The findings showed that the Asian-Pacific financial system is more impacted by the returns of European and American equities, and that these impacts are more noticeable when the market is volatile. Additionally, using the framework of financial contagion theory, Akhtaruzzaman et al. (2021b) investigated the interdependencies between the financial markets of China and the G7. Their results showed that during the pandemic, correlations between financial-sector companies increased significantly, highlighting their crucial role in promoting the spread of market disruptions. Similarly, Y. Zhang and Mao (2022) used the spillover of shock methodology introduced by Diebold and Yilmaz (2012) to study shock propagation between developed and emerging equities markets, specifically the US and China. They found that the American financial system was more affected by Chinese shocks, a phenomenon exacerbated by the COVID-19 pandemic.
3. Data and Methodology
3.1. Data
This study investigates how shocks from BSI, U.S. and European financial markets’ uncertainty indices (CBOE VIX and VSTOXX-50) and FSIs influence the conditional volatility of GCC Islamic sectoral equities—specifically Industrials (IND), Health Care (HC), Real Estate (RE), Consumer Staples (CS), Financials (FIN), Energy (ENE), Telecommunication (TEL), Utilities (UTI) and Materials (MAT)—using daily data from 1 February 2018, to 1 January 2025. The Islamic sectoral stocks are taken into account because of the fact that Sharia-compliant financial system’s resilience during the 2008–09 financial crisis and its outperformance of conventional equity markets have strengthened investor demand for Sharia-compliant products, which prohibit interest and operate on profit-and-loss sharing principles. Whereas, the daily time series data on GCC sectoral stocks are incorporated from https://www.spglobal.com/en (accessed on 1 January 2025). U.S. equity market uncertainty conditions captured through the CBOE Volatility Index (VIX), representing S&P 500 volatility. Data on CBOE VIX and European VSTOXX-50 were sourced from the Federal Reserve Economic Data (https://fred.stlouisfed.org/ (accessed on 1 January 2025)) and www.investing.com (accessed on 1 January 2025) from 1 February 2018, to 1 January 2025. For the European market, the VSTOXX-50 index is employed to reflect anticipated volatility in Eurozone equities. While the VIX serves as a global equity market risk gauge, the VSTOXX specifically captures Eurozone equity market uncertainty (Sarwar, 2023).
To further assess the role of global financial stress, we incorporate disaggregated daily Financial Stress Index (FSI) measures—obtained from the U.S. Department of Treasury—which include “credit” market disruptions, “funding” pressures, equity, forex and commodity “volatility”, reduced “equity valuation” capacity, and a shift toward “safe-haven” assets. The daily data for the components of the Financial Stress Index (FSI) spanning the period from 1 February 2018, to 1 January 2025, were obtained from the U.S. Office of Financial Research’s publicly accessible database (available at https://www.financialresearch.gov/financial-stress-index/ (accessed on 1 January 2025)).
As an indication of global equity market risk, Dutta (2018) used the U.S. CBOE VIX in an ARDL modeling framework to examine the connection between the performance of U.S. energy sector stocks and the unpredictability of the global oil market. As a measure of investor emotion and expectations for future market circumstances, the VIX has been validated by Q. Zhang et al. (2024) as a crucial indicator of market uncertainty in the United States. Additionally, Sarwar (2023) demonstrated that the CBOE-VIX and its European equivalent, the VSTOXX-50, modify the dynamic conditional correlations between the financial markets of the United States and Europe and function as indicators of stock market uncertainty.
A popular tool for assessing the mood of the cryptocurrency market and predicting price patterns is the Bitcoin Fear and Greed Sentiment Index (BSI). It compiles metrics including price momentum, social media sentiment, market momentum, volatility, and Bitcoin dominance. DataStream provided daily data from 1 February 2018, until 1 January 2025 (https://www.lseg.com/en (accessed on 1 January 2025)). Similarly, Mokni et al. (2022) used a quantile regression framework to evaluate their capacity to predict Bitcoin returns during the COVID-19 crisis, while Gaies et al. (2023) employed them to predict Bitcoin price movements using daily observations from 2018 to 2020.
In order to create a harmonized dataset appropriate for thorough econometric analysis, daily records for sectoral stock conditional volatilities, stress indices, sentiment measures related to cryptocurrencies, and implied volatility indicators were methodically linked with their corresponding calendar dates using VLOOKUP. Previous studies have also looked at the transmission patterns connecting the VIX to different commodities asset classes and the spread of shocks from composite measures of financial stress indices to equities markets (Le et al., 2021). Additionally, a smaller body of research has examined the relationship between U.S. stock markets and mood indices measuring fear and greed among Bitcoin investors, using a similar data alignment approach to guarantee temporal consistency. This study used Excel’s VLOOKUP feature to combine and align data from a variety of sources, such as financial stress indicators (FSI), the CBOE VIX, VSTOXX-50, BSI, and GCC sectoral stocks. The rationale for this approach is rooted in the fundamental need in time-series econometrics that models such as the TVP-VAR employ uniformly synchronized datasets, in which every variable is denoted by an identical temporal index. Without such synchronization, the estimation of dynamic linkages and shock transmission mechanisms would be susceptible to distortion, since misaligned observations introduce spurious inconsistencies and compromise the reliability of the findings.
Following the 2008 global financial crisis, Islamic finance had a considerable expansion on a global scale, reaching a valuation of $2.19 trillion by 2018 (Raouf & Ahmed, 2022). Islamic banks played a crucial role in shaping the region’s financial environment, as seen by the over $490 billion in assets they held in the GCC alone by the middle of 2013 (Aliani et al., 2022). The current study uses a Student’s t-copula structure in conjunction with a univariate EGARCH (1,1) model to describe the daily dynamics of conditional volatility in Sharia-compliant sectoral stocks across GCC markets. With a combined market value of over $8 trillion, companies listed on GCC stock exchanges establish the area as a major contributor to the MSCI Emerging Markets Index (Al-Fayoumi et al., 2023). According to projections, the economies of the GCC are expected to grow at an annualized rate of around 7%, following development paths like to those seen in fast emerging countries like China and India (Bouri et al., 2023). The EGARCH (1,1) approach’s mean and variance equation can be expressed as
In the above Equation (1a), and are characterized as return series at a time t and conditional mean, respectively. Whereas, is the return innovation (shock). is the standardized error term, typically assumed with mean 0 and variance 1 (e.g., Normal or Student’s t). Furthermore, the variance equation of the EGARCH (1,1) can be written as
In the specified Equation (1b), ω represents the constant component that determines the unconditional or long-term average level of volatility. The coefficient β denotes the persistence parameter, reflecting the degree to which previous volatility continues to influence current conditional volatility (). A higher estimated value of β suggests that shocks to volatility dissipate more slowly, thereby enhancing persistence. The parameter α captures the magnitude effect, indicating the sensitivity of volatility to the size of market shocks (measured through absolute returns). A positive α suggests that larger shocks translate into heightened future volatility. The coefficient γ embodies the asymmetry, often referred to as the leverage effect, assessing whether negative innovations ( < 0) exert a different impact on volatility compared to positive ones of equal magnitude. When γ < 0, negative shocks intensify volatility more strongly than comparable positive shocks, whereas γ > 0 implies the reverse, with positive shocks exerting greater influence. In contrast, Bouri et al. (2023) employed models from the GARCH family to assess the conditional risk dynamics of sector-specific equities in the GCC region and to investigate how extreme shocks are transmitted between oil-related implied volatility and the volatility of GCC sectoral stock markets.
3.2. Methodology3
3.2.1. The “Time” Domain Connectivity Approach Based upon the TVP-VAR Method by Antonakakis et al. (2020)
This study adopts the Time-Varying Parameter Vector Autoregressive (TVP-VAR) framework with a 20-step-ahead forecasting horizon to examine the spillover dynamics of shocks originating from U.S. and European financial market uncertainty—captured through the VIX and VSTOXX-50 indices—as well as from disaggregated Financial Stress Indicators (FSIs) and Bitcoin Investors’ Fear and Greed Sentiment Index (BSI) in predicting the 20-day-ahead conditional volatility of GCC sectoral equities. Within the existing body of research, Chatziantoniou and Gabauer (2021) investigated the dynamic transmission of shocks between interest rate swaps and monetary policy uncertainty by employing a similar 20-step-ahead predictive horizon coupled with a 200-day rolling window. The same forecasting horizon was used by Balcilar et al. (2021) to investigate the processes of shock transmission between the commodities market and oil futures prices using the TVP-VAR approach. Furthermore, Antonakakis et al. (2020), who looked at the changing interdependencies within foreign currency markets, used a methodological approach that is consistent with the 200-day rolling timeframe chosen for this research.
In order to ensure steady and effective parameter evolution across time, the Time-Varying Parameter Vector Autoregressive (TVP-VAR) model is estimated using a Bayesian framework and informative shrinkage priors. In particular, the model uses a “BayesPrior” specification, which assumes that the variance–covariance matrix and the coefficients follow random walk processes with innovations that are normally distributed. The hyper-parameters = 0.99 and = 0.96 determine the degree of smoothness in these time-varying parameters. The autoregressive coefficients have greater persistence when is larger, suggesting that they develop gradually and represent slow structural changes in the data. In contrast, the error covariance matrix’s adaptability is controlled by , which permits a considerable amount of flexibility in volatility dynamics. By avoiding overfitting and guaranteeing that parameter modifications maintain their economic significance, this Bayesian prior structure successfully strikes a compromise between model flexibility and parsimony. These previous arrangements have been frequently utilized in the empirical literature (e.g., Koop & Korobilis, 2014; Antonakakis et al., 2020) for modeling dynamic spillovers and uncertainty transmission across financial markets because they provide a dependable way of capturing changing interdependencies while maintaining numerical stability in estimation.
The connectivity technique of Diebold and Yilmaz (2012) is extremely susceptible to the arbitrary choice of the rolling-window dimensions, whereas the TVP-VAR methodology employs a multivariate variant of the conventional Kalman filter for estimating parameter values. Consequently, providing flexibility without the chance of losing observations when dealing with small datasets (Harvey et al., 1992). Furthermore, according to Balcilar et al. (2021), the spillover index estimated through the TVP-VAR connectivity approach show a high degree of robustness against outliers. This technique combines the methodology of Koop and Korobilis (2014) with the connection concept of Diebold and Yilmaz (2012). We use a TVP-VAR model with a lag order of 1 that was chosen using the Bayesian Information Criterion (BIC).
Let and represent K × K matrices, while , , and are K × 1 vectors. Although is a × matrix, both vec () and are vectors. Over time, the parameters () change, affecting the relationships among the series. The matrices of the variance-covariance and also vary over time (Balcilar et al., 2021). The Wold representation theorem is employed to transform the TVP-VAR model into a TVP-VMA model. The equation is presented, with = as the initial condition. Here, represents a vector of white noise shocks with a symmetric yet non-orthogonal time-varying covariance matrix () = . Consequently, the forecast error for H steps can be expressed as follows:
with error co-variance matrix as:
The framework is built upon the “H-step” ahead “generalized forecast error variance decomposition” (GFEVD) approach developed by Koop et al. (1996) and Pesaran and Shin (1998). The (scaled) GFEVD, denoted as , signifies the impact of a disruption in variable j on variable i, formally defined as:
In the scenario described, where is a K × 1 vector mostly zeros with a single one at the position, and denotes the reduction in error variance of variable i due to shocks in variable j over an H-step interval. Diebold and Yilmaz (2012) proposed a normalization approach to address the issue that does not equal 1. This involves dividing each value by the sum of its respective row, yielding the generalized spillover table . The key to spillover summary metrics is this table, which captures directional “FROM” connectivity (impact of other variables j on i) and “TO” connectivity (how shocks in i affect j). These spillovers can be expressed as:
The “NET” directional spillovers can be estimated as
Antonakakis et al. (2020) characterize the total connectedness indices (TCI) as the aggregate proportion of forecast error variance decomposition arising from the shock transmissions throughout the entire VAR network. This can be expressed as
In addition to the quantitative representation of TCI described earlier, another measure known as the “net pairwise dynamic connectedness” can be defined as: .
3.2.2. The “Frequency” Domain TVP-VAR Approach by Chatziantoniou et al. (2023)
From the overall transmission of shocks from the global uncertainty factors towards the GCC sectoral stock volatility, we now shift our focus to examining the interconnectedness in the frequency domain, specifically investigating the transmission of the short- and long-term shocks across the variables. This analysis employs the (Stiassny, 1996) spectral decomposition method, facilitating an exploration of interconnection as elucidated by Chatziantoniou et al. (2023). Chatziantoniou et al. (2023) examine the spectral density of variable at frequency ω using the equation , where “i” represents the imaginary unit (√−1) and ω denotes the frequency. The Fourier transformation of the TVP-VMA (∞∞) model is employed to define the spectral density in this context
Spectral density is included in the framework of the GFEVD incorporating frequency analysis. Normalizing the frequency-based GFEVD is crucial, and the methods employed here are similar to those used in the temporal analysis. The following is one way to express this normalization:
“” in this context indicates the spectral component of the variable associated with a shock in the variable at the certain frequency ‘ω.’ This metric represents the correlation at a specific frequency. To explore connections across the diverse time periods encompassing multiple frequencies, we aggregate all frequencies within a designated interval ‘d’ represented as (a, b), where ‘a’ and ‘b’ fall within the range (−π, π) with ‘a’ being less than ‘b’. Thus, expressing this as d = (a, b): a, b ∈ (−π, π), a < b encapsulates this concept effectively.
Hence, the directional spillover of shocks, i.e., TO, FROM and NPDC can be written as , and , respectively. However, the total connectedness indices (TCI) can be written as . Moreover, the NET spillover of shocks can be written as = .
All these measures provide particular information about the assigned frequency range, but none provides an exhaustive analysis of the total effect at all frequencies. In order to overcome this constraint, Baruník and Křehlík (2018) provide an approach wherein the impact of measurements for every frequency band ‘d’ is proportionately weighed in relation to the whole system. As stated by Chatziantoniou et al. (2023), the weighing, represented as Γ(d), is calculated by dividing the total number of variables ‘N’ in the system by the combined value of all “” values inside the frequency band.
Consequently, the directional transmission (TO), reception (FROM), and NET spillover of shocks can be expressed as and , respectively. Additionally, the total connectedness indices (TCI) can be written as . The net spillover of shocks can be reformulated as: . Finally, the directional “TO”, “FROM”, “NET” as well as ‘Total Connectedness Indices” and “Net Pairwise Directional Connectedness” (NPDC) in the frequency domain based on TVP-VAR can be articulated as
Furthermore, in the present study, the endogeneity issue is mitigated both econometrically and conceptually due to the following reasons. First, as the wavelet framework separates co-movements and causality patterns at different scales rather than depending on a single aggregated time-series process, this time–frequency decomposition naturally overcomes simultaneity bias. The framework lessens the possibility that estimated spillovers are caused by current shocks or feedback loops by distinguishing low-frequency (long-term) cycles reflecting structural interdependence from high-frequency (short-term) co-movements, which are usually dominated by market noise and instantaneous reactions (Chatziantoniou et al., 2023). In order to mitigate reverse causality, the model captures directional transmission instead of contemporaneous correlation. The transmission of shocks from Bitcoin to equity markets, for example, was examined by Khalfaoui et al. (2022) using a VAR-based connectivity approach. They found no evidence of simultaneity bias or reverse causality, indicating that endogeneity problems were not a significant worry in their model. By using a time-varying parameter VAR (TVP-VAR) connectivity framework, Shahbaz et al. (2024) also observed how financial stress shocks spread to industrial metals. Additionally, their results supported the directional and time-dependent characteristics of spillovers, which naturally reduces the likelihood of endogenous feedback effects.
Secondly, from a theoretical standpoint, endogeneity is not a major issue in the current TVP-VAR methodological approach. This is because of the fact that the flow of uncertainty and sentiment-driven shocks follows an asymmetric and unidirectional pattern, impending from global indicators like the BSI and FSI as well as prominent financial systems, mainly the U.S. and European markets, toward relatively emerging or regionally integrated markets like those in the GCC. In the global volatility network, GCC equities markets mostly act as price takers due to their lower market size and relative lack of financial openness (Alotaibi & Mishra, 2015). The GCC is positioned as a net receiver or absorber of such disruptions, as evidenced by Haddad et al. (2020), who show that shocks that originate in advanced economies are conveyed to developing markets with higher power and persistence. Similarly, a unidirectional spillover from aggregated global financial stress indices toward stock returns across a variety of economies is documented by Soltani and Abbes (2025). Furthermore, Alotaibi and Mishra (2015) underlined that the main factors influencing GCC stock returns are the shocks from the United States and Saudi Arabia. Thus, from an economic perspective, it is still unlikely that shifts in GCC sectoral volatility would have a significant feedback effect on global benchmarks such as the VIX, VSTOXX-50, or BSI.
Thirdly, the empirical findings from earlier research also show how resilient the TVP-VAR-based connectedness technique is in identifying shock propagation processes across financial asset classes (Kapar et al., 2024) without introducing problems with endogeneity. The unidirectional and time-dependent spillover effects that are repeatedly shown in these research suggest that the TVP-VAR paradigm places inherent limitations on the emergence of simultaneity or feedback problems. Overall, we show that the VAR and TVP-VAR connectivity methods provide a robust and robust way to describe dynamic interdependencies in financial and commodities market evaluations while efficiently preventing endogeneity issues. Furthermore, the time-varying parameter vector autoregressive (TVP-VAR) approach utilized in this study proficiently handles possible dynamic endogeneity by allowing model parameters to vary uninterruptedly over time. The TVP-VAR configuration, in divergence to conventional static VAR or OLS stipulations, accounts for structural breakdowns, regime transitions, and shifts in market subtleties by capturing the evolutionary nature of interlinkages among variables (Balcilar et al., 2021). The TVP-VAR model, a well-liked econometric technique for proving directional spillovers and reducing simultaneity bias, identifies time-varying lead-lag correlations by integrating each series’ lagged interactions with its own and other variables’ prior values.
4. Results
4.1. Descriptive Statistics
Table 1a presents a summary of key descriptive statistics associated to various uncertainty indicators, including indicators of financial stress, market volatility indices for the European financial system (VSTOXX-50) and United States (CBOE-VIX), as well as the sentiment index reflecting Bitcoin investors’ fear and greed levels. On the other hand, the conditional volatility descriptive data for the different GCC stock market sectors are shown in Table 1b. The “Volatility” component, which represents volatile fluctuations in the stock, foreign currency, and commodity markets, has the most variability among the five examined global financial stress indicators, with a standard deviation of 1.183. Standard deviations of 0.50 and 0.40 are comparatively high for the “Credit” stress indicator, which represents market tension from expanding spreads, and the “Equity Valuation” component, which indicates investors’ risk aversion. The CBOE-VIX and VSTOXX-50 indexes have average values of 19.88 and 20.24, respectively, with standard deviations of 7.61 and 7.82, according to Table 1a. These numbers exceed those linked to the Financial Stress Index (FSI). Significant excess kurtosis is seen in both the European and American uncertainty indicators (VSTOXX-50 and VIX), indicating leptokurtic distributions with extreme values. This statistical data suggests that industrialized economies are experiencing increasingly frequent and severe bouts of market volatility, which might have an impact on financially linked nations like the GCC. Furthermore, with a standard deviation of 21.97, the Bitcoin Fear and Greed Sentiment Index exhibits a significant amount of unpredictability. This broad range suggests that although times of anxiety tend to cause panic selling and sharp drops in asset values, times of increased investor confidence frequently result in speculative spikes and overpriced markets.

Table 1.
(a). Descriptive statistics for the global uncertainty factors. (b) Descriptive statistics for the GCC sectoral stock conditional volatility.
The disaggregated measures of financial distress indicators reveal a pronounced escalation, as illustrated in Figure 1a–c. The onset of the COVID-19 pandemic, among various economic disruptions, triggered breakdowns in supply-chain networks, limitations on mobility, and a decline in domestic household expenditure. Consequently, apprehensions regarding corporate sustainability and the direction of the post-crisis economic rebound intensified (Kapar et al., 2024). This heightened ambiguity prompted market participants to re-evaluate asset risks and valuations, thereby amplifying turbulence across international financial systems (Rahman et al., 2021). Specifically, Figure 1b highlights a substantial surge in the VSTOXX-50 index during 2020 and 2021. The CBOE-VIX and VSTOXX-50 indices show a significant increase in market uncertainty in both the U.S. and European stock markets during the COVID-19 pandemic. Strict lockdowns and economic limitations imposed throughout Europe in reaction to the epidemic are mostly to blame for this increase. Major European market indexes, such as the UK’s FTSE 100, France’s CAC 40, and Germany’s DAX, also had significant corrections at this time. Furthermore, while new trade agreements and regulatory reforms altered Europe’s financial landscape and affected overall equities performance, the end of Brexit at the end of 2020 added more layers of uncertainty. The attitude of Bitcoin investors also declined throughout the epidemic, as seen in Figure 1c, with anxiety levels increasing as sentiment indexes declined. Additionally, this encourages us to investigate the time-varying shock spillovers across various frequency wavelengths between the GCC financial system and FSI, BSI, and U.S. and European financial market uncertainty (VIX, VSTOXX-50) during COVID-19.
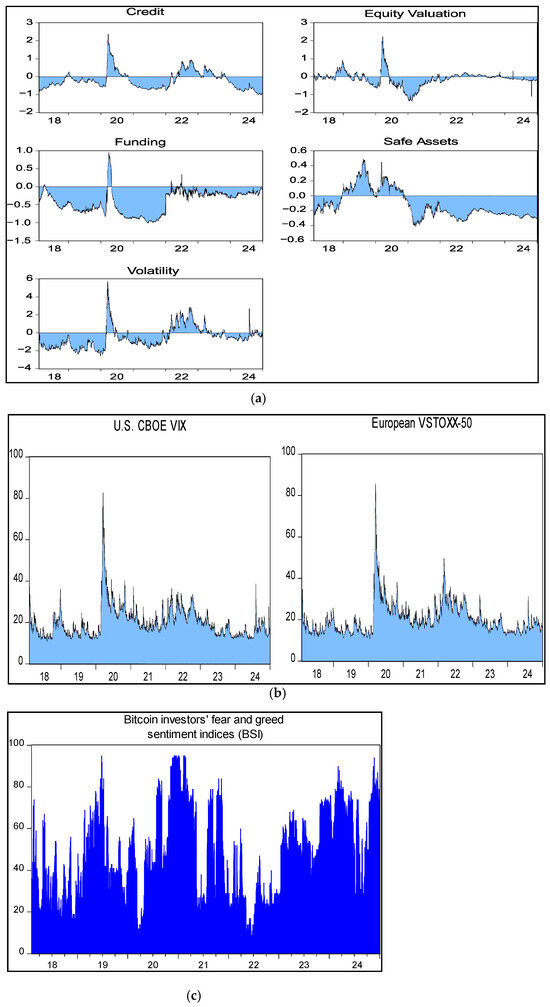
Figure 1.
(a): Graphical representation of the disaggregated global financial stress indicators (FSI). (b): U.S. and European financial market uncertainty indices. (c): The Bitcoin investors’ fear and greed Sentiment Indices (BSI).
Table 1b presents the performance metrics for GCC sectoral equities, showing that Energy and Utility sectors recorded the highest average conditional volatility of 0.0162 and 0.0196, respectively, followed by Health Care (0.0167), Industries (0.092) and Financials (0.0135). The Energy sector exhibited the largest standard deviation of conditional volatility (0.0074), with Utility (0.0065) and Materials (0.1447) also displaying relatively high variability, reflecting greater return instability and elevated uncertainty. As illustrated in Figure 2, volatility levels across most GCC sectors intensified during distinct phases, notably in 2018–2019, throughout the COVID-19 pandemic, and in the post-pandemic period (2021–2022). The transnational portfolio modifications, cross-market capital flows, and shifts in investor sentiment are some of the ways that external shocks can spread across emerging economies like the GCC. Furthermore, during the COVID-19 epidemic, the conditional volatility across GCC stock sectors was increasing concurrently with global uncertainty indices like the VIX, VSTOXX-50, and the Bitcoin Sentiment Index (BSI) (see Figure 1a–c and Figure 2). This tendency makes sense given the complex linkages that characterize the contemporary global financial system (Voronkova, 2004). In big, sophisticated economies like the US or Europe, the effects of greater uncertainty often cut across national borders. Increased investor fear and a general flight from riskier assets were the causes of the sharp spikes in volatility that were seen during the pandemic (Akhtaruzzaman et al., 2021a). These moves probably had an impact on GCC stock markets as investors sought safety, causing local players to respond to both domestic and international turmoil, which in turn amplified sectoral performance changes. The idea of volatility spillover, which postulates that shocks originating in dominant financial centers can easily impact markets that differ geographically and structurally, is consistent with the apparent co-movement between GCC market volatility and key global uncertainty measures (Yousaf et al., 2022).
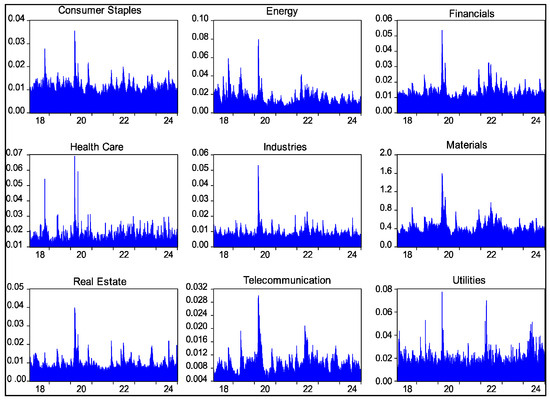
Figure 2.
The graphical representation of the GCC sectoral stock conditional volatility series.
4.2. The “Time” and “Frequency” Domain Shock Spillovers from Uncertainty Factors Towards the Equity Market Conditional Volatility
Table 2 reports the aggregated “time-domain” values of forecast error variances, capturing the overall spillover effects between GCC equity market conditional volatility and BSI, VIX, FSI, and VSTOXX-50. Table 3 presents the frequency-domain spillovers, revealing heterogeneous shock transmission patterns across low- and high-frequency bands, corresponding to long- and short-term investment horizons. Figure 2 provides a graphical representation of the time-varying spillover dynamics, illustrating both the aggregate (time-domain) effects and the frequency-specific transmission patterns for different investment periods (long- and short-term).
Table 2.
The time domain spillover of shocks from U.S. and European financial market risk, BSI and global financial stress indicators towards the GCC equity market volatility.
Table 3.
The frequency domain spillover of shocks from U.S. and European financial market risk, BSI and global financial stress indicators towards the GCC equity market volatility.
4.2.1. Shock Transmission from Disaggregated Financial Stress Indicators (FSI)
Table 2 indicates that the Energy sector within GCC equities absorbed the largest shock contributions, receiving 2.9%, 3%, 0.91%, 0.92%, and 2.96% from financial stress components related to “Credit” disruptions, declines in “Equity Valuation,” shifts toward “Safe Assets,” “Funding” constraints, and “Volatility,” respectively. Similarly, the Real Estate sector exhibited elevated sensitivity to shocks from “Credit” disruptions (1.74%), reduced “Equity Valuation” (3.18%), “Safe Asset” transitions (1.26%), and “Volatility” (3.23%). For the Telecommunication sector, financial stress indicators of “Credit” market disruptions, “Safe Asset” transitions, lower “Equity Valuation”, “Volatility” and “Funding” constraints also accounted for higher contributions of 1.25%, 1.22%, 4.2%, 2.64%, and 0.64% of error variances to conditional volatility, respectively, as compared with rest of the sectors. Additionally, fluctuations across international currency, commodity, and stock markets generated significant transmission effects, accounting for approximately 3.96% of disturbances within the financial industry and 4.75% within the materials industry.
In contrast to the prevalent trends in previous empirical research, the current findings on shock transmission from disaggregated Financial Stress Indicators (FSI) to GCC sectoral stock conditional volatility offer fresh perspectives. He et al. (2021) have expanded this study to European green and sustainable enterprises, demonstrating that investor risk aversion and liquidity limitations might have a negative impact on environmentally oriented industries through aggregate global stress indicators. Cipollini and Mikaliunaite (2020), on the other hand, provided a regional viewpoint by using monthly FSI at the European level to investigate the relationship between national financial stress situations and macroeconomic uncertainty in many European nations. According to their results, the spread of stress is frequently diverse and impacted by institutional and financial elements unique to each nation. As an illustration, Hippler and Hassan (2015) examined the connection between overall financial stress and US stock market performance, showing that times of elevated financial stress considerably raise systematic risk and reduce market efficiency. Therefore, previous research has mostly focused on how aggregate financial stress indicators, which are frequently built as composite indexes, explain volatility and contagion effects in advanced economies, generally ignoring disaggregated or channel-specific dynamics in developing markets.
Nevertheless, the existing literature is still lacking in a number of important areas in spite of these significant additions. To evaluate how each channel uniquely transmits shocks to various sectors, prior research has not broken down aggregated FSI into their constituent parts, such as disruptions in the “credit” market, distortions in “equity valuation”, “funding” constraints, shifts to “safe assets”, or “volatility” in global commodities and foreign exchange markets. Our understanding of how financial stress affects sectoral risk dynamics is hampered by this omission, especially in developing and resource-dependent GCC financial market, where structural characteristics like fixed exchange rate regimes, little financial diversification, and a reliance on hydrocarbon revenues may make a market more susceptible to global financial disruptions.
The empirical findings of this research article demonstrate a significant spillover influence from Financial Stress Indicators (FSI) to the conditional volatility of sectoral equities, which is consistent with earlier research on financial contagion and market instability. L. Chen et al. (2023) state that since investors are still unsure and risk averse, shocks that happen during periods of high market volatility tend to have more disruptive and long-lasting effects than those that happen during periods of financial stability. Financial pressure has a consistent negative effect on stock returns throughout the distribution, affecting both gains and losses, according to Y. Liu and Wang (2024). When taken as a whole, past studies demonstrate how financial stress affects risk dynamics and market behavior, serving as the main driver of volatility in developing financial systems. Furthermore, because positive stress shocks result in deteriorating fiscal balances and rising levels of government debt, Kasal (2023) found that increased financial stress frequently limits public financing conditions. This linkage highlights the wider macro-financial ramifications of stress-induced shocks by connecting financial instability to shifts in asset prices and systemic and fiscal vulnerabilities in developing countries. Similar to this, Fink and Schüler (2015) highlighted that changes in market dynamics might worsen during times of financial hardship because indirect channels—like credit restrictions, stricter borrowing requirements, and a lack of available capital—amplify the effects of shocks brought on by stress. Their research’s findings are in strong agreement with and support the findings of the current analysis.
Table 2 demonstrates that the cumulative proportion of forecast error variance—capturing the comprehensive transmission of disturbances across the variables (FSI, BSI, VIX, and VSTOXX-50) within the full TVP-VAR structure—is equivalent to 59.68% for the overall investment horizon. In contrast, Table 3 presents the spillover effects across frequency wavelengths, indicating that the total shock spillover—measured by the aggregated forecast error variance—is lower in the short term (19.35%) compared with the long term (40.33%). For example, in the short term, the conditional volatility of the Real Estate sector received the highest contributions of forecast error variance of 0.3%, 0.58%, 0.82%, 0.28%, and 0.59% from the financial stress components of “Credit,” “Equity Valuation,” “Safe Assets,” “Funding,” and “Volatility,” respectively. Furthermore, in the short-term, conditional volatility within the Telecommunication sector also received higher shocks of 0.3%, 0.75%, 0.76%, 0.25% and 0.85%, respectively, from these stress indicators. In the long term, these disaggregated financial stress indicators transmit larger shock contributions of 2.52%, 2.77%, 0.55%, 0.6%, and 2.61% to the conditional volatility of the Energy sector. Moreover, “Credit,” “Equity Valuation,” “Safe Assets,” “Funding,” and “Volatility” also transmitted higher contributions of shocks of 1.39%, 2.34%, 0.55%, 0.68% and 4.24% towards the conditional volatility of Material sector, respectively.
The intensified spillover effects from financial stress indicators to sectoral conditional volatility observed in this study are consistent with prior empirical research. In the same vein, the pronounced contagion patterns observed in this analysis are consistent with the work of Chau and Deesomsak (2014), who found that financial stress is an effective indicator of macroeconomic variability and functions as a precautionary signal for forthcoming financial turmoil. Additionally, the findings of Balcilar et al. (2023), who reported a strong and positive correlation between financial stress intensity and volatility transmission across developing equity markets, are supported by the stronger spillover links from different components of financial stress to conditional market risk. According to their findings, this relationship’s intensity tends to increase over longer time horizons and at times when there are significant market disturbances. According to C. Liang et al. (2023), composite indices of financial stress have a significant and long-lasting impact on the actual volatility of stock markets over time, particularly at times when there are significant global financial disruptions. All together, these similarities confirm that aggregate and disaggregated financial stress plays a crucial role in determining volatility behavior, with long-term effects on the resilience and stability of developing financial systems.
Figure 3 illustrates the total time-varying dynamic spillover effects between global uncertainty indicators (BSI, FSI, VIX, and VSTOXX-50) and the conditional volatility of GCC sectoral equities. The combined measures of overall spillovers in the time domain, as well as short- and long-term spillovers in the frequency domain, exhibit a notable rise during 2018 and 2019. Furthermore, pronounced increases in both aggregate and horizon-specific connectedness across these variables are also evident throughout 2020, between 2022 and 2023, and in the final quarters of 2023.
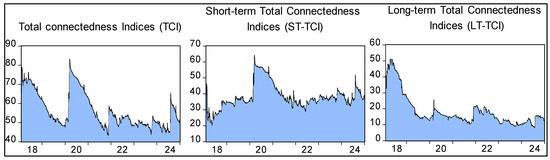
Figure 3.
Total Connectedness Indices for the overall, short- and long-term investment horizons.
Figure 4 presents the temporal and frequency-domain dynamics of amplified shock transmissions from financial stress indicators (FSI), such as global “Credit” disruptions, widening spreads due to “Funding” issue, decreased “equity valuations”, transition towards “Safe Assets” reflecting heightened risk aversion, and increased “volatility” in foreign exchange, commodity, and financial markets. These effects were most pronounced in 2018 and during the COVID-19 outbreak in late 2019. Intensified spillovers from FSI to GCC sectoral stock volatility were also evident in 2020 (during the COVID-19), between 2021 and 2022, and in the final quarter of 2023.
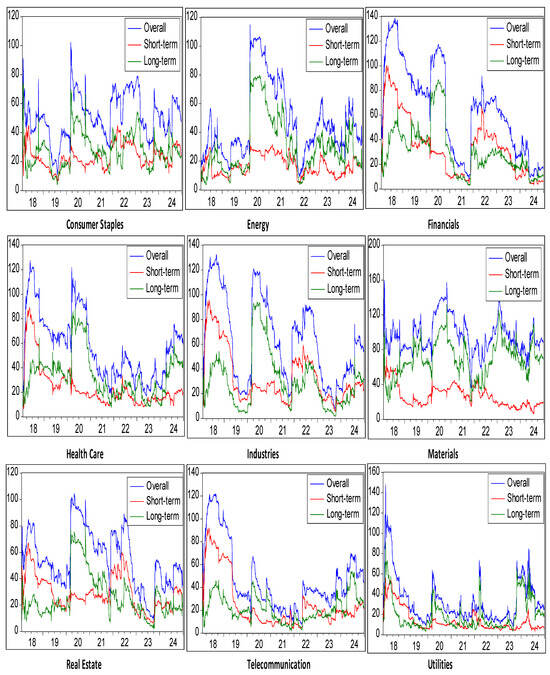
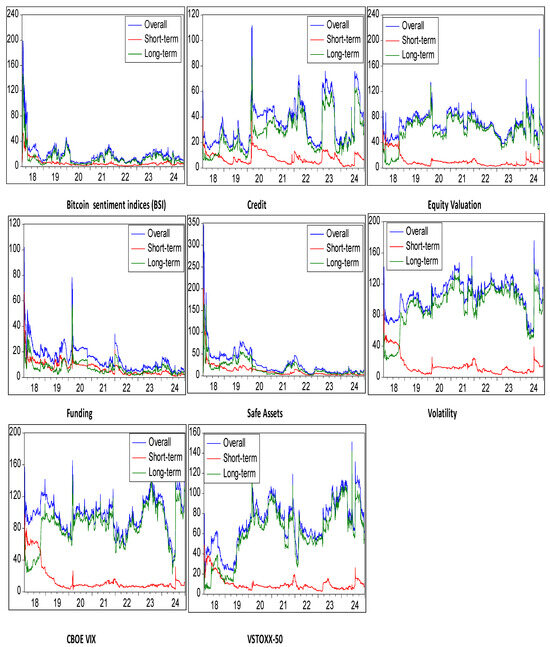
Figure 4.
Spillover of shocks from variable “” “TO” variable “” by utilizing the “Time” and “Frequency” domain TVP-VAR based connectedness approach.
As shown in Figure 5, GCC sectoral stocks experienced elevated volatility shocks across 2018, 2019–2021 (during the COVID-19), and again between 2022 and 2023. Moreover, conditional volatility in GCC sectors recorded an additional surge in shock reception from FSI and other global uncertainty sources during the last quarter of 2023.
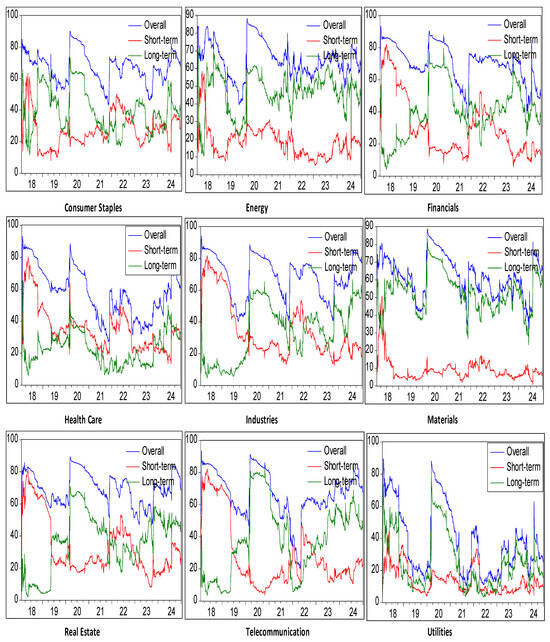
Figure 5.
Spillover of shocks “FROM” all other variables “j” to variable “i” by utilizing the “Time” and “Frequency” domain TVP-VAR based connectedness approach.
One of the justifications for the time-varying shock spillovers is the investors reaction to the uncertainty created by U.S. trade restrictions and their perceived implications for global economic growth; the increased financial stress shocks that influenced GCC sectoral stock volatility in 2018 were primarily caused by widening credit spreads and increasing global market turbulence (Santacreu, 2020). At the same time, Italy’s political unrest increased fiscal uncertainty throughout Europe, raising the rates on sovereign bonds and widening credit spreads in the Eurozone (The Economist, 2022; Schiantarelli et al., 2020). All of these changes reinforced financial contagion pathways from developed countries to GCC markets and indicated an increase in systemic risk. Similar economic strain was reawakened in 2019 due to the strident reduction of the Argentine peso, increasing inflationary pressures, and growing fears of a government breakdown (World Bank Group, 2018). These measures signaled growing susceptibilities in developing financial systems and augmented the spread of volatility from global financial stress indicators to the GCC’s equities markets. Subsequent to this, the COVID-19 pandemic in late 2019 further aggravated financial unsteadiness by causing a sharp worldwide economic decline, liquidity constraints, and a significant upsurge in credit spreads as governments and businesses sought for immediate sources of funding. The hostility over oil pricing between Russia and Saudi Arabia, which led to an extraordinary breakdown in crude oil values, undermined the energy industry and intensified the financial vulnerability of the GCC’s petroleum-based economic structure (Ma et al., 2021).
Furthermore, the global financial disruptions following the pandemic were compounded by the Evergrande debt turmoil in China, which heightened investors’ risk perception and exposed the structural fragility of over-leveraged property sectors (Altman et al., 2022). Given its trade interconnections and dependence on resource exports, the GCC region experienced a more pronounced impact from the ensuing financial tremors that rippled through worldwide equity markets, amplifying volatility transmission. These developments collectively diminished investor assurance, broadened sectoral exposure to risk, and escalated market instability across the GCC’s financial landscape. This demonstrates how the region’s susceptibility to worldwide financial stress is still impacted by foreign financial and geopolitical shocks. As a result, FSI showed more robust transmission patterns toward sectoral volatility in the GCC in 2021, signifying a time of increased market interdependence and fresh stress. Lastly, by distressing commodity supply chains, imposing harsh sanctions, and raising risks in the energy and geopolitical markets, the Russia-Ukraine conflict of 2022 further increased global unpredictability (Boubaker et al., 2022). In addition to increasing risk premiums and volatility across a number of asset sectors, these disruptions tightened global financial conditions.
4.2.2. Shock Transmission from U.S. VIX and European VSTOXX-50
Table 2 reveals that variations in the U.S. VIX produce significant expansions in the proportion of forecast error variance linked to sector-specific conditional volatility—amounting to 3.98% for the Financial sector, 3.48% for Energy, 4.88% for Materials, and 3.55% for Real Estate. In addition, the same table shows that shocks originating from the VSTOXX-50’s conditional volatility generate the largest spillover effects of 3.28%, 2.88%, 3.02%, and 2.87% on the Energy, Industrials, Materials, and Real Estate sectors, respectively. Meanwhile, Table 3 presents the pattern of shock transmission across different frequency domains, capturing both short- and long-term investment horizons. The findings indicate that volatility shocks from both the VIX and the VSTOXX-50 exert stronger and more persistent effects on the Energy, Financials, Materials, and Real Estate sectors over the long run compared to the short run. For instance, in the short term, the conditional volatility of Financials, Health Care, Industrials and Telecommunication sectors receives higher shock contributions of 0.96%, 1.04%, 1.16% and 1.28%, from the VIX, respectively, compared with the other GCC sectors. Similarly, these sectors receive higher short-term shocks of 0.73%, 0.62%, 0.94% and 0.72% from the VSTOXX-50, respectively (see Table 3). However, in the long term, the Energy, Financials, Material and Real Estate sectors experience the highest shock spillovers from both the VIX and the VSTOXX-50 compared with the other GCC sectors. For example, in the long term, the VIX transmits shocks of 2.87%, 3.02%, 4.15% and 2.78% to the conditional volatility of Energy, Financials, Material and Real Estate sectors, respectively. Similarly, these sectors receive the highest shock spillovers from the VSTOXX-50, with contributions of 2.77%, 2.05%, 2.68%, 2.25%, respectively, compared with the remaining GCC sectors.
The results of this study are broadly consistent with prior empirical evidence emphasizing the global transmission of market uncertainty and volatility. A significant association between stock market returns and the VIX index was discovered by Kirci Altinkeski et al. (2024), especially at the extremities of the return distribution. This pattern implies that in an attempt to improve portfolio stability during periods of elevated uncertainty, investors frequently reallocate funds to safer or alternative asset classes. B. Chen and Sun (2022) demonstrated the worldwide reach of U.S. financial conditions by demonstrating that rising U.S. market volatility, as shown by VIX spikes, often has a detrimental effect on the performance of developing nations’ currency and equities markets. Furthermore, X. Chen et al. (2024) found that the relationship between asset return synchronization and uncertainty measurements, such the VIX, varies over time and often gets stronger during times of financial turmoil. These results are consistent with the idea that VIX-driven volatility shocks have longer-lasting effects than short-lived market disruptions. This time-dependent variability suggests that changes in investor mood cycles and general economic settings influence the length and severity of volatility transmissions. The disputation that the U.S. is the primary source worldwide financial uncertainty is further supported by Smales (2022) observation that rises in U.S. equity market risk perceptions have a tendency to spread to other markets. Deep financial interconnectedness and synchronized investment operations are demonstrated by the volatility’s ongoing regional dispersion. These traits can enhance contagion effects when worldwide stress increases, even while they promote competitiveness during periods of stability. For instance, the most recent trend indicates that European markets are in a comparable bind. The higher transference of volatility spillovers towards the emerging nations from the European developed financial system are consistent with the findings of existing studies. For example, Tissaoui and Zaghdoudi (2021) identified sturdy cross- market volatility interactions between developed and developing financial systems, particularly during times of financial recession. The continual spread of volatility across regions demonstrates deep financial connectivity and coordinated investment activity. Even though these characteristics boost market efficiency during stable times, they can also increase contagion effects when global stress grows.
Figure 4 further indicates that, in the frequency domain, long-term shocks transmitted from the VIX and VSTOXX-50 to the GCC sector-wide equity market conditional volatility exhibit greater magnitude and intensity compared to short-term shocks. Additionally, the Figure 4 reveals that shock transmission from the VIX and VSTOXX-50 to other sectors intensified during 2018 and the COVID-19 period. A similar rise in transmission is also evident in the third quarter of 2021, as well as between 2022 and 2023. Furthermore, Figure 5 also shows all the conditional volatility within all the GCC sectors also experienced higher shocks from VIX and VSTOXX-50 during the COVID-19 and between 2022 and 2023.
The U.S. administration’s imposition of import taxes on goods from China and the European Union in 2018 caused a significant increase in financial instability in both American and European markets, upending established trade dynamics and reducing global investor confidence (Caldara et al., 2020). These tariff disputes increased investor prudence, causing market volatility and stoking widespread doubt about the sustainability of global trade alliances over the long run. In addition, the Federal Reserve’s interest rate increases in 2018 increased the cost of lending and increased market anxiety over a possible deceleration in economic expansion. These problems were made worse by the U.S. government shutdown, which occurred from late 2018 to early 2019 and reduced investor confidence while increasing policy uncertainty. Then, during the COVID-19 crisis, financial instability rapidly worsened as bear markets were triggered by unexpected liquidity disruptions, elevated joblessness, and widespread business shutdowns. For example, the S&P 500 index fell over 34% between February and March 2020 (S. I. Ahmed & Randewich, 2020), highlighting the extraordinary severity of the economic crisis. When the Delta variety emerged in mid-2021, it exacerbated global issues by igniting fresh waves of infection in major economies and raising concerns about a long-term economic recovery. The declaration of COVID-19 as a global pandemic by the World Health Organization was a significant turning point that sparked one of the most severe and swiftest economic downturns of the modern age. A remarkable increase in market anxiety and perceived risk was recorded by the U.S. Volatility Index (VIX) on 16 March 2020, marking the highest level since the global financial crisis of 2008 (Apergis et al., 2023). Together, these events highlight how interwoven uncertainty shocks from developed economies—especially those in the US and Europe—intensify systemic financial turmoil in interconnected international markets.
When the WHO announced the outbreak of the pandemic, European financial markets saw comparable steep declines. In mid-March 2020, the Euro VSTOXX index surged beyond 80 points, indicating a notable increase in the perceived risk of investors. Strict restrictions on movement, such countrywide business shutdowns, and ambiguity surrounding the European Union’s economic cooperation and emergency preparedness procedures were the main causes of this spike in turbulence. Early in 2022, a fresh wave of financial instability emerged with the rapid global spread of the Omicron version and escalating inflationary pressures. These considerations rekindled concerns about the stability of the global economic outlook and caused another dramatic increase in volatility indicators. At the same time, the escalation of the war between Russia and Ukraine exacerbated market volatility, leading to significant disruptions in global energy supply and increasing geopolitical unpredictability (Dang et al., 2023). These improvements enhanced the transmission of financial risks across regional and global markets by weakening investor confidence and increasing cross-market contagion pathways (Boubaker et al., 2022). The interdependence of modern financial systems and their susceptibility to systemic disruptions are further highlighted by research that repeatedly show that shocks impending from industrialized and developed nations have a greater impact on global equity markets (Gorman & Hughen, 2024).
The primary cause of the 2018 financial crisis in Europe was the growing rifts over fiscal supervision and budgetary control between the European Union and the populist government in Italy (The Economist, 2018). These periods of economic instability raised investor anxiety and accelerated the spread of volatility through the VSTOXX-50 index, raising concerns about Italy’s budgetary stability and the overall structural soundness of the Eurozone economy (Lane, 2024). By maintaining continuous uncertainty inside European capital systems and strengthening cross-regional financial linkages, the lingering frictions in 2018 and 2019 further exacerbated volatility spillovers into GCC sectoral stock markets. Market destabilization was further exacerbated by the increasing uncertainty around the UK’s withdrawal from the European Union, which was especially noticeable in 2019. Together, such variables highlight the profound financial interconnection between developed and developing equity market systems and demonstrate how unpredictable political circumstances, budgetary conflicts, and monetary instability inside Europe may greatly accelerate the spread of cross-border volatility. According to Apostolakis et al. (2021b), investor confidence was undermined, risk premiums increased, and the spread of volatility from European to developing markets was expedited due to the uncertainties surrounding Brexit. Another justification of the higher shock spillovers from VIX and VSTOXX-50 towards the GCC in 2021 and 2022 is that mounting price pressures and anticipated monetary tightening by central authorities destabilized Europe’s financial landscape. Therefore, successive surges in the VSTOXX-50, signaling heightened investor unease and intensifying volatility diffusion toward interconnected areas such as the GCC, mirrored these evolving macro-financial conditions.
4.2.3. Shock Transmission from Bitcoin Investors’ Fear and Greed Sentiment Indices (BSI)
Table 2 indicates that volatility was most pronounced in the GCC sectoral stock conditional volatility of Energy, Materials, Financial, and Telecommunications, which recorded respective increases of 1.7%, 1.47%, 1.45%, and 1.57%. Much of this instability appears to stem from changing attitudes among Bitcoin investors, particularly shifts between fear and optimism observed across different investment horizons. For instance, as shown in Table 3, the influence of the Bitcoin Sentiment Index (BSI) on sectoral volatility tends to strengthen over longer periods compared to the short term. In the short run, for instance, the Energy and Industrial sectors were slightly more responsive to changes in the BSI, with contributions of 0.52% and 0.47%. Over extended periods, however, greater spillover effects were evident in the Energy, Materials, and Telecommunications sectors, where the impact of BSI-related shocks reached 1.18%, 1.26%, and 1.13%, respectively.
Figure 4 demonstrates that, over extended timeframes, the Bitcoin Sentiment Index (BSI) had a deeper and more enduring impact on market fluctuations than it did in shorter intervals. This effect extended across multiple markets, including the GCC financial system, particularly during 2018 and 2019. The magnitude of these spillovers intensified further during the COVID-19 crisis and again between 2022 and 2023. Similarly, Figure 5 reveals that, during these periods, all GCC equity market sectors experienced heightened volatility as a result of shocks originating from the BSI.
One of the justification for the higher spillover of shocks towards the GCC financial system during 2018 to 2019 is that the Bitcoin Cash hard fork disagreement shattered investor sentiment and increased systemic uncertainty inside the cryptocurrency market; volatility in the cryptocurrency ecosystem intensified between 2018 and 2019 (Pascoe, 2019). As a result of these changes, the shock propagation from the Bitcoin Sentiment Index (BSI) to the conditional volatility of different stock market sectors was accelerated. A steep drop in Bitcoin returns and widespread investor fear and speculative repositioning were caused by the COVID-19 outbreak in late 2019 (Yarovaya et al., 2021). The introduction of stricter cryptocurrency trading regulations in major Asian economies, including China and South Korea, was a significant factor in the increased transmission of shocks from Bitcoin investors’ fear and greed sentiment indices to sectoral stock market volatility in 2018 (Macfarlane, 2020). Bitcoin’s value sharply corrected as a result of these governmental crackdowns, falling from around USD 17,000 to about USD 6000, indicating a significant decline in investor confidence (Chan et al., 2023). The Mt. Gox exchange trustee’s court-ordered liquidation of substantial Bitcoin reserves to pay creditors further exacerbated market volatility and further down the price of digital assets (Browne & Sigalos, 2024). Tesla’s suspension of cryptocurrency payments and Elon Musk’s public criticism of Bitcoin’s environmental impact sparked a massive sell-off throughout cryptocurrency markets in mid-2021, causing a further spike in volatility (Browne, 2021). China’s stepped-up crackdown on cryptocurrency mining and trading exacerbated this market drop by reducing liquidity and raising global risk aversion. By early 2022, Bitcoin prices were very volatile due to a mix of increased geopolitical uncertainty, especially the Russia-Ukraine war (Boubaker et al., 2022), and growing inflationary and interest rate pressures. Stronger cross-market spillovers from crypto sentiment to GCC sectoral stock volatility were caused by these variables taken together, which strengthened high levels of investor fear.
Due in significant part to Bitcoin’s extraordinary volatility during the COVID-19 epidemic, shocks from the Bitcoin Sentiment Index (BSI) have a stronger transmission to sectoral market volatility in the GCC. Bitcoin saw a historic one-day drop of about 40% in March 2020 as investors worldwide quickly pulled out of high-risk and speculative assets due to growing financial instability (Diniz-Maganini et al., 2021). Its reputation as a possible safe-haven or hedging asset during crises was called into question by this sharp decline, which also revealed Bitcoin’s susceptibility to systemic shocks. Bitcoin’s value steadily increased as a result of increased institutional investment and rekindled speculative interest, although volatility remained even after significant fiscal and monetary stimulus packages were introduced between April and June 2020. Bullish attitude was further heightened by the news of vaccination advances in late 2020, which caused Bitcoin’s price to surpass USD 20,000 for the first time since 2017 (Jolly, 2020).
The results align with Bazán-Palomino’s (2023), who observed that the increasing participation of institutional investors in Bitcoin has established a major channel for spreading volatility across markets, thereby complicating efforts aimed at regulation and financial stability. Likewise, W. M. A. Ahmed (2021a) found that developing economies are particularly vulnerable to negative movements in Bitcoin prices—especially during times of economic growth or investor optimism—as speculative capital flows tend to intensify overall market uncertainty. Additionally, there is Bazán-Palomino’s (2023) assertion that Bitcoin-driven volatility fluctuations operate in different time-frequency parameters and demonstrate inconsistent transmission mechanisms over short-, medium-, and longer-term investment time frames. Therefore, these findings are consistent with the research findings of our study that ongoing spillover effects from Bitcoin sentiment indices to equity conditional volatility varied across frequency wavelengths. This demonstrates Bitcoin’s growing systemic importance as a cause and a conduit of financial instability in both domestic and international markets. Zhao and Zhang (2023) identified a shifting and time-varying linkage between Bitcoin and major global equity indices, showing that both the magnitude and trajectory of these relationships evolve alongside broader economic and financial developments. This pattern aligns with the widening transmission of emotion-driven disturbances, where fluctuations in sectoral stock volatility increasingly spill over into Bitcoin movements. As noted by Elsayed et al. (2022), Bitcoin functions as a dominant transmitter of global market turbulence, exerting substantial influence on interconnected financial environments. This phenomenon became especially evident during the COVID-19 crisis, when rapid shifts in investor sentiment and liquidity constraints propagated swiftly across multiple asset categories.
Figure 6 depicts the graphical representation of Net Pairwise Dynamic Connectivity across varying temporal and frequency dimensions, encompassing the entire observation window (a), short-run period (b), and extended-run period (c). The analysis indicates that, with the exception of global “Credit” pressures, the majority of financial stress indicators predominantly operate as net propagators of disturbances over longer durations. In contrast, during shorter intervals, nearly all stress metrics function as net senders of impulses, aside from “Funding” constraints and the inclination toward “Safe Asset” holdings. Furthermore, the U.S. VIX consistently stands out as a principal channel of volatility transmission across all examined phases—comprehensive (a), brief (b), and prolonged (c)—whereas the VSTOXX-50 demonstrates this transmission role solely within the short-term timeframe (b).
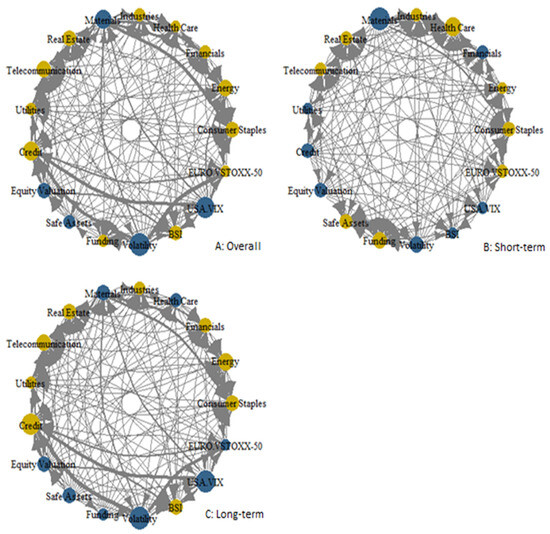
Figure 6.
The network of shock spillovers between global uncertainty factors and GCC sectoral stock conditional volatility for the overall (A), short-term (B) and long-term (C) investment horizons.
5. Robustness and Sensitivity Analysis
To ensure robustness and assess sensitivity, the empirical investigation is extended by estimating the shock spillovers amongst variables across multiple H-step ahead forecasting horizons (10, 15 and 20) within the TVP-VAR approach. This methodological enhancement fulfills two key econometric objectives. First, in the context of a TVP-VAR-based connectedness structure, evaluating the persistence of spillover estimates across different H-step ahead forecasting horizon values enables a temporal stability test of the transmission process, functioning as an internal validity check. Conducting sensitivity analysis by varying H-step ahead forecasting horizons (e.g., 10, 15, 20) ensures that the estimated spillover indices and network connectedness are not artifacts of a specific horizon. If the spillover measures and their graphical trends (as in Figure 7) remain qualitatively stable across horizons, it validates the robustness of the dynamic connectedness results and rules out the possibility of forecasting horizon-dependent bias. The area-band plots presented in Figure 7 illustrate that the dynamic connectedness patterns between FSI, VIX, VSTOXX-50, BSI and GCC sectoral stock conditional volatility remain qualitatively stable and similar across all examined horizons (10, 15 and 20) with only negligible variations in band width. Such consistency suggests that the estimated spillover dynamics are largely insensitive to the chosen forecast horizon, reinforcing the robustness of the underlying transmission mechanism. The close alignment of time-varying spillover trajectories and the minimal fluctuation in area-band widths across combination of H-step ahead forecasting horizons such as 10 and 15, 15 and 20 as well as 10 and 20 (see Figure 7), further substantiate the econometric reliability of the TVP-VAR-based connectedness estimation.
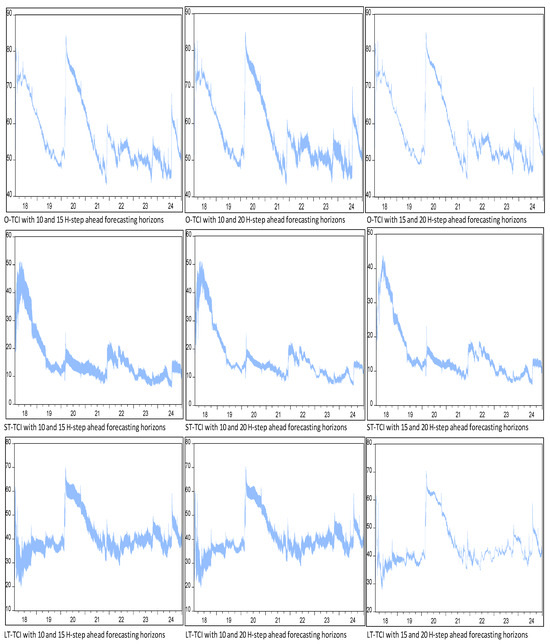
Figure 7.
The time varying total connectedness indices for the overall (O-TCI), short-term (ST-TCI) and long-term across different H-step ahead forecasting horizons.
Estimating shock spillovers within the TVP-VAR framework under varying lag specifications and across different H-step ahead forecasting horizons offers a comprehensive robustness and sensitivity assessment of the dynamic connectedness structure. The consistent outcomes and trend alignment illustrated in Figure 8 imply that the spillover dynamics maintain structural stability and temporal coherence across different model configurations. Moreover, the robustness of the time-varying pattern of the dynamic connectedness across varied lag lengths confirms the adequacy of the model’s specification (see Figure 8). Consequently, the consistent time-varying spillover of shocks transmitted from the FSI, BSI, VIX, and VSTOXX-50 indices toward the GCC sectoral volatility across varied lag lengths (1, 2 and 3) represent authentic and persistent economic interactions, rather than artifacts arising from parameterization or lag selection. Therefore, from an econometric perspective, maintaining stability across various forecast horizons and lag lengths indicates that the model effectively reflects enduring structural relationships and also demonstrates that the GFEVD remains numerically consistent when estimated recursively, ensuring the reliability of dynamic connectedness measures. Moreover, the absence of distortions linked to forecast horizon truncation confirms the robustness of the results. Consequently, conducting sensitivity analysis serves as a diagnostic tool to validate the internal consistency and reliability of the TVP-VAR framework (see BenSaïda, 2019).
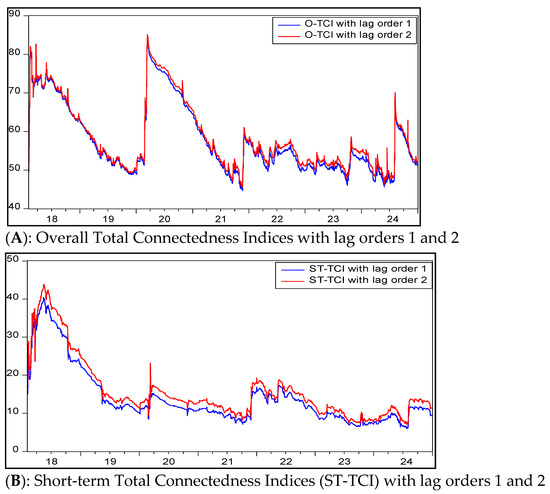
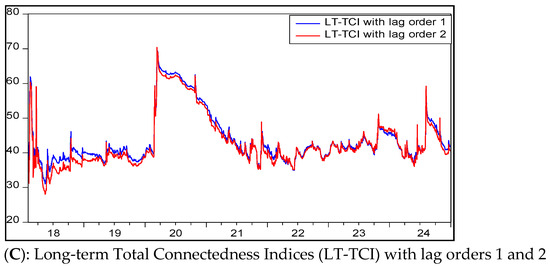
Figure 8.
The time varying total connectedness indices for the overall (A), short-term (B) and long-term (C) across different lag orders.
6. Discussion with Theoretical Rationality and Practical Implications
6.1. Shock Transmission from BSI
The findings indicate that sudden shifts in investor sentiments connected to cryptocurrencies, especially those fueled by fear and greed have a significant impact on the volatility of risk in the Energy and Industrial sectors. It is thus advised that asset managers put in place adaptable security measures that combine ongoing monitoring of Bitcoin emotion indicators with timely defensive strategies like inter-sector allocation changes or derivative-based covering. On the other hand, the Materials and Real Estate markets are comparatively less sensitive to psychological fluctuations, suggesting that these sectors might be more stable investment opportunities when the digital currency landscape is more unpredictable. Moreover, integrating emotional indicators derived from Bitcoin activity into automated trading systems and fluctuation forecasting mechanisms can enhance the precision of near-term instability estimations while reinforcing the portfolio’s structural resilience. Over extended horizons, pronounced movements in the Bitcoin Sentiment Index (BSI) exert substantial influence on the conditional unpredictability of the Energy, Materials, and Telecommunication segments. Continuous transformations in digital asset perceptions intensify overall market ambiguity, emphasizing the importance of embedding BSI variations within long-duration uncertainty evaluation models. Employing robust defensive measures—such as expanding asset exposure across minimally connected instruments and implementing derivative-supported safeguards—can mitigate the destabilizing effects triggered by sentiment-driven turbulence. Anticipated instability in financial markets can elevate funding and borrowing expenses for firms within the communication services field, whereas enduring emotional disruptions tend to intensify variations in production expenses and amplify apprehensions related to raw material pricing within the energy and resource-based industries. In contrast, the utilities segment demonstrates stronger resistance to emotion-induced fluctuations, implying that it may function as a stabilizing component within broadly diversified investment holdings.
From an applied perspective, integrating Bitcoin Sentiment Index (BSI) metrics into quantitative and automated trading frameworks can sharpen volatility prediction accuracy and enable quicker, data-driven portfolio rebalancing decisions. Within Gulf Cooperation Council (GCC) markets, supervisory authorities and economic planners are advised to continuously evaluate digital currency sentiment measures as a component of comprehensive financial soundness assessments. This holds particular significance for the Energy, Materials, and Communication industries, which form essential pillars of the region’s economic expansion. Establishing macro-level safeguard mechanisms that incorporate cryptocurrency market transmission effects could ultimately mitigate widespread financial vulnerabilities. Enterprises across the GCC region ought to embed emotion-based fluctuation analytics within their expenditure planning, project evaluation, and long-range strategy formulation frameworks to guarantee that enduring fiscal and managerial choices remain resilient amid the evolving patterns of cryptocurrency market behavior.
One of the theoretical justifications for the higher shock transmission from BSI towards the GCC sectoral stock volatility is due to the bitcoin’s rising status as a transformative element within international financial networks, which can be understood through the observable spillover of disturbances from the Bitcoin Sentiment Index (BSI) into industry-specific conditional fluctuations. Furthermore, the swift evolution of blockchain innovation and Bitcoin’s expanding role within the global financial architecture have heightened apprehensions about possible threats to worldwide economic steadiness, emphasizing the importance of comprehensively examining the channels through which emotion-driven disturbances propagate across markets (Musholombo, 2023). The expanding adoption of crypto-oriented financial instruments by corporations reinforces Bitcoin’s deepening integration within institutional and individual investment structures, signaling a broad reconfiguration of global capital distribution patterns (Mercik et al., 2024). Consequently, emotional oscillations surrounding Bitcoin—whether expressed through speculative accumulation or downturn-driven liquidations—operate as conduits for transmitting instability among diverse asset categories and regional markets. Even without direct economic interconnections, disturbances originating in one component of the monetary system can readily influence other industries within an intricately interdependent financial landscape (W. M. A. Ahmed, 2021b). As shown by Kannan and Köhler-Geib (2009), disruptions that occur in a particular market, such sudden changes in the Bitcoin Sentiment Index (BSI), frequently lead to mass investor movements, which increases systemic vulnerability throughout the financial system. Variations in sector-based stock volatility in GCC economies typically reflect reallocations carried out by institutional and speculative traders in response to sentiment-driven changes in the price of Bitcoin. This trend is consistent with the cross-market portfolio adjustment theory, which postulates that investors reduce their equity holdings after cryptocurrency market shocks, thereby shifting volatility pressures from digital assets to conventional equity markets (Kodres & Pritsker, 2002).
6.2. Shock Transmission from VIX and VSTOXX-50
Over long periods of time, the transmission of error variance from global volatility benchmarks like the VIX and VSTOXX-50 to the Energy, Financials, Materials, and Real Estate sectors demonstrates how highly sensitive these sectors are to protracted periods of global market uncertainty. The sustainability of long-term growth and macroeconomic stability are significantly impacted by this ongoing vulnerability. Because the capital and real estate markets, in particular, depend heavily on global financing flows and changes in monetary policy, changes in global uncertainty frequently result in tighter lending standards and limited cash supply. The Energy and Raw Materials sectors, which are strongly linked to commodity valuation trends, may also encounter persistent price volatility that jeopardizes fiscal equilibrium in countries that rely on income from resources. In times of increased financial fragility, governments may enact tougher loan-to-value ratios and tighter credit controls in an effort to prevent excessive speculation and maintain affordability in the housing sector. To mitigate these exposures, financial oversight bodies ought to strengthen system-wide monitoring by utilizing policy tools like national stabilization reserves, cyclical fiscal cushions, and selective modifications in capital risk weighting. From a portfolio management standpoint, redirecting resources toward the healthcare and utility domains—which traditionally exhibit lower sensitivity to worldwide market turbulence—could bolster investment durability and establish a steadier platform for sustained wealth preservation.
The analysis reveals that heightened ambiguity within American and European capital arenas acts as an early signal for sudden valuation swings in Energy, Finance, Healthcare, Industrial, and Communication equities, particularly affecting traders operating on brief timeframes. This linkage implies that consistent observation of the VIX and VSTOXX-50 measures—often leading indicators of substantial sectoral repricing—can enable market participants to capitalize on turbulence-driven opportunities. From a tactical implementation view, volatility-dependent instruments such as straddles, strangles, and futures tied to these segments may yield notable gains amid periods of elevated investor anxiety. However, disciplined protection protocols—incorporating precise stop-loss thresholds, adaptive exposure calibration, and continuous intraday oversight—remain essential, as the same fluctuation forces that create profit potential equally heighten downside vulnerability. Moreover, since shares within the consumer staples category typically exhibit limited responsiveness to volatility waves originating from the VIX and VSTOXX-50 indices, allocating capital to these equities can function as an inherent safeguard against market turbulence. Consequently, reducing concentration in highly sensitive sectors—such as Energy, Finance, Healthcare, Industry, and Communications—or strategically channeling resources toward more defensive holdings like essential consumer goods or government securities, can help steady portfolios over shorter horizons. This form of adjustment not only minimizes potential capital losses but also enhances overall endurance against temporary fluctuation transmissions within globally linked financial networks.
The persistent transmission of long-range volatility from the VIX and VSTOXX-50 indices to sectors such as Real Estate, Industry, and Energy—alongside the short-term responsiveness observed in Energy, Healthcare, and Materials—can be conceptually attributed to the adverse repercussions of financial and macroeconomic ambiguity originating in the U.S. and Europe on global capital allocation and consumption patterns. Within these advanced economies, elevated uncertainty often suppresses demand for industrial goods and exhaustible commodities, discourages international investment movements, and amplifies volatility spillovers toward emerging markets. Given that the GCC’s economic structure is closely tied to worldwide trade networks and external funding inflows, these dynamics exert a disproportionately strong influence on its energy, resource, industrial, and property sectors. Investors tend to become more risk averse during times of increased global uncertainty, which causes them to pull out of erratic regional holdings and exacerbate price swings on GCC stock markets (Guiso et al., 2018). At the same time, instability in Western financial institutions reduces global output and consumption levels (Yıldırım-Karaman, 2018), which reduces the demand for the commodities produced from oil and industrial inputs that support the building and manufacturing industries in the Gulf area. The GCC’s materials and real estate sectors are further weakened by the concomitant decline in foreign direct investment (FDI) from developed countries, especially those that depend on a consistent flow of outside capital to support long-term economic growth and infrastructure projects. Therefore, rising market turbulence frequently hampers international production networks and constrains the movement of fuel and raw resource exchanges across borders.
The behavioral finance perspective, which contends that rising stock market anxiety in developed regions—most notably the United States and Europe—often prompts coordinated liquidation actions by international investors, including participants within GCC exchanges, provides an explanation for how disruptions from the VIX and VSTOXX-50 indices affect the fluctuation patterns of GCC equities, even when local macroeconomic fundamentals remain stable. According to Kirimhan et al. (2024), this phenomenon is characterized by herd-like behavior, which intensifies the cross-border dissemination of instability through linked risk channels and global anxiety measurements. In order to rebalance portfolio risk levels, large investors usually reduce their exposure to Gulf assets. This allows outside financial disruptions to seep in and destabilize local market conditions in the area. Countries with strong economic ties, significant cross-border capital flows, and constrained fiscal capacity are more vulnerable to instability emanating from U.S. financial sectors (Balli et al., 2021). Furthermore, compared to backward-looking or model-derived volatility measures, volatility benchmarks like the VIX and VSTOXX serve as gauges of investor sentiment generally and provide a more thorough representation of expected market instability (Smales, 2022). Given its central role in global investment transmission channels and its central influence in global capital circulation, the growing interconnectedness and mutual dependence among global financial structures further emphasize how disruptions within the U.S. monetary framework can have an impact on other countries (Smales, 2020).
6.3. Shock Transmission from Disgaregted Financial Stress Indicators (FSI)
The findings provide a number of useful takeaways for hedge fund managers, asset allocators, and active traders. When monetary circumstances tighten and lending channels become limited, it is crucial to have sufficient cash reserves because industries including real estate, healthcare, industrials, communications, and energy are more susceptible to changes in global financial stress. Key operating priority should continue to include securing secure finance arrangements, adequate emergency liquidity, and adequate contingency capital. It is critical for short-term investors in GCC equity segments to create trading systems that protect companies, especially those in manufacturing and production, from the negative effects of capital scarcity, credit restrictions, and increased market volatility in order to maintain steady solvency and flexible financial capacity. Similarly, diversification strategies that protect domestic stocks from the impact of global changes in commodity, asset, and currency markets should be implemented by investment supervisors. This goal can be achieved by increasing allocations to defensive sectors, such as utilities, which often exhibit reduced susceptibility to systemic disruptions brought on by indicators of financial strain like volatility spikes or liquidity constraints. It is equally important to strengthen comprehensive risk governance. This entails carrying out thorough scenario studies, assessing the resilience of portfolios in the event of a contagion, and incorporating cross-market stress indicators into risk assessment frameworks. When taken as a whole, these actions promote stability during times of increased global financial volatility, encourage well-informed investment decisions, and strengthen the longevity of long-term portfolios.
The results provide hedge fund executives, institutional traders, and asset allocators with a number of useful information. First and foremost, decision-makers should keep a close eye on macro-financial stress indicators like the VIX, LIBOR–OIS spread, and international credit risk margins while creating investment and distribution policies in the GCC’s energy sector. Empirical data suggests that global tension indicators significantly increase conditional volatility in the regional energy market, which justifies this monitoring. From the perspective of implementation, adaptive hedging systems that make use of energy-related financial instruments—such as futures, options, and sector-specific volatility benchmarks—are necessary to safeguard capital against sudden price swings. Additionally, by successfully reducing vulnerability to enterprise-level or particular market disruptions, diversifying assets within the energy segment itself can improve portfolio robustness. Furthermore, the finding that financing shortages and risk-averse capital movements have noticeable transmission effects in the utilities sector emphasizes how crucial it is for businesses in this industry to have a sound balance sheet design and proactive cash-flow management. Integrating global stress indicators into simulation-based forecasting and analytical risk frameworks is crucial for energy and utility firms alike. This procedure entails testing the durability of portfolio holdings under sharp swings in borrowing rates, yield gaps, and resource values as well as assessing each sector’s susceptibility to changes in investor demand for safe assets. Lastly, investment leaders should incorporate protective sectors like necessities into their allocation plans and keep reserves of premium liquid products, such as government securities, to increase the durability of their portfolios. By taking these steps, the negative effects of significant financial disruptions are lessened, long-term portfolio stability is promoted, and capital is protected in the face of shifting global market conditions.
The main way that financial stress indicators (FSI) spread disruptions into GCC equity sectors is through widespread market fragility and fluctuations in resource valuations, which lead investors to simultaneously seek speculative opportunities and defensive repositioning (Bouri et al., 2023). Variations in worldwide energy standards, which are impacted by changes in global demand, supply-side adjustments, and general economic uncertainty, have a significant impact on industries that rely heavily on raw resources (Bakas & Triantafyllou, 2020). Investors frequently rearrange their asset allocations during periods of heightened market stress, which accentuate financialization trends and exaggerate changes in commodity prices (Adams & Glück, 2015). Given that natural gas and petroleum revenues provide the main source of funding for GCC states, these developments intensify fluctuations in energy valuations, which have a direct impact on corporate earnings and encourage the spread of financial risk across various industries across regional exchanges (L. Chen et al., 2023). Investors’ risk tolerance is further weakened by growing global uncertainty, which leads them to shift their money away from emerging-market investments and into safer financial products. By limiting international capital movement, reducing global funding availability, and boosting dependence on derivative-based protection mechanisms, this change modifies the behavior of the market as a whole (Cavallaro & Cutrini, 2019). Because GCC economies remain substantially dependent on external funding sources and inbound global investments, unfavorable financial conditions can sometimes trigger withdrawals of foreign capital and concentrated equity sell-offs, intensifying price fluctuations and overall market turbulence. The ensuing contraction in overseas participation and tightening of liquidity within regional financial systems produce dual effects—depressed share valuations and elevated conditional market variability.
7. Conclusions with Policy Guidelines, Research Limitation and Future Research Directions
This study provides the first empirical investigation of how the GCC’s stock sectors react to changes in global uncertainty. It looks at how well these markets withstand shocks and volatility brought on by a variety of international financial stressors, including the European VSTOXX-50, the U.S. VIX, and investor mood indexes connected to Bitcoin, such as the Fear and Greed Index (BSI). Additionally, the study examines the transmission of these shocks across several investment horizons, offering insights into both short-term market responses and longer-term structural changes in sectoral equities markets. More focused macroprudential tactics can be developed by determining which GCC sectors are most vulnerable to global uncertainty. To reduce the possibility of systemic risk escalation, authorities should specifically think about strengthening countercyclical capital buffers in industries that exhibit higher susceptibility to external shocks.
According to the analysis, the industrial sector of the GCC equity markets is especially vulnerable to financial stress in the short term. This is especially true when there are disruptions in the credit markets; funding conditions tighten, investors turn to safe-haven assets, or pressures on valuation and volatility arise in the equity, commodity, and foreign exchange markets. However, the energy sector shows the highest level of conditional volatility over a longer time horizon, suggesting a greater structural vulnerability to continuous external uncertainties and global financial crisis. There are several regulatory ramifications to these results. Policymakers should think about implementing short-term macro-prudential measures, such as sector-specific countercyclical capital buffers, liquidity support mechanisms, and targeted stress tests under credit and funding constraints, to stop the rapid spread of contagion during times of market turbulence because the industrial sector responds quickly to market shocks. On the other hand, the high level of long-term volatility in the energy industry points to the necessity of a more structured approach to risk management. Addressing these more profound vulnerabilities would be made easier by incorporating systemic risk assessments into policy frameworks, especially those connected to global energy and commodity cycles. Therefore, it is recommended to implement a two-tier monitoring strategy, one for controlling short-term liquidity risks in industrial markets and another for reducing long-term structural vulnerability in the energy sector. In order to improve regulatory supervision and the overall resilience of GCC financial markets, such a framework should integrate specific financial stress metrics, such as credit spreads, financing constraints, and volatility indicators, into sector-focused early warning systems.
The findings show that there are notable volatility spillovers into GCC equities markets from changes in the Bitcoin Sentiment Index (BSI), which measures changes in investor fear and greed. Over longer time horizons, the Energy, Materials, and Telecommunications sectors have the largest sensitivity to these sentiment-driven shocks, while the Energy and Industrial sectors seem to be the most vulnerable in the short term. From a regulatory standpoint, long-term policy frameworks ought to prioritize the implementation of countercyclical capital buffers, improved disclosure of vulnerabilities relating to cryptocurrency, and more robust funding arrangements, particularly for businesses that operate in the most susceptible industries. Supervisory authorities are also urged to enhance model governance by restricting concentrated exposures to businesses that rely on funding connected to cryptocurrencies and making sure that risk assessments specifically take sentiment-induced changes in market regimes into consideration. While promoting more stable and sustainable sectoral financing channels, additional safeguards—such as increased cross-border cooperation among regulators and tighter market integrity standards—would help lessen the systemic vulnerability of GCC markets to volatility shocks produced by cryptocurrencies. Additionally, supervisors have to think about incorporating attitude indicators like the BSI into their more comprehensive monitoring systems. Creating early-warning dashboards to monitor the spread of volatility across many markets is one way to do this. To safeguard the Energy and Industrial sectors during times of significant sentiment-driven volatility, authorities are urged to implement flexible margin and collateral regulations, conduct sector-specific stress tests, and offer short-term liquidity assistance. In the same way, money market funds and other financial intermediaries should keep adequate liquidity reserves, shorten the duration of their portfolios, and distribute their investments among industries like consumer staples that are less impacted by market sentiment related to cryptocurrencies in order to increase the overall stability of financial markets.
In the long run, the necessity of incorporating systemic risk assessments into regulatory supervision is underscored by the Energy, Materials, and Real Estate sectors’ natural susceptibility to global volatility, particularly from the U.S. (CBOE VIX) and European (VSTOXX-50) markets. It is important to create supervisory frameworks that particularly address the risks associated with fluctuations in commodity prices and flaws in real estate finance arrangements. Similarly, money market funds may increase their resilience by limiting exposure to certain sectors, keeping enough liquidity reserves, and using early warning signs of volatility to guide their investment choices and portfolio planning. Regulators should mandate targeted stress testing, short-term liquidity support tools, and countercyclical capital buffers to contain contagion risks during turbulent times, as industries such as industrials, health care, and energy tend to respond more strongly to volatility shocks from U.S. and European markets. By reducing portfolio maturities, expanding holdings in high-quality liquid assets and more stable industries like consumer staples, and modifying counterparty exposures to reduce vulnerabilities in sectors most impacted by volatility—specifically, industrials, health care, and energy—money market funds can further improve their risk management at the same time.
Utilizing daily GCC sectoral equity data to investigate volatility spillovers from the BSI, FSI, VIX, and VSTOXX-50 indexes is a significant constraint of this research. Intraday data might be useful for future studies to further examine the effects of shocks from global uncertainty indicators on realized semi-variances and differentiate between upward and downward volatility swings. This method would enhance knowledge of the effects of uncertainty metrics, especially the VIX, VSTOXX-50, BSI, and FSI, on both positive and negative volatility patterns in GCC sectors. Another drawback of the study is its sole dependence on European and American equities market uncertainty indexes. A more comprehensive understanding of global risk transmission would be possible by extending the research to incorporate implied volatility indicators from other significant GCC trading partners, including China, the UK, and Japan. In addition, the existing analysis of time-varying spillovers is limited to three significant crises: the COVID-19 pandemic, the war between Russia and Ukraine, and the failure of Silicon Valley Bank. Future research that incorporates other geopolitical events, such the Israel-Iran war or Indo-Pakistan tensions, may provide a more thorough understanding of how volatility transmission changes under various global uncertainty scenarios.
Author Contributions
Conceptualization, M.I.T., M.M., S.S.I.; methodology, M.I.T., Ş.C.G., S.S.I., A.H.; validation, M.I.T., Ş.C.G., S.S.I.; writing—original draft, M.I.T., S.S.I., A.H.; literature review, M.I.T., S.S.I., M.M., A.H., Ş.C.G.; results, A.H.; supervision, Ş.C.G.; resources, M.M. and AH. All authors have read and agreed to the published version of the manuscript.
Funding
This research received no external funding.
Institutional Review Board Statement
Not applicable.
Informed Consent Statement
Not applicable.
Data Availability Statement
The data supporting the conclusions of this article will be made available by the authors on request.
Conflicts of Interest
The authors declare no conflict of interest.
Notes
| 1 | This research employs the U.S. Department of Treasury’s disaggregated global Financial Stress Indicators (FSI), which encompass measures such as “equity market valuation”, “volatility” trends, “funding” constraints, disruption in “credit” activities, and the transition of investors towards the “safe-haven” assets. Existing studies also shed light on the importance of these financial stress indicators in the forecasting frameworks. For instance, Elsayed and Yarovaya (2019) examined whether the aggregated value of the FSI are influenced during the Arab spring. On the contrary, C. Liang et al. (2023) also stated that aggregated value of the FSI outperforms other uncertainty indicators like geopolitical uncertainty and U.S. economic uncertainty in explaining the fluctuations within the equity market returns. |
| 2 | The Bitcoin Sentiment Index (BSI) reflects the overall attitude of cryptocurrency investors by merging various market indicators into a single composite score ranging from 0 to 100. The scores above 75 signifies extreme greed due to increase in buying behavior of Bitcoins amid upward shift in prices. Whereas, a score below 25 reflects the extreme fear due to the higher selling activity amid bearish bitcoin market conditions. |
| 3 | In this study, the notion of “shock transmission” and “spillover mechanism” is understood to represent a predictive and variance-decomposition-based connectivity framework that assesses the degree to which changes in the forecast error variance of one series are impacted by innovations in another, in different time and frequency domains. The directional spillover mechanisms or shock diffusion channels by which disturbances from the VIX, VSTOXX-50, BSI, and FSI spread into the GCC sectoral volatility framework are highlighted in this view rather than making explicit claims about causal relationships. Shahbaz et al. (2024) evaluated the transmission of shocks from climate-related uncertainty to industrial metal markets using the time-varying parameter VAR (TVP-VAR) framework in accordance with this methodological basis. |
References
- Adams, Z., & Glück, T. (2015). Financialization in commodity markets: A passing trend or the new normal? Journal of Banking & Finance, 60, 93–111. [Google Scholar] [CrossRef]
- Ahmed, S. I., & Randewich, N. (2020, August 18). Say goodbye to the shortest bear market in S&P 500 history. Reuters. Available online: https://www.reuters.com/article/business/say-goodbye-to-the-shortest-bear-market-in-sp-500-history-idUSKCN25E2R8/ (accessed on 1 January 2025).
- Ahmed, W. M. A. (2021a). How do Islamic equity markets respond to good and bad volatility of cryptocurrencies? The case of Bitcoin. Pacific-Basin Finance Journal, 70, 101667. [Google Scholar] [CrossRef]
- Ahmed, W. M. A. (2021b). Stock market reactions to upside and downside volatility of Bitcoin: A quantile analysis. The North American Journal of Economics and Finance, 57, 101379. [Google Scholar] [CrossRef]
- Äijö, J. (2008). Implied volatility term structure linkages between VDAX, VSMI and VSTOXX volatility indices. Global Finance Journal, 18(3), 290–302. [Google Scholar] [CrossRef]
- Akhtaruzzaman, M., Boubaker, S., Lucey, B. M., & Sensoy, A. (2021a). Is gold a hedge or a safe-haven asset in the COVID–19 crisis? Economic Modelling, 102, 105588. [Google Scholar] [CrossRef]
- Akhtaruzzaman, M., Boubaker, S., & Sensoy, A. (2021b). Financial contagion during COVID–19 crisis. Finance Research Letters, 38, 101604. [Google Scholar] [CrossRef]
- Al-Fayoumi, N., Bouri, E., & Abuzayed, B. (2023). Decomposed oil price shocks and GCC stock market sector returns and volatility. Energy Economics, 126, 106930. [Google Scholar] [CrossRef]
- Ali, S., Naveed, M., Hanif, H., & Gubareva, M. (2024). The resilience of Shariah-compliant investments: Probing the static and dynamic connectedness between gold-backed cryptocurrencies and GCC equity markets. International Review of Financial Analysis, 91, 103045. [Google Scholar] [CrossRef]
- Aliani, K., Al-kayed, L., & Boujlil, R. (2022). COVID-19 effect on Islamic vs. conventional banks’ stock prices: Case of GCC countries. The Journal of Economic Asymmetries, 26, e00263. [Google Scholar] [CrossRef]
- Alotaibi, A. R., & Mishra, A. V. (2015). Global and regional volatility spillovers to GCC stock markets. Economic Modelling, 45, 38–49. [Google Scholar] [CrossRef]
- Altman, E. I., Hu, X., & Yu, J. (2022). Has the Evergrande debt crisis rattled Chinese capital markets? A series of event studies and their implications. Finance Research Letters, 50, 103247. [Google Scholar] [CrossRef]
- Antonakakis, N., Chatziantoniou, I., & Gabauer, D. (2020). Refined measures of dynamic connectedness based on Time-Varying Parameter Vector autoregressions. Journal of Risk and Financial Management, 13(4), 84. [Google Scholar] [CrossRef]
- Apergis, N., Mustafa, G., & Malik, S. (2023). The role of the COVID-19 pandemic in US market volatility: Evidence from the VIX index. The Quarterly Review of Economics and Finance, 89, 27–35. [Google Scholar] [CrossRef]
- Apostolakis, G. N., Floros, C., Gkillas, K., & Wohar, M. (2021a). Financial stress, economic policy uncertainty, and oil price uncertainty. Energy Economics, 104, 105686. [Google Scholar] [CrossRef]
- Apostolakis, G. N., Floros, C., Gkillas, K., & Wohar, M. (2021b). Political uncertainty, COVID-19 pandemic and stock market volatility transmission. Journal of International Financial Markets, Institutions and Money, 74, 101383. [Google Scholar] [CrossRef]
- Baele, L. (2005). Volatility spillover effects in European equity markets. Journal of Financial and Quantitative Analysis, 40(2), 373–401. [Google Scholar] [CrossRef]
- Bakas, D., & Triantafyllou, A. (2020). Commodity price volatility and the economic uncertainty of pandemics. Economics Letters, 193, 109283. [Google Scholar] [CrossRef]
- Balcilar, M., Elsayed, A. H., & Hammoudeh, S. (2023). Financial connectedness and risk transmission among MENA countries: Evidence from connectedness network and clustering analysis1. Journal of International Financial Markets, Institutions and Money, 82, 101656. [Google Scholar] [CrossRef]
- Balcilar, M., Gabauer, D., & Umar, Z. (2021). Crude Oil futures contracts and commodity markets: New evidence from a TVP-VAR extended joint connectedness approach. Resources Policy, 73, 102219. [Google Scholar] [CrossRef]
- Balli, F., Hasan, M., Ozer-Balli, H., & Gregory-Allen, R. (2021). Why do US uncertainties drive stock market spillovers? International evidence. International Review of Economics & Finance, 76, 288–301. [Google Scholar] [CrossRef]
- Bandyopadhyay, S. (2024, February 19). UAE crypto investors realised estimated gains of $200 million in 2023. Khaleej Times. Available online: https://www.khaleejtimes.com/business/cryptocurrency/uae-crypto-investors-realised-estimated-gains-of-200-million-in-2023 (accessed on 14 August 2025).
- Baruník, J., & Křehlík, T. (2018). Measuring the frequency dynamics of financial connectedness and systemic risk. Journal of Financial Econometrics, 16(2), 271–296. [Google Scholar] [CrossRef]
- Bazán-Palomino, W. (2023). The increased interest in Bitcoin and the immediate and long-term impact of Bitcoin volatility on global stock markets. Economic Analysis and Policy, 80, 1080–1095. [Google Scholar] [CrossRef]
- Bekaert, G., Harvey, C. R., & Lundblad, C. (2005). Does financial liberalization spur growth? Journal of Financial Economics, 77(1), 3–55. [Google Scholar] [CrossRef]
- BenSaïda, A. (2019). Good and bad volatility spillovers: An asymmetric connectedness. Journal of Financial Markets, 43, 78–95. [Google Scholar] [CrossRef]
- Bitget Research. (2024). UAE leads crypto adoption in the Middle East with 72% of local users investing in Bitcoin. Zawya. Available online: https://www.zawya.com/en/press-release/research-and-studies/uae-leads-crypto-adoption-in-the-middle-east-with-72-of-local-users-investing-in-bitcoin-bitget-research-l9tbl2l5 (accessed on 1 January 2025).
- Boubaker, S., Goodell, J. W., Pandey, D. K., & Kumari, V. (2022). Heterogeneous impacts of wars on global equity markets: Evidence from the invasion of Ukraine. Finance Research Letters, 48, 102934. [Google Scholar] [CrossRef]
- Bouri, E., Hammoud, R., & Kassm, C. A. (2023). The effect of oil implied volatility and geopolitical risk on GCC stock sectors under various market conditions. Energy Economics, 120, 106617. [Google Scholar] [CrossRef]
- Bouteska, A., Mefteh-Wali, S., & Dang, T. (2022). Predictive power of investor sentiment for Bitcoin returns: Evidence from COVID-19 pandemic. Technological Forecasting and Social Change, 184, 121999. [Google Scholar] [CrossRef]
- Browne, R. (2021, May 13). Why Elon Musk is worried about Bitcoin’s environmental impact. CNBC. Available online: https://www.cnbc.com/2021/05/13/why-elon-musk-is-worried-about-bitcoin-environmental-impact.html (accessed on 17 August 2025).
- Browne, R., & Sigalos, M. (2024, July 5). Mt. Gox begins repaying Bitcoin to creditors a decade on from collapse. CNBC. Available online: https://www.cnbc.com/2024/07/05/mt-gox-begins-repaying-bitcoin-to-creditors-a-decade-on-from-collapse.html (accessed on 17 August 2025).
- Brunnermeier, M. K., & Pedersen, L. H. (2009). Market liquidity and funding liquidity. The Review of Financial Studies, 22(6), 2201–2238. [Google Scholar] [CrossRef]
- Caldara, D., Iacoviello, M., Molligo, P., Prestipino, A., & Raffo, A. (2020). The economic effects of trade policy uncertainty. Journal of Monetary Economics, 109, 38–59. [Google Scholar] [CrossRef]
- Cavallaro, E., & Cutrini, E. (2019). Distance and beyond: What drives financial flows to emerging economies? Economic Modelling, 81, 533–550. [Google Scholar] [CrossRef]
- Chan, J. Y.-L., Phoong, S. W., Phoong, S. Y., Cheng, W. K., & Chen, Y.-L. (2023). The bitcoin halving cycle volatility dynamics and safe haven-hedge properties: A MSGARCH approach. Mathematics, 11(3), 698. [Google Scholar] [CrossRef]
- Chatziantoniou, I., & Gabauer, D. (2021). EMU risk-synchronisation and financial fragility through the prism of dynamic connectedness. The Quarterly Review of Economics and Finance, 79, 1–14. [Google Scholar] [CrossRef]
- Chatziantoniou, I., Gabauer, D., & Gupta, R. (2023). Integration and risk transmission in the market for crude oil: New evidence from a time-varying parameter frequency connectedness approach. Resources Policy, 84, 103729. [Google Scholar] [CrossRef]
- Chau, F., & Deesomsak, R. (2014). Does linkage fuel the fire? The transmission of financial stress across the markets. International Review of Financial Analysis, 36, 57–70. [Google Scholar] [CrossRef]
- Chen, B., & Sun, Y. (2022). The impact of VIX on China’s financial market: A new perspective based on high-dimensional and time-varying methods. The North American Journal of Economics and Finance, 63, 101831. [Google Scholar] [CrossRef]
- Chen, B., & Sun, Y. (2024). Financial market connectedness between the U.S. and China: A new perspective based on non-linear causality networks. Journal of International Financial Markets, Institutions and Money, 90, 101886. [Google Scholar] [CrossRef]
- Chen, L., Verousis, T., Wang, K., & Zhou, Z. (2023). Financial stress and commodity price volatility. Energy Economics, 125, 106874. [Google Scholar] [CrossRef]
- Chen, X., Yao, Y., Wang, L., & Huang, S. (2024). How EPU, VIX, and GPR interact with the dynamic connectedness among commodity and financial markets: Evidence from wavelet analysis. The North American Journal of Economics and Finance, 74, 102217. [Google Scholar] [CrossRef]
- Cheng, T., Liu, F., Liu, J., & Yao, W. (2024). Tail connectedness: Measuring the volatility connectedness network of equity markets during crises. Pacific-Basin Finance Journal, 87, 102497. [Google Scholar] [CrossRef]
- Cipollini, A., & Mikaliunaite, I. (2020). Macro-uncertainty and financial stress spillovers in the Eurozone. Economic Modelling, 89, 546–558. [Google Scholar] [CrossRef]
- Dang, T. H.-N., Nguyen, C. P., Lee, G. S., Nguyen, B. Q., & Le, T. T. (2023). Measuring the energy-related uncertainty index. Energy Economics, 124, 106817. [Google Scholar] [CrossRef]
- Dankwah, B., Abakah, E. J. A., Agbloyor, E. K., & Lee, C.-C. (2025). Dynamic connections between Africa’s emerging equity markets and global financial assets. Emerging Markets Review, 68, 101337. [Google Scholar] [CrossRef]
- Dickey, D. A., & Fuller, W. A. (1981). Likelihood Ratio Statistics for Autoregressive Time Series with a Unit Root. Econometrica, 49(4), 1057–1072. [Google Scholar] [CrossRef]
- Diebold, F. X., & Yilmaz, K. (2012). Better to give than to receive: Predictive directional measurement of volatility spillovers. International Journal of Forecasting, 28(1), 57–66. [Google Scholar] [CrossRef]
- Diniz-Maganini, N., Diniz, E. H., & Rasheed, A. A. (2021). Bitcoin’s price efficiency and safe haven properties during the COVID-19 pandemic: A comparison. Research in International Business and Finance, 58, 101472. [Google Scholar] [CrossRef] [PubMed]
- Dutta, A. (2018). Oil and energy sector stock markets: An analysis of implied volatility indexes. Journal of Multinational Financial Management, 44, 61–68. [Google Scholar] [CrossRef]
- Elsayed, A. H., Gozgor, G., & Lau, C. K. M. (2022). Risk transmissions between bitcoin and traditional financial assets during the COVID-19 era: The role of global uncertainties. International Review of Financial Analysis, 81, 102069. [Google Scholar] [CrossRef]
- Elsayed, A. H., & Yarovaya, L. (2019). Financial stress dynamics in the MENA region: Evidence from the Arab Spring. Journal of International Financial Markets, Institutions and Money, 62, 20–34. [Google Scholar] [CrossRef]
- Endri, E., Fauzi, F., & Effendi, M. S. (2024). Integration of the Indonesian stock market with eight major trading partners’ stock markets. Economies, 12(12), 350. [Google Scholar] [CrossRef]
- Espinoza, R., Fayad, G., & Prasad, A. (2013). The macroeconomics of the Arab States of the Gulf. Oxford University Press. Available online: https://www.elibrary.imf.org/display/book/9780199683796/9780199683796.xml (accessed on 1 January 2025).
- European Commission. (2022). Joint communication to the European Parliament and the Council: A strategic partnership with the Gulf (2022). European External Action Service. Available online: https://www.eeas.europa.eu/sites/default/files/documents/Joint%20Communication%20to%20the%20European%20Parliament%20and%20the%20Council%20-%20A%20Strategic%20Partnership%20with%20the%20Gulf.pdf (accessed on 10 August 2025).
- European Commission. (2025). EU trade relations with the Gulf region—Facts, figures and latest developments. Directorate-General for Trade. Available online: https://policy.trade.ec.europa.eu/eu-trade-relationships-country-and-region/countries-and-regions/gulf-region_en (accessed on 10 August 2025).
- European Union External Action Service. (2021). Gulf Cooperation Council (GCC) and the EU. Available online: https://www.eeas.europa.eu/eeas/gulf-cooperation-council-gcc-and-eu_en (accessed on 10 August 2025).
- Fink, F., & Schüler, Y. S. (2015). The transmission of US systemic financial stress: Evidence for emerging market economies. Journal of International Money and Finance, 55, 6–26. [Google Scholar] [CrossRef]
- Gaies, B., Nakhli, M. S., Sahut, J.-M., & Schweizer, D. (2023). Interactions between investors’ fear and greed sentiment and Bitcoin prices. The North American Journal of Economics and Finance, 67, 101924. [Google Scholar] [CrossRef]
- Gilchrist, S., Yankov, V., & Zakrajšek, E. (2009). Credit market shocks and economic fluctuations: Evidence from corporate bond and stock markets. Journal of Monetary Economics, 56(4), 471–493. [Google Scholar] [CrossRef]
- Gorman, M., & Hughen, W. K. (2024). Does bitcoin still enhance an investment portfolio in a post Covid-19 world? Finance Research Letters, 62, 105170. [Google Scholar] [CrossRef]
- Guiso, L., Sapienza, P., & Zingales, L. (2018). Time varying risk aversion. Journal of Financial Economics, 128(3), 403–421. [Google Scholar] [CrossRef]
- Güler, D. (2023). The impact of investor sentiment on bitcoin returns and conditional volatilities during the era of COVID-19. Journal of Behavioral Finance, 24(3), 276–289. [Google Scholar] [CrossRef]
- Gulf Insider. (2024, March 19). UAE investors gain $204M from crypto investments in 2023. Gulf Insider. Available online: https://www.gulf-insider.com/uae-investors-gain-204m-from-crypto-investments-in-2023 (accessed on 1 January 2025).
- Guo, L., & Zhong, L.-X. (2025). Risk spillover and hedging effects between stock markets and cryptocurrency markets depending upon network analysis. The North American Journal of Economics and Finance, 80, 102524. [Google Scholar] [CrossRef]
- Haddad, H. B., Mezghani, I., & Al Dohaiman, M. (2020). Common shocks, common transmission mechanisms and time-varying connectedness among Dow Jones Islamic stock market indices and global risk factors. Economic Systems, 44(2), 100760. [Google Scholar] [CrossRef]
- Harvey, A., Ruiz, E., & Sentana, E. (1992). Unobserved component time series models with ARCH disturbances. Journal of Econometrics, 52(1–2), 129–157. [Google Scholar] [CrossRef]
- Hasan, M. B., Mahi, M., Hassan, M. K., & Bhuiyan, A. B. (2021). Impact of COVID-19 pandemic on stock markets: Conventional vs. Islamic indices using wavelet-based multi-timescales analysis. The North American Journal of Economics and Finance, 58, 101504. [Google Scholar] [CrossRef]
- He, X., Mishra, S., Aman, A., Shahbaz, M., Razzaq, A., & Sharif, A. (2021). The linkage between clean energy stocks and the fluctuations in oil price and financial stress in the US and Europe? Evidence from QARDL approach. Resources Policy, 72, 102021. [Google Scholar] [CrossRef]
- Hippler, W. J., & Hassan, M. K. (2015). The impact of macroeconomic and financial stress on the U.S. financial sector. Journal of Financial Stability, 21, 61–80. [Google Scholar] [CrossRef]
- Hoque, M. E., Billah, M., Kapar, B., & Naeem, M. A. (2024). Quantifying the volatility spillover dynamics between financial stress and US financial sectors: Evidence from QVAR connectedness. International Review of Financial Analysis, 95, 103434. [Google Scholar] [CrossRef]
- Ilesanmi, K. D., & Tewari, D. D. (2020). Financial stress index and economic activity in South Africa: New evidence. Economies, 8(4), 110. [Google Scholar] [CrossRef]
- IMARC Group. (2024). GCC cryptocurrency market size, share, growth and forecast 2025–2033. IMARC Group. Available online: https://www.imarcgroup.com/gcc-cryptocurrency-market (accessed on 1 January 2025).
- Iqbal, N., Naeem, M. A., & Suleman, M. T. (2022). Quantifying the asymmetric spillovers in sustainable investments. Journal of International Financial Markets, Institutions and Money, 77, 101480. [Google Scholar] [CrossRef]
- Jia, B., Shen, D., & Zhang, W. (2024). Bitcoin market reactions to large price swings of international stock markets. International Review of Economics & Finance, 90, 72–88. [Google Scholar] [CrossRef]
- Jolly, J. (2020, November 30). Bitcoin price hits all-time high of almost $20,000. The Guardian. Available online: https://www.theguardian.com/technology/2020/nov/30/bitcoin-price-hits-all-time-high-of-almost-20000#:~:text=The%20price%20of%20bitcoin%20has,CoinDesk%2C%20a%20bitcoin%20price%20index (accessed on 1 January 2025).
- Kannan, M. P., & Köhler-Geib, F. (2009). The uncertainty channel of contagion. International Monetary Fund. [Google Scholar]
- Kapar, B., Billah, S. M., Rana, F., & Balli, F. (2024). An investigation of the frequency dynamics of spillovers and connectedness among GCC sectoral indices. International Review of Economics & Finance, 89, 1442–1467. [Google Scholar] [CrossRef]
- Kasal, S. (2023). What are the effects of financial stress on economic activity and government debt? An empirical examination in an emerging economy. Borsa Istanbul Review, 23(1), 254–267. [Google Scholar] [CrossRef]
- Khalfaoui, R., Ben Jabeur, S., & Dogan, B. (2022). The spillover effects and connectedness among green commodities, Bitcoins, and US stock markets: Evidence from the quantile VAR network. Journal of Environmental Management, 306, 114493. [Google Scholar] [CrossRef] [PubMed]
- Khalfaoui, R., Hammoudeh, S., & Rehman, M. Z. (2023). Spillovers and connectedness among BRICS stock markets, cryptocurrencies, and uncertainty: Evidence from the quantile vector autoregression network. Emerging Markets Review, 54, 101002. [Google Scholar] [CrossRef]
- Kirci Altinkeski, B., Dibooglu, S., Cevik, E. I., Kilic, Y., & Bugan, M. F. (2024). Quantile connectedness between VIX and global stock markets. Borsa Istanbul Review, 24, 71–79. [Google Scholar] [CrossRef]
- Kirimhan, D., Payne, J. E., & AlKhazali, O. (2024). Herd behavior in U.S. bank stocks. Finance Research Letters, 67, 105930. [Google Scholar] [CrossRef]
- Kodres, L. E., & Pritsker, M. (2002). A rational expectations model of financial contagion. The Journal of Finance, 57(2), 769–799. [Google Scholar] [CrossRef]
- Koop, G., & Korobilis, D. (2014). A new index of financial conditions. European Economic Review, 71, 101–116. [Google Scholar] [CrossRef]
- Koop, G., Pesaran, M. H., & Potter, S. M. (1996). Impulse response analysis in nonlinear multivariate models. Journal of Econometrics, 74(1), 119–147. [Google Scholar] [CrossRef]
- Lane, P. R. (2024, March 11). The 2021–2022 inflation surges and monetary policy in the euro area [Blog post]. European Central Bank (ECB). Available online: https://www.ecb.europa.eu/press/blog/date/2024/html/ecb.blog240311~968c707650.en.html (accessed on 1 January 2025).
- Lang, C., Hu, Y., Corbet, S., & Hou, Y. (2024). Tail risk connectedness in G7 stock markets: Understanding the impact of COVID-19 and related variants. Journal of Behavioral and Experimental Finance, 41, 100889. [Google Scholar] [CrossRef]
- Le, T.-L., Abakah, E. J. A., & Tiwari, A. K. (2021). Time and frequency domain connectedness and spill-over among fintech, green bonds and cryptocurrencies in the age of the fourth industrial revolution. Technological Forecasting and Social Change, 162, 120382. [Google Scholar] [CrossRef]
- Li, D., Zhang, F., & Li, X. (2022). Can U.S. trade policy uncertainty help in predicting stock market excess return? Finance Research Letters, 49, 103136. [Google Scholar] [CrossRef]
- Li, S. (2022). Spillovers between bitcoin and meme stocks. Finance Research Letters, 50, 103218. [Google Scholar] [CrossRef]
- Liang, C., Luo, Q., Li, Y., & Duc Toan Huyn, L. (2023). Global financial stress index and long-term volatility forecast for international stock markets. Journal of International Financial Markets, Institutions and Money, 88, 101825. [Google Scholar] [CrossRef]
- Liu, P., & Yuan, Y. (2024). Is Bitcoin a hedge or safe-haven asset during the period of turmoil? Evidence from the currency, bond and stock markets. International Review of Financial Analysis, 96, 103663. [Google Scholar] [CrossRef]
- Liu, Y., & Wang, K. (2024). Asymmetric impacts of coal prices, fintech, and financial stress on clean energy stocks. Resources Policy, 92, 104954. [Google Scholar] [CrossRef]
- Longstaff, F. A. (2010). The subprime credit crisis and contagion in financial markets. Journal of Financial Economics, 97(3), 436–450. [Google Scholar] [CrossRef]
- Ma, R. R., Xiong, T., & Bao, Y. (2021). The Russia-Saudi Arabia oil price war during the COVID-19 pandemic. Energy Economics, 102, 105517. [Google Scholar] [CrossRef]
- Macfarlane, E. K. (2020). Strengthening sanctions: Solutions to curtail the evasion of international economic sanctions through the use of cryptocurrency. Michigan Journal of International Law, 42, 199. [Google Scholar] [CrossRef]
- Mensi, W., Ur Rehman, M., Maitra, D., Hamed Al-Yahyaee, K., & Sensoy, A. (2020). Does bitcoin co-move and share risk with Sukuk and world and regional Islamic stock markets? Evidence using a time-frequency approach. Research in International Business and Finance, 53, 101230. [Google Scholar] [CrossRef]
- Mercik, A., Słoński, T., & Karaś, M. (2024). Understanding crypto-asset exposure: An investigation of its impact on performance and stock sensitivity among listed companies. International Review of Financial Analysis, 92, 103070. [Google Scholar] [CrossRef]
- Mining Grid. (2024, September 30). UAE crypto inflows top $34 billion, highlighting strong market growth. FF News. Available online: https://ffnews.com/newsarticle/cryptocurrency/uae-crypto-inflows-growth-2025 (accessed on 1 January 2025).
- Mokni, K., Bouteska, A., & Nakhli, M. S. (2022). Investor sentiment and Bitcoin relationship: A quantile-based analysis. The North American Journal of Economics and Finance, 60, 101657. [Google Scholar] [CrossRef]
- Musholombo, B. (2023). Cryptocurrencies and stock market fluctuations. Economics Letters, 233, 111427. [Google Scholar] [CrossRef]
- Naeem, M. A., Chatziantoniou, I., Gabauer, D., & Karim, S. (2024). Measuring the G20 stock market return transmission mechanism: Evidence from the R2 connectedness approach. International Review of Financial Analysis, 91, 102986. [Google Scholar] [CrossRef]
- Nguyen, K. Q. (2022). The correlation between the stock market and Bitcoin during COVID-19 and other uncertainty periods. Finance Research Letters, 46, 102284. [Google Scholar] [CrossRef]
- Pascoe, L. (2019). Digital currency exchanges, ICOs and insolvency: The story so far. Insolvency and Restructuring International, 13, 5. [Google Scholar]
- Pavabutr, P., & Yan, H. (2007). The impact of foreign portfolio flows on emerging market volatility: Evidence from Thailand. Australian Journal of Management, 32(2), 345–368. [Google Scholar] [CrossRef]
- Pesaran, H. H., & Shin, Y. (1998). Generalized impulse response analysis in linear multivariate models. Economics Letters, 58(1), 17–29. [Google Scholar] [CrossRef]
- Phillips, P. C. B., & Perron, P. (1988). Testing for a unit root in time series regression. Biometrika, 75(2), 335–346. [Google Scholar] [CrossRef]
- Rahman, M. L., Amin, A., & Al Mamun, M. A. (2021). The COVID-19 outbreak and stock market reactions: Evidence from Australia. Finance Research Letters, 38, 101832. [Google Scholar] [CrossRef]
- Raouf, H., & Ahmed, H. (2022). Risk governance and financial stability: A comparative study of conventional and Islamic banks in the GCC. Global Finance Journal, 52, 100599. [Google Scholar] [CrossRef]
- Rösch, C. G., & Kaserer, C. (2013). Market liquidity in the financial crisis: The role of liquidity commonality and flight-to-quality. Journal of Banking & Finance, 37(7), 2284–2302. [Google Scholar] [CrossRef]
- Santacreu, A. M. (2020, October 22). The economic effects of the 2018 U.S. trade policy: A state-level analysis. Federal Reserve Bank of St. Louis. Available online: https://research.stlouisfed.org/publications/review/2020/10/22/the-economic-effects-of-the-2018-u-s-trade-policy-a-state-level-analysis (accessed on 1 January 2025).
- Sarwar, G. (2023). Market risks that change US-European equity correlations. Journal of International Financial Markets, Institutions and Money, 83, 101731. [Google Scholar] [CrossRef]
- Schiantarelli, F., Brancati, E., Brianti, M., & Balduzzi, P. (2020, October 27). Populism, political risk and the economy: What we can learn from the Italian experience. VoxEU, CEPR. Available online: https://cepr.org/voxeu/columns/populism-political-risk-and-economy-what-we-can-learn-italian-experience (accessed on 1 January 2025).
- Shahbaz, M., Sheikh, U. A., Tabash, M. I., & Jiao, Z. (2024). Shock transmission between climate policy uncertainty, financial stress indicators, oil price uncertainty and industrial metal volatility: Identifying moderators, hedgers and shock transmitters. Energy Economics, 136, 107732. [Google Scholar] [CrossRef]
- Shen, Y.-Y., Jiang, Z.-Q., Ma, J.-C., Wang, G.-J., & Zhou, W.-X. (2022). Sector connectedness in the Chinese stock markets. Empirical Economics, 62(2), 825–852. [Google Scholar] [CrossRef]
- Shi, Y., & Wang, L. (2023). Comparing the impact of Chinese and U.S. economic policy uncertainty on the volatility of major global stock markets. Global Finance Journal, 57, 100860. [Google Scholar] [CrossRef]
- Singh, A., & Singh, M. (2016). Investigating impact of financial stress on FII flows in Indian equity market. Cogent Business & Management, 3(1), 1190263. [Google Scholar] [CrossRef]
- Smales, L. A. (2020). Examining the relationship between policy uncertainty and market uncertainty across the G7. International Review of Financial Analysis, 71, 101540. [Google Scholar] [CrossRef]
- Smales, L. A. (2022). Spreading the fear: The central role of CBOE VIX in global stock market uncertainty. Global Finance Journal, 51, 100679. [Google Scholar] [CrossRef]
- Soltani, H., & Abbes, M. B. (2025). Regime-specific spillover effects between financial stress, GCC stock markets, brent crude oil, and the gold market. Journal of the Knowledge Economy, 16(2), 8840–8866. [Google Scholar] [CrossRef]
- Stiassny, A. (1996). A spectral decomposition for structural VAR models. Empirical Economics, 21(4), 535–555. [Google Scholar] [CrossRef]
- Tedeschi, M., Foglia, M., Bouri, E., & Dai, P.-F. (2024). How does climate policy uncertainty affect financial markets? Evidence from Europe. Economics Letters, 234, 111443. [Google Scholar] [CrossRef]
- The Economist. (2018, October 27). The European Commission rejects Italy’s budget. The Economist. Available online: https://www.economist.com/europe/2018/10/27/the-european-commission-rejects-italys-budget (accessed on 1 January 2025).
- The Economist. (2022, December 5). Political instability in Italy has always affected reform. The Economist. Available online: https://www.economist.com/special-report/2022/12/05/political-instability-in-italy-has-always-affected-reform (accessed on 1 January 2025).
- The National. (2024, March 16). UAE cryptocurrency investors realised gains worth $204m in 2023. The National News. Available online: https://www.thenationalnews.com/business/money/2024/03/16/uae-cryptocurrency-investors-realised-gains-worth-204m-in-2023 (accessed on 1 January 2025).
- Tissaoui, K., & Zaghdoudi, T. (2021). Dynamic connectedness between the U.S. financial market and Euro-Asian financial markets: Testing transmission of uncertainty through spatial regressions models. The Quarterly Review of Economics and Finance, 81, 481–492. [Google Scholar] [CrossRef]
- Tronzano, M. (2020). Safe-haven assets, financial crises, and macroeconomic variables: Evidence from the last two decades (2000–2018). Journal of Risk and Financial Management, 13(3), 40. [Google Scholar] [CrossRef]
- Voronkova, S. (2004). Equity market integration in Central European emerging markets: A cointegration analysis with shifting regimes. International Review of Financial Analysis, 13(5), 633–647. [Google Scholar] [CrossRef]
- World Bank Group. (2018, September 17). Argentina: Escaping crises, sustaining growth, sharing prosperity (Systematic Country Diagnostic). World Bank. Available online: https://documents1.worldbank.org/curated/en/696121537806645724/pdf/Argentina-Systematic-Country-Diagnostic-09172018.pdf (accessed on 1 January 2025).
- Wu, X., He, Q., & Xie, H. (2023). Forecasting VIX with time-varying risk aversion. International Review of Economics & Finance, 88, 458–475. [Google Scholar] [CrossRef]
- Xu, L., & Kinkyo, T. (2023). Hedging effectiveness of bitcoin and gold: Evidence from G7 stock markets. Journal of International Financial Markets, Institutions and Money, 85, 101764. [Google Scholar] [CrossRef]
- Xu, Y., Liang, C., & Wang, J. (2023). Financial stress and returns predictability: Fresh evidence from China. Pacific-Basin Finance Journal, 78, 101980. [Google Scholar] [CrossRef]
- Yadav, M. P., Rao, A., Abedin, M. Z., Tabassum, S., & Lucey, B. (2023). The domino effect: Analyzing the impact of Silicon Valley Bank’s fall on top equity indices around the world. Finance Research Letters, 55, 103952. [Google Scholar] [CrossRef]
- Yarovaya, L., Elsayed, A. H., & Hammoudeh, S. (2021). Determinants of spillovers between Islamic and conventional financial markets: Exploring the safe haven assets during the COVID-19 pandemic. Finance Research Letters, 43, 101979. [Google Scholar] [CrossRef]
- Yıldırım-Karaman, S. (2018). Uncertainty in financial markets and business cycles. Economic Modelling, 68, 329–339. [Google Scholar] [CrossRef]
- Younis, I., Naeem, M. A., Shah, W. U., & Tang, X. (2025). Inter- and intra-connectedness between energy, gold, Bitcoin, and Gulf cooperation council stock markets: New evidence from various financial crises. Research in International Business and Finance, 73, 102548. [Google Scholar] [CrossRef]
- Yousaf, I., Beljid, M., Chaibi, A., & Ajlouni, A. A. L. (2022). Do volatility spillover and hedging among GCC stock markets and global factors vary from normal to turbulent periods? Evidence from the global financial crisis and COVID-19 pandemic crisis. Pacific-Basin Finance Journal, 73, 101764. [Google Scholar] [CrossRef]
- Zhang, Q., Zhang, Z., & Luo, J. (2024). Asymmetric and high-order risk transmission across VIX and Chinese futures markets. International Review of Financial Analysis, 93, 103114. [Google Scholar] [CrossRef]
- Zhang, Y., & Mao, J. (2022). COVID-19′s impact on the spillover effect across the Chinese and U.S. stock markets. Finance Research Letters, 47, 102684. [Google Scholar] [CrossRef]
- Zhang, Y.-J., Chevallier, J., & Guesmi, K. (2017). “De-financialization” of commodities? Evidence from stock, crude oil and natural gas markets. Energy Economics, 68, 228–239. [Google Scholar] [CrossRef]
- Zhao, J., & Zhang, T. (2023). Exploring the time-varying dependence between Bitcoin and the global stock market: Evidence from a TVP-VAR approach. Finance Research Letters, 58, 104342. [Google Scholar] [CrossRef]
- Zupan, V. (2021, April 12). GCC countries leading the way in cryptocurrency regulation. Arab News. Available online: https://www.arabnews.com/node/2055281 (accessed on 14 August 2025).


Disclaimer/Publisher’s Note: The statements, opinions and data contained in all publications are solely those of the individual author(s) and contributor(s) and not of MDPI and/or the editor(s). MDPI and/or the editor(s) disclaim responsibility for any injury to people or property resulting from any ideas, methods, instructions or products referred to in the content. |
© 2025 by the authors. Licensee MDPI, Basel, Switzerland. This article is an open access article distributed under the terms and conditions of the Creative Commons Attribution (CC BY) license (https://creativecommons.org/licenses/by/4.0/).