Abstract
International tourism has helped numerous economies and regions over the years in achieving the objective of long-term sustainable economic growth. The “Association of Southeast Asian Nations (ASEAN)” is the rising hub for international tourism due to its rich history, rich vibrant culture, pleasant weather conditions, and beautiful landscape. However, research evidence about the tourism-growth relationship in the context of ASEAN economies is indeed very scarce. Accordingly, this research paper focuses on the members of the ASEAN region to examine the true influence that international tourism has on economic growth. Relevant econometric technique such as the “Fixed Effects (FEF)” is chosen for analysis based on the Hausman test, “Feasible Generalized Least Squares (FGLS)” is used for robustness, and “Two Stages Least Squares (2SLS)” is employed for tackling the likely endogeneity issue. The results show that international tourism has contributed positively to the economic growth of the ASEAN economies. Similarly, openness to global trade and education have also helped the ASEAN economies in securing long run sustainable economic growth. Lastly, the inflation rate has decelerated the pace of economic growth, while government expenditures have accelerated the pace of economic growth among ASEAN members. Our empirical findings are robust to alternative model specifications and alternative econometric estimations. Therefore, we expect our empirical findings to help the policymakers of the ASEAN economies in developing suitable policy responses regarding the growth performance of their economies through the channel of international tourism.
1. Introduction
International tourism has helped numerous economies over the last few decades to achieve better economic performance. International tourism is basically an invisible export, and it is different from the traditional exports in the sense that a consumer visits a country to receive a tourist service (Walton, 2018). International tourism brings multiple benefits for the host economies, including the inflows of precious foreign currencies, which ultimately address the balance of payment issues. There are several channels on which international tourism positively impacts the growth performance of the recipient economy such as through currency earnings, stimulating investment, competition, and employment generation (Brida et al., 2020). Increased international tourism is an alternative export channel, and it helps economies to earn precious foreign currency reserves. International tourism is therefore an integral part of the growth-enhancing strategies specifically for developing and emerging economies in the modern world. Khayrulloevna (2020) rightly pointed out that international tourism is indeed beneficial for the host economy.
Globally, international tourism was adversely impacted by COVID-19. However, international tourism has recovered well and has increased substantially in recent years in all parts of the world. According to the World Tourism Barometer (W.T.B., 2025), international tourism has recovered by 99 percent the pre-pandemic level in 2024. Around 1.4 billion people traveled in 2024, showing a net increase of 11 percent compared to 2023. Approximately 300 million people crossed international borders in the first quarter of 2025. International tourism has increased in several regions, including Europe, Africa, and Asia, as highlighted by the Global Tourism Forum. The apparent significant increase in international tourism is indeed important for the smooth functioning of the global economy.
Empirical research studies have demonstrated that tourism is important for the growth and development of countries. The recent research study of Wu et al. (2024) reported a positive relationship between international tourism and economic performance in eastern China. Similarly, utilizing the neo-classical framework, Fayissa et al. (2008) also supported the positive impacts of tourism on economic performance. Similarly, using data of Mauritius economy, Durbarry (2004) endorsed that tourism has significantly contributed to the growth and development process. On the other hand, some studies have questioned the positive impacts of international tourism. For instance, Antonakakis et al. (2015) reported that the relationship between tourism and economic growth is unstable and further depends on the time and economic events. It means that the debate regarding the tourism-growth relationship is yet to be resolved. Moreover, Pablo-Romero and Molina (2013) studied the literature and endorsed that the tourism-led growth hypothesis has received relatively less attention in the literature from the researchers. Gwenhure and Odhiambo (2017) also reviewed the literature and demonstrated that the issue of causality in the tourism-growth relationship is yet to be investigated comprehensively.
The “Association of Southeast Asian Nations (ASEAN, hereafter)” is a famous destination among international tourists largely due to its rich history, rich vibrant culture, and pleasant weather conditions. The ASEAN region is ranked third among the 13 tourism markets, with 125.78 million visitors annually as endorsed by Aini (2024). The author further mentioned that the tourism industry of ASEAN contributes 12 percent to the GDP and further generates 4 percent of the total employment. Öztürk et al. (2019) pointed out that international tourism is one of the major drivers of economic performance for all member economies of the ASEAN region. Like all parts of the world, international tourism has also increased in the ASEAN region (Ardra & Martawardaya, 2017). The ASEAN region is generally successful in attracting foreign tourists to the region mainly due to its favorable geography, natural wealth, and diversity as endorsed by Sara et al. (2018).
In the following Figure 1, we have graphed international tourism for the ASEAN economies for the period 2001–2023. It can be seen from Figure 1 that international tourism has increased steadily for all ASEAN economies during the study period. International tourism was relatively low in Brunei Darussalam till 2015. However, Brunei has also shown some improvement in international tourism after 2015. Tourism has declined in all ASEAN economies due to COVID-19, except Thailand. The overall performance of Thailand in terms of international tourism is remarkable among the ASEAN members. The economy of Malaysia also appeared to be successful in attracting international tourists as illustrated by Figure 1. However, recent data shows that all ASEAN members recovered from the observed decline in tourism amid COVID-19.
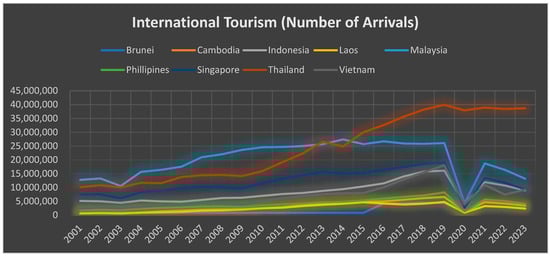
Figure 1.
International tourism in ASEAN (2001–2023). Source: Authors’ analysis using data from “World Development Indicators”.
Several studies have attempted to assess the role of tourism in promoting economic growth. However, the findings reported by different researchers about the tourism-growth relationship in the context of ASEAN economies are largely inconclusive due to inconsistent and contradictory findings. For instance, Ardra and Martawardaya (2017) utilized data of ASEAN economies and empirically showed that international tourism has reduced poverty and increased income per person. However, on the other hand, the latest research (Van Trung, 2025) demonstrated that tourism has a negative impact for ASEAN economies. Furthermore, Rahmiati et al. (2021) endorsed that tourism receipts and expenditures are positively linked with economic growth, while the number of tourist arrival is negatively associated with economic growth. Moreover, Nguyen (2024) also demonstrated that international tourism is unable to explain the economic performance of ASEAN member economies.
The available literature in the case of ASEAN economies regarding the tourism-growth linkages is largely unsettled owing to diverse and contradictory results reported by researchers. Still, it is unclear whether higher tourism leads to higher growth or higher growth promotes the tourism sector. In other words, the direction of the relationship between tourism and economic growth is yet to be explored. Even in the context of ASEAN’s members, research evidence on the relationship between tourism and economic growth is not only scarce but also inconclusive. While it is a fact that the ASEAN region is largely dependent on international tourism, in simple words, there exists a clear research gap regarding the tourism-growth relationship in the context of ASEAN member economies. Consequently, the present study tries to fill the aforementioned research gap by carrying out a comprehensive research study by focusing on the tourism-growth relationship in the context of the ASEAN economies.
This research article is interested in establishing a comprehensive relationship between international tourism and economic growth by focusing on the economies of the ASEAN region. Similarly, our study is also interested in figuring out the exact direction of relationship between tourism and economic growth. Therefore, the results of the current study are expected to shape policy formulation regarding international tourism in the ASEAN region.
This research article has several sections as follows. The second section of the article provides detailed discussion of the literature. The model derivation, data sources, and estimation methods are outlined in detail in section three, while section four discusses the results obtained through analysis. The penultimate section includes results of causality analysis based on the DH approach. The final section of the article provides concluding remarks, presents policy implications, and further highlights both limitations and future research avenues for potential future researchers.
2. Literature Review
The importance of international tourism from the perspective of economic growth has been debated and researched in the literature due to its enormous benefits. Government authorities are constantly trying to attract international tourism to advance the speed of their economic growth (Brida et al., 2020). Due to the enormous benefits of international tourism for the host economy, several researchers have conducted research studies to identify its true impacts. For instance, utilizing data for the period 1995–1998, Eugenio-Martin et al. (2004) empirically showed that tourism is a relevant factor for the growth of low-income and middle-income economies. They further highlighted the role of complementary factors such as education and infrastructure for attracting tourists. Gökovali and Bahar (2006) also demonstrated empirically that international tourism is a conductive factor for the acceleration of economic growth.
Sak and Karymshakov (2012) utilized the granger causality techniques and have focused on 135 economies for the period 1995–2008 to study the linkages between tourism and economic growth. Their comprehensive analysis demonstrated several two-way as well as one-way causal relationships between tourism and economic growth. Wijesekara et al. (2022) utilized data for the period 2003–2020 of 105 economies and concluded that tourism enhances economic growth. Finally, Ady et al. (2022) displayed a positive relationship between tourism and economic growth using several proxies for the measurement of tourism.
Some researchers have reviewed the literature on the tourism-growth relationship to provide detailed understanding for potential researchers. For instance, Pablo-Romero and Molina (2013) reviewed 87 empirical research articles on the tourism-growth relationship and reported that 55 articles displayed a univocal relationship, 16 articles demonstrated bidirectional relationship, 4 articles showed no relationship, and 9 studies endorsed that economic growth leads to increased tourism. Similarly, Gwenhure and Odhiambo (2017) also conducted a review of the literature and concluded that the tourism-growth relationship significantly varies from country to country and is further dependent on the methods used in the analysis.
Particularly, in the context of the ASEAN economies, some researchers have attempted to figure out the importance of international tourism from the perspective of economic growth. In this regard, the study of Sara et al. (2018) demonstrated that international tourism has helped the ASEAN economies to decrease poverty and increase per person income. Aini (2024) demonstrated that international tourism is positively related to GDP, employment level, and carbon emissions in the ASEAN region. Moreover, using data of ASEAN economies for the period 2003–2021, Aida et al. (2023) empirically showed that international tourism has promoted the economic performance of ASEAN economies. However, another strand of the literature has largely questioned the tourism-led growth hypothesis for the ASEAN economies. For instance, Van Trung (2025) and Nguyen (2024) reported that international tourism is unable to explain the economic performance of the ASEAN economies. International tourism has grown in recent years in all ASEAN economies, and hence a comprehensive research study is indeed needed to figure out its true relationship with economic growth.
In summary, the relationship between international tourism and economic growth is debated and researched at a global level more extensively but less extensively in the context of ASEAN member economies. The available research evidence about the tourism-growth relationship in the context of ASEAN economies is largely inconsistent and inconclusive. Therefore, the present study attempts to provide comprehensive evidence about the potential impact of international tourism on the economic growth of ASEAN economies. Therefore, our findings will enrich the literature in the context of ASEAN economies and will further shape policymaking regarding international tourism.
2.1. Development of Hypothesis
Based on the literature, the study has formulated the following null hypotheses which will be tested against the alternative hypotheses. All these hypotheses are based on prior research studies.
2.1.1. Tourism and Economic Growth
H1.
“Increased tourism positively contributes to economic growth”.
2.1.2. Control Variables and Economic Growth
H2.
“Human capital positively impacts economic growth”.
H3.
“Domestic investment positively influences economic growth”.
H4.
“International trade openness enhances the speed of economic growth”.
H5.
“Heightened inflation rate negatively impacts economic growth”.
H6.
“Government expenditure improves economic growth”.
3. Research Design and Estimation
3.1. Model Specification
To assess the impact of international tourism on the economic performance of ASEAN economies, in this section we specify an empirical model. International tourism is the main independent variable, while economic growth is the dependent variable in the current study. However, economic growth has several determinants as mentioned in previous studies. Therefore, we have included education, investment, and trade openness in addition to international tourism (Tahir & Azid, 2015). The empirical model of the study is shown below using expression (1).
Expression (1) indicates that the economic growth of ASEAN economies is dependent on international tourism, education, investment, and trade openness.
3.2. Definition of Variables
For economic growth, the present study utilized the growth rate of GDP per capita, which is consistent with prior research studies. Similarly, openness to trade is measured as “trade as % of GDP”. For capturing the impact of international tourism, we used “International tourism, number of arrivals”. Similarly, for measuring education, we used “Human capital index, based on years of schooling and returns to education”. The years of schooling are taken from Barro and Lee (2013), while returns to education are based on the well-known Mincer equation. The human capital index is a comprehensive index that measures the overall development of human capital in economies. Several future studies have employed the human capital index for the measurement of human capital in recent years (Alfalih et al., 2025; Alam et al., 2025). Moreover, “gross capital formation as % of GDP” is used for measuring investment. Besides the mentioned variables, we also used inflation rate and government expenditures as additional determinants of growth to figure out whether the established relationship between international tourism and economic growth changes or stays robust.
3.3. Data Collection and Sample
Data on all variables except human capital was gathered for the period 2001–2023 from the “World Development Indicators (WDI)”. Data on education is extracted from the “Penn World Tables (PWT)”. The present study initially focused on all ASEAN economies. However, the economy of Myanmar was dropped from the sample due to missing and inconsistent data for some key variables.
3.4. Estimation Strategy
Panel econometric models pose several challenges in applied research studies for researchers. Researchers have used the “Fixed Effects (FEM, hereafter)” and “Random Effects (REM, hereafter)” for handling models involving panel data. FEM modeling is extensively used in numerous research studies, including Tahir and Azid (2015). FEM modeling can effectively handle the likely serial correlation between the regressors and the error term of the econometric model. However, FEM modeling is unable to assess the impact of time-invariant factors due to the issue of dummy variable trap. On the other hand, the REM model can effectively assess the impact of time-invariant factors. However, REM modeling is incapable of controlling the problem of serial correlation between the error term and the regressors. In the literature, the Hausman test (1978) is used by almost all research studies to choose between FEM and REM. The present study also applied the Hausman test for decision-making regarding FEM and REM. The results of the Hausman test supported the use of FEM modeling. It is pertinent to mention that both time effect and country effects are included while estimating the models. In other words, the estimated models include both time and country effects.
In addition to the FEM modeling, the present study also used the “Feasible Generalized Least Squares (FGLS)” estimator for assessing the robustness of the FEM modeling following prior research (Tahir & Alam, 2022). Finally, for addressing the likely endogeneity problem, the present study preferred the use of “Two Stages Least Squares (2SLS)”. Lagged values of the same variables are used as instruments in the 2SLS estimation. Finally, the “Generalized Method of Moments (GMM)” is skipped as the number of cross-sections are less than the number of years.
3.5. Preliminary Testing
In the first step of the analysis, we performed the Pesaran CD test to assess the possibility of cross-sectional dependency. The outcome of CD test (Table A1, Appendix A) confirmed cross-sectional independence for the sample considered. The CD test is insignificant for all four estimated models. Similarly, the Hausman testing (1978) is also conducted, and results are shown in Table A2 in Appendix A. The results of the Hausman testing rejected the use of REM at the standard significance level. Moreover, we also conducted the “Variance Inflation Factor (VIF)” for assessing the presence of multicollinearity in our specified model. The findings of VIF shown in the appendix section (Table A3) demonstrate that multicollinearity is not associated with our specified models as the VIF values are lower than five for all variables included in the model.
4. Results and Discussions
4.1. Descriptive Analysis
Descriptive analysis of key variables chosen for the current study is conducted, and the findings are shown in Table 1. The results show that the mean value of the growth of GDP per capita is 3.273, with a standard deviation of 3.418 during the period 2001–2023. The highest growth of GDP per capita (14.430) is experienced by the economy of Singapore in the year 2021. Similarly, the lowest statistics of growth (−10.548) is observed in the Philippines in 2020.

Table 1.
Descriptive analysis.
The statistics of international tourism show that between 2001 and 2023, the ASEAN region attracted about 9,185,740 international tourists on average having a standard deviation of 9,051,253. Among the ASEAN members, the economy of Thailand has attracted the highest number of international tourists (39,916,000) in 2019. Similarly, Cambodia has attracted the lowest number of international tourists (605,000) in 2001 among the ASEAN states. The overall statistics of tourism in the ASEAN region are satisfactory. Several factors, including feasible weather conditions, stability, and better law and order situation, could explain the relatively better performance of ASEAN members in terms of international tourism.
In terms of education, the ASEAN states have done well over the years. The average value of human capital index is 2.513 between 2001 and 2023. Singapore experienced the highest value of human capital (4.351) among the ASEAN states in 2019. On the other hand, the lowest value of human capital (1.552) is witnessed by the economy of Cambodia in 2001. However, Cambodia has done well over the years, and its human capital index has reached to 1.940 in 2023. All other economies have also shown enormous improvement in terms of improving their human capital scores.
The descriptive analysis further illustrates that the trade performance of the ASEAN states is exemplary. The trade openness index is 134.613 percent (trade as % of GDP) on average between 2001 and 2023 for the ASEAN region which is remarkable. Among the ASEAN members, Singapore has experienced the highest value of trade openness (437.326) in 2008. The Singapore economy is a textbook example where trade openness has played a remarkable role in uplifting the economic performance. The descriptive analysis further indicated that Indonesia has experienced the lowest value of trade openness (32.972) in 2020. However, the latest statistics show that Indonesia has improved its trade openness from 32.972 in 2020 to 41.315 in 2023, which is a significant improvement.
The statistics for domestic investment are also satisfactory as evident from Table 1. The average value of domestic investment measured as “gross fixed capital formation as % of GDP” is more than 26 percent which is reasonable. Domestic investment is the key component of the production process, and hence its higher values are desirable. The highest value of domestic investment (40.891) is recorded for the Bruneian economy in 2018. The lowest figure of domestic investment (13.453) is experienced by Laos in 2001. However, the statistics of 2023 indicated that Laos has increased its domestic investment to more than 30 percent, which is indeed an excellent performance. Overall, the ASEAN region has done well in terms of improvement in domestic investment.
Moreover, in terms of inflation, the ASEAN region has done remarkably well as evident from the statistics provided. The average value of inflation is below four percent between 2001 and 2023, which is the reflection of overall stable economic environment. The highest inflation figure (31.230) is recorded for Laos in 2023. Similarly, the lowest inflation statistic (−2.314) occurred in Brunei Darussalam in 2002. The inflation statistics, in general, are stable for the ASEAN region, which is a good indicator from the perspective of long-run development. It is generally accepted that inflation statistics, preferably in single digits, generates economic activities. Hence, increased economic activities amid single digit inflation promotes the overall economic performance. Finally, we found that the government expenditures are in moderate range in the ASEAN region. It is witnessed that the average value of the government expenditure is slightly below 12 percent. The highest value of government expenditures (29.576) happened in Brunei Darussalam in 2001. The lowest value of the government expenditures (4.809) is recorded in 2019 for the economy of Cambodia.
4.2. Correlation Analysis
The matrix of correlation is presented in Table 2 to assess the strength of association among the selected variables. The results endorsed a significant correlation between international tourism and education, tourism and trade, and tourism and inflation rate. Similarly, education is significantly correlated with trade, investment, inflation rate, and government expenditures. Furthermore, we observed that inflation rate is significantly correlated both with trade and government expenditures.
Table 2.
Correlation analysis.
4.3. Discussion on Long-Run Results
The results depicted in Table 3 illustrate that international tourism has helped the ASEAN region in advancing its economic growth. It means that the long-term growth performance of ASEAN members could be explained largely by its relatively rich tourism sector. Our results are supported significantly by the results of Fayissa et al. (2008) who demonstrated a positive relationship between tourism and economic growth by focusing on African economies. Similarly, Risso (2018) quantitatively showed that 100 percent increase in the arrival of tourists is expected to increase GDP per capita by 9 percent. The members of the ASEAN region are advised to encourage international tourism by applying all available means. Over the years, the ASEAN economies have developed their infrastructure and maintained a well-protected law and order situation. Stable law and order situation and well-developed infrastructure are the main reasons behind international tourism. Therefore, as policy advice, the ASEAN members must provide an encouraging environment for international tourists such as reasonable facilities of accommodation and information about the tourism sites for promoting the tourism sector.
Table 3.
Long-run findings.
Similarly, the coefficient of trade openness is positive and significant, which is in line with the perception hypothesized. Research studies, (Dollar, 1992; Edwards, 1998; Tahir & Khan, 2014; Tahir & Azid, 2015) provided significant evidence about the positive trade-growth linkages. Therefore, the policymakers of the ASEAN economies need to liberalize their international trade regime further by relaxing all restrictions. The liberalized trade regime would benefit all the ASEAN economies in their efforts to improve the overall economic growth. It is a fact that some ASEAN members, such as Singapore and Malaysia along with Brunei Darussalam, have paid significant attention to the process of trade liberalization. However, some members of ASEAN such as Indonesia and the Philippines are required to take some visible steps to liberalize their trade regimes further for the purpose of achieving higher economic growth.
The results further indicated that human capital has played a dominant role in enhancing the growth performance of the ASEAN economies. Previous research has also illustrated a positive relationship between education and growth by focusing on different nations and regions (Barro, 1998; Gyimah-Brempong et al., 2006; Barro, 2013). Therefore, ASEAN member states are advised to pay further attention by improving both the volume and quality of their existing human capital to accelerate the growth process in the long run. Finally, domestic investment has not had a significant positive influence on economic growth. Although domestic investment possesses a positive coefficient sign, it is possible that other determinants of capital, such as human capital, matter the most as compared to physical capital.
Model-2 indicates that the inflation rate has proved its adverse consequences on economic performance. However, it should be noted that with the addition of inflation rate into the model, the already established positive relationship between tourism and growth remained the same. Moreover, the results of Model-3 show that after controlling the government expenditures, international tourism appeared to be one of the main factors of growth for the ASEAN economies. Finally, after controlling inflation and government expenditures simultaneously, again we found significant evidence of a positive relationship that international tourism has with economic growth (Model-4).
4.4. Robustness Analysis
This section of the paper is devoted to solving the issue of robustness that may be associated with the results reported earlier using the FEM modeling. In the first step, we apply the FGLS method to estimate all four models, and results are presented in columns 2–5 of Table 4, Models (5–8). In addition to the FGLS estimation, we have also utilized the 2SLS estimator for the purpose of estimation to address the likely endogeneity problem. The results of the 2SLS are shown in the last four columns of Table 4.
Table 4.
Robustness Findings.
The findings of FGLS estimator provided concrete support to the findings shown in Table 3 using the FEM modeling. In the FGLS modeling, we found consistent positive evidence about international tourism and growth. In the FGLS estimation, the positive impacts of education and trade openness on economic performance did not change. However, it should be noted that in the FGLS estimation, the positive and insignificant influence of domestic investment and government expenditure on economic growth turned significant in a couple of specifications. It implies that the current level of government expenditure is effective in improving growth.
Moving to the 2SLS estimation, the results displayed validity of the earlier results. The results of the 2SLS demonstrated a positive and significant influence of international tourism on economic growth. Again, using the 2SLS estimation, we found that domestic investment is an irrelevant determinant of economic growth for the ASEAN economies. Finally, the 2SLS estimation confirmed the positive and negative impacts of government expenditures and inflation rate on economic growth, respectively.
5. Causality Findings
In this section, the study attempts to highlight the direction of relationship among the chosen variable for this research. The causality results (Table 5) highlighted several one-way as well as two-way causality among the selected variables. The results proved a one-way relationship originating from tourism towards economic growth, which implies that the tourism-led growth hypothesis is valid for the ASEAN economies. Similarly, the causality analysis further confirmed a one-way impact of economic growth on education, trade openness, and government expenditures for the ASEAN economies. Further, we observed a unilateral impact of human capital on trade openness and domestic investment. Moreover, inflation rate and domestic investment are linked with trade openness in a unilateral passion as demonstrated by the results. Finally, the causality outcome proved the one-way impact of government expenditures on domestic investment rate in the ASEAN economies.
Table 5.
Panel causality testing.
In terms of a two-way relationship, we witnessed that openness to international trade and tourism are impacting each other in a bidirectional manner. Both trade openness and international tourism are the characteristics of an open economy, and hence a bidirectional relationship between the two is expected. Similarly, we found evidence of a two-way relationship that is present between government expenditures and international tourism. It means that the government sector can play a vital role in attracting international tourism, while tourism enhances the performance of the government sector significantly.
6. Conclusions, Implications, and Limitations
6.1. Summary Remarks
This paper assessed the influence of international tourism on economic growth, an under-researched area, particularly in the context of the ASEAN economies. Annual data is sourced from credible sources for the period 2001–2023. Several econometric techniques are employed to obtain robust results.
Our results brought significant insights into the role of tourism in advancing the economic growth of ASEAN member states. Besides international tourism, trade openness and education have also contributed to the economic performance of ASEAN member states. Furthermore, government expenditures have also played an important role in advancing the growth performance in the long run. The causality analysis has also endorsed the tourism-led growth hypothesis for the ASEAN economies. Finally, the inflation rate appeared to be the main hurdle for the growth performance of the ASEAN economies. Our results are robust to alternative model specification and estimating techniques.
6.2. Policy Implications
Policy implications based on results are outlined for the consideration of policymakers and authorities of the ASEAN region.
- 1.
- Firstly, the policymakers of ASEAN are suggested to provide a more feasible environment for the promotion of the tourism sector as it positively contributes to the growth performance. In this regard, tourism facilitation centers along with better facilities of accommodation and transportation would enhance the economic performance which is desirable.
- 2.
- Secondly, the authorities and policymakers of ASEAN are required to liberalize their trade regime further by relaxing all sorts of trade restrictions, including tariff and non-tariff barriers. Similarly, some incentives for the export sector would also help the policymakers to achieve higher trade volumes. Enhanced trade volume would eventually accelerate the growth performance of ASEAN member economies.
- 3.
- Thirdly, human capital has played a dominant role in explaining the overall growth performance as confirmed by results. Therefore, the rational policy would be to focus on increasing both the volume of human capital as well as the quality of human capital using several policies. Furthermore, the policymakers of the ASEAN region are encouraged to focus on improving the skills of population.
- 4.
- Finally, the policymakers of ASEAN are encouraged to control the inflationary pressure using suitable policy responses, as it is harmful for economic performance.
6.3. Limitations and Future Research Directions
- 1.
- The first limitation of the study is that it focuses on the ASEAN economies, which are unique. Therefore, potential researchers are encouraged to test the models of our study by focusing on some other group of economies, such as G-20 and OECD, to address the issue of robustness and results generalization.
- 2.
- The variable used for the measurement of international tourism is narrow. Therefore, future studies on the subject are advised to use a more detailed proxy for the measurement of international tourism to provide more robust evidence.
- 3.
- The current study has only focused on a few determinants of economic growth, while economic growth may be influenced by several factors, including research development, political stability, and entrepreneurial activities. Therefore, future studies should include research and development, political stability, and entrepreneurial activities in their research models to assess the true impact of international tourism on economic growth. The inclusion of the variables mentioned in our estimated model would provide more in-depth insights.
- 4.
- Lastly, the present study conducted empirical analysis only using traditional econometric techniques. However, due to the limited number of cross-sections, the present study did not use the GMM estimator. Future research studies are recommended to utilize more comprehensive samples of countries and apply the GMM estimator.
Author Contributions
Conceptualization, T.H.A. and M.T.; methodology, U.B.; software, M.T.; validation, T.H.A., T.F.A. and Z.K.A.; formal analysis, U.B.; investigation, M.J.; resources, T.H.A.; data curation, M.T.; writing—original draft preparation, T.H.A.; writing—review and editing, T.F.A.; visualization, M.J.; supervision, Z.K.A.; project administration, T.F.A.; funding acquisition, U.B. All authors have read and agreed to the published version of the manuscript.
Funding
This research received no external funding.
Institutional Review Board Statement
Not applicable.
Informed Consent Statement
Not applicable.
Data Availability Statement
Data used in the article is available from the corresponding author upon suitable request.
Conflicts of Interest
The authors declare no conflict of interest.
Appendix A
Table A1.
Cross-sectional dependence test.
Table A1.
Cross-sectional dependence test.
| Test Name | Model | Test-Score | Degree of Freedom | Prob. Value | Conclusion |
|---|---|---|---|---|---|
| Pesaran CD Test | 1 | −0.135 | 36 | 0.8919 | “Ho is not rejected” |
| 2 | −0.943 | 36 | 0.3453 | “Ho is not rejected” | |
| 3 | −0.861 | 36 | 0.3891 | “Ho is not rejected” | |
| 4 | −0.853 | 36 | 0.3933 | “Ho is not rejected” |
Table A2.
Hausman Test.
Table A2.
Hausman Test.
| Test Name | Model | Test-Score | Prob. Value | Conclusion |
|---|---|---|---|---|
| Cross-Section Random | 1 | 66.824 | 0.000 | “Ho is rejected” |
| 2 | 60.730 | 0.000 | “Ho is rejected” | |
| 3 | 49.321 | 0.000 | “Ho is rejected” | |
| 4 | 52.896 | 0.000 | “Ho is rejected” |
Table A3.
Multicollinearity testing (VIF).
Table A3.
Multicollinearity testing (VIF).
| Correlation | Variance | VIF |
|---|---|---|
| 0.001330 | 1.417303 | |
| 0.055063 | 2.273638 | |
| 0.025812 | 1.078219 | |
| 0.004645 | 1.377476 | |
| 6.75 × 10⁻⁵ | 1.207254 | |
| 0.009825 | 1.531639 |
References
- Ady, S. U., Moslehpour, M., Van, D. N., Johari, S. M., Thuy, V. V. T., & Hieu, V. M. (2022). The impact of Sustainable tourism growth on the economic development: Evidence from a developing economy. Cuadernos de Economía, 45(127), 130–139. [Google Scholar]
- Aida, N. E. L. I., Palupi, W. A., & Husain, F. R. (2023). What is the role of tourism, foreign direct investment, and institutions in economic growth in ASEAN. WSEAS Transactions on Environment and Development, 19, 571–581. [Google Scholar] [CrossRef]
- Aini, Y. N. (2024). Sustainable tourism in Southeast Asia: Balancing economic growth, employment, and carbon emissions through evidence-based strategies. Jurnal Kepariwisataan Indonesia: Jurnal Penelitian dan Pengembangan Kepariwisataan Indonesia, 18(1), 157–174. [Google Scholar]
- Alam, M. B., Tahir, M., Omar Ali, N., Naveed Jan, M., & Sayal, A. U. (2025). The moderating role of terrorism on the insurance–growth nexus: Empirical evidence from the 14 MENA countries. Journal of Economic and Administrative Sciences, 41(2), 720–734. [Google Scholar]
- Alfalih, A. A., Azid, T., Jaboob, M., & Tahir, M. (2025). Natural resources management as drivers of economic growth: Fresh insights from a time series analysis of Saudi Arabia. Sustainability, 17(4), 1728. [Google Scholar] [CrossRef]
- Antonakakis, N., Dragouni, M., & Filis, G. (2015). How strong is the linkage between tourism and economic growth in Europe? Economic Modelling, 44, 142–155. [Google Scholar] [CrossRef]
- Ardra, U., & Martawardaya, B. (2017). Tourism and economic development in ASEAN 1998–2013. Economics and Finance in Indonesia, 63(2), 2. [Google Scholar]
- Barro, R. J. (1998). Human capital and growth in cross-country regressions (pp. 1–56). Harvard University. [Google Scholar]
- Barro, R. J. (2013). Education and economic growth. Annals of Economics and Finance, 14(2), 301–328. [Google Scholar]
- Barro, R. J., & Lee, J. W. (2013). A new data set of educational attainment in the world, 1950–2010. Journal of development economics, 104, 184–198. [Google Scholar]
- Brida, J. G., Gómez, D. M., & Segarra, V. (2020). On the empirical relationship between tourism and economic growth. Tourism Management, 81, 104131. [Google Scholar] [CrossRef]
- Dollar, D. (1992). Outward-oriented developing economies really do grow more rapidly: Evidence from 95 LDCs, 1976–1985. Economic Development and Cultural Change, 40(3), 523–544. [Google Scholar] [CrossRef]
- Durbarry, R. (2004). Tourism and economic growth: The case of Mauritius. Tourism Economics, 10(4), 389–401. [Google Scholar] [CrossRef]
- Edwards, S. (1998). Openness, productivity and growth: What do we really know? The Economic Journal, 108(447), 383–398. [Google Scholar] [CrossRef]
- Eugenio-Martin, J. L., Morales, N. M., & Scarpa, R. (2004). Tourism and economic growth in Latin American countries: A panel data approach (No. 26.2004). Nota di Lavoro. [Google Scholar]
- Fayissa, B., Nsiah, C., & Tadasse, B. (2008). Impact of tourism on economic growth and development in Africa. Tourism Economics, 14(4), 807–818. [Google Scholar] [CrossRef]
- Gökovali, U., & Bahar, O. (2006). Contribution of tourism to economic growth: A panel data approach. Anatolia, 17(2), 155–167. [Google Scholar] [CrossRef]
- Gwenhure, Y., & Odhiambo, N. M. (2017). Tourism and economic growth: A review of international literature. Tourism: An International Interdisciplinary Journal, 65(1), 33–44. [Google Scholar]
- Gyimah-Brempong, K., Paddison, O., & Mitiku, W. (2006). Higher education and economic growth in Africa. The Journal of Development Studies, 42(3), 509–529. [Google Scholar] [CrossRef]
- Khayrulloevna, A. M. (2020). The substantial economic benefits of tourism. Academy, 3(54), 39–40. [Google Scholar]
- Nguyen, C. V. (2024). Air transport resilience, tourism and its impact on economic growth. Economies, 12(9), 236. [Google Scholar] [CrossRef]
- Öztürk, M., Ihtiyar, A., & Aras, O. N. (2019). The relationship between tourism industry and economic growth: A panel data analysis for ASEAN member countries. In Quantitative tourism research in Asia: Current status and future directions (pp. 35–58). Springer Nature. [Google Scholar]
- Pablo-Romero, M. D. P., & Molina, J. A. (2013). Tourism and economic growth: A review of empirical literature. Tourism Management Perspectives, 8, 28–41. [Google Scholar] [CrossRef]
- Rahmiati, F., Jokhu, J. R., Arquisola, M. J., Advincula, G., & Rasid, R. (2021). Tourism Impact the Economic Growth of ASEAN Countries. Lesson Learned for Post-Pandemic Covid-19 Recovery. Journal of Technology Management and Technopreneurship (JTMT), 9(2), 29–38. [Google Scholar]
- Risso, W. A. (2018). Tourism and economic growth: A worldwide study. Tourism Analysis, 23(1), 123–135. [Google Scholar] [CrossRef]
- Sak, N., & Karymshakov, K. (2012). Relationship between tourism and economic growth: A panel Granger causality approach. Asian Economic and Financial Review, 2(5), 591. [Google Scholar]
- Sara, I., Dharmanegara, I. B. A., & KORRI, I. (2018). The dynamics of international tourism and economic growth convergence in ASEAN+ 3. Journal of Environmental Management and Tourism, 9(4), 2018. [Google Scholar] [CrossRef] [PubMed]
- Tahir, M., & Alam, M. B. (2022). Does well banking performance attract FDI? Empirical evidence from the SAARC economies. International Journal of Emerging Markets, 17(2), 413–432. [Google Scholar] [CrossRef]
- Tahir, M., & Azid, T. (2015). The relationship between international trade openness and economic growth in the developing economies: Some new dimensions. Journal of Chinese Economic and Foreign Trade Studies, 8(2), 123–139. [Google Scholar] [CrossRef]
- Tahir, M., & Khan, I. (2014). Trade openness and economic growth in the Asian region. Journal of Chinese Economic and Foreign Trade Studies, 7(3), 136–152. [Google Scholar] [CrossRef]
- Van Trung, H. (2025). Tourism, FDI, renewable energy and growth: An analysis of ASEAN countries. Revista Tur smo & Desenvolvimento| n. o, 48, 599–623. [Google Scholar]
- Walton, J. (2018). Tourism and economic development in ASEAN. In Tourism in South-East Asia (pp. 214–233). Routledge. [Google Scholar]
- Wijesekara, C., Tittagalla, C., Jayathilaka, A., Ilukpotha, U., Jayathilaka, R., & Jayasinghe, P. (2022). Tourism and economic growth: A global study on Granger causality and wavelet coherence. PLoS ONE, 17(9), e0274386. [Google Scholar] [CrossRef]
- W.T.B. (2025). World Tourism Barometer. UN Tourism Publications. [Google Scholar] [CrossRef]
- Wu, T. P., Wu, H. C., Ye, G., Wu, X., & Pan, B. (2024). The contribution of international tourism development to economic growth in Chinese economy. Journal of Policy Research in Tourism, Leisure and Events, 16(4), 575–589. [Google Scholar] [CrossRef]

Disclaimer/Publisher’s Note: The statements, opinions and data contained in all publications are solely those of the individual author(s) and contributor(s) and not of MDPI and/or the editor(s). MDPI and/or the editor(s) disclaim responsibility for any injury to people or property resulting from any ideas, methods, instructions or products referred to in the content. |
© 2025 by the authors. Licensee MDPI, Basel, Switzerland. This article is an open access article distributed under the terms and conditions of the Creative Commons Attribution (CC BY) license (https://creativecommons.org/licenses/by/4.0/).