Article

Investigating the Effects of the COVID-19 Pandemic on Stock Volatility in Sub-Saharan Africa: Analysis Using Explainable Artificial Intelligence

by
Mbongiseni Ncube
*,
Mabutho Sibanda
and
Frank Ranganai Matenda
School of Accounting, Economics and Finance, University of KwaZulu-Natal, Westville Campus, Durban 4041, South Africa
*
Author to whom correspondence should be addressed.
Economies 2024, 12(5), 112; https://doi.org/10.3390/economies12050112
Submission received: 23 December 2023 / Revised: 28 April 2024 / Accepted: 29 April 2024 / Published: 8 May 2024
(This article belongs to the Section Macroeconomics, Monetary Economics, and Financial Markets)

Abstract

:
This study examines the impact of the COVID-19 pandemic on sector volatility in sub-Saharan Africa by drawing evidence from two large and two small stock exchanges in the region. The analysis included stock-specific data, COVID-19 metrics, and macroeconomic indicators from January 2019 to July 2022. This study employs generalized autoregressive conditional heteroskedasticity (GARCH) models to estimate volatility and Explainable Artificial Intelligence (XAI) in the form of SHapley Additive exPlanations (SHAP) to identify significant factors driving stock volatility during the pandemic. The findings reveal significant volatility increases at the onset of the pandemic, with government stringency measures leading to increased volatility in larger exchanges, while the introduction of vaccination programs helped to reduce volatility. Weaker macroeconomic fundamentals impact volatility in smaller exchanges. The healthcare sector has emerged as the most resilient, while non-essential sectors, such as consumer discretionary, materials, and real estate, face greater vulnerability, especially in smaller exchanges. The research findings reveal that the heightened stock market volatility observed was mainly a result of the government’s actions to combat the spread of the pandemic, rather than its outbreak. We recommend that governments introduce sound policies to balance public health measures and economic stability, and that investors diversify their investments to reduce the impact of pandemics.

1. Introduction

The coronavirus disease (COVID-19) pandemic, caused by a novel coronavirus, emerged in late 2019 and quickly spread worldwide, leading to widespread health, social, and economic disruptions. The COVID-19 pandemic has emerged as a unique and unprecedented crisis affecting the global economy in distinct ways. Unlike past pandemics, such as the Spanish flu and SARS outbreaks, the COVID-19 pandemic rapidly spread across borders, resulting not only in widespread infections and healthcare disruptions, but also economic disruptions (Foley et al. 2022; Kusumahadi and Permana 2021; Priscilla et al. 2022).
In response to the COVID-19 pandemic, governments worldwide implemented various measures to control the virus’s spread. These measures included the imposition of economic lockdowns, introduction of fiscal stimulus packages, and introduction of vaccination programs. Recent studies show that the policies and measures implemented in response to the pandemic were diverse and had varying effects on different countries’ economies and financial markets (Bakry et al. 2022; Mishra et al. 2020; Phan and Narayan 2020). For instance, developing economies typically have less advanced healthcare infrastructure and fiscal and monetary policies, making it challenging to mitigate the negative impacts of the pandemic on their economies.
However, a study by Kumeka et al. (2022) showed that stock markets in developing countries are more resilient to the effects of the pandemic than developed countries. On the other hand, researchers such as Harjoto and Rossi (2021); Takyi and Bentum-Ennin (2021) have found that the negative impacts of the pandemic were short-lived in developed country stock markets, as stocks quickly rebounded. Nonetheless, the findings from these studies were based on an analysis of aggregate stock market indices, which fail to account for sector-level returns and the uneven impact of the pandemic on various sectors. Therefore, a granular approach is necessary to understand how different sectors were affected by the pandemic.
This study examines the impact of the COVID-19 pandemic on sector volatility in sub-Saharan African stock markets. Volatility in financial markets refers to the degree of variation in security prices over time. This is a measure of the dispersion of returns for a given security or market index, reflecting the level of uncertainty or risk in the market. High stock volatility indicates larger price fluctuations and, hence, a high risk inherent in that stock, whereas low volatility suggests more stable and predictable price movements. Similar to other regions, the sub-Saharan African region suffered greatly from the pandemic, resulting in a 3.4% contraction in the continent’s GDP, which is the largest decline in almost three decades (Toure 2020; UN 2021).
Given the region’s weak macroeconomic fundamentals, including low commodity prices, high public debt, and the dominance of the informal sector, the economies in the region were more vulnerable to the pandemic’s shocks (Djankov and Panizza 2020; Elkhishin and Mohieldin 2021; UN 2021). The sub-Saharan African region’s stock markets are relatively small, accounting for approximately 1.3% of the total global market capitalization as of 2020 (ASEA 2020; Njenga et al. 2022). Owing to their modest size, these markets tend to experience heightened volatility and low liquidity, rendering traditional analyses focused on aggregate indices insufficient to fully comprehend the intricate dynamics driving market movements.
Limited research has been conducted on the impact of the COVID-19 pandemic on sector volatility in the sub-Saharan African stock markets. Although Ncube et al. (2023) attempted to assess the impact of the pandemic on sector performance, their study was limited to the return measure. Relying solely on absolute returns as a measure of stock performance may be a significant oversight, as stock markets could appear to have recovered from the pandemic, but still experience excessive volatility, which could result in substantial losses for investors (Będowska-Sójka and Kliber 2019; Choi and Munro 2022). Examining the impact of the pandemic on sector volatility is crucial to gaining a comprehensive understanding of the risks associated with investing in the stock market in sub-Saharan Africa during this period. Additionally, the few studies that examined the impact of the COVID-19 pandemic on stock market volatility in some African nations primarily focused on the overall market performance rather than sector-level volatility (Del Lo et al. 2022; Zaremba et al. 2020). Given that the pandemic has not affected all sectors of the economy equally, a study that investigates only the overall stock market may not accurately capture the sector-specific effects of the pandemic and the potential for risk diversification by investing in sectors that are more robust to the pandemic.
This study therefore adds to the limited body of literature on the COVID-19 pandemic and sector volatility in sub-Saharan Africa. Understanding volatility is crucial for investors and policymakers because it influences investment decisions, risk management strategies, and market stability. First, we employ the Generalised Autoregressive Conditional Heteroskedasticity (GARCH) models to estimate the sector volatility in each of the selected stock exchanges. Subsequently, we utilize Explainable Artificial Intelligence (XAI) techniques to comprehend how COVID-19 events, such as infections and deaths, and government actions, including the implementation of economic lockdowns, vaccinations, and economic indicators, influenced sector-specific volatility. By harnessing XAI methods, such as decision trees and Shapley Additive Explanations (SHAP), this study seeks to unveil the key drivers of volatility and pinpoint the specific time frames when certain COVID-related factors exert significant influence on stock market volatility. This comprehensive analysis offers valuable insights for policymakers, putting measures to curb the negative effects of the pandemic, and also assists stakeholders interested in investing in industries that are more resilient to the pandemic’s negative effects.
The rest of the paper is organized as follows: Section 2 describes the theoretical and empirical literature related to this study. Section 3 presents the data, sources, and methodology. Section 4 presents and discusses the results, and Section 5 concludes the study.

2. Literature Review

2.1. Theories Related to the Impact of the Pandemic on Volatility

2.1.1. Black Swan Theory

The black swan, as defined by Taleb (2007) refers to rare and unpredictable events that have a significant impact on the global economy and financial markets. These events are characterized by their extreme rarity, high impact, and often unforeseeable nature. However, once they occur, they tend to be less random and more predictable.The COVID-19 pandemic has been dubbed a “black swan” event because of its unexpected nature and extreme impact (Ahmad et al. 2021), which resulted in millions of deaths and significant economic and social upheaval, with lockdowns, travel restrictions, and social distancing measures causing massive economic instability. Studies have shown that the pandemic has led to increased volatility in stock markets globally, with different regions experiencing varying degrees of impact (Kusumahadi and Permana 2021; Machado 2023). Black swan events, such as the COVID-19 pandemic, can trigger sell-offs, causing a decline in stock liquidity in certain sectors, leading to heightened market volatility. According to Ahmad et al. (2021), the COVID-19 pandemic manifested itself as a black swan event in the US and European stock markets in March 2020, when most stock markets experienced a severe decline in returns, leading to limited investment opportunities in most sectors.

2.1.2. Herding Behavior Theory

The herding behavior hypothesis is a significant theoretical concept that can shed light on the dynamics of stock market volatility, especially during crises such as the COVID-19 pandemic. Herding behavior refers to the tendency of individuals to follow the actions of a larger group rather than making independent decisions based on private information. The roots of the herding behavior hypothesis can be traced back to Keynes, who highlighted the motivations behind imitating and following group behaviors in uncertain environments. Keynes viewed herding as a response to uncertainty and individuals’ perceptions of their own ignorance, whereby people may follow the crowd, assuming that others possess superior information (Keynes 1937, 1964). In the context of financial markets, herding behavior can lead to exaggerated price movements and increased volatility as investors react to the actions of others rather than fundamental market factors. During times of uncertainty, such as the COVID-19 pandemic, investors may exhibit herd behavior because of factors such as regret aversion, lack of information, and trust in others’ decisions. This collective behavior can amplify market volatility and impact stock prices in ways that may not align with fundamental market conditions.

2.1.3. Lucas Critique

The Lucas Critique, proposed by Lucas (1976), is a critique of econometric models that aim to predict the effects of policy changes based solely on historical data. According to the Lucas Critique, such models may be inadequate because they do not account for the fact that people may change their behavior in response to policy changes, which can lead to unintended consequences. In the context of stock markets, the Lucas Critique suggests that government actions to temper the economy can affect stock market volatility by changing investors’ expectations and behavior. Governments around the globe have enacted various policies with the expectation that they will help reduce the spread of the pandemic and foster economic growth. However, if investors anticipate that a government policy will lead to lower economic growth, they may become more pessimistic and sell off stocks, leading to higher volatility. Therefore, the Lucas Critique highlights the importance of considering how people’s expectations and behavior may change in response to policy changes when trying to predict the effects of those policies on stock market volatility.

2.2. Outbreak of COVID-19 Pandemic in Sub-Saharan Africa

The first COVID-19 case in Africa was recorded on 14 February, in Egypt, which marked the onset of the pandemic on the continent. Subsequently, COVID-19 cases emerged in various countries across Africa (Chitungo et al. 2020). Despite this spread, the absolute numbers of COVID-19 cases and deaths in sub-Saharan Africa (SSA) have remained notably lower compared to higher-income countries and some low-middle-income countries (WHO 2020). In 2020, Africa accounted for only 4% of all confirmed cases and 3% of all deaths globally. The peak of daily COVID-19 cases and deaths in Africa during 2020 occurred in mid-July, with approximately 117,000 new daily cases reported across the region (WHO 2023). Among the top countries in terms of COVID-19 cases were South Africa, Nigeria, Cameroon, Cote d’Ivoire, Sudan, Kenya, and the Democratic Republic of Congo. South Africa reported the highest number of cumulative cases, reaching approximately 264,184 by mid-July, followed by Nigeria with 32,987 cases. In contrast, countries such as Zimbabwe, Botswana, Mauritius, Angola, Tanzania, Togo, and Burundi had lower COVID-19 case numbers, below 1000, in Sub-Saharan Africa during this period. Figure 1 illustrates the total COVID-19 cases and deaths for the top ten and bottom ten countries in sub-Saharan Africa as of mid-July 2020. The figures are presented as the natural logarithm of the total number of COVID-19 cases and deaths in each country as of mid-July 2020.
The emergence of COVID-19 variants has further impacted the sub-Saharan African region. Notably, four main variants that affected sub-Saharan African countries were detected. The Beta variant (B.1.351) was first detected in South Africa in October 2020 and has led to a surge in cases, reaching a peak in January 2021. This was followed by the gamma variant (P.1) from Brazil and the Delta variant (B.1.617.2) from India (Makulo et al. 2023). The Delta variant caused another surge in mid-July 2021, with a significant increase in daily infections and deaths. The Omicron variant (B.1.1.529), discovered in South Africa and Botswana in November 2021, exhibited higher transmissibility than previous variants but was less deadly than Delta. Its emergence led to a spike in daily COVID-19 cases across Africa, with a record high of approximately 290,000 by the end of December 2021. Subsequently, after mid-year 2022, daily COVID-19 cases in Africa have decreased significantly, with some countries reporting no new cases or deaths (Makulo et al. 2023; Murewanhema and Dzinamarira 2022). This decline marked a potential end to the pandemic in the region. In response to these challenges posed by variants, sub-Saharan African countries began rolling out vaccines at the beginning of January 2021 to combat the spread of the virus. However, vaccination rates remained low across the region, falling short of the targets set by international organizations, such as the IMF, to fully vaccinate a 40% portion of the population by the end of 2021.

2.3. Stock Market Development and Challenges in Sub-Saharan Africa

Stock market capitalization is generally lower in sub-Saharan African markets than in other developing economies, except for the Johannesburg Stock Exchange (JSE). According to the European Investment Bank (EIB) report by Colin et al. (2022), as of 2021, the JSE had the highest market capitalization at $1 trillion, representing 313.5% of its GDP. The Nigerian Stock Exchange (NGX) followed, with a market capitalization of $56 billion, equivalent to 12% of its GDP. The Nairobi Stock Exchange (NSE) had a market capitalization of $21.4 billion, while that of Ghana’s stock exchange was $9.2.6 billion. Bourse régionale des valeurs mobilières, which spans eight countries in the West African Economic and Monetary Union, had a stock market capitalization of 7.3 billion USD, accounting for a significant portion of its GDP. Additionally, the stock exchanges in Lusaka, Zimbabwe, Malawi, Uganda, and Namibia were among the smallest in sub-Saharan Africa, with market capitalizations below 6 billion USD as of early 2021 (Kossi 2021).
Despite their small size, stock exchanges in these countries have shown resilience and the potential for growth. For example, the Zimbabwe Stock Exchange experienced a substantial increase in market capitalization from USD 318 billion at the beginning of 2021 to USD 1300 billion by the end of the year, marking a growth of about 300% before adjusting for annual inflation at 61%. This growth positions the stock exchange as one of the fastest-growing exchanges during the pandemic (Sengere 2022).
While stock exchanges in sub-Saharan Africa have existed for some time, many are still in the early stages of development due to limited tradable instruments and a small number of listed stocks, which present significant constraints on stock market development in Africa. The number of listed companies on African stock exchanges remains relatively low; in 2020, there were only 1251 listed companies on African stock exchanges, compared to 2347 on the London Stock Exchange and 2933 on Nasdaq. Of these, 397 were listed on North African stock exchanges and 854 on exchanges in sub-Saharan Africa (Colin et al. 2022). Excluding companies listed on the Johannesburg Stock Exchange reduced the number of listed firms on sub-Saharan African stock exchanges to 523. Furthermore, stock exchanges in sub-Saharan Africa exhibit low turnover ratios relative to other emerging economies’ stock exchanges. The turnover ratio reflects the ease or difficulty in selling shares of a particular stock in the market. The combination of a small number of companies and low stock turnover contributes to low liquidity and increased volatility in these markets.

2.4. COVID-19 Pandemic and Stock Market Performance

Studies have explored the impact of the COVID-19 pandemic on stock market volatility using diverse methodologies across different regions. Papadamou et al. (2020) utilized panel data analysis to demonstrate how COVID-19 news heightened investor anxiety, leading to increased volatility in stock markets in Europe, the USA, Australia, and Asia. Similarly, Baek et al. (2020) employed the Markov-switching AR model to identify shifts in volatility levels, revealing that negative COVID-19 news has a more pronounced effect on volatility than positive news. Expanding the research scope to global markets, Kusumahadi and Permana (2021) applied the TGARCH modeling, and their findings indicated a moderate rise in volatility during the pandemic, driven by multifaceted factors beyond the direct influence of COVID-19. Ibrahim et al. (2020) highlighted the role of government interventions in mitigating stock market volatility in both developed and emerging markets in the Asia-Pacific region, with stricter measures, such as lockdowns, correlating with increased volatility. Conversely, Bakry et al. (2022) observed that higher COVID-19 death rates amplified volatility in emerging countries, but decreased it in developed nations through effective government actions.
Furthermore, comparative studies by Topcu and Gulal (2020), Ashraf (2020), and Uddin et al. (2021) underscore the negative impact of the pandemic on global stock markets. Notably, they found that news related to COVID-19 cases and deaths spurred higher volatility in developed markets than in emerging markets. However, Ledwani et al. (2021) underscored the importance of economic development and government support in reducing the negative effects of the COVID-19 pandemic on stock markets. Their study shows that stock markets in developed G7 countries were negatively impacted, but quickly recovered, while emerging stock markets exhibited a diverse response, with some taking longer to recover and others seemingly unaffected. Analyzing African stock markets during the pandemic, Kumeka et al. (2022) attributed market fluctuations to external shocks, such as oil price and exchange rate variations, rather than to COVID-19 cases or deaths. Other studies explored the effect of government interventions in the form of economic lockdown policies, travel restrictions, school closures, and quarantines on stock market volatility. For example, Zaremba et al. (2021) analyzed the impact of government interventions on stock market volatility and found that non-pharmaceutical interventions led to increased volatility in most stock markets worldwide. Furthermore, government intervention significantly increases volatility in global stock markets prior to the introduction of the vaccination program; after the introduction of vaccines, government stringency policies had less effect on stock volatility (Abdullah et al. 2022; Yu and Xiao 2023). Abdullah et al. (2022) show that the effect of government intervention varies among stock markets in different countries. In high-income countries, government interventions led to a decline in stock volatility, while in lower- and middle-income countries, it led to an increase in volatility.
Most studies on the impact of the pandemic on stock performance have focused on stock returns rather than volatility. Xu (2021) conducted an in-depth analysis of the effect of COVID-19 cases and the ensuing uncertainty on stock markets in developed countries, such as the US and Canada, revealing a negative correlation between increasing COVID-19 cases and declining stock returns. Similarly, Harjoto et al. (2021) demonstrated a decline in stock market returns in developed countries in response to rising COVID-19 cases, employing a robust regression method to analyze the impact of the pandemic on both developed and emerging markets. In contrast, Yousfi et al. (2021) used a regression analysis to show that COVID-19 cases and fatalities led to diminished stock market returns during the initial wave of the pandemic. However, swift market recoveries were observed, particularly in nations where government interventions such as economic recovery stimulus programs were implemented.
Further comparative analyses by Kharbanda and Jain (2021), Sachdeva and Sivakumar (2020), and Topcu and Gulal (2020) underscored the heightened vulnerability of emerging markets to the adverse effects of the pandemic, resulting in decreased stock market returns as COVID-19 cases surged. Alam et al. (2021) and Ncube et al. (2023) employed event study analyses to explore the impact of the pandemic on stock market returns across various sectors. Alam et al. (2021) who considered stock markets in developed countries, highlighted positive returns in sectors such as food, pharmaceuticals, and healthcare following the pandemic announcement in contrast to the poor performance observed in the transportation sector. Ncube et al. (2023) focused on sub-Saharan stock markets, revealing sector-specific variations in performance across exchanges after pandemic outbreak, with consumer staples emerging as resilient to the pandemic’s adverse effects.
Takyi and Bentum-Ennin (2021) focus on the impact of the COVID-19 pandemic on stock market performance in African countries using a Bayesian structural time series approach. They find that while most nations experienced notable declines in stock market performance during and after the pandemic, some countries were relatively unaffected. These researchers suggest that there is no chance that the COVID-19 pandemic could positively affect stock market performance in Africa. However, their study was based on stock market performance at the index level and was limited to the short-term pandemic period up to June 2020.
In all of the above studies on the COVID-19 pandemic and stock market volatility, we find that researchers have been considering the impact of the pandemic on the stock market as a whole without considering the sector-specific effects of the pandemic on stock market volatility; most of these studies were mainly conducted in developed and emerging markets, leaving more work to be done in sub-Saharan Africa.

3. Materials and Methods

3.1. Data and Sources

This study examines the effects of the COVID-19 pandemic on market volatility in the sub-Saharan African stock markets. This study focuses on four exchanges that comprise the Johannesburg Stock Exchange (JSE) and the Nigeria Stock Exchange (NGX), which are the two largest exchanges in sub-Saharan Africa by market capitalization, and the Zimbabwe Stock Exchange (ZSE) and Lusaka Stock Exchange (LUSE), which represent relatively smaller exchanges in the region. Three sets of data were collected in this study. First, stock-specific data, comprising daily stock prices and trading volumes from each sampled exchange, were gathered from the Market Watch website at <https://www.marketwatch.com/investing/stock/{ticker}/download-data?countrycode={countrycode}>, accessed on 27 December 2023. COVID-19 data, which include COVID-19 metrics such as cases, deaths, vaccinations, hospitalizations, and government policies, were obtained from the Our World in Data website at <https://github.com/owid/covid-19-data/tree/master/public/data>, accessed on 15 January 2024.
Lastly, we collected macroeconomic data for the inflation and exchange rate variables corresponding to each selected country’s stock exchange sourced from the respective country’s Central Bank websites. The selection of inflation and exchange rates as macroeconomic variables was based on their availability in more frequent periods, which aligns with the daily recording frequency of COVID-19 and stock data. While the inflation data were originally recorded on a monthly basis, they were further interpolated to daily data using the spline interpolation method to maintain consistency.
The study period spans from January 2019 to July 2022. This period was selected based on the availability of data concerning COVID-19 events in sub-Saharan Africa, and this time frame adequately covered all COVID-19 variants that affected the region, ensuring a comprehensive analysis. While 2019 is utilized as a benchmark for comparison, it is excluded from the assessment of how COVID-19 events influenced stock market volatility, because data on COVID-19 are not available for that period. Table 1 summarizes the COVID-19 period in each sampled country.
Furthermore, our study focuses on the sector-specific effects of the COVID-19 pandemic. Thus, we further segmented our stock exchanges into various sectors using Global Industry Classification Standards (GICS) (MSCI 2023). GICS classifies stocks into 11 sectors: consumer discretionary, consumer staples, energy, financial, healthcare, information technology, communication, industry, materials, real estate, and utilities. However, since sub-Saharan African stock markets have fewer stocks traded and some stocks have missing information, not all 11 sectors were included. Additionally, we combined the information technology and communication sectors to create the ICT sector because of fewer stocks in these sectors. Table 2 summarizes information on the sectors covered by each exchange and the number of stocks included in each sector.

3.2. Methodology and Justification of Variables

This study analyses the impact of the COVID-19 pandemic on stock volatility using a two-stage approach. First, we estimated conditional volatility for each sector using the generalized autoregressive conditional heteroskedasticity (GARCH) models and then used the Akaike Information criterion (AIC) to select the best model. The model with the lowest AIC was applied to analyze the impact of the pandemic on stock volatility. The second stage involved assessing the effect of the pandemic on stock volatility. We first analyzed the GARCH model results to check for the relationship between conditional volatility and exogenous variables to determine the impact of COVID-19 factors, as well as other control variables, on stock volatility in each sector. Following the GARCH analysis, we applied Explainable Artificial Intelligence (XAI) in the form of SHapley Additive exPlanations (SHAP) to identify the most significant factors driving stock volatility during the COVID-19 pandemic and how these factors are related to stock volatility. SHAP serves as a method of addressing the weakness found in GARCH models in that it is model-agnostic, and thus there is no need to make assumptions regarding the distribution of the data for the variables used. It also clarifies how the results of the analysis were arrived at.

3.2.1. Volatility Estimation

To estimate daily stock volatility, we utilized GARCH models, which are commonly used in financial econometrics to capture the volatility clustering effect observed in financial time-series data. GARCH models have the advantage of accounting for the persistence of volatility in financial markets, making them well suited for capturing the time-varying volatility observed in financial markets (Bollerslev 1986). Specifically, we employed Asymmetric GARCH models, including GJR-GARCH and Exponential GARCH (EGARCH), which are more effective in modeling financial time series data that often exhibit a fat-tailed distribution and volatility clustering observed during crisis (Alberg et al. 2008; Gökbulut and Pekkaya 2014; Miron and Tudor 2010). Additionally, these models capture the leverage effect. The leverage effect is the observation that negative shocks to security returns tend to cause more volatility than positive shocks (Brooks 2019).
We estimated the daily stock volatility from stock returns. We calculated the stock returns from the daily stock prices as the natural logarithm of the current stock price divided by the previous day’s stock price, as shown in Equation (1).
R t = l n P t P t 1
Following the computation of stock returns, we grouped them by sector and then computed average sector returns. Grouping returns rather than prices allows for a more accurate comparison of performance across different sectors within and across different stock exchanges as it normalizes the data and eliminates the impact of varying stock prices. Although some stock exchanges may have market capitalization-weighted sector indices, the sector classification may not be consistent with the GICS classification.

3.2.2. GJR-GARCH Model

This model was suggested by Glosten et al. (1993) as an extension of the GARCH model to capture asymmetries in terms of positive and negative shocks. To this end, the model adds a dummy variable to the variance to determine whether there is a statistically significant difference when the shocks are negative.
The GJR-GARCH model can be represented using the following formula:
h t = ω + i = 1 q ( α i + γ i D t i ) ε t i 2 + k = 1 p β k h t k + u = 1 v π u X t
The parameters of the GJR-GARCH model include the constant term ω , ARCH coefficient α , GARCH coefficient β , and GJR-GARCH coefficient γ . The constant term represents the unconditional variance of the series, whereas the ARCH coefficients capture the impact of the past squared errors on the current conditional variance. The GARCH coefficient captures the impact of past conditional variances on the current conditional variance, and the GJR-GARCH coefficient captures the impact of negative shocks on volatility. The dummy variable D t takes the value of 1 for ε t < 0 and 0 otherwise. If γ i is significant and positive, negative shocks have a larger effect on h t than do positive shocks. The non-negativity conditions ω > 0, α > 0, β > 0, and α + γ ≥ 0 are artificially imposed to ensure that the coefficients are positive. X t is a vector of exogenous variable values indexed by time t. In this case, X t represents the COVID-19 metrics as well as macroeconomic variables while π u represents the coefficient of the exogenous variable X.

3.2.3. The Exponential GARCH (EGARCH)

The EGARCH model was coined by Nelson (1991) and, like the GJR-GJR model, it is an extension of the simple GARCH model that accounts for the asymmetry in volatility estimation. However, in the EGARCH model, volatility is modelled as the log of variance, and this property makes it superior to other GARCH models as there is no need to artificially impose non-negativity constraints on the model parameters. The EGARCH model with exogenous variables is expressed by the following equation:
log h t = ω + i = 1 q α ε t i h t i + i = 1 q γ ε t i h t i + k = 1 p β l o g h t k + u = 1 v π u X t
The parameters ω , α , β , and π are interpreted as in the GJR-GARCH model. Gamma (γ) represents asymmetry in the volatility response to positive and negative shocks. A positive gamma value indicates that the impact of a negative shock on volatility is greater than that of a positive shock of the same magnitude. Because we are modeling the log of variance, log h t , even if the parameters are negative, h t will be positive. The exogenous variable X is interpreted in the same way as in the GARCH models. Table 3 below provides a description of the exogenous variables used in this study.
We use a multifaceted approach to modeling the impact of the pandemic on stock volatility to comprehensively capture both the healthcare and economic impacts of the COVID-19 pandemic in various contexts. Variables such as cases, deaths, hospitalizations, and vaccination rates directly reflect the severity of a health crisis and influence investor sentiment and market dynamics. The stringency index captures the regulatory environment and restrictions imposed, impacting business operations, and consequently, stock market volatility. Additionally, economic indicators such as inflation, exchange rates, and the volume of shares traded are considered control variables to account for broader macroeconomic trends that can shape investor behavior.

3.3. Explainable Artificial Intelligence

Explainable Artificial Intelligence (XAI) is a machine learning approach that can produce human-understandable explanations of AI-based information systems (Ahmed et al. 2022). It overcomes the weaknesses of primitive machine learning models, such as logistic regression and linear regression, which assume a linear dataset. XAI can handle nonlinear data, which is common in real-world data (Ali et al. 2023). Moreover, other ML techniques, such as deep neural networks, need to be trained on large datasets; however, given the constraints on access to data in developing markets, AI models, such as XAI, are preferable as they can be trained on smaller datasets and still produce more accurate results by increasing the number of filters an AI uses (Molnar 2020).
To apply XAI, Random Forest, Support Vector Machine, and XGboost types of machine learning algorithms were trained on a dataset of COVID-19 events. The input variables include COVID-19-related data and macroeconomic variables. Each ML algorithm was trained on historical data to understand the relationships between input variables and stock market volatility. The model with high explanatory power was then selected for further analysis using a method in XAI known as SHapley Additive exPlanations (SHAP).
SHAP is a mathematical method based on game theory that aims to explain machine learning model predictions by calculating the contribution of each feature to the prediction. It provides insights into how individual features influence model predictions and enhance transparency and interpretability. The SHAP values are determined using coalitional game theory, which optimizes feature selection by considering interactions and dependencies. The SHAP value is calculated as the marginal contribution of a feature value to the prediction across all possible coalitions, ensuring a fair distribution of rewards among the features based on their contributions. This approach allows for efficient computation of feature importance, even in high-dimensional datasets. It addresses redundancy by evaluating the correlations among features and computing feature importance scores. The SHAP methodology is model-agnostic, which means that it does not make any assumptions about the algorithm used in black-box models; therefore, it can be used to interpret any machine learning model, regardless of its type or structure (Bhattacharya 2022).
For a dataset of N features, the marginal contribution of feature i can be calculated using the formula of the SHapley values shown in Equation (4), as proposed by Bhattacharya (2022).
φ i = S N / i S ! N S 1 ! N ! ( v ( S i v S )
In this research we define φ i as the contribution of exogenous variable i to stock volatility, S as the coalition subset of exogenous variables, and (S) as the total value of S. SHAP values can be positive or negative, where a high positive value indicates a high positive contribution to the explained variable, and a high negative value shows a more significant negative contribution. Compared to other XAI techniques like the LIME framework, SHAP provides a more robust explanation, as stated by (Bhattacharya 2022). Furthermore, SHAP is model-agnostic, which means that it does not make any assumptions about the algorithm used in black-box models.
Given the inherent complexity of SHapley values, their interpretation requires intuitive visualizations. For deeper understanding, we employed SHAP summary plots, a powerful tool for visualizing global model explainability. It highlights the important features and impact of each feature on the explained variable. These plots display feature instances along the horizontal axis, color-coded (blue for lower values, red for higher values), and positioned based on their contribution to the model output (positive on the right, negative on the left).

3.4. Analytical Software

Our main analytical tool was Python 3.11.7, which enabled us to work with large datasets of stock market data and COVID-19 cases and deaths. Python 3.11.7, through its Pandas library, helped us organise our stocks into sectors with ease. With a few lines of coding, we were able to map stocks with their respective sectors. The Pandas library also enabled researchers to handle stocks with missing data. Despite the large dataset of stock prices and trading volumes, we were able to quickly search for stocks with missing values and drop them. Furthermore, using functions built on the Pandas and Numpy libraries, we computed our variables of interest, such as stock returns and dollar trading volumes. The scikit-learn library was used for data scaling, normalization, and in handling outliers. The Statsmod library was used in econometric modeling, such as in the estimation of our GARCH models. This library also has built-in functions for selecting the mean model and testing for ARCH effects. Finally, Python was used to run the machine learning algorithms. This includes training the machine learning models, such as Random Forest, XGBoost and Support Vector Machines (SVM) on our dataset, as well as in feature analysis using SHAP.

4. Results

In this section, we delve into our research findings concerning the impact of the COVID-19 pandemic and its related occurrences on stock volatility within the sub-Saharan African region. The initial subsection presents descriptive statistics. Subsequently, we showcase our results from the GARCH estimation and the outcomes of the analysis using explainable Artificial Intelligence (XAI). Following the presentation of the results, we consolidate our findings in the Discussion section by comparing the effects of the COVID-19 pandemic across different sectors and stock markets and establishing connections with other researchers to enhance our findings.

4.1. Descriptive Statistics

Table 4 displays the descriptive statistics for the COVID-19 factors and macroeconomic variables in each country in which the selected stock exchange is located. South Africa exhibited the highest mean daily COVID-19 deaths and cases at 4121 and 121, respectively, significantly surpassing those of Zimbabwe, Nigeria, and Zambia. Despite Nigeria experiencing high case and death rates in the early stages of the 2020 pandemic (refer to Figure 1), the mean daily COVID-19 cases and deaths over a three-year period were 293 and 3, respectively, lower than those of Zimbabwe and Zambia. This finding suggests that Nigeria may have effectively managed the spread of the COVID-19 pandemic and reduced case fatalities. While South Africa reports the highest mean daily COVID-19 vaccination records, Nigeria leads in the daily COVID-19 vaccine rollout, achieving a peak daily record of 797,209 compared to South Africa’s 414,065. This highlights Nigeria’s dedication to curbing the spread of this virus. Regarding the positivity rate from COVID-19 tests, South Africa’s mean is 11%, followed by Zimbabwe at 6%, and Nigeria at 5%. No records were available for Zambia. However, Zimbabwe once recorded the highest positive rate at 44%, surpassing South Africa and Nigeria, which had highest records of approximately 30%. Data on hospitalizations were only available for South Africa, with no records for Zimbabwe, Nigeria, or Zambia. Zimbabwe exhibits the highest average stringency index at 62%, indicating stricter government measures, such as business lockdowns, school closures, and travel restrictions, compared to Nigeria and South Africa, which hover around 50%.
In terms of macroeconomic variables, Zimbabwe faces the highest inflation with an average of 290% annually, alongside an ever-depreciating currency that reached a peak of 628 Zimbabwean dollars (ZWL) per USD from a low of 25 ZWL per USD over the study period. South Africa maintained an average inflation rate of approximately 4.6% during the study period, while Nigeria and Zambia recorded mean inflation rates of 13% and 17%, respectively. Currency stability is observed for South Africa, Nigeria, and Zambia throughout the study period, in contrast to the high standard deviation in Zimbabwean inflation and currencies, which had significant volatility in these economic indicators.

4.2. Trend Analysis

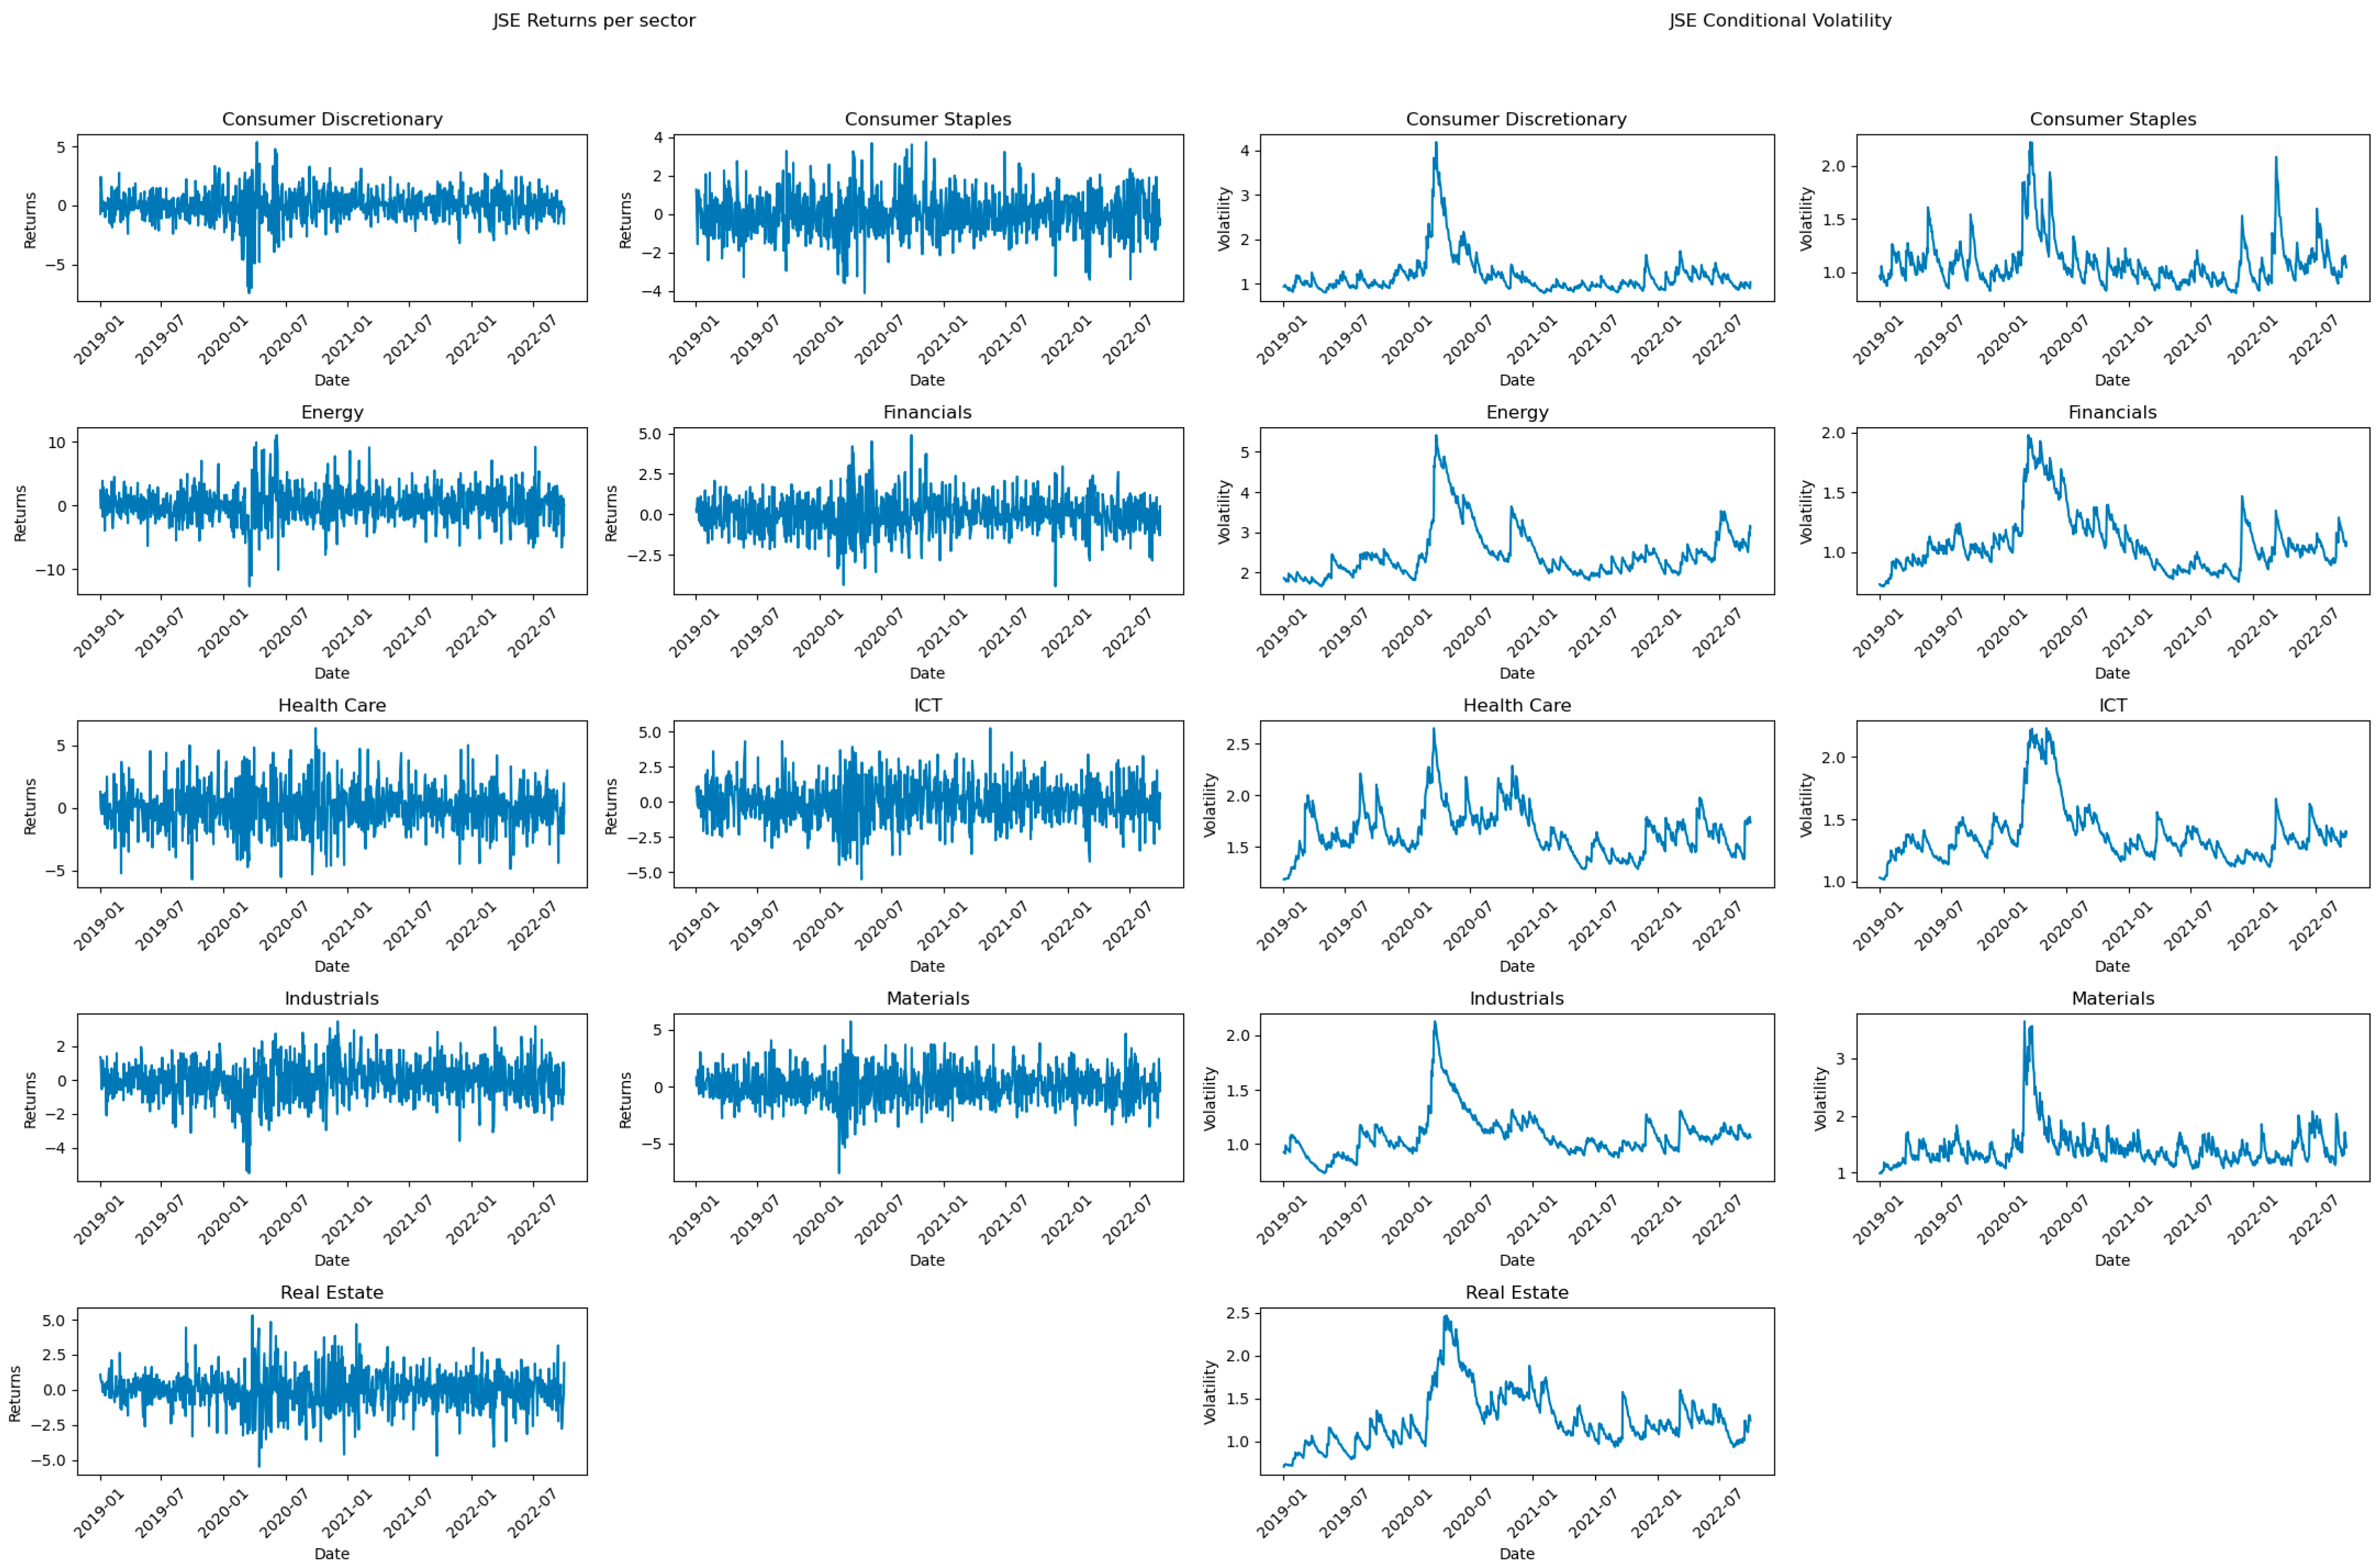
In this section, we provide a trend analysis of stock returns and volatility for each sector of the sampled stock exchanges. This analysis allows us to verify the accuracy of the estimated conditional volatility by comparing it with the observed volatility in stock returns. Furthermore, we compare the volatility levels in the pre-pandemic period and during the pandemic to understand the changes in stock market stability due to the outbreak of the pandemic. Figure 2 illustrates the results for the returns and volatilities of the Johannesburg Stock Exchange (JSE) sectors. The results show that for all sectors, there was a spike in volatility following the outbreak of the pandemic in March 2020, as seen in the returns plots and confirmed by higher volatility values in the conditional volatility plots. This confirms the reliability of our volatility estimation using the GARCH models. We also observe some volatility persistence in the energy, ICT, financial, industrial, and real estate sectors, where the volatility in these sectors took time to return to pre-pandemic levels. However, in sectors such as consumer discretionary, consumer staples, and materials, the spike in volatility quickly drops to pre-pandemic levels within a few months. The plots in Figure 2 also show some leverage effects, with higher volatility occurring in most sectors during times of negative returns rather than positive returns.
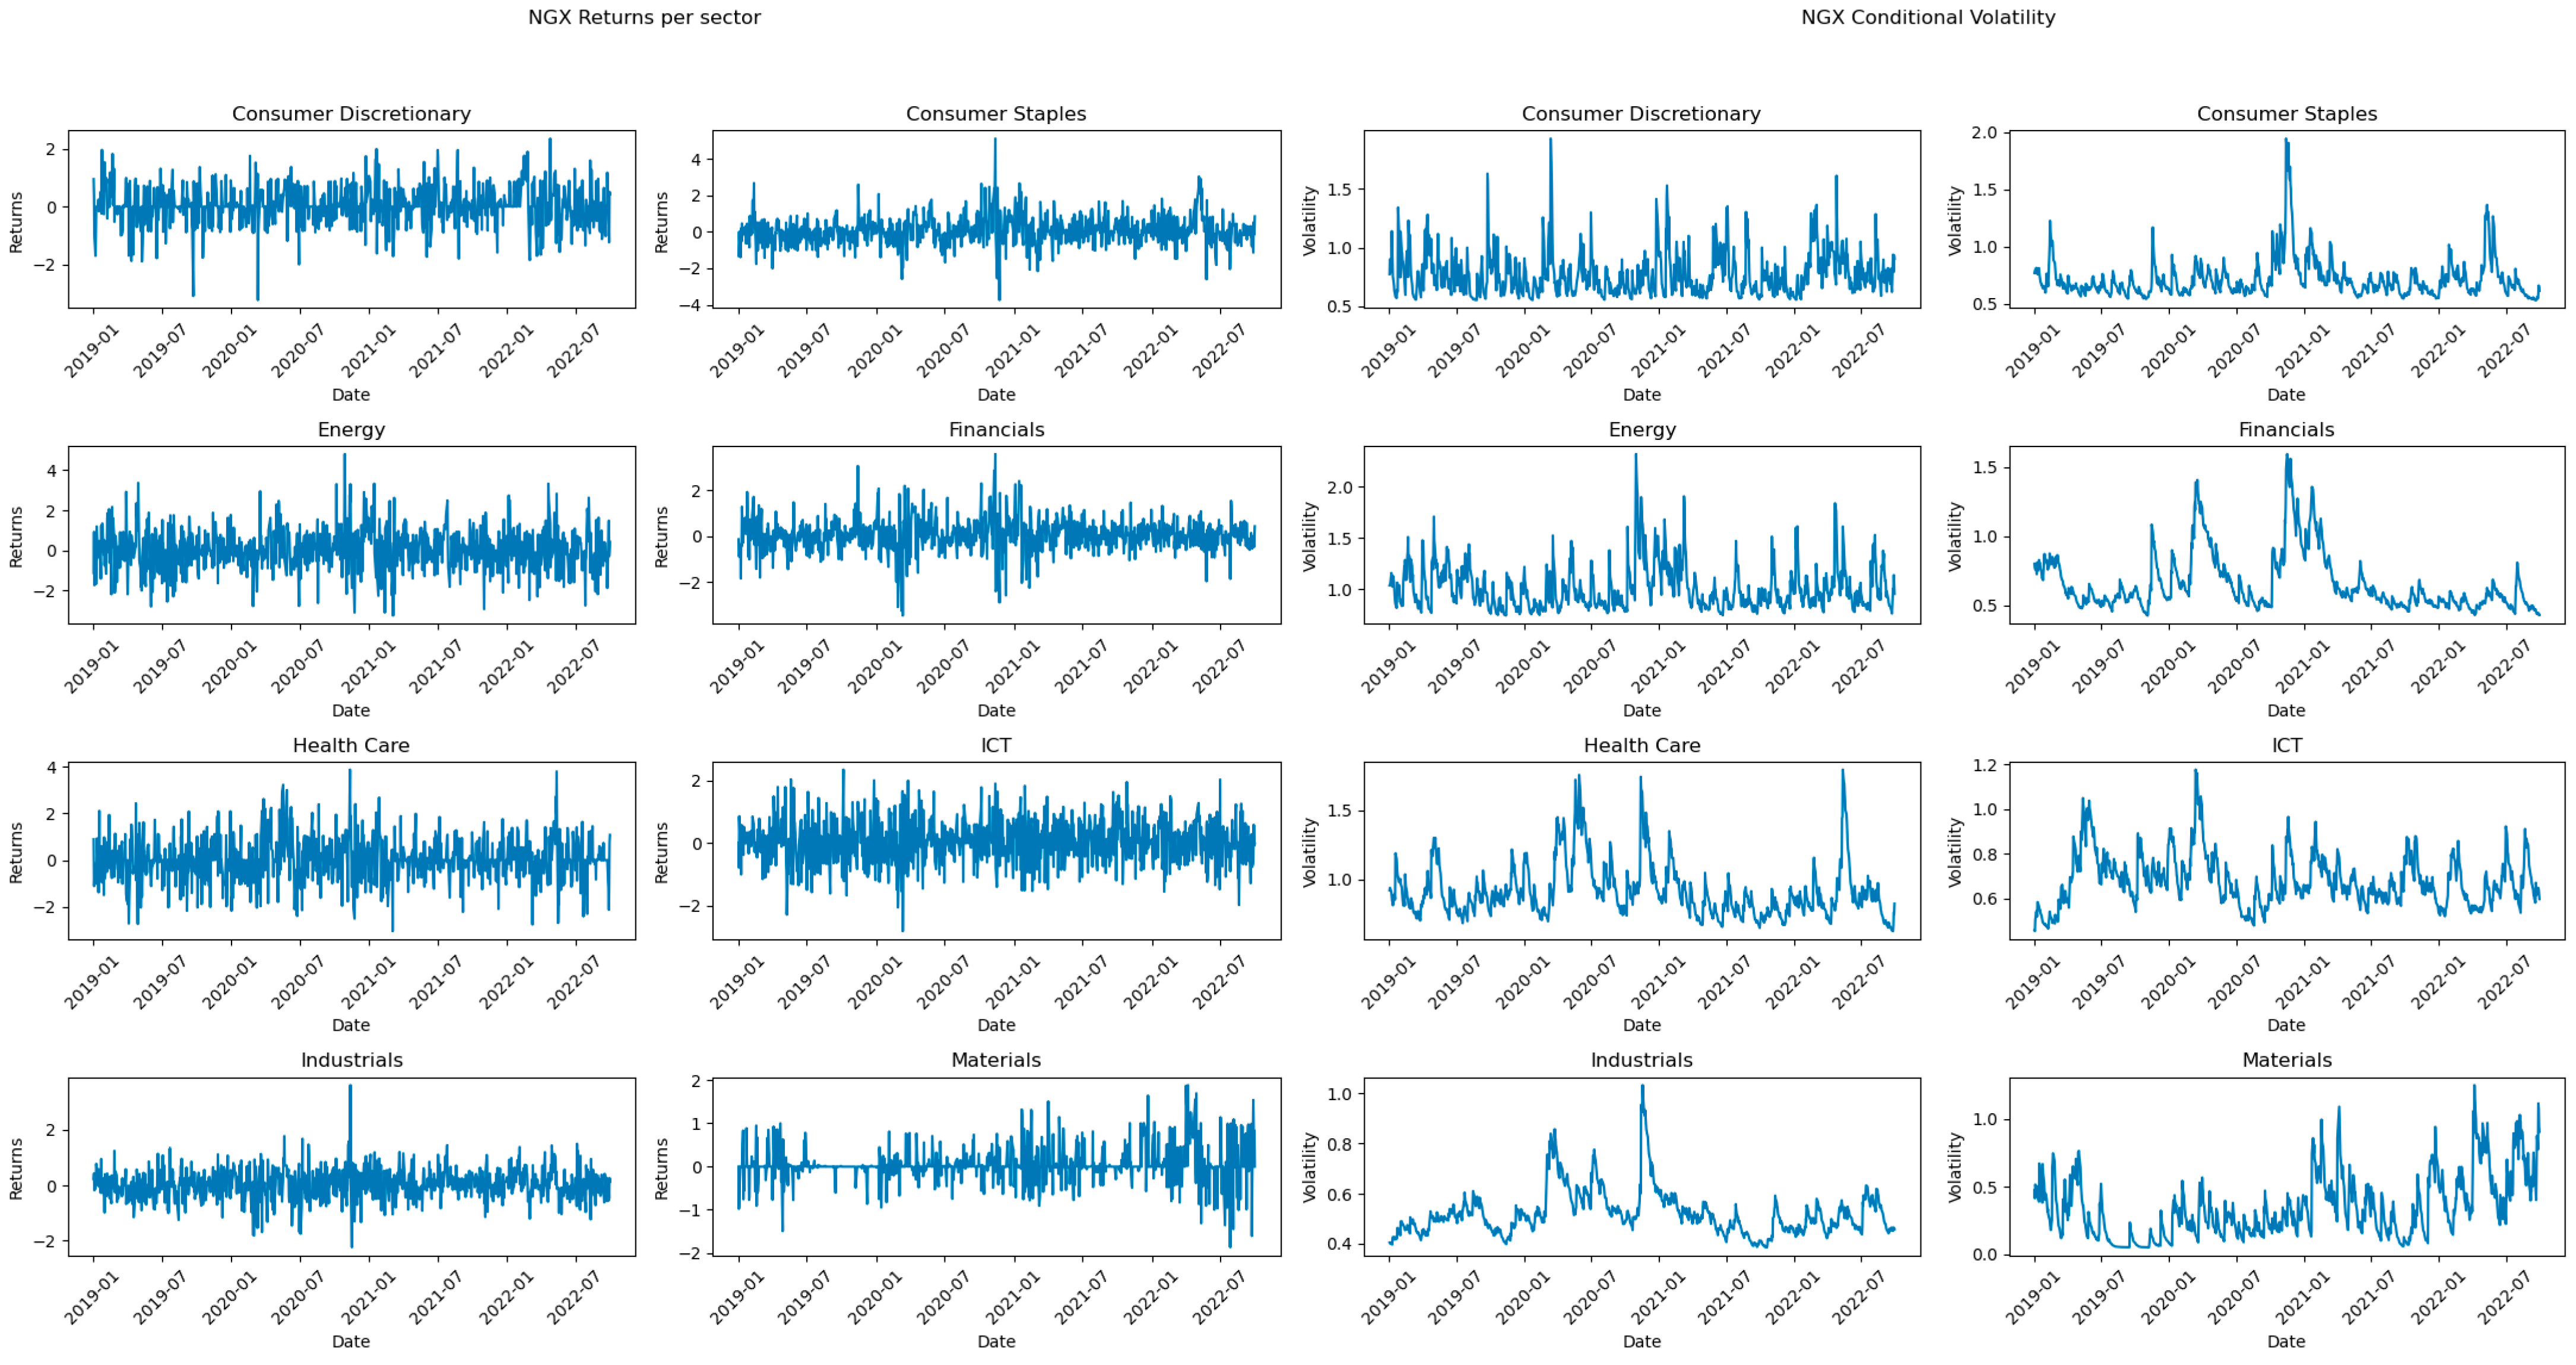
Figure 3 presents the results for the Nigerian Stock Exchange (NGX). Following the outbreak of the pandemic in March 2020, we observe an increase in volatility in the ICT, financial, healthcare, and industrial sectors. Both the returns and volatility plots confirm these results. In contrast, sectors such as consumer staples, energy, and materials experienced higher volatility towards the end of 2020, joined by sectors such as financials, healthcare, and industrials. This period coincided with the second wave of the COVID-19 pandemic in sub-Saharan Africa, due to the outbreak of the beta variant. We also observe some clustering of volatility in the ICT, healthcare, industrial, and materials sectors, where periods of higher volatility seem to persist for longer. The leverage effect can be seen in sectors such as healthcare and ICT, where periods of higher volatility are mostly associated with negative returns in the returns plot.
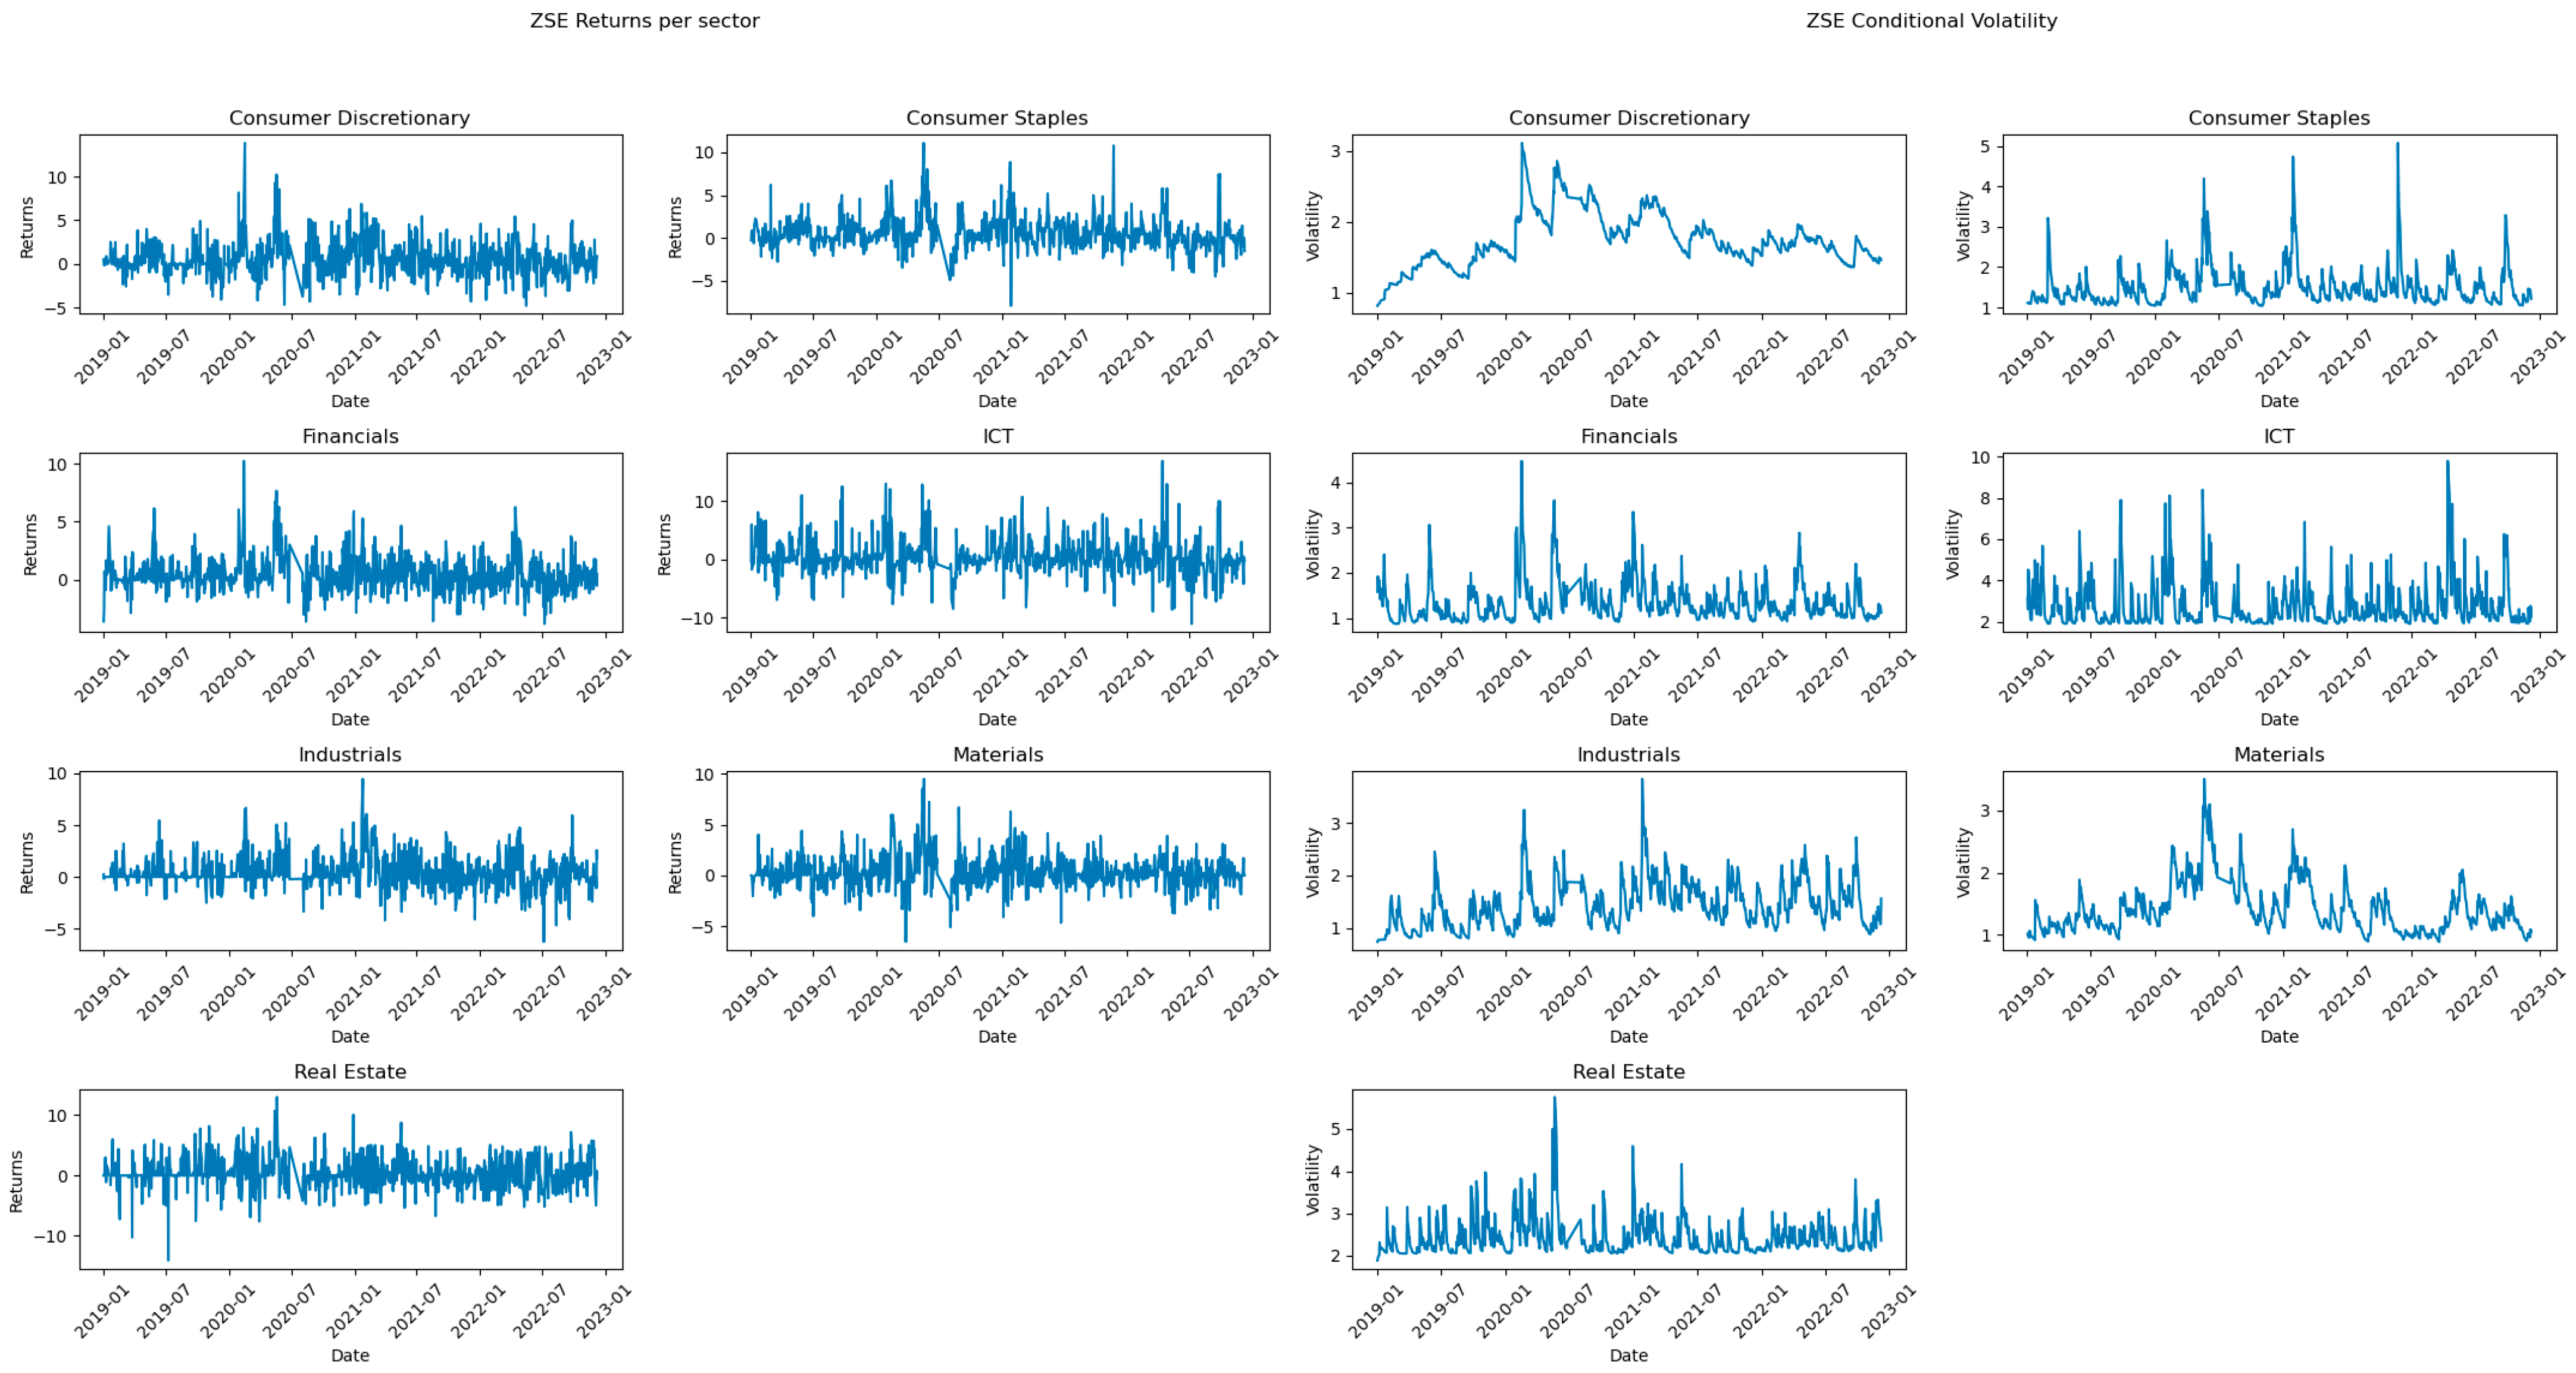
Figure 4 depicts the returns and conditional volatility for the Zimbabwean Stock Exchange (ZSE). We observe an increase in volatility in the consumer discretionary, industrial, materials, and real estate sectors at the onset of the pandemic. However, the volatility in the real estate sector is transient. The ICT and financial sectors experienced heightened volatility, even before the pandemic. The volatility in the consumer staples sector remained low, with a few instances of increased volatility at the beginning and end of 2021, coinciding with the emergence of the beta and omicron COVID-19 variants. It appears that there is minimal volatility persistence in most sectors of the ZSE, except for the materials and consumer discretionary sectors, where higher volatility seems to endure longer. We find that the spikes in returns in the returns plot align well with the increase in volatility observed in the conditional volatility plot, validating the reliability of our GARCH estimation. Moreover, we observe that an increase in volatility in most sectors on the ZSE is more closely linked to positive spikes in stock returns than to negative ones.
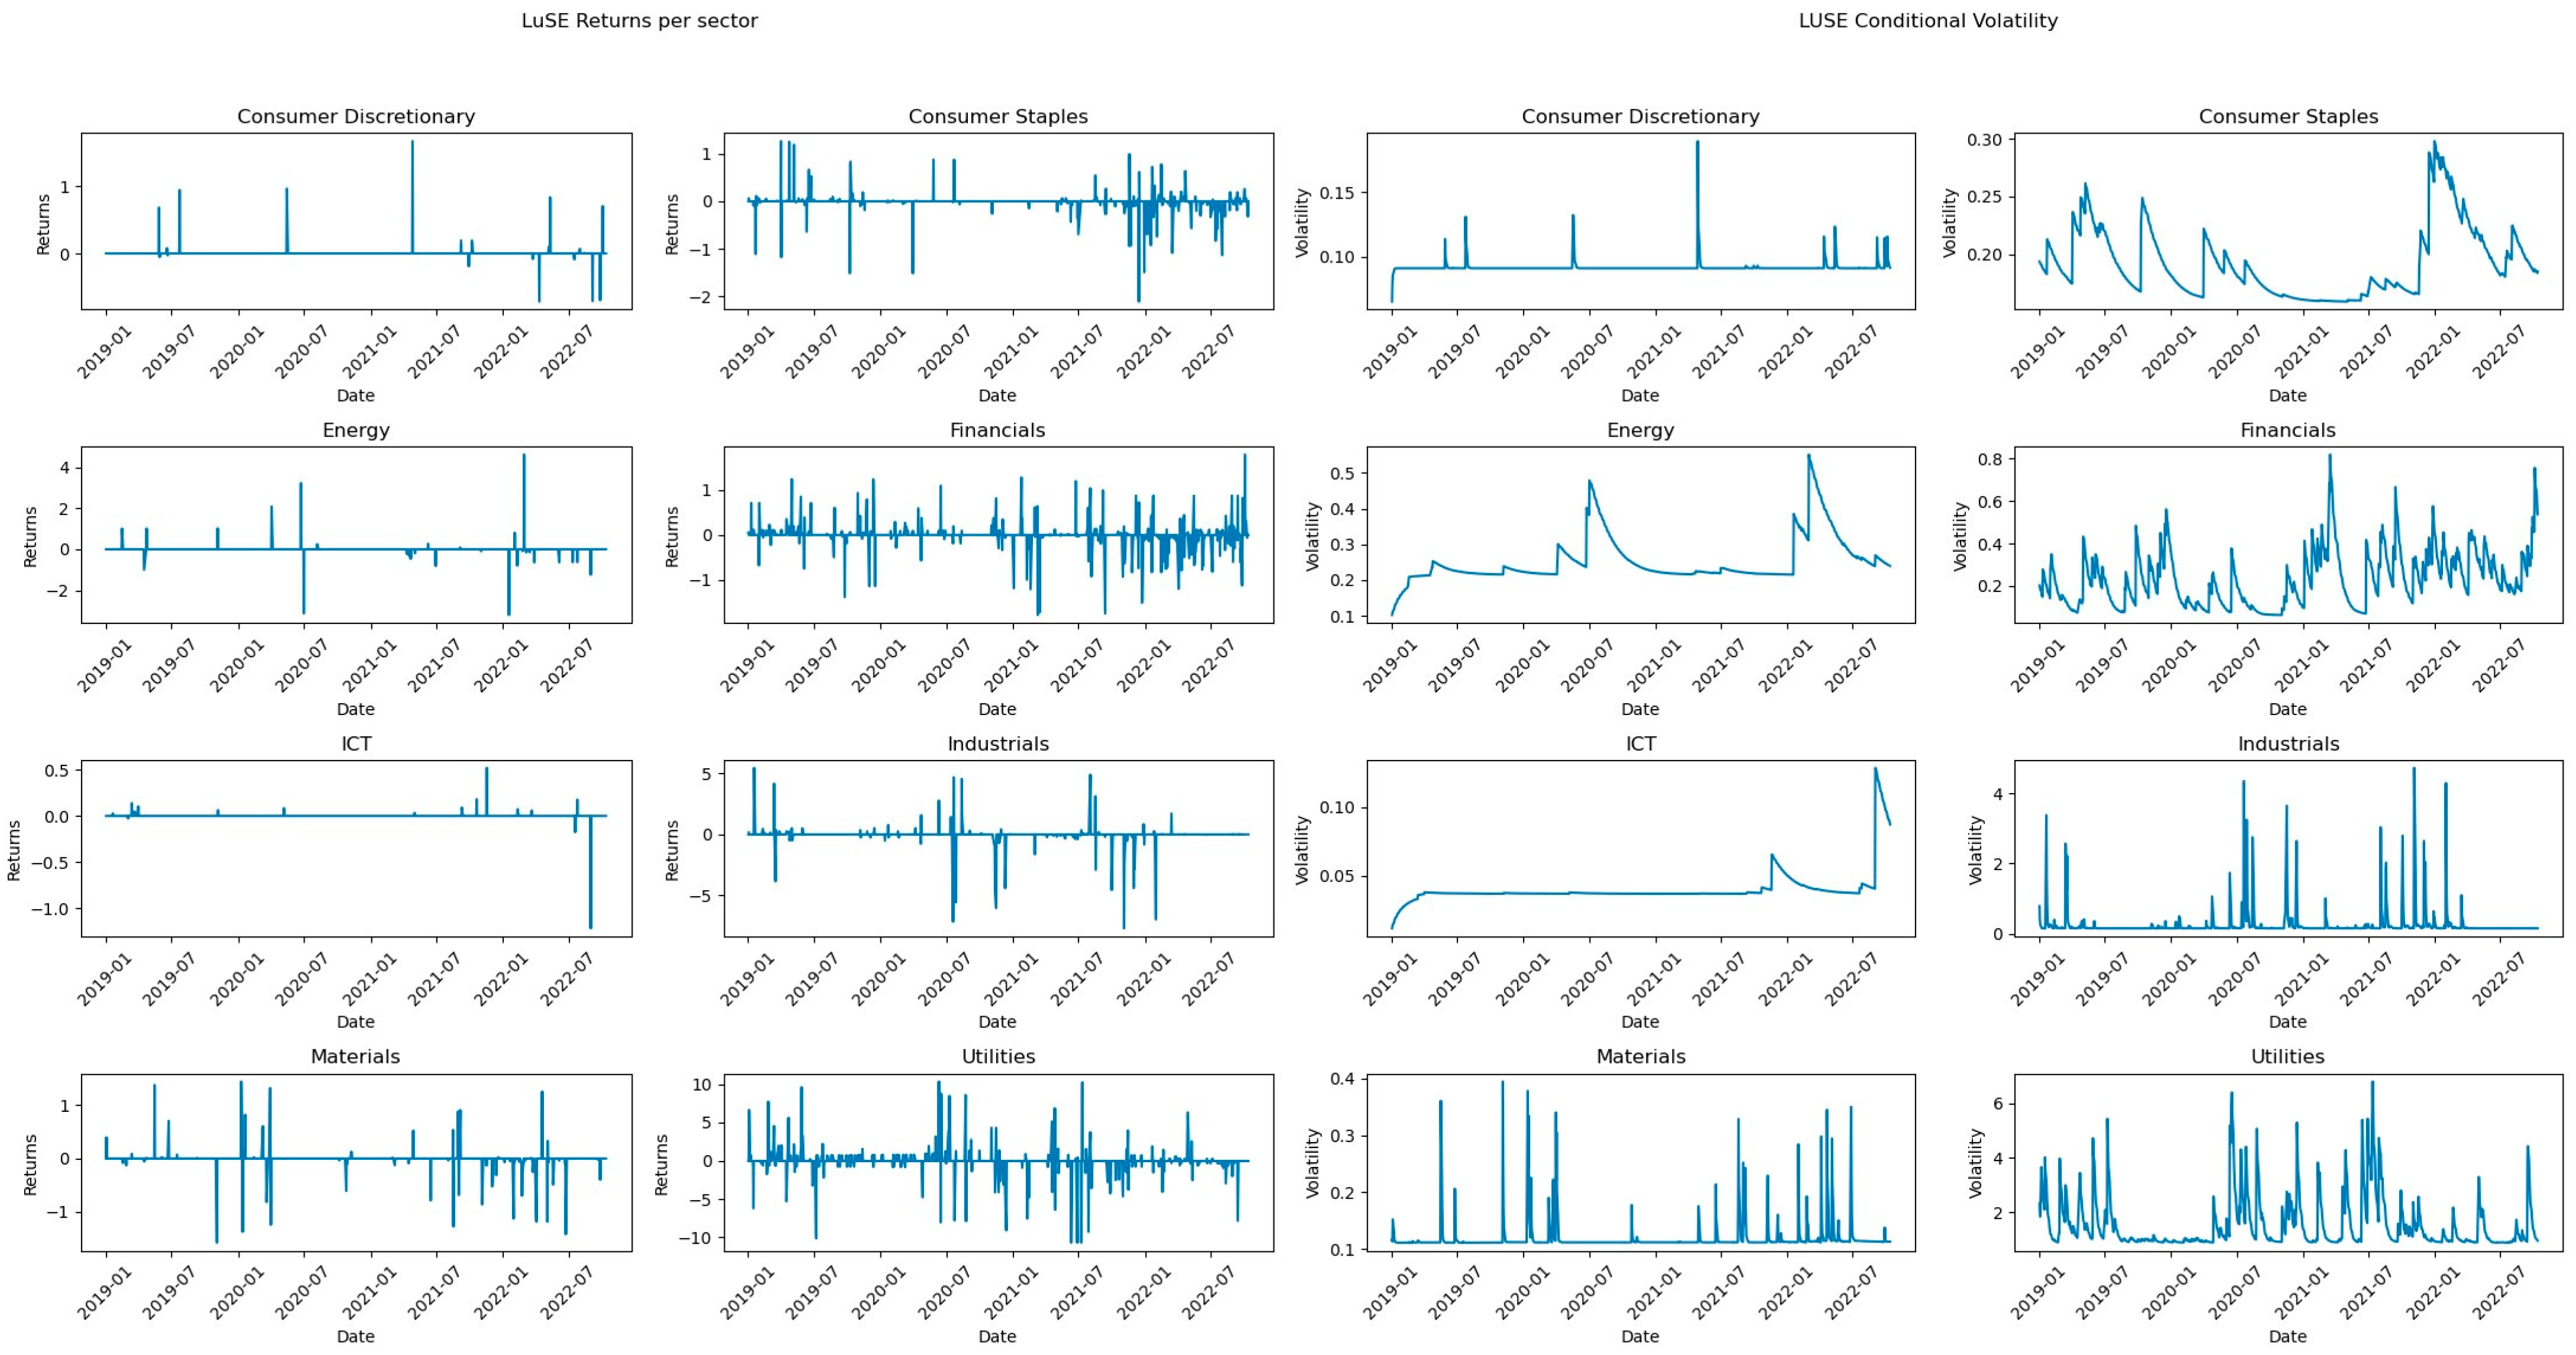
Regarding the Lusaka Stock Exchange (LuSE), Figure 5 displays the returns and volatility plots. Although the exchange experiences infrequent trading, we observe consistency in volatility and return plots. We find that periods with spikes in returns are associated with an increase in volatility, confirming the reliability of our volatility estimates using GARCH models. Interestingly, we did not observe any increase in volatility at the onset of the pandemic in any sector except for the utility sector. In the financial sector, volatility increased at the beginning of 2021, coinciding with the period when we had the beta variant in sub-Saharan Africa. Although volatility has remained low on the LuSE, the industrial and utilities sectors have the highest volatility, with certain days recording an average daily volatility of more than 4%, notably in mid-year 2020 and mid-year 2021.

GARCH Results

In this section, we present the results of GARCH modeling. We used two GARCH models, GJR-GARCH and EGARCH, and selected the model with the lowest AIC for further analysis. We included COVID-19 events and macroeconomic variables as exogenous variables to examine their impact on volatility.
Table 5 presents the results for the E-GARCH model for the sectors in the JSE. Significant positive alpha coefficients for the consumer discretionary, energy, and industrial sectors indicate that past news shocks led to increased stock volatility in these sectors. A significantly negative alpha value for the ICT sector suggests that news shocks actually resulted in a decline in volatility in this sector. Higher and significant beta values for most sectors indicate high volatility persistence in the JSE during the COVID-19 pandemic. The significantly negative gamma coefficient for most sectors, except for industrials and materials, confirms the presence of the leverage effect in these sectors, where volatility is higher when prices fall than when they rise, as discussed above.
The results in Table 5 indicate that the change in COVID-19 cases and deaths (represented by variables ∆_Cases and ∆_Deaths) as well as the rate of positive COVID-19 tests had no significant influence on stock volatility in all sectors. However, the stringency of government policies, such as lockdowns, social distancing measures, and business closures, had a significant and positive impact on stock volatility in most sectors, except for the healthcare sector, where volatility decreased as government measures became more stringent. A positive and significant hospitalization ratio in most sectors indicates that an increase in hospitalizations led to an increase in volatility in most sectors, except for the healthcare, consumer discretionary, and materials sectors, where the coefficient is negative and significant, suggesting that volatility actually decreased as hospitalizations increased. The negative and significant vaccination ratio variable for all sectors indicates that an increase in vaccines administered led to a decrease in stock volatility in all sectors except for the real estate sector, which was unaffected.
The exchange rate variable, which is negative and significant, suggests that the depreciation of the South African Rand against the USD led to an increase in stock volatility across all the sectors. The coefficient of the inflation variable is positive and significant in most sectors, except for consumer staples, consumer discretionary, ICT, and real estate, where it is negative, and the financial sector, where it is insignificant. Therefore, an increase in inflation is associated with increased volatility in the healthcare, industrial, energy, and materials sectors. In most sectors, the volume of trade variable is positive and significant, suggesting that increased trading activity on the stock exchange exacerbates stock volatility.
Table 6 presents the results of the E-GARCH analysis for the Nigerian stock exchange (NGX). A positive alpha coefficient in most sectors indicates that past news shocks led to an increase in stock volatility in these sectors. The financials, healthcare, and ICT sectors were the most affected, as shown by their higher alpha coefficients. The beta values for all sectors were high and significant, indicating persistent volatility in these sectors during the COVID-19 pandemic, although persistence was lower in the consumer discretionary and energy sectors. The insignificant constant omega in all the sectors suggests that volatility tends to stem from news shocks and that unconditional volatility is low.
The coefficients for the daily changes in COVID-19 cases and deaths are insignificant in all sectors, indicating that the growth in COVID-19 cases and deaths did not affect volatility in various sectors in the NGX. The variable for the rate of positive COVID-19 cases is also insignificant, except for the consumer staples, financial, and energy sectors, where a higher rate of positive COVID-19 tests is associated with an increase in stock volatility. For the consumer discretionary, consumer staples, energy, and real estate sectors, the stringency index variable is positive and significantly even at 1% level, suggesting that the government’s stringent measures exacerbated volatility in these sectors. However, these measures do not seem to affect the industrial and financial sectors much, while the healthcare and ICT sectors saw a decline in volatility as government restrictions increased.
The vaccination variable exhibits a positive and statistically significant relationship across all sectors, suggesting that heightened vaccination rates correspond to heightened stock volatility in each sector. Conversely, the inflation and exchange rate variables demonstrate negative and significant coefficients, signifying that rising inflation levels are linked to decreased volatility in most sectors, while the devaluation of the Nigerian naira against the USD is associated with amplified stock volatility. Notably, the volume of trade variable is positive and statistically significant across all sectors, underscoring that high trading activity is associated with increased volatility within the NGX exchange.
In Table 7, we present the results of the GJR-GARCH model for the Zimbabwean Stock Exchange (ZSE). We selected the GJR-GARCH model because of its superior performance over the E-GARCH model. The alpha coefficients for the consumer staples, financial, ICT, and materials sectors are positive and significant, indicating that news shocks during the pandemic increased stock volatility in these sectors. Moreover, a positive and significant omega value for the financial and ICT sectors suggests high unconditional volatility in these sectors. Although the beta values are significant, they are generally low, indicating that volatility tends to dissipate quickly. Furthermore, our analysis found no evidence of a leverage effect at the ZSE. The negative and significant gamma coefficient in the ICT sector suggests that positive shocks have a greater impact on volatility than negative shocks.
The coefficients of the change in COVID-19 cases and deaths indicate that their impact on stock volatility is insignificant in all sectors. Similarly, the variable for the rate of positive COVID-19 tests is positive and significant only for the consumer discretionary and consumer staples sectors. This indicates that the increase in COVID-19 cases and deaths did not have a significant influence on stock volatility in most of the Zimbabwean sectors. The consumer discretionary real estate and materials sectors, which mostly provide non-essential services, have positive and significant stringency index variables. This means that the government’s stringency measures led to high volatility in these sectors. A negative and significant vaccination ratio for the consumer discretionary sector indicates that the introduction of vaccinations led to a decrease in volatility only in this sector. The inflation and exchange rate variables are positive and significant in most sectors. Inflation appears to have significantly contributed to an increase in volatility in all sectors, with the largest impact in the consumer staples, industrials, and materials sectors. The appreciation of the Zimbabwean dollar led to an increase in volatility in almost all sectors except the financial, ICT, and industrial sectors. The Volume of trade variable is positive and significant in most sectors, indicating that high trading volume is associated with increased stock volatility in the ZSE.
Table 8 displays the volatility results for the Lusaka Stock Exchange (LuSE). The GJR_GARCH was chosen for the analysis. The utilities sector exhibits a high and positive omega value, which is significantly different from zero, indicating a higher level of unconditional volatility, while a high positive and significant alpha value suggests that news shocks have increased this sector’s volatility. A high and significant beta value for the consumer staples, energy, and ICT sectors indicates volatility persistence in these sectors, while a significant negative gamma for the utilities sector signifies that volatility responds more to positive shocks than to negative ones.
The variables for changes in COVID-19 cases and deaths, as well as the rate of positive COVID-19 tests, appear to have no significant impact on stock market volatility in most sectors of the LuSE. The case fatality rate is also insignificant in most sectors, suggesting that reports on COVID-19 cases and deaths do not have a significant influence on stock market volatility in most sectors of the LuSE. Additionally, the stringency index variable is not significantly different from zero in all sectors, suggesting no effect of government stringency on volatility. Macroeconomic variables and trading volumes are the variables that seem to have a significant influence on stock market volatility in the LuSE. Low inflation is positively and significantly associated with increased volatility in the consumer staples, energy, and ICT sectors, whereas high inflation is positively and significantly associated with increased volatility in the financial and utilities sectors. Similarly, the depreciation of the Zambian Kwacha is associated with increased volatility in the consumer staples, energy, and ICT sectors. The dollar volume of shares traded is positive and significant in the consumer staples, energy, financials, industrials, and materials sectors. This indicates that volatility increases with trading volume in these sectors, while it decreases with trading volume in the utilities sector.

4.3. Explainable Artificial Intelligence (XAI) Results

In this section, we present the results of the analysis using Explainable Artificial Intelligence (XAI), particularly the SHAP method, to examine the impact of COVID-19 on stock volatility in sub-Saharan stock markets. The XAI method was selected not only to address discrepancies identified in our analysis using the GARCH model but also to provide insights into the decision-making process and improve the accuracy of our results. We first present the R-squared results to showcase the performance of various machine learning training models, including Random Forest, XGBoost, and Support Vector Machines (SVM), as shown in Table 9, and choose the best model for further analysis using SHAP. Upon analyzing the results in Table 9, it is evident that the Random Forest model outperforms the other models, demonstrating the highest R-squared values across all sectors among the stock exchanges studied.
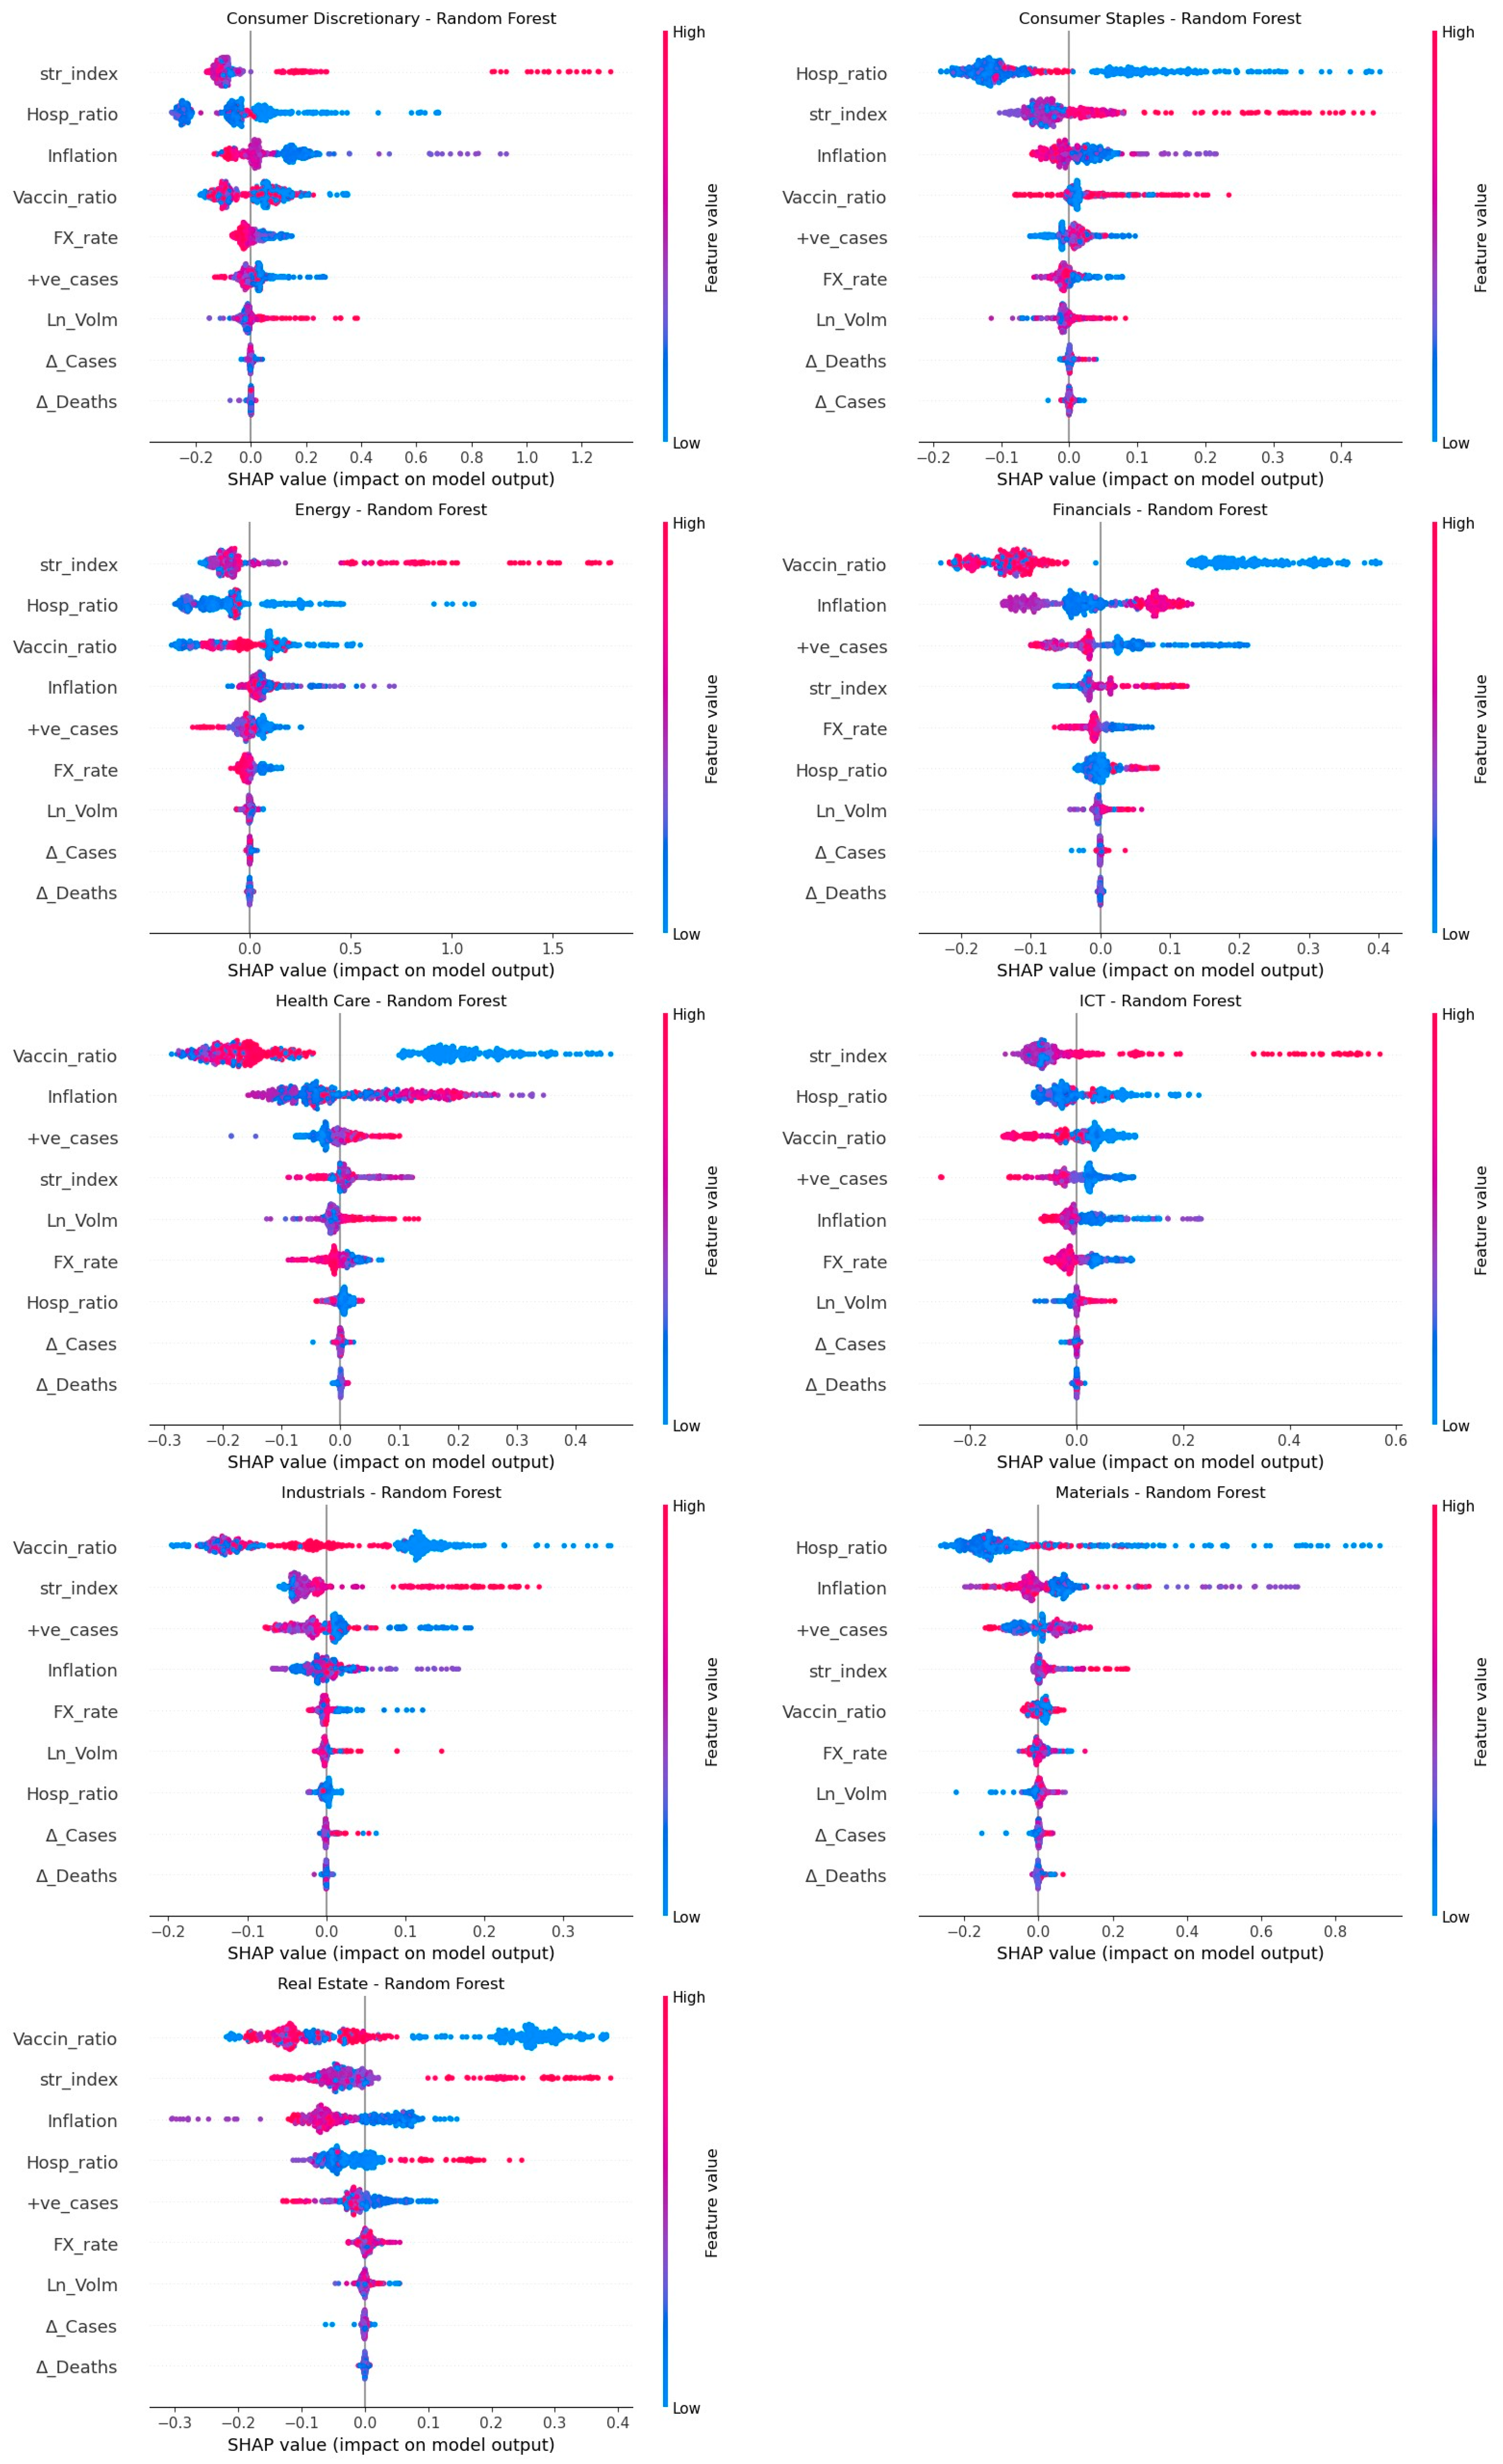
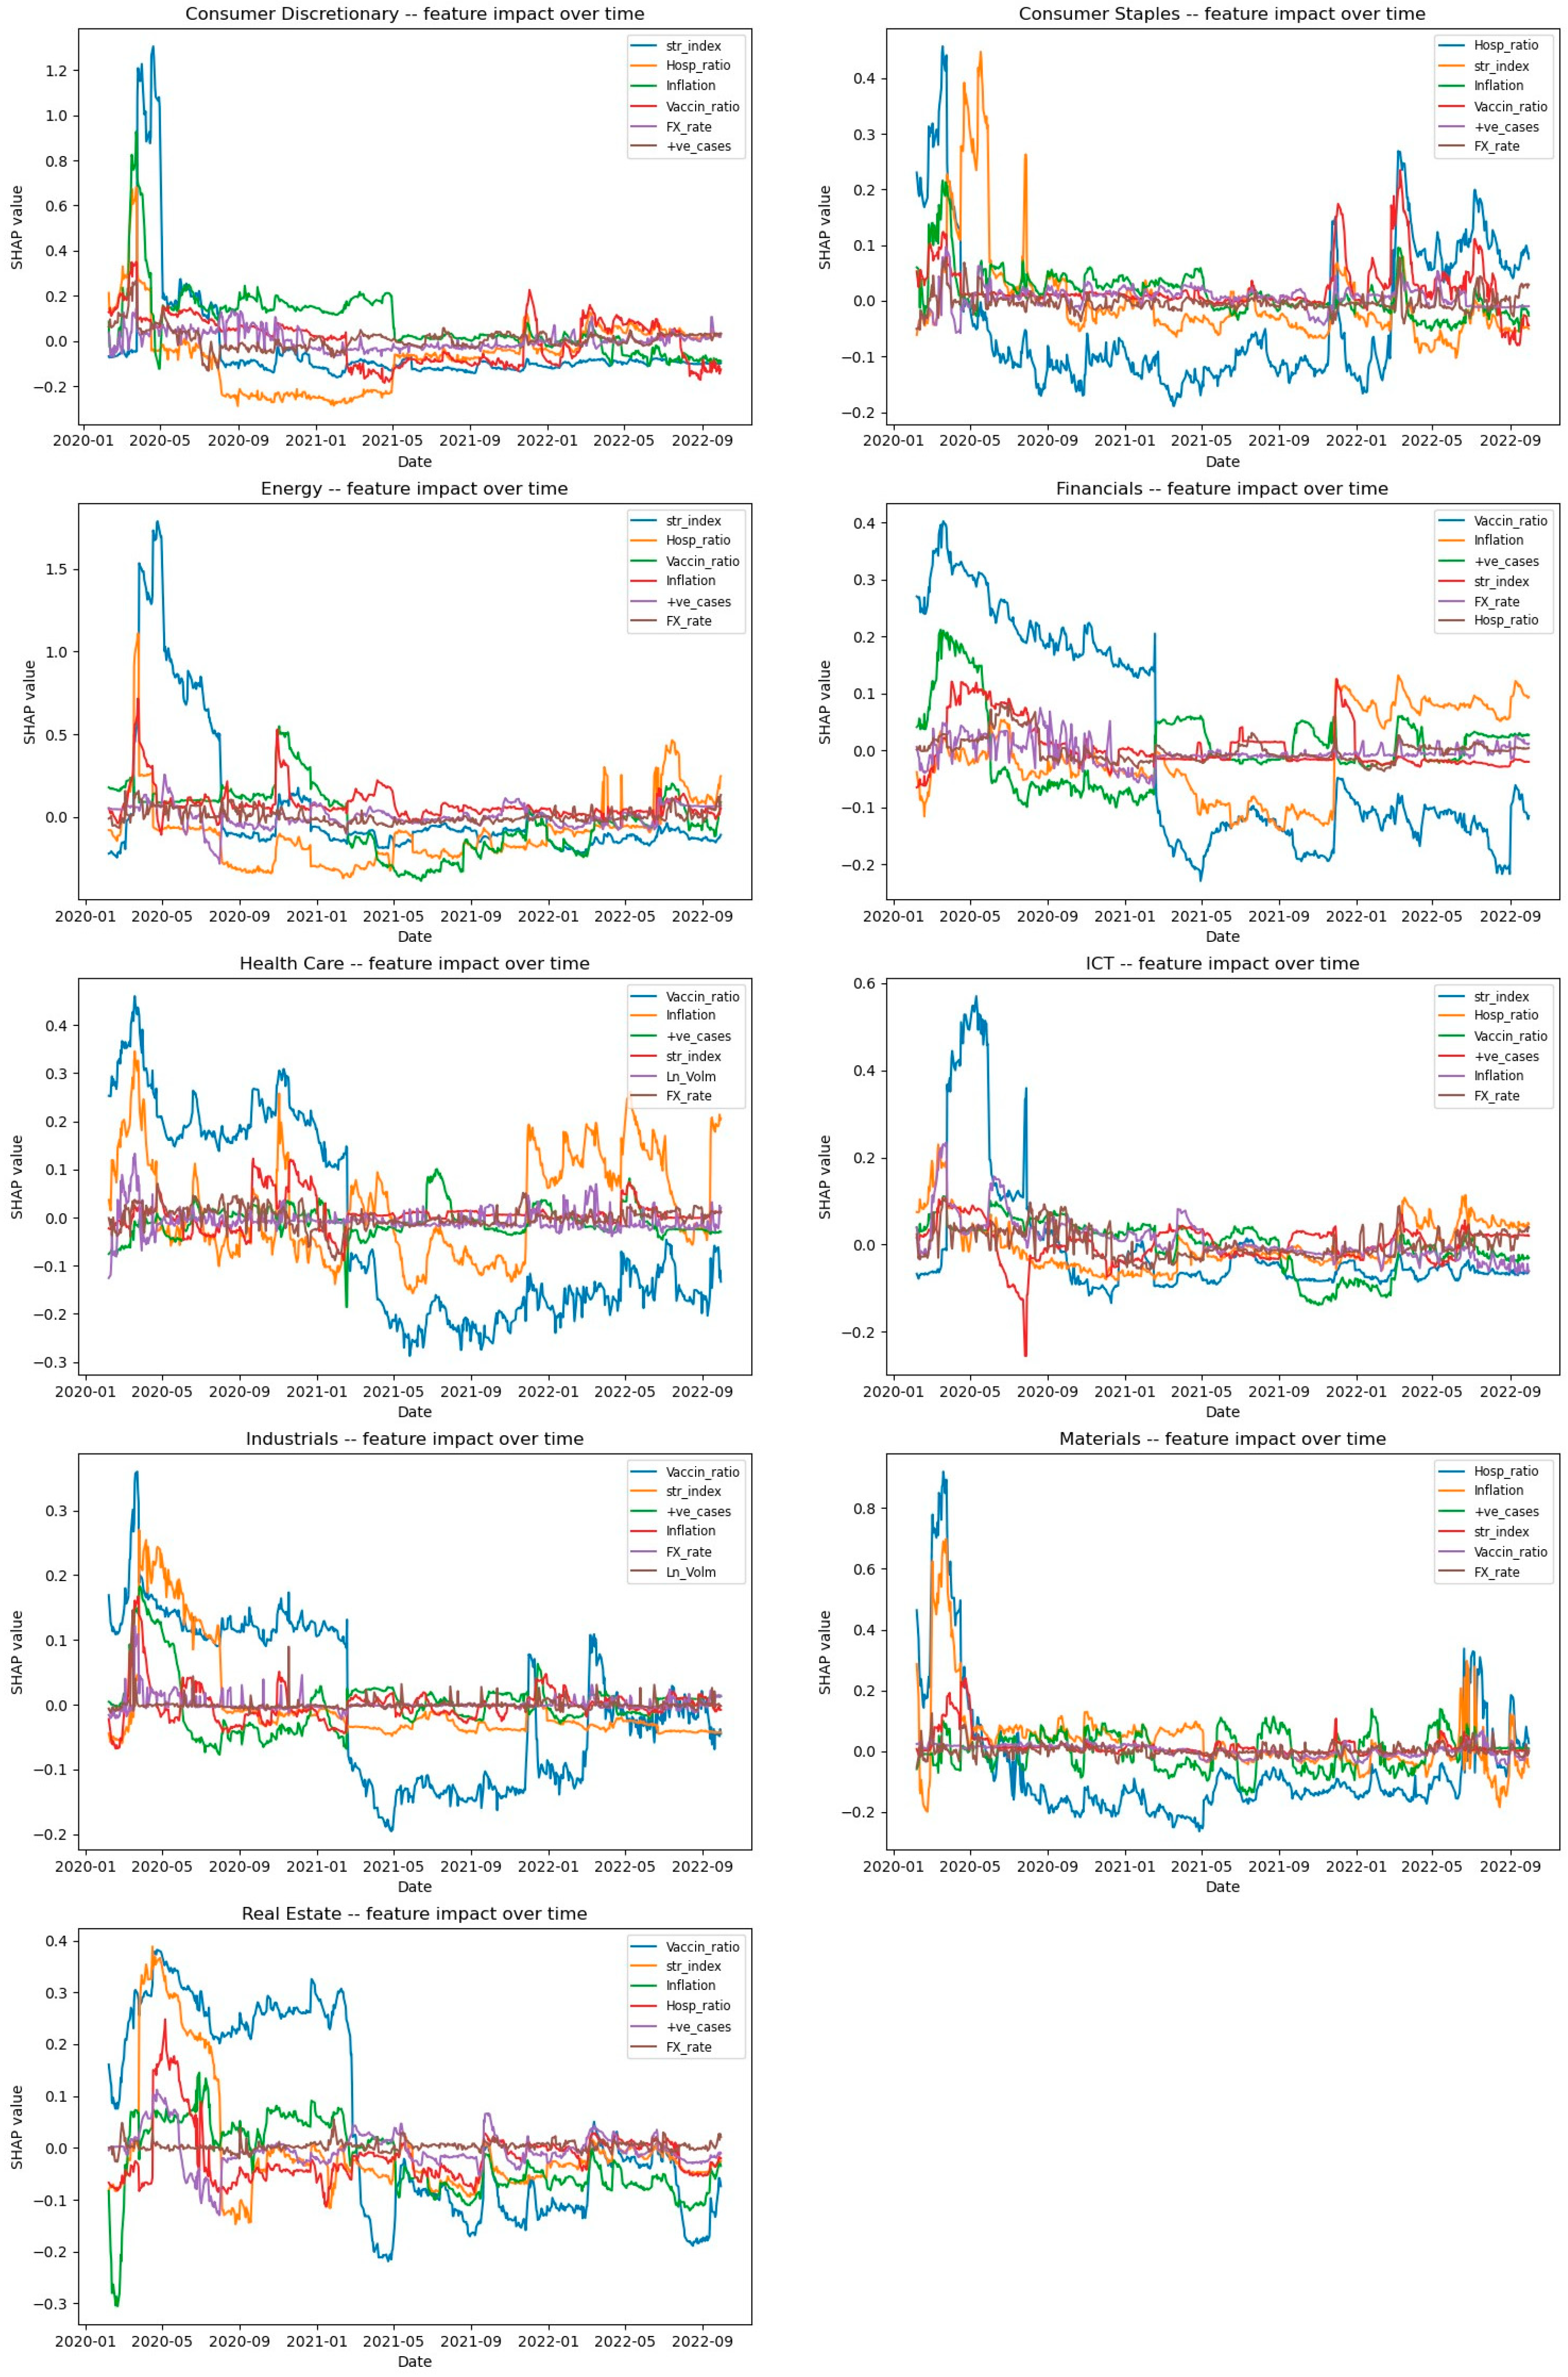
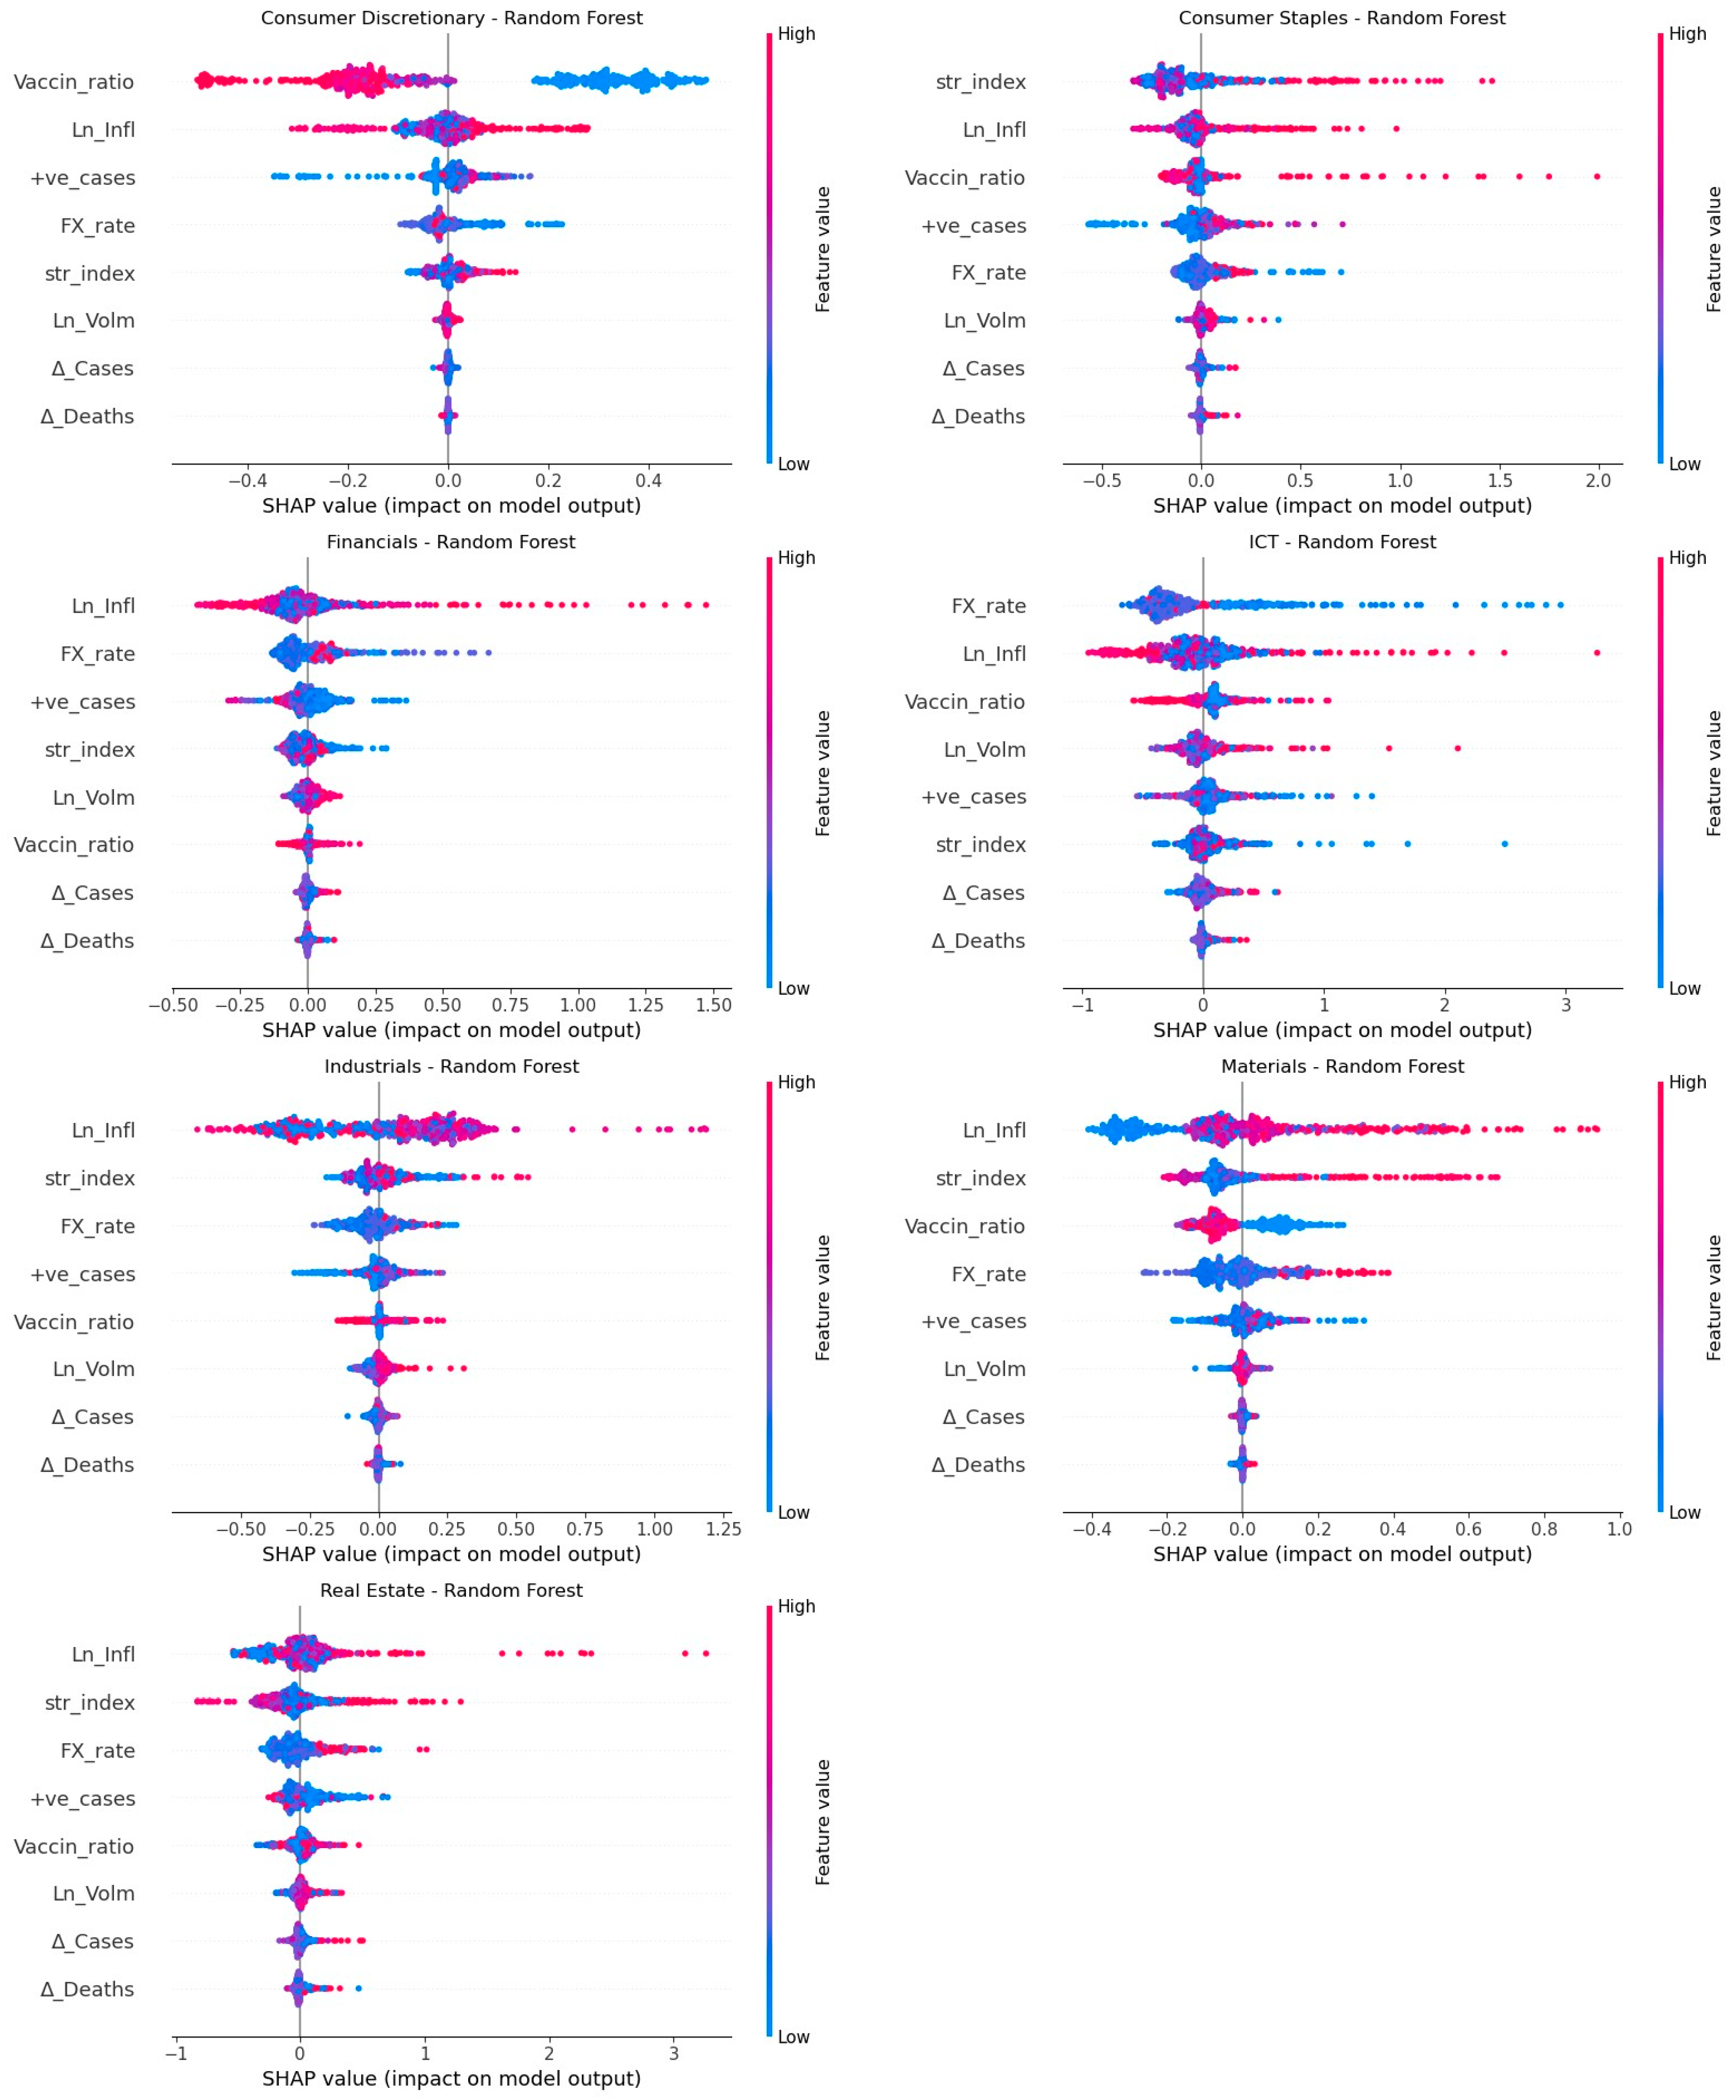
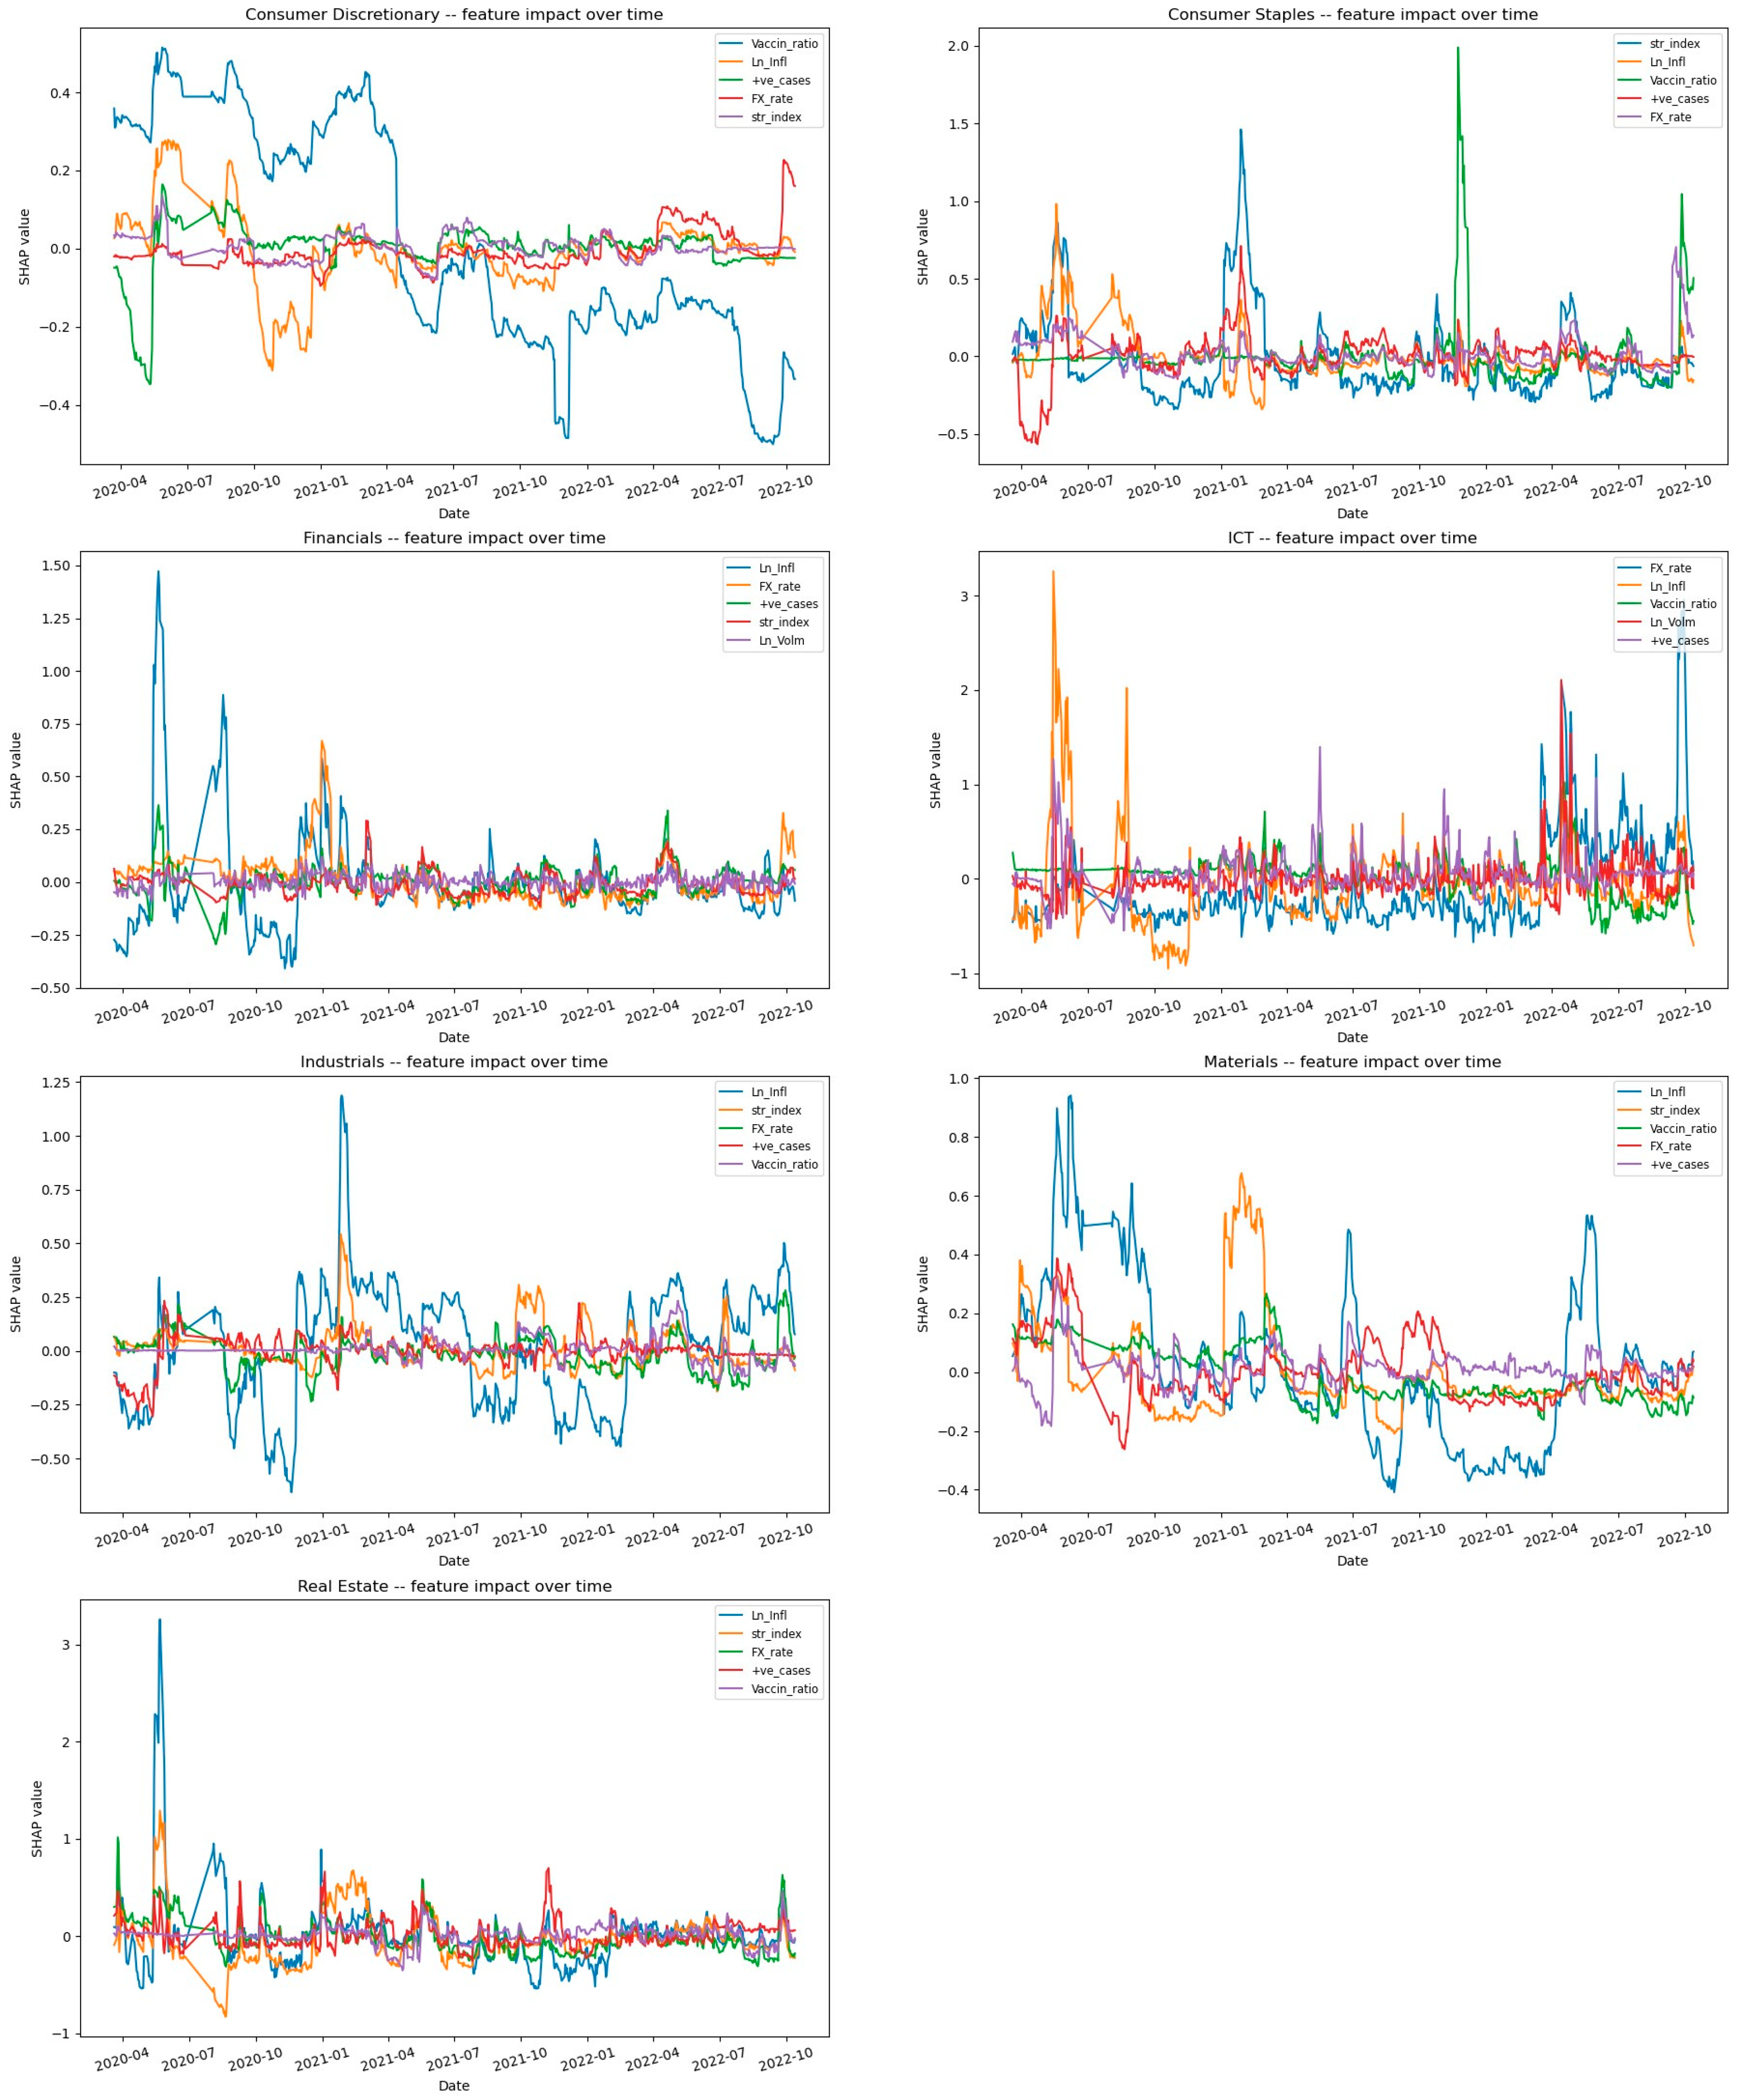
We now present the results of the impact of different features on stock volatility per sector. To achieve this, we generated summary plots using SHAP, which provides insight into the dominant factors affecting volatility in various sectors. In addition, we created a time-series plot to illustrate the impact of these features on volatility over time. In Figure 6, we observe the SHAP summary plots for the JSE, which reveal that the stringency index is a significant factor affecting volatility in the consumer discretionary, consumer staples, energy, ICT, industrial, and real estate sectors. Across all sectors, high levels of stringency such as economic lockdowns, school closures, and travel restrictions are associated with increased stock volatility.
Another critical factor is the vaccination ratio, which exhibits a strong correlation with low volatility in the healthcare, energy, financial, real estate, and industrial sectors. As shown in Figure 7 which depicts the feature impact on stock volatility over time in the JSE, the introduction of vaccines in South Africa in early 2021 led to a significant reduction in volatility in the aforementioned sectors.
Although an increase in hospitalization appears to be associated with a decline in volatility in the consumer staples, energy, and materials sectors, Figure 7 clarifies this matter. It shows that low values of hospitalization at the onset of the pandemic coincided with higher values of volatility as the stock market reacted to the outbreak of the pandemic and imposition of government stringency measures. In other words, it was not low hospitalization rates that led to increased volatility, but rather the market’s response to the pandemic and associated restrictions. Similar to the results obtained from GARCH models, the increase in COVID-19 cases and deaths did not have a significant impact on stock volatility across all sectors. Furthermore, an increase in the rate of positive COVID-19 tests did not lead to increased stock volatility except in the healthcare sector, where a positive relationship between the rate of positive COVID-19 tests and stock volatility appears to exist.
Low inflation rates are associated with higher volatility in most sectors except for the healthcare and financial sectors where higher inflation rates are linked to increased volatility. However, we observe that for the sectors where we have negative relationships, the higher values of inflation are clustered around SHAP values of zero, indicating no significant influence of higher inflation on volatility. Conversely, currency rate fluctuations and trading volumes do not seem to have a significant impact on stock volatility across all sectors in the JSE.
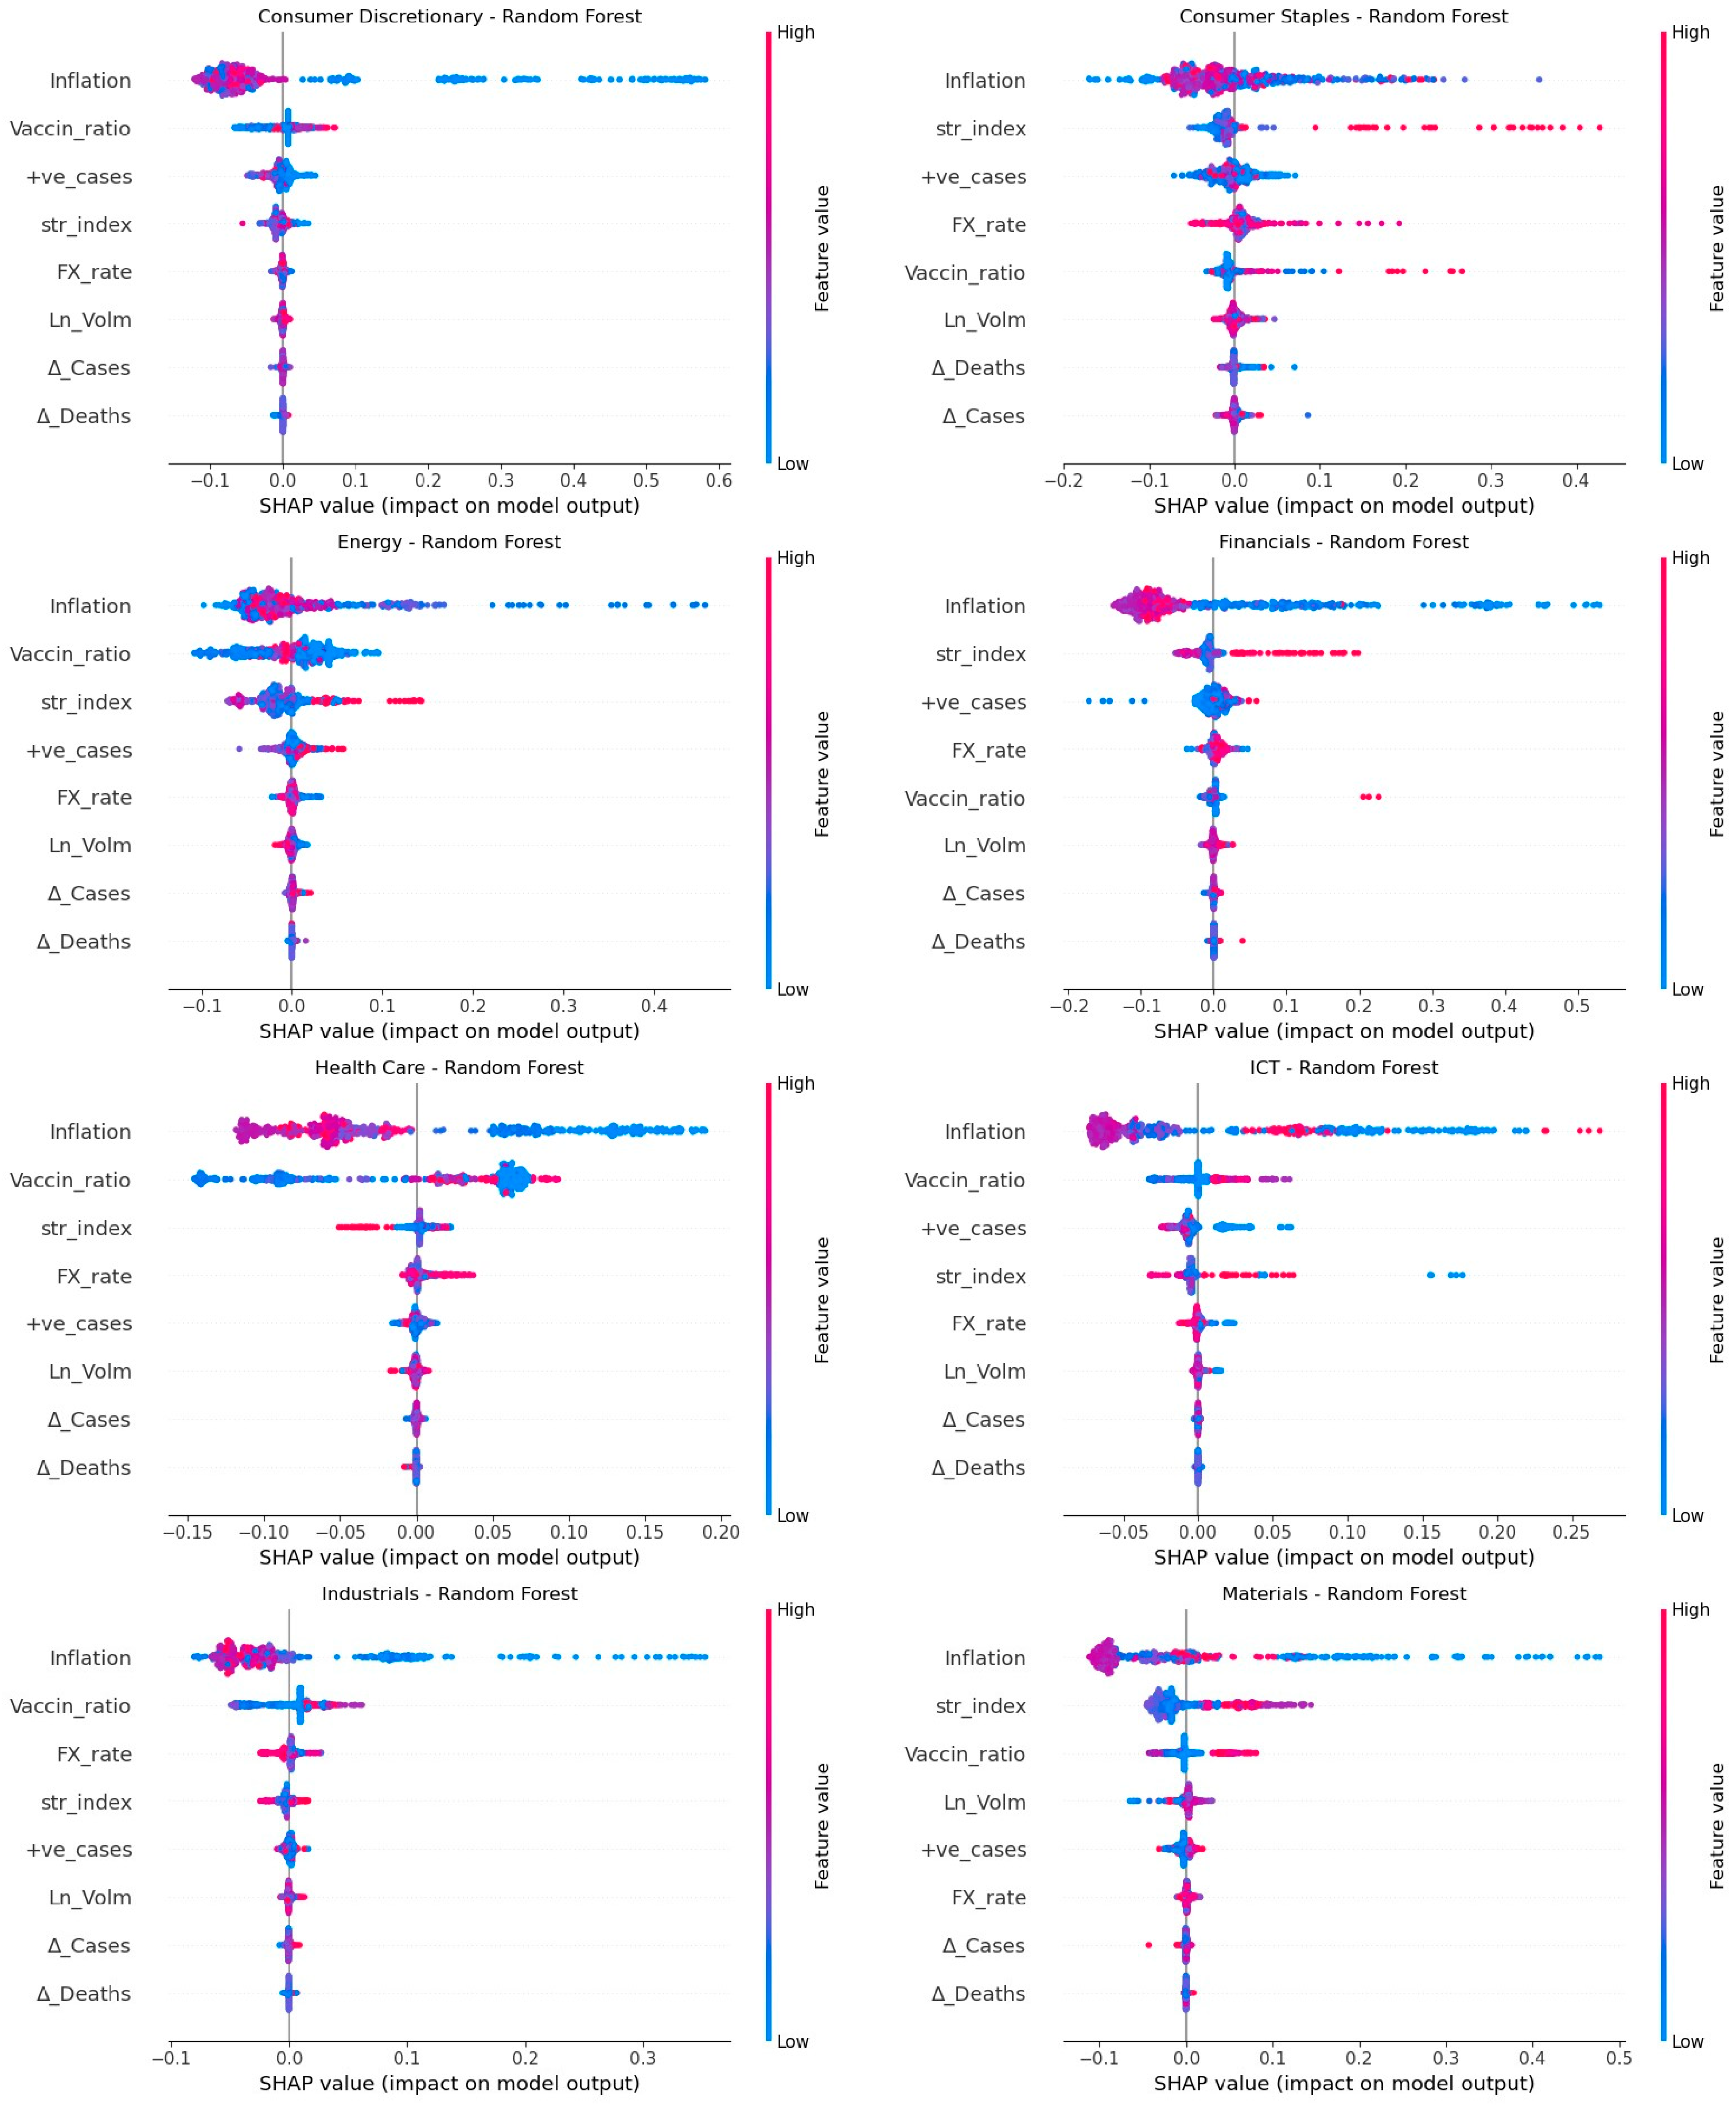
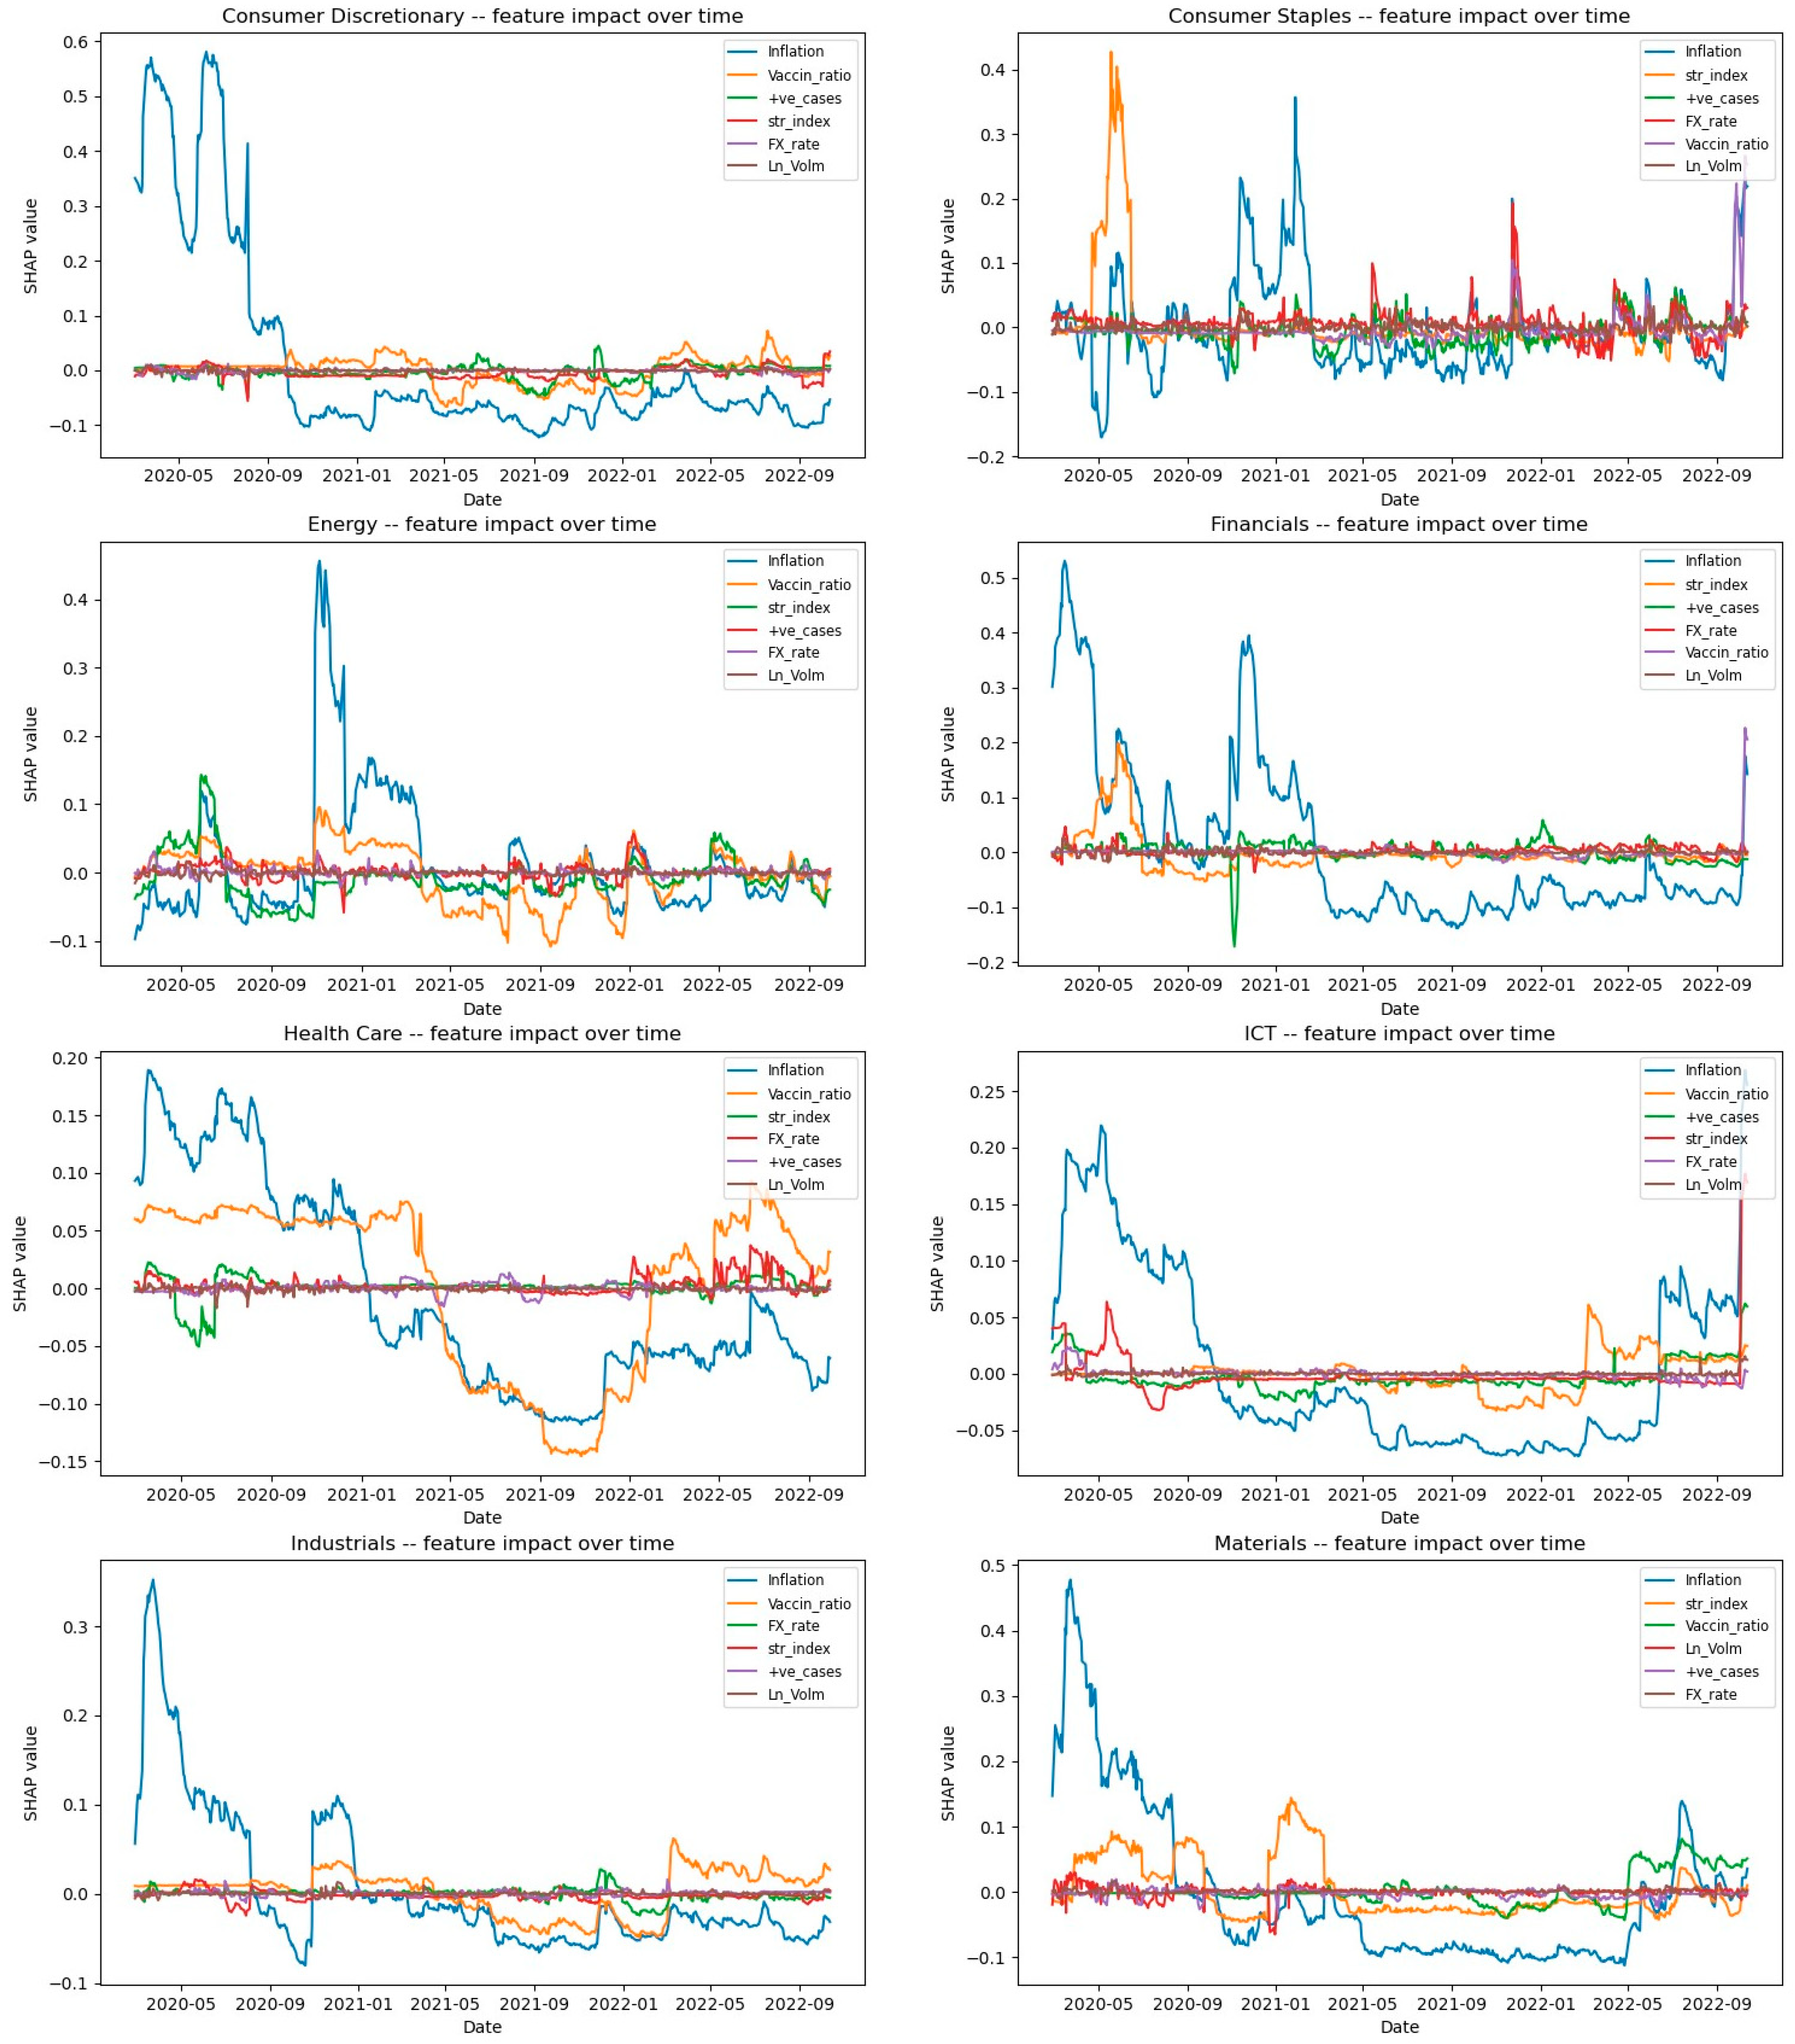
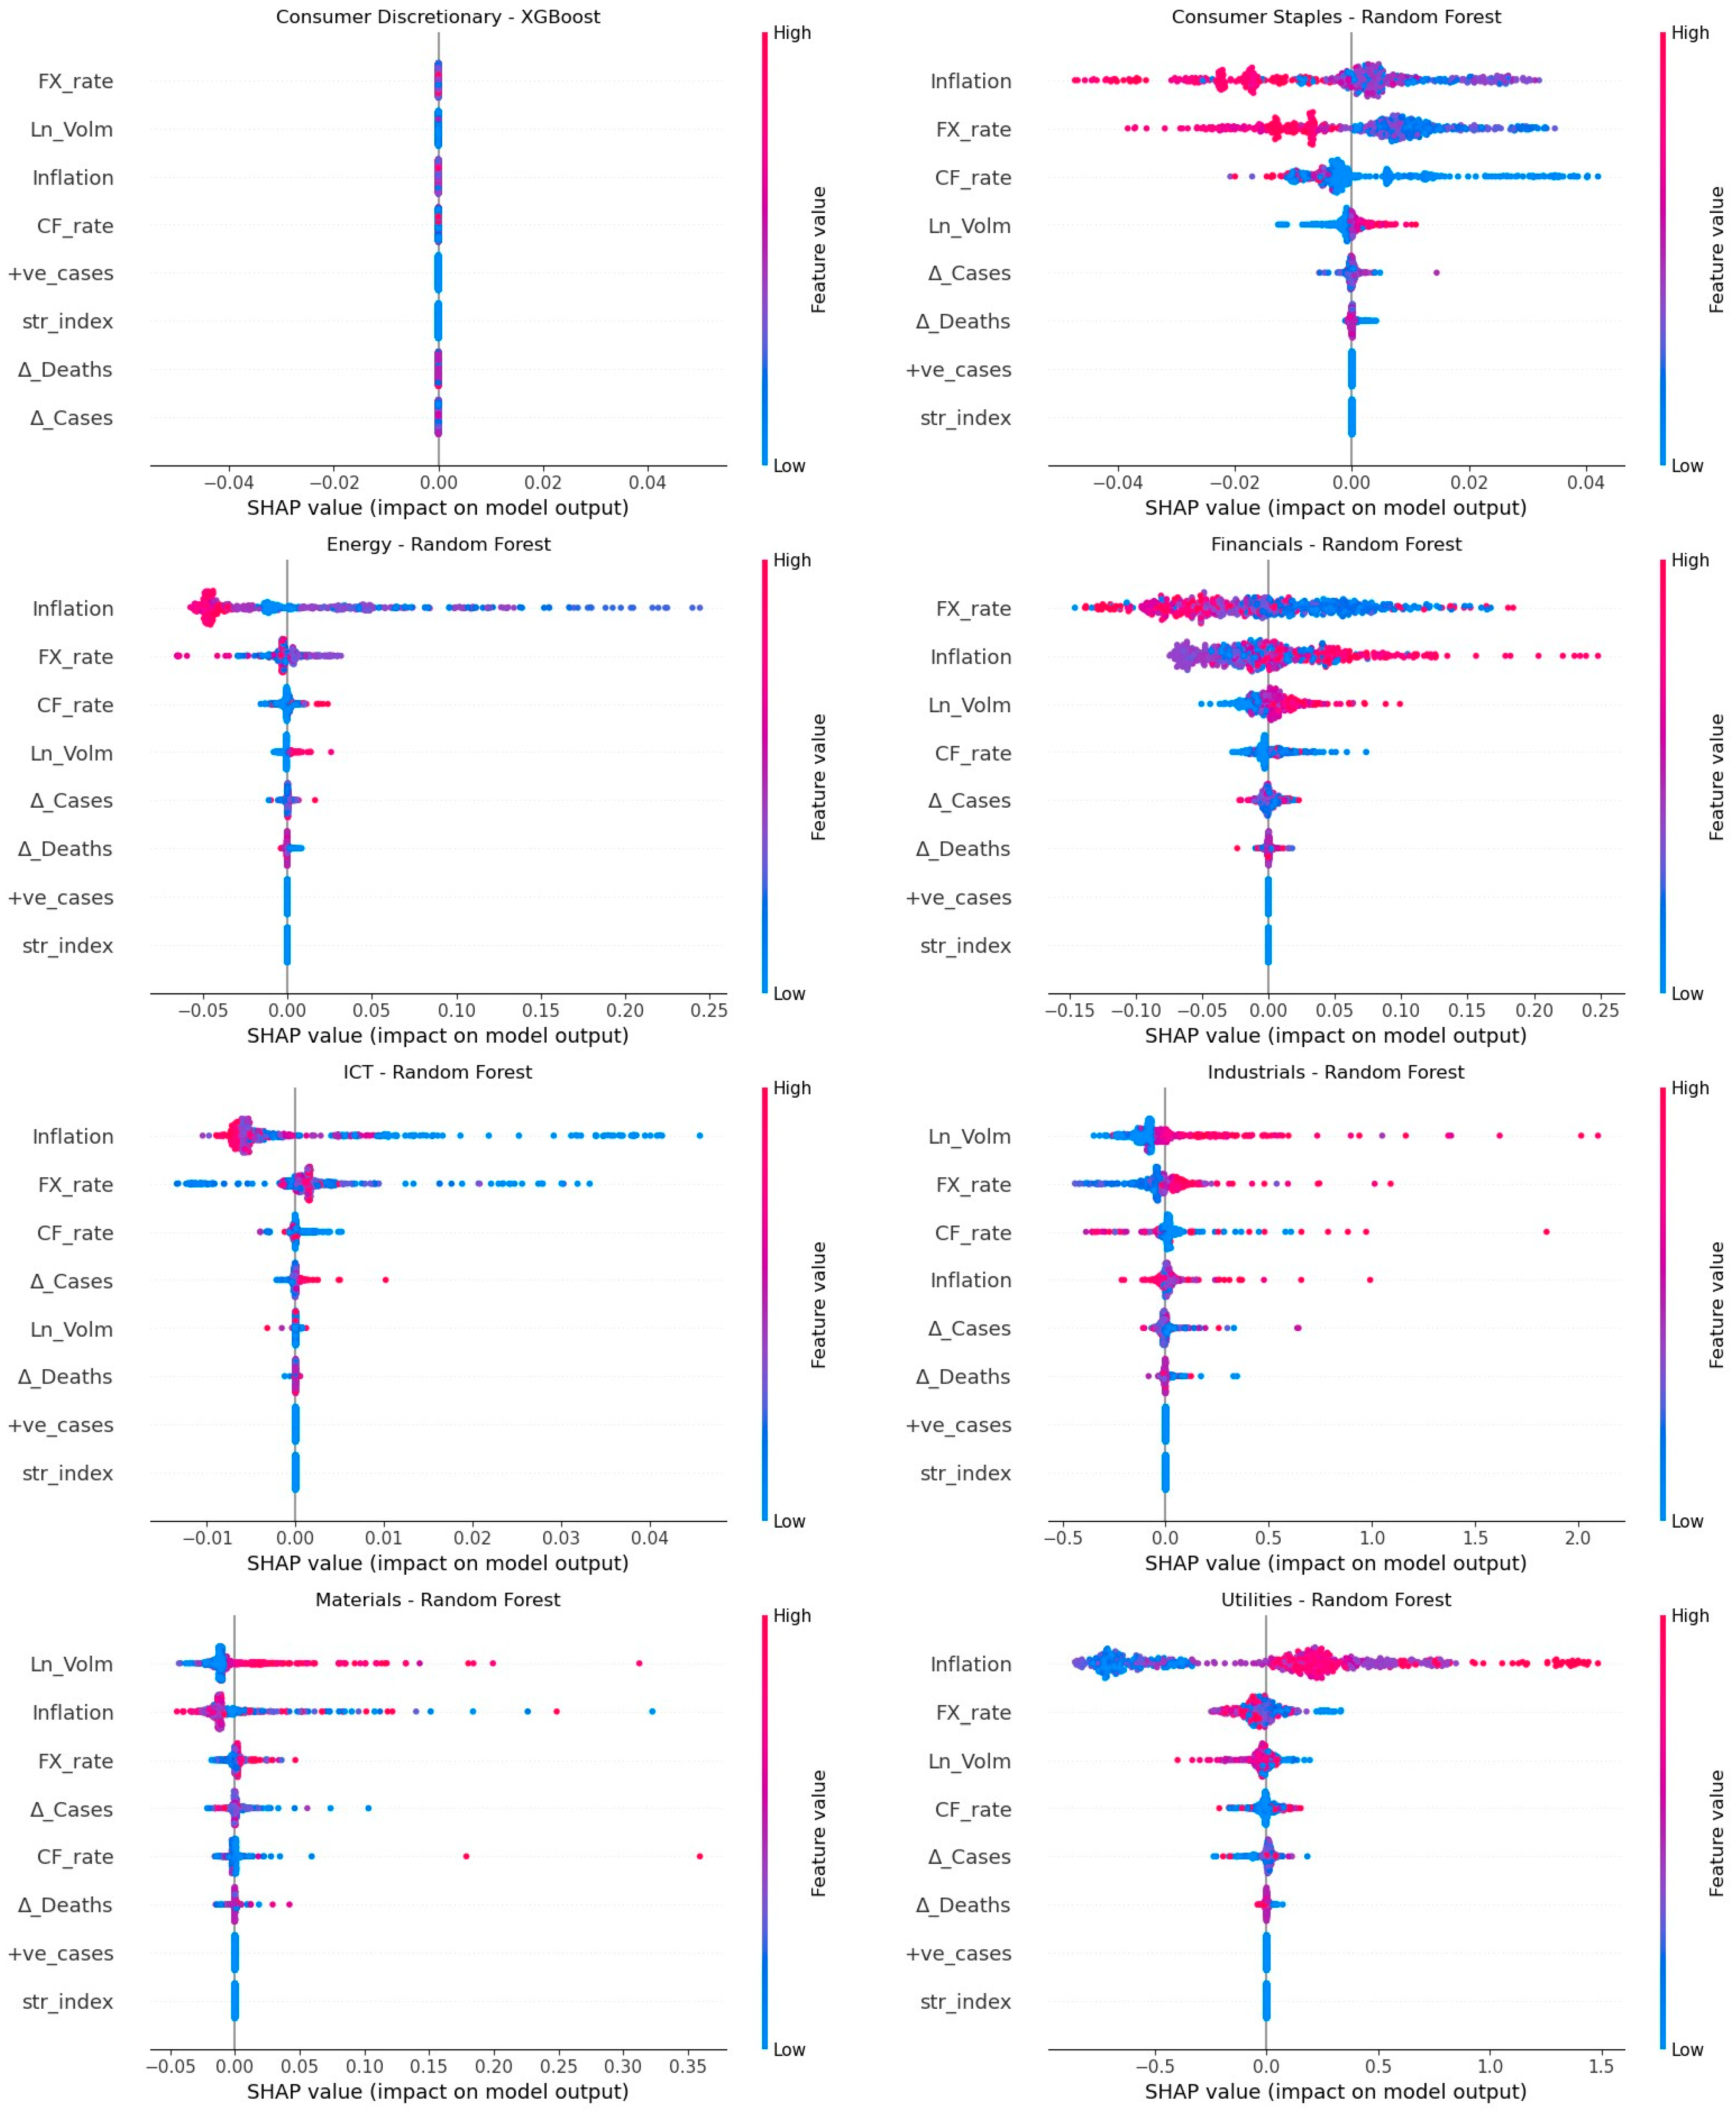
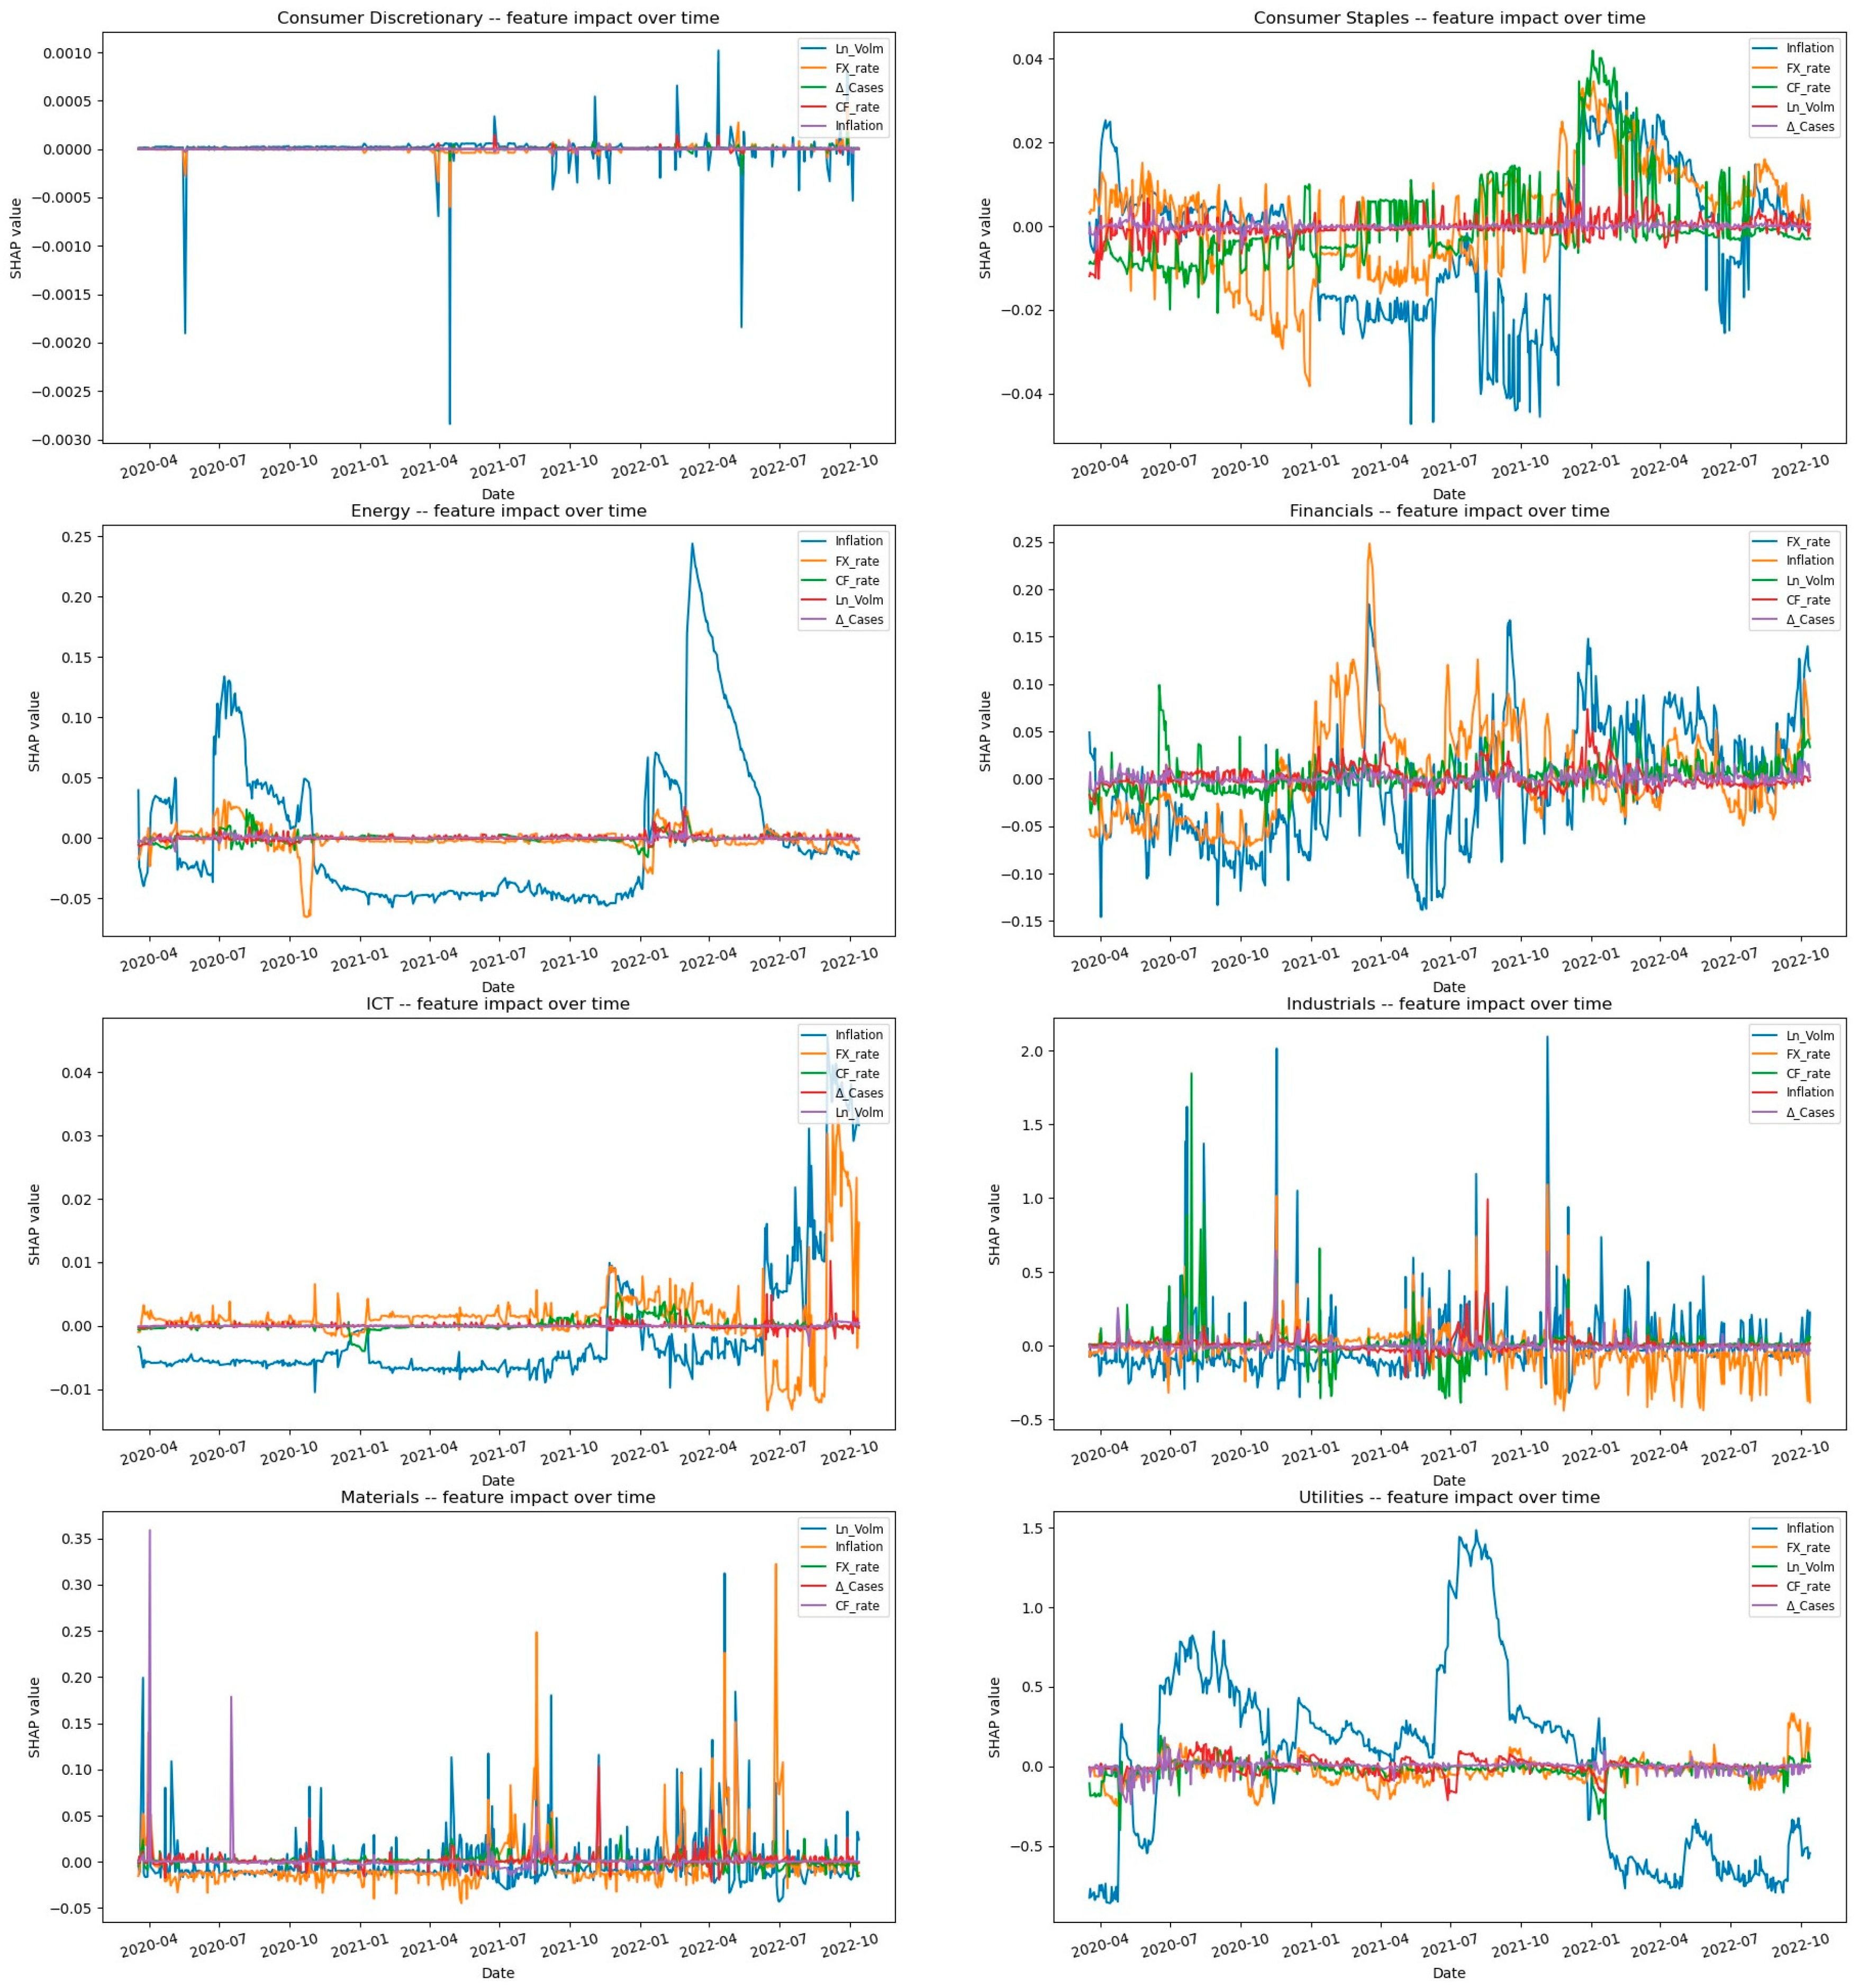
Figure 8 displays the SHAP summary plots, while Figure 9 illustrates the feature’s impact over time on stock volatility among the NGX sectors. Inflation is the most prominent factor that influences stock volatility. Low inflation is associated with increased stock volatility in all sectors. As previously discussed, the results align with those of the GARCH model. The plot in Figure 9 demonstrates that the high stock volatility associated with low inflation in Nigeria occurred at the onset of the pandemic in 2020, whereas the low volatility associated with higher inflation occurred later, in 2021 and beyond. However, we observe that higher values of volatility are clustered close to SHAP values of zero, indicating that high inflation had no significant influence on stock volatility. High stringency measures are associated with increased volatility in the consumer staples, financials, and materials sectors. Figure 9 shows that the most significant impact was felt primarily during the first half of 2020, at the start of the pandemic. High vaccination rates appear to be associated with increased stock volatility in most NGX sectors. However, the time series feature impact plots in Figure 9 reveal that the healthcare and energy sectors experienced a decline in volatility following the introduction of the vaccination program in Nigeria at the beginning of 2021. We also observed that the growth in COVID-19 cases and deaths did not have any significant impact on stock volatility for all sectors. Additionally, an increase in the rate of positive COVID-19 test results did not lead to increased stock volatility in most sectors. The changes in the value of the Nigerian naira and trading volumes also did not have a significant influence on stock volatility for the NGX sector.
In Figure 10, the SHAP summary plot for the Zimbabwean Stock Exchange (ZSE) reveals inflation as a significant driver of stock volatility across all the sectors. High-inflation periods (highlighted in red) display varying volatility levels, while low-inflation periods (highlighted in blue) cluster at SHAP values of zero, indicating minimal impact. Figure 11, depicting the feature impact over time for ZSE sectors, demonstrates that inflation positively impacted volatility in the consumer discretionary, financial, ICT, and consumer staples sectors from the onset of the pandemic up to August 2020. Subsequently, high inflation was linked to reduced volatility until the end of 2020, with no notable influence post-2020. Notably, instances of exceptionally high stock volatility in these sectors align with increased inflation levels, affirming the significantly positive coefficient of the inflation variable in the GARCH model. For the material and real estate sectors, the results clearly show that higher volatility is associated with higher inflation.
The stringency index is another variable that has a significant influence on stock volatility, particularly in sectors such as consumer discretionary, consumer staples, industrials, materials, and real estate. Figure 11 illustrates that increased volatility due to high stringency occurred mainly at the onset of the pandemic and at the beginning of 2021, coinciding with intensified lockdowns in response to the beta variant. However, this volatility surge due to government stringency is short-lived. By contrast, the financial sector and ICT are less susceptible to these stringent measures. The advantages of SHAP analysis over traditional regression methods are evident when we consider the impact of the stringency variable on stock market volatility. While GARCH results may indicate the insignificance of the stringency variable across most sectors due to its reliance on average values, the SHAP analysis precisely identifies the specific points where the stringency index has the most significant influence.
The vaccination ratio variable, which is generally insignificant across sectors, notably impacts the consumer discretionary sector. Here, the introduction of vaccines coincides with a marked decrease in volatility, reflecting the positive influence of vaccination on businesses in the hotel and tourism industry. The exchange rate is another significant factor. While the GARCH results suggest a positive correlation between currency appreciation and average volatility, from the summary plot in Figure 10, we observe that this results from instances of currency depreciation being concentrated on both positive and negative SHAP values while instances of currency appreciation are clustered close to SHAP values of zero. However, we observe that periods of extreme volatility are associated with depreciation of the Zimbabwean dollar in most sectors. Although trading volume is not significant in most sectors, higher trading volumes are associated with increased volatility. Similar to the GARCH results, the increase in the number of COVID-19 cases, deaths, and rate of positive cases does not significantly affect stock volatility across all sectors.
The SHAP analysis results for the Lusaka Stock Exchange (LuSE) are presented in Figure 12 and Figure 13. Figure 12 shows the summary plots and Figure 13 depicts the feature impact on stock volatility over time. Notably, the SHAP values for the consumer discretionary sector are consistently zero across all features due to limited volatility data resulting from infrequent trading in this sector. Macroeconomic factors and trading volumes primarily influence volatility in most sectors, with COVID-19 playing a minor role. The plots show that low inflation periods coincide with increased stock volatility, whereas high inflation periods are associated with a decrease in volatility, particularly in the ICT, energy, and consumer staples sectors. Conversely, the financial and utility sectors exhibit opposite trends. Most sectors experience higher stock volatility because of the devaluation of the Zambian kwacha, with the exception of the industrial and materials sectors, where kwacha appreciation leads to an increase in volatility. Higher trading volumes are associated with increased stock volatility in sectors such as industrials, materials, financials, energy, and consumer staples, with notable impacts on these sectors. Interestingly, the utility sector shows lower volatility during high trading activity. The case fatality rate significantly affects the industrial sector, with higher fatality rates correlating with increased volatility, particularly at the start of the pandemic.

4.4. Discussion of Results

The COVID-19 pandemic has had a significant impact on stock market volatility in sub-Saharan Africa, affecting various sectors across different stock exchanges. In the Johannesburg Stock Exchange (JSE), the spread of the pandemic in March 2020 caused a surge in volatility across various sectors, with some maintaining heightened volatility even after the initial shock. Similarly, the Nigerian Stock Exchange (NGX) experienced increased volatility in sectors such as the ICT, financial, energy, healthcare, and industrial sectors following the pandemic and during the latter part of 2020 due to the second wave of the beta variant. By contrast, the Zimbabwean Stock Exchange (ZSE) witnessed an increase in volatility in sectors such as consumer discretionary, industrials, materials, and real estate at the onset of the pandemic, with the real estate sector showing transient volatility. However, the Lusaka Stock Exchange (LuSE) did not experience an increase in volatility across all sectors except for the utility sector. Our analysis reveals an asymmetric response to news shocks on the JSE and NGX, with bad news having a greater influence on volatility than good news in all sectors at the JSE and in the ICT, healthcare, and consumer staples sectors on the NGX.
Further analysis using SHAP revealed that the government’s stringency measures, such as lockdowns, social distancing, and business closures, led to an increase in stock volatility in most sectors across exchanges in sub-Saharan Africa, except for the healthcare sector in the JSE and the financial sector in the NGX, where volatility decreased as government measures became more stringent. In smaller stock exchanges, such as the ZSE, the most affected sectors were those dealing with non-essentials, such as consumer discretionary, materials, and real estate. Notably, we found that sectors that responded more to negative news were those that were significantly affected by the government’s stringency measures. The increase in volatility as the government imposed more stringent measures suggests that these measures, which were put in place to curb the spread of the pandemic, were perceived negatively by investors in those affected stocks. These findings align with those of Abdullah et al. (2022); Yu and Xiao (2023), who discovered that highly stringent COVID-19 government interventions had a negative impact on stock markets in lower and middle-income countries. The Lucas critique (Lucas 1976) also suggests that the impact of a policy change cannot be determined by past experiences alone but rather depends on how individuals respond to the new policy.
On the other hand, the introduction of vaccines led to a decrease in volatility in all sectors at the JSE, while at the NGX, only the energy and healthcare sectors experienced a decline in volatility. At the ZSE, it is the consumer discretionary sector that’s experienced a decline in volatility after the introduction of vaccines. Our findings also indicate that following the introduction of vaccines in South Africa, the impact of government stringency on stock volatility at the JSE was less severe than before the introduction. This is consistent with the findings of (Yu and Xiao 2023), who noted that the impact of government stringency measures became less effective on stock market volatility in several developed economies after the introduction of vaccination programs. In contrast, factors such as the increase in COVID-19 cases and deaths, the rate of positive COVID-19 tests, and hospitalization were not found to have a significant impact on stock volatility in most sectors across the sub-Saharan stock markets. This aligns with the findings of Kumeka et al. (2022), who showed that COVID-19 cases and deaths had no significant effect on return fluctuations in African stock markets, but rather that the fluctuations were linked to macroeconomic factors such as exchange rate volatility and changes in oil prices. While other studies, such as those by Topcu and Gulal (2020) and Ashraf (2020) show that the pandemic had a significant impact on stock performance at the onset, we show that over the long term, the increase in COVID-19 cases and deaths had no significant impact on stock volatility.
Inflation is another key factor influencing stock market volatility in sub-Saharan Africa during the pandemic. However, the impact varies across sectors and stock exchanges. In the Zimbabwean stock exchange (ZSE), most sectors experienced high volatility during periods of heightened inflation. Our results show that high inflation at the onset of the pandemic led to increased stock volatility, mostly in sectors such as materials, real estate, and consumer discretionary. Contrary to the theory that suggests a positive relationship between inflation and stock volatility, low inflation is associated with high stock volatility in most sectors in the NGX. The observed relationship between low inflation and high stock volatility in the NGX could be due to policy responses from the Central Bank of Nigeria, such as cutting interest rates from 9% to 5% (Olawoye and Erediauwa 2023), which reduced inflation during this period. The clustering of high inflation values close to the SHAP values of zero in Figure 8 is another cause for concern, indicating that high inflation had no significant impact stock volatility in NGX.
For the JSE, we found that while low inflation was associated with increased stock volatility in most sectors, it was not the primary factor. Similar to the NGX findings, we observed that, in the JSE, high inflation values clustered at zero SHAP values, suggesting that inflation had a negligible effect on stock volatility, except in the financial services sector, where high inflation values were associated with increased stock volatility. The increase in inflation in South Africa from 2021 to 2022 does not have a significant impact on stock volatility. We expect the financial sector to experience the impact of inflation because of its sensitivity to changes in inflation, which can impact interest rates and securities prices, thereby escalating volatility. Similarly, in the Lusaka Stock Exchange (LuSE), we find that an increase in inflation leads to an increase in volatility in both the financial services and utilities sectors.
Across all stock markets, the depreciation of a country’s currency against the USD leads to an increase in stock volatility across all sectors. However, in larger stock exchanges such as the JSE and NGX, the exchange rate does not appear to be a significant factor. In contrast, during the pandemic, high volatility in the ZSE was associated with depreciation of the Zimbabwean currency. As shown in Figure 10, instances of high inflation align well with low values of the Zimbabwean dollar for extreme positive SHAP values. This aligns with findings from other researchers that high inflation in Zimbabwe has been linked to depreciation of the Zimbabwean currency (IMF 2024; Nyamunda 2023). The inflation hedging hypothesis posits that equity serves as a hedge against inflation as it represents claims against real assets (Bodie 1976; Cooper and Kaplanis 1994). Therefore, when investors anticipate an increase in inflation in Zimbabwe, they prefer to sell their Zimbabwean dollar holdings in exchange for stocks to preserve the value of their investment. This leads to fluctuations in stock prices, and hence, high volatility. Therefore, we attribute the high stock volatility in the Zimbabwean sectors mainly to inflation and currency issues and less to the pandemic outbreak. Moreover, the depreciation of the Zambian kwacha resulted in increased volatility in the consumer staples, financial, and ICT sectors in the LuSE.
An increase in trading volume on all stock exchanges is associated with high stock volatility. However, trading volume is not the most significant factor influencing stock volatility on most stock exchanges, except for LuSE, where high trading volume is one of the most significant factors fueling stock volatility, especially in the materials, industrials, and financial sectors.

5. Conclusions and Policy Implication

In conclusion, the COVID-19 pandemic has significantly impacted stock volatility in sub-Saharan Africa, with varying effects across sectors and stock exchanges. In larger stock exchanges such as the JSE and NGX, government stringency measures, including economic lockdowns, social distancing, school closures, and travel restrictions, were the primary drivers of increased volatility. However, the introduction of vaccination programs has helped to reduce volatility. We also find an asymmetric response to news shocks, with bad news leading to higher volatility than good news. For smaller exchanges such as the ZSE and LuSE, weaker macroeconomic fundamentals had a more significant impact on stock volatility than the pandemic itself. The healthcare sector was found to be the most resilient, while sectors dealing in non-essentials were more exposed to the negative effects of the pandemic, mainly on smaller stock exchanges. In larger stock exchanges, exposure is more concentrated in sectors with high trading activity. Volatility in the financial sector is more exposed to high inflation and currency depreciation than pandemic-related factors in all stock exchanges.
Our findings reveal that stock markets in sub-Saharan Africa reacted more to governmental actions to control the spread of the pandemic than to the outbreak itself. Additionally, our investigation of sector-specific effects reveals that the extent of the impact of black swan events on sector performance depends on the susceptibility of each sector to a specific event. For instance, non-essential sectors were more prone to the adverse effects of stringency measures, while the healthcare sector displayed a more defensive stance and the financial sector was more sensitive to macroeconomic factors.
Several policy recommendations have been proposed to address the challenges raised in this study. First, we recommend that governments balance public health concerns with economic stability to reduce the impact of stringency measures on stock market volatility. This can be achieved, for example, by maintaining economic lockdowns at levels that will not hurt the performance of businesses, while simultaneously reducing the spread of the pandemic. Governments should also provide more support in the form of economic recovery packages for businesses affected by stringency measures. Moreover, governments should implement sound fiscal and monetary policies to control inflation and promote exchange rate stability because high levels of inflation and a weakening currency result in high investment risks in the stock market. For investors in smaller stock exchanges, we recommend diversifying portfolios across sectors to reduce investment risk. For larger stock exchanges, we recommend diversifying across asset classes, rather than keeping investments only in the form of equity holdings.
The varying responses of sectors across exchanges also present an opportunity for international portfolio diversification by investing in stock exchanges in other countries. Investors should also focus on government policies and macroeconomic factors when making investment decisions. Given the variation in the impact of the pandemic on sector performance, for future research, we recommend a study that considers firm-specific factors that drive stock returns during pandemics. By implementing these recommendations, governments and investors can better navigate the challenges posed by the pandemic and ensure the long-term stability of stock markets in sub-Saharan Africa.

Author Contributions

Conceptualization, M.N. and M.S.; methodology, M.N. and F.R.M.; software, M.N.; validation, M.N. and M.S.; formal analysis, M.N.; investigation, M.N. and F.R.M.; resources, M.N., M.S. and F.R.M.; data curation, M.N.; writing—original draft preparation, M.N.; writing—review and editing, M.N. and F.R.M.; visualization, M.N.; supervision, M.S. and F.R.M.; project administration, F.R.M.; funding acquisition, M.S. All authors have read and agreed to the published version of the manuscript.

Funding

This research received no external funding.

Informed Consent Statement

Written informed consent has been obtained from the patient(s) to publish this paper.

Data Availability Statement

The data presented in this study are available on request from the corresponding author.

Conflicts of Interest

The authors declare no conflict of interest.

References

  1. Abdullah, Mohammad, G. M. Wali Ullah, and Mohammad Ashraful Ferdous Chowdhury. 2022. The asymmetric effect of COVID-19 government interventions on global stock markets: New evidence from QARDL and threshold regression approaches. Investment Analysts Journal 51: 268–88. [Google Scholar] [CrossRef]
  2. Ahmad, Wasim, Ali M. Kutan, and Smarth Gupta. 2021. Black swan events and COVID-19 outbreak: Sector level evidence from the US, UK, and European stock markets. International Review of Economics & Finance 75: 546–57. [Google Scholar]
  3. Ahmed, Imran, Gwanggil Jeon, and Francesco Piccialli. 2022. From artificial intelligence to explainable artificial intelligence in industry 4.0: A survey on what, how, and where. IEEE Transactions on Industrial Informatics 18: 5031–42. [Google Scholar] [CrossRef]
  4. Alam, Md Mahmudul, Haitian Wei, and Abu N. M. Wahid. 2021. COVID-19 outbreak and sectoral performance of the Australian stock market: An event study analysis. Australian Economic Papers 60: 482–95. [Google Scholar] [CrossRef]
  5. Alberg, Dima, Haim Shalit, and Rami Yosef. 2008. Estimating stock market volatility using asymmetric GARCH models. Applied Financial Economics 18: 1201–08. [Google Scholar] [CrossRef]
  6. Ali, Sajid, Tamer Abuhmed, Shaker El-Sappagh, Khan Muhammad, Jose M. Alonso-Moral, Roberto Confalonieri, Riccardo Guidotti, Javier Del Ser, Natalia Díaz-Rodríguez, and Francisco Herrera. 2023. Explainable Artificial Intelligence (XAI): What we know and what is left to attain Trustworthy Artificial Intelligence. Information Fusion 99: 101805. [Google Scholar] [CrossRef]
  7. ASEA. 2020. ASEA Newsletter 2020 Q2 Lite. Pleasant Grove: ASEA. Available online: https://african-exchanges.org/download/asea-newsletter-2020-q2-lite/ (accessed on 30 November 2023).
  8. Ashraf, Badar Nadeem. 2020. Economic impact of government interventions during the COVID-19 pandemic: International evidence from financial markets. Journal of Behavioral and Experimental Finance 27: 100371. [Google Scholar] [CrossRef]
  9. Baek, Seungho, Sunil K. Mohanty, and Mina Glambosky. 2020. COVID-19 and stock market volatility: An industry level analysis. Finance Research Letters 37: 101748. [Google Scholar] [CrossRef]
  10. Bakry, Walid, Peter John Kavalmthara, Vivienne Saverimuttu, Yiyang Liu, and Sajan Cyril. 2022. Response of stock market volatility to COVID-19 announcements and stringency measures: A comparison of developed and emerging markets. Finance Research Letters 46: 102350. [Google Scholar] [CrossRef]
  11. Będowska-Sójka, Barbara, and Agata Kliber. 2019. The causality between liquidity and volatility in the Polish stock market. Finance Research Letters 30: 110–15. [Google Scholar] [CrossRef]
  12. Bhattacharya, Aditya. 2022. Applied Machine Learning Explainability Techniques: Make ML Models Explainable and Trustworthy for Practical Applications Using LIME, SHAP, and More. Birmingham: Packt Publishing Ltd. [Google Scholar]
  13. Bodie, Zvi. 1976. Common stocks as a hedge against inflation. The Journal of Finance 31: 459–70. [Google Scholar] [CrossRef]
  14. Bollerslev, Tim. 1986. Generalized autoregressive conditional heteroskedasticity. Journal of Econometrics 31: 307–27. [Google Scholar] [CrossRef]
  15. Brooks, Chris. 2019. Introductory Econometrics for Finance. Cambridge: Cambridge University Press. [Google Scholar]
  16. Chitungo, Itai, Mathias Dzobo, Mbuzeleni Hlongwa, and Tafadzwa Dzinamarira. 2020. COVID-19: Unpacking the low number of cases in Africa. Public Health in Practice 1: 100038. [Google Scholar] [CrossRef] [PubMed]
  17. Choi, Jae Hoon, and David Munro. 2022. Market liquidity and excess volatility: Theory and experiment. Journal of Economic Dynamics and Control 139: 104442. [Google Scholar] [CrossRef]
  18. Colin, Bermingham, Cali Claudio, Fenton Nina, and Santos Ricardo. 2022. Finance in Africa: Navigating the Financial Landscape in Turbulent Times. Sydney: European Investment Bank. [Google Scholar]
  19. Cooper, Ian, and Evi Kaplanis. 1994. Home bias in equity portfolios, inflation hedging, and international capital market equilibrium. The Review of Financial Studies 7: 45–60. [Google Scholar] [CrossRef]
  20. Del Lo, Gaye, Théophile Basséne, and Babacar Séne. 2022. COVID-19 And the african financial markets: Less infection, less economic impact? Finance Research Letters 45: 102148. [Google Scholar] [CrossRef] [PubMed]
  21. Djankov, Simeon, and Ugo Panizza. 2020. COVID-19 in Developing Economies. London: Centre for Economic Policy Research. [Google Scholar]
  22. Elkhishin, Sarah, and Mahmoud Mohieldin. 2021. External debt vulnerability in emerging markets and developing economies during the COVID-19 shock. Review of Economics and Political Science 6: 24–47. [Google Scholar] [CrossRef]
  23. Foley, Sean, Amy Kwan, Richard Philip, and Bernt Arne Odegaard. 2022. Contagious margin calls: How COVID-19 threatened global stock market liquidity. Journal of Financial Markets 59: 100689. [Google Scholar] [CrossRef]
  24. Glosten, Lawrence R., Ravi Jagannathan, and David E. Runkle. 1993. On the relation between the expected value and the volatility of the nominal excess return on stocks. The Journal of Finance 48: 1779–801. [Google Scholar] [CrossRef]
  25. Gökbulut, R. İlker, and Mehmet Pekkaya. 2014. Estimating and forecasting volatility of financial markets using asymmetric GARCH models: An application on Turkish financial markets. International Journal of Economics and Finance 6: 23–35. [Google Scholar] [CrossRef]
  26. Harjoto, Maretno Agus, and Fabrizio Rossi. 2021. Market Reaction to the COVID-19 Pandemic: Evidence from Emerging Markets. International Journal of Emerging Markets, ahead-of-print. [Google Scholar] [CrossRef]
  27. Harjoto, Maretno Agus, Fabrizio Rossi, Robert Lee, and Bruno S. Sergi. 2021. How do equity markets react to COVID-19? Evidence from emerging and developed countries. Journal of Economics and Business 115: 105966. [Google Scholar] [CrossRef] [PubMed]
  28. Ibrahim, Izani, Kamilah Kamaludin, and Sheela Sundarasen. 2020. COVID-19, government response, and market volatility: Evidence from the Asia-Pacific developed and developing markets. Economies 8: 105. [Google Scholar] [CrossRef]
  29. IMF. 2024. IMF Staff Completes 2024 Article IV Mission to Zimbabwe. Available online: https://www.imf.org/en/News/Articles/2024/02/13/pr2447-zimbabwe-imf-staff-completes-2024-article-iv-mission (accessed on 8 April 2024).
  30. Keynes, John Maynard. 1937. The general theory of employment. The Quarterly Journal of Economics 51: 209–23. [Google Scholar] [CrossRef]
  31. Keynes, John Maynard. 1964. The general theory of employment, interest and money (1936). The Collected Writings of John Maynard Keynes 7: 1971–79. [Google Scholar]
  32. Kharbanda, Varuna, and Rachna Jain. 2021. Impact of COVID on the stock market: A study of BRIC countries. International Journal of Financial Markets and Derivatives 8: 169–84. [Google Scholar] [CrossRef]
  33. Kossi, Félix Edoh. 2021. African Stock Exchanges Focus Report. Nairobi: African Securities Exchanges Association. [Google Scholar]
  34. Kumeka, Terver, Patricia Ajayi, and Oluwatosin Adeniyi. 2022. Is stock market in Sub-Saharan Africa resilient to health shocks? Journal of Financial Economic Policy 14: 562–98. [Google Scholar] [CrossRef]
  35. Kusumahadi, Teresia Angelia, and Fikri C Permana. 2021. Impact of COVID-19 on global stock market volatility. Journal of Economic Integration 36: 20–45. [Google Scholar] [CrossRef]
  36. Ledwani, Sanket, Suman Chakraborty, and Sandeep S. Shenoy. 2021. Spatial tale of G-7 and Brics stock markets during COVID-19: An event study. Investment Management and Financial Innovations 18: 20–36. [Google Scholar] [CrossRef]
  37. Lucas, Robert E. 1976. Econometric policy evaluation: A critique. Carnegie-Rochester Conference Series on Public Policy 1: 19–46. [Google Scholar] [CrossRef]
  38. Machado, José A. Tenreiro. 2023. COVID-19 and Stock Market Volatility in sub-Saharan Africa. East African Journal of Rural Development 5: 225–48. [Google Scholar]
  39. Makulo, Jean-Robert, Roger Wumba, Madone Ndona Mandina, Placide Mbala, Adrienne Amuri Aziza, Yannick Mayamba Nlandu, Benjanmin Kabwe, Donatien Mangala, Ben Izizag Bepouka, and Jerome Ossam Odio. 2023. SARS-CoV2 mutations and impact on mortality: Observational study in a sub-saharan Africa hospital. Virology Journal 20: 56. [Google Scholar] [CrossRef]
  40. Miron, Dumitru, and Cristiana Tudor. 2010. Asymmetric conditional volatility models: Empirical estimation and comparison of forecasting accuracy. Romanian Journal of Economic Forecasting 13: 74–92. [Google Scholar]
  41. Mishra, Alok Kumar, Badri Narayan Rath, and Aruna Kumar Dash. 2020. Does the Indian financial market nosedive because of the COVID-19 outbreak, in comparison to after demonetisation and the GST? Emerging Markets Finance and Trade 56: 2162–80. [Google Scholar] [CrossRef]
  42. Molnar, Christoph. 2020. Interpretable Machine Learning. Morrisville: Lulu.com. [Google Scholar]
  43. MSCI. 2023. S&P Dow Jones. The Global Industry Classification Standard (GICS®). Available online: https://www.msci.com/our-solutions/indexes/gics (accessed on 12 December 2023).
  44. Murewanhema, Grant, and Tafadzwa Dzinamarira. 2022. The COVID-19 pandemic: Public health responses in Sub-Saharan Africa. International Journal of Environmental Research and Public Health 19: 4448. [Google Scholar] [CrossRef]
  45. Ncube, Mbongiseni, Mabutho Sibanda, and Frank Ranganai Matenda. 2023. COVID-19 Pandemic and Stock Performance: Evidence from the Sub-Saharan African Stock Markets. Economies 11: 95. [Google Scholar] [CrossRef]
  46. Nelson, Daniel B. 1991. Conditional heteroskedasticity in asset returns: A new approach. Econometrica: Journal of the Econometric Society 59: 347–70. [Google Scholar] [CrossRef]
  47. Njenga, Githinji, Josphat Machagua, and Samwel Gachanja. 2022. Capital Markets in Sub-Saharan Africa. Helsinki: United Nations University World Institute for Development Economics Research. [Google Scholar]
  48. Nyamunda, Tinashe. 2023. Emergism as Ideology: Zimbabwe’s Ill-Fated Policies for an ‘Emerging’ Upper-Middle-Income Economy. In The Political Economy of Emerging Markets and Alternative Development Paths. Berlin/Heidelberg: Springer, pp. 297–322. [Google Scholar]
  49. Olawoye, Salewa, and Adesuwa O. Erediauwa. 2023. Monetary policy during the COVID-19 pandemic: A case study of the Central Bank of Nigeria. In COVID-19 and the Response of Central Banks. Cheltenham: Edward Elgar Publishing, pp. 85–103. [Google Scholar]
  50. Papadamou, Stephanos, Athanasios Fassas, Dimitris Kenourgios, and Dimitrios Dimitriou. 2020. Direct and Indirect Effects of COVID-19 Pandemic on Implied Stock Market Volatility: Evidence from Panel Data Analysis. Munich: University Library of Munich, Germany. [Google Scholar]
  51. Phan, Dinh Hoang Bach, and Paresh Kumar Narayan. 2020. Country responses and the reaction of the stock market to COVID-19—A preliminary exposition. Emerging Markets Finance and Trade 56: 2138–50. [Google Scholar] [CrossRef]
  52. Priscilla, Sherin, Saarce Elsye Hatane, and Josua Tarigan. 2022. COVID-19 Catastrophes and Stock Market Liquidity: Evidence from Technology Industry of Four Biggest ASEAN Capital Market. Asia-Pacific Journal of Business Administration, ahead-of-print. [Google Scholar] [CrossRef]
  53. Sachdeva, Kanika, and Poruran Sivakumar. 2020. COVID-19 and Stock Market Behavior—An Event Study of BRIC Countries. Turkish Journal of Computer and Mathematics Education (TURCOMAT) 11: 741–54. [Google Scholar]
  54. Sengere, Leonard. 2022. The Zimbabwe Stock Exchange (ZSE) Grew by 314.37% in 2021, Whilst Inflation Rate Was 60.7%. Harare: TechZim. [Google Scholar]
  55. Takyi, Paul Owusu, and Isaac Bentum-Ennin. 2021. The impact of COVID-19 on stock market performance in Africa: A Bayesian structural time series approach. Journal of Economics and Business 115: 105968. [Google Scholar] [CrossRef] [PubMed]
  56. Taleb, Nassim Nicholas. 2007. The Black Swan: The Impact of the Highly Improbable. New York: Random house, vol. 2. [Google Scholar]
  57. Topcu, Mert, and Omer Serkan Gulal. 2020. The impact of COVID-19 on emerging stock markets. Finance Research Letters 36: 101691. [Google Scholar] [CrossRef] [PubMed]
  58. Toure, Aby. 2020. COVID-19 (Coronavirus) Drives Sub-Saharan Africa toward First Recession in 25 Years. Singapore: The World Bank. [Google Scholar]
  59. Uddin, Moshfique, Anup Chowdhury, Keith Anderson, and Kausik Chaudhuri. 2021. The effect of COVID-19 pandemic on global stock market volatility: Can economic strength help to manage the uncertainty? Journal of Business Research 128: 31–44. [Google Scholar] [CrossRef] [PubMed]
  60. UN. 2021. World Economic Situation and Prospects 2021. New York: UN. [Google Scholar]
  61. WHO. 2020. Coronavirus Disease 2019 (COVID-19): Situation Report. Geneva: WHO, p. 73. [Google Scholar]
  62. WHO. 2023. Number of Weekly COVID-19 Cases Reported to WHO. Available online: https://data.who.int/dashboards/covid19/cases?n=c (accessed on 29 December 2023).
  63. Xu, Libo. 2021. Stock Return and the COVID-19 pandemic: Evidence from Canada and the US. Finance Research Letters 38: 101872. [Google Scholar] [CrossRef] [PubMed]
  64. Yousfi, Mohamed, Younes Ben Zaied, Nidhaleddine Ben Cheikh, Béchir Ben Lahouel, and Houssem Bouzgarrou. 2021. Effects of the COVID-19 pandemic on the US stock market and uncertainty: A comparative assessment between the first and second waves. Technological Forecasting and Social Change 167: 120710. [Google Scholar] [CrossRef] [PubMed]
  65. Yu, Xiaoling, and Kaitian Xiao. 2023. COVID-19 Government restriction policy, COVID-19 vaccination and stock markets: Evidence from a global perspective. Finance Research Letters 53: 103669. [Google Scholar] [CrossRef] [PubMed]
  66. Zaremba, Adam, David Y. Aharon, Ender Demir, Renatas Kizys, and Dariusz Zawadka. 2021. COVID-19, government policy responses, and stock market liquidity around the world: A note. Research in International Business and Finance 56: 101359. [Google Scholar] [CrossRef]
  67. Zaremba, Adam, Renatas Kizys, David Y. Aharon, and Ender Demir. 2020. Infected markets: Novel coronavirus, government interventions, and stock return volatility around the globe. Finance Research Letters 35: 101597. [Google Scholar] [CrossRef]
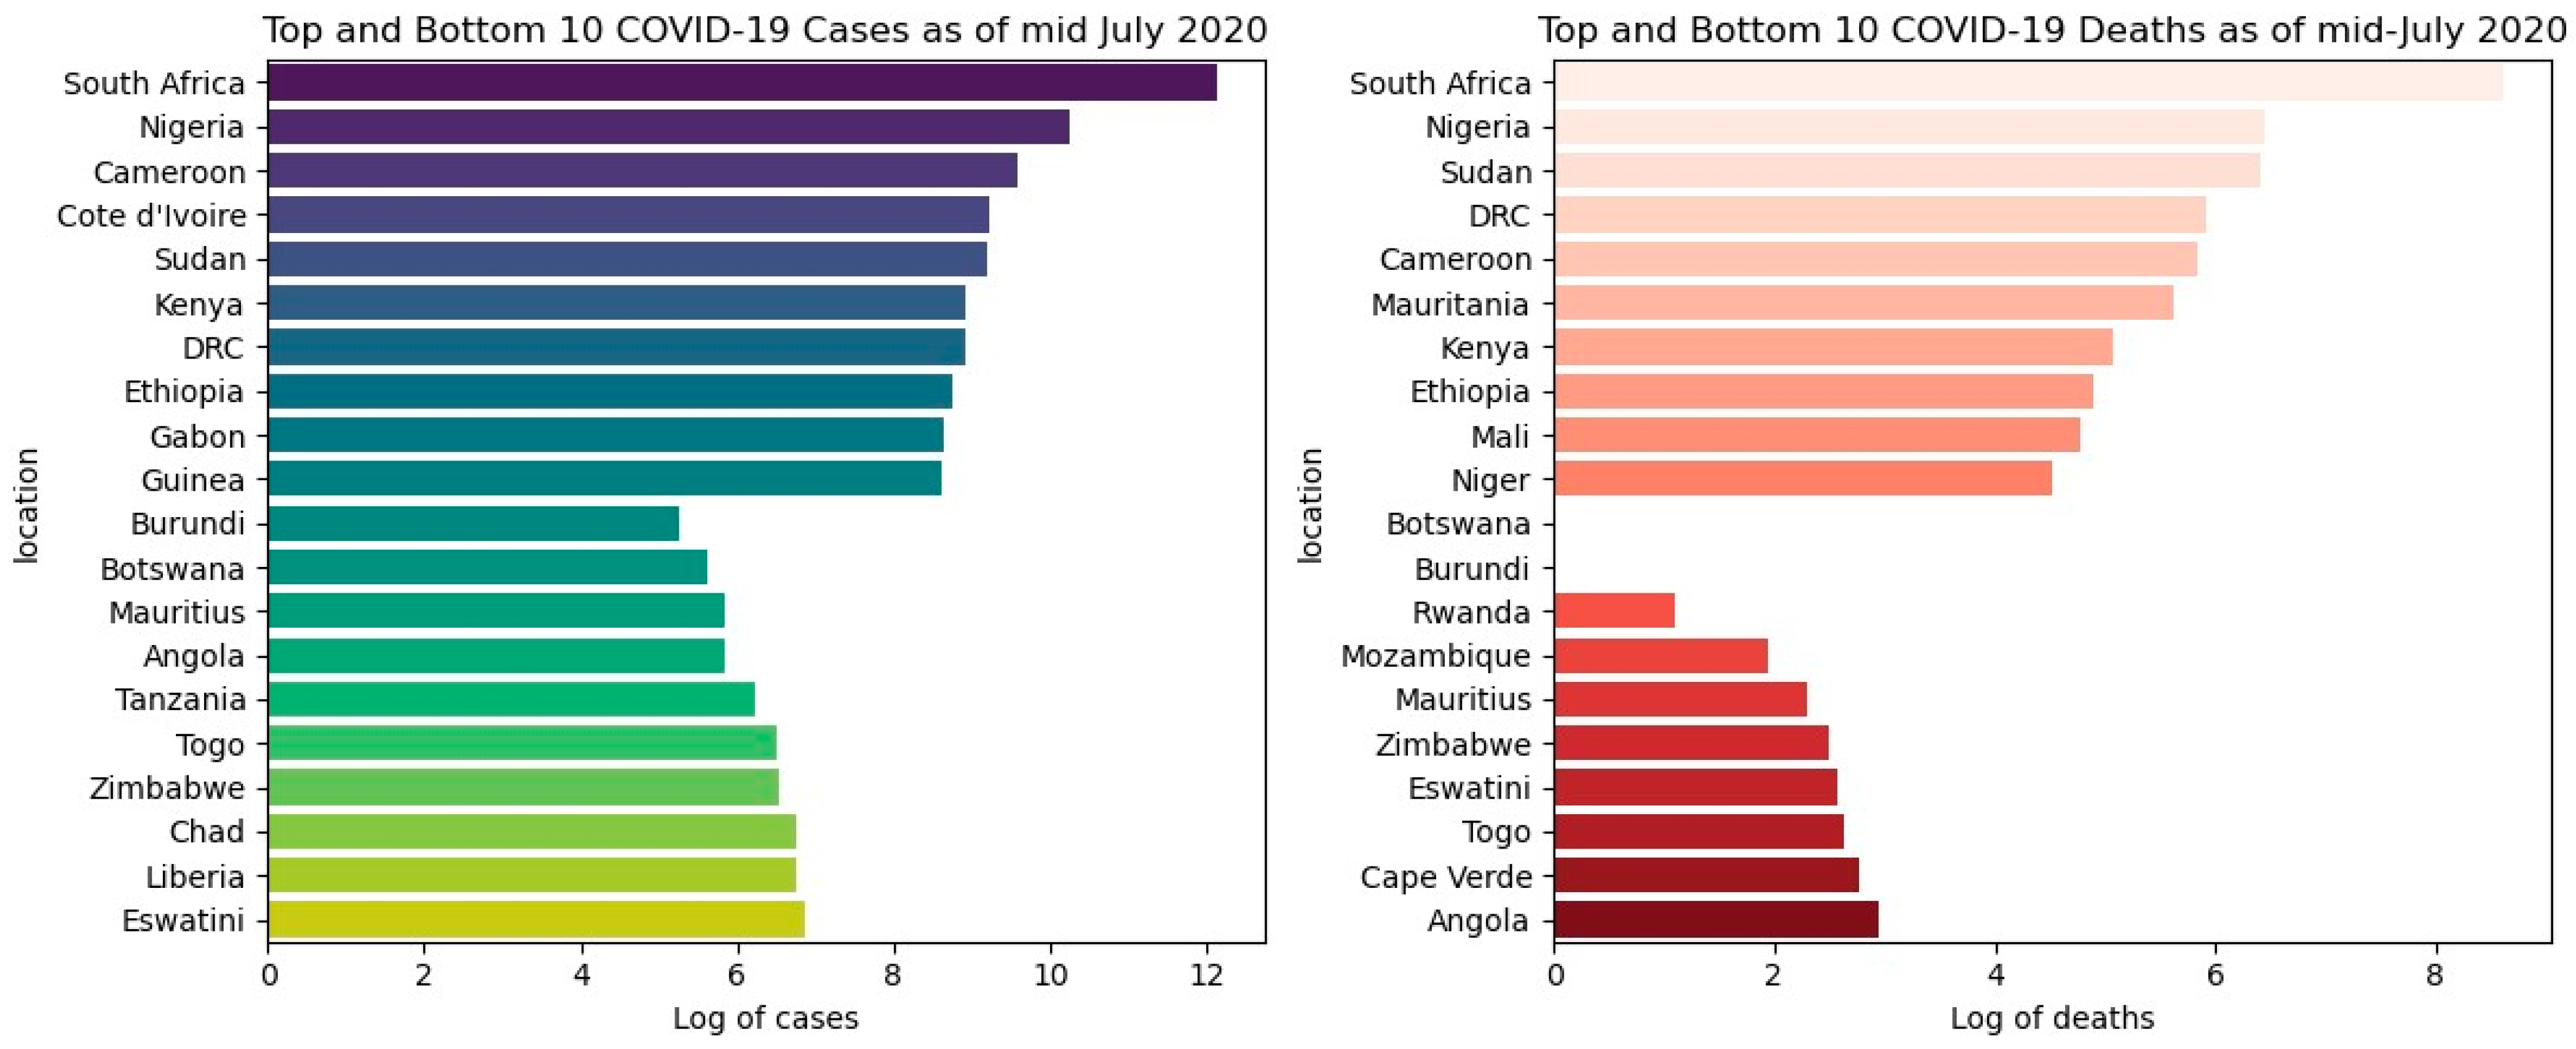
Figure 1. Total COVID-19 cases and deaths for the selected sub-Saharan countries as of July 2020. Source: Author compilation.
Economies 12 00112 g001
Figure 2. Plot of daily returns and volatility for each sector at the JSE. Note: The plot illustrates the daily returns and conditional volatility in percentage terms for each sector during the COVID-19 period.
Economies 12 00112 g002
Figure 3. Plot of daily returns and volatility for each sector at the NGX. The plot illustrates the daily returns and conditional volatility in percentage terms for each sector during the COVID-19 period.
Economies 12 00112 g003
Figure 4. Plot of daily returns and volatility for each sector at the ZSE. Note: The plot illustrates the daily returns and conditional volatility in percentage terms for each sector during the COVID-19 period.
Economies 12 00112 g004
Figure 5. Plot of daily returns and volatility for each sector at the LuSE. Note: The plot illustrates the daily returns and conditional volatility in percentage terms for each sector during the COVID-19 period.
Economies 12 00112 g005
Figure 6. SHAP summary plots for the feature impact on sector volatility at the JSE. Note: The features are arranged by their order of importance on volatility, with the most significant features being at the top. The feature values are color-coded, with red representing high feature values and blue representing low feature values.
Economies 12 00112 g006
Figure 7. Time series plot of SHapley Additive (SHAP) values for the JSE sectors.
Economies 12 00112 g007
Figure 8. SHAP summary plots for the feature impact on sector volatility at the NGX. Note: The features are arranged by their order of importance on volatility, with the most significant features being at the top. The feature values are color-coded, with red representing high feature values and blue representing low feature values.
Economies 12 00112 g008
Figure 9. Time series plot of SHapley Additive (SHAP) values for the NGX sectors.
Economies 12 00112 g009
Figure 10. SHAP summary plots for the feature impact on sector volatility at the ZSE. Note: The features are arranged by their order of importance on volatility, with the most significant features being at the top. The feature values are color-coded, with red representing high feature values and blue representing low feature values.
Economies 12 00112 g010
Figure 11. Time series plot of SHapley Additive (SHAP) values for the ZSE sectors.
Economies 12 00112 g011
Figure 12. SHAP summary plots for the feature impact on sector volatility at the LuSE. Note: The features are arranged by their order of importance on volatility, with the most significant features being at the top. The feature values are color-coded, with red representing high feature values and blue representing low feature values.
Economies 12 00112 g012
Figure 13. Time series plot of SHapley Additive (SHAP) values for the LuSE sectors.
Economies 12 00112 g013
Table 1. COVID-19 pandemic periods for selected sub-Saharan African stock markets.
CountryFirst COVID CaseCOVID-19 Period
South Africa05 March 202005 March 2020 to 31 July 2022
Nigeria27 February 202027 February 2020 to 31 July 2022
Zimbabwe20 March 202020 March 2020 to 31 July 2022
Zambia18 March 202018 March 2020 to 31 July 2022
Source: Author compilation.
Table 2. Number of sampled stocks by sector on the selected stock exchanges.
SectorJSENGXZSELUSE
Consumer Discretionary321362
Consumer Staples2422126
Energy411--1
Financials7354117
Health Care118----
ICT241221
Industrials432272
Materials371374
Real Estate2213--
Utilities--1--1
Total2701574824
Note: The blank cells in the table indicate that there were no stocks available for sampling from that particular sector in the respective stock exchange during the study period. Source: Author compilation.
Table 3. Description of Analytical Variables.
VariableDescription
∆_CasesChange in new COVID-19 cases from day t − 1 to day t
∆_DeathsChange in new COVID-19 deaths from day t − 1 to day t
Vaccin_ratioVaccin_ratio—represents the total number of vaccinations on day t divided by the cumulative number of confirmed cases on day t
CF_rateThe case fatality rate represents the number of deaths on day t divided by the cumulative number of confirmed cases on day t
str_indexThe change in the government stringency index between day t and day t − 1. The stringency index is a composite measure based on 9 response indicators including school closures, workplace closures, and travel bans, rescaled to a value from 0 to 100
Hosp_rateTotal number of hospitalized patients on day t divided by cumulative number of confirmed cases on day t
+ve rateThe share of COVID-19 tests that are positive, given as a rolling 7-day average
Ln_VolmNatural log of total dollar volume of shares traded per sector on day t
InflationInflation rate
FX_rateExchange rate given as number of USD per unit of a country’s currency
Table 4. Descriptive statistics for the variables, for all the four stock exchanges.
(A) Descriptive statistics for the variables used to model volatility at the Johannesburg stock exchange(B) Descriptive statistics for the variables used to model volatility at the Nigerian stock exchange
countmeanstdmin25%50%75%maxcountmeanstdmin25%50%75%max
new_cases53014121.485149.1905811866577126,3894732292.82449.110261384166158
new_deaths5301121.12153.640156716084447323.195.07001531
icu_patients5301732.34712.210194532998269447320000000
hosp_patients53015350.784619.42020034274770018,03447320000000
positive_rate53010.110.0900.040.080.180.3347320.050.06000.020.080.3
new_vaccinations530126,276.1356,754.2400016,390414,06547324555.0244,753.750000797,209
stringency_index530148.2121.992.7836.1948.1563.8987.96473250.7115.27039.4947.2258.3385.65
FX_rate530115.791.2413.4314.815.4616.7519.114732399.9818.6360.5381.2410.3415.12444.97
Inflation53014.641.581.993.174.675.777.8473212.842.119.410.9613.1713.9317.67
Dollar_Volm53011.32 × 10101.57 × 101080,905,5854.77 × 1099.01 × 1091.59 × 10104.53 × 101147324.63 × 1095.75 × 10913311.97 × 1093.34 × 1095.56 × 1092.2 × 1011
(C) Descriptive statistics for the variables used to model volatility at the Zimbabwean stock exchange(D) Descriptive statistics for the variables used to model volatility at the Lusaka stock exchange
new_cases4326322.55807.4801657.522790274504383.7773.47017853225555
new_deaths43266.8614.92001510745044.210.26000372
icu_patients4326000000045040000000
hosp_patients4326000000045040000000
positive_rate43260.060.0700.010.030.080.4445040000000
new_vaccinations432613,178.3424,821.17001597.516,349175,91545040000000
stringency_index432661.715.68051.0557.4171.387.9645040000000
FX_rate4326149.62149.7324.7582.4285.6130.12628.21450418.692.2513.9416.9718.132122.68
Inflation4326289.09249.0249.3766.55213.54394.13839.08450417.074.749.713.916.0921.8324.8
Dollar_Volm43265,400,96630,335,077043,116.32359,761.12,499,1301.23 × 1094504278,375.213,394,0940001480.988.94 × 108
Note: The descriptive statistics for each stock exchange were calculated from the data for the country where the stock exchange is domiciled. The meaning of the variables is as explained in Table 3.
Table 5. Results of the Exponential GARCH model for the JSE Sectors.
VariableConsumer DiscretionaryConsumer StaplesEnergyFinancialsHealth CareICTIndustrialsMaterialsReal Estate
omega0.010.0130.018 *0.0030.0240.005 ***0.0030.0450.007
alpha [1]0.107 **0.1230.075 ***0.043 *0.059−0.042 ***0.087 **0.150.078
gamma [1]−0.08 ***−0.098 **−0.061 ***−0.043 ***−0.051 **−0.041 ***−0.029 *−0.078 *−0.049 ***
beta [1]0.977 ***0.94 ***0.992 ***0.989 ***0.979 ***0.992 ***0.986 ***0.936 ***0.991 ***
+ve Cases−1.285 ***−0.168−2.094 ***−0.385 ***0.191−0.54 ***−0.326 ***−0.544 ***−0.642 ***
∆_Cases0.008−0.009−0.007−0.0080.0010.003−0.0010.003−0.011
∆_Deaths0.0120.0070.0110.0040.010.0030.0030.0040.008
str_index0.009 ***0.002 ***0.012 ***0.002 ***−0.005 ***−0.001 *0.002 ***0.002 *0.004 ***
FX_rate−41.375 ***−13.044 ***−78.308 ***−35.809 ***−36.609 ***−35.377 ***−18.839 ***−26.257 ***−30.715 ***
Inflation−0.125 ***−0.061 ***0.146 ***0.0140.058 ***−0.071 ***0.010.133 ***−0.068 ***
Ln_Volm0.093 ***0.1 ***−0.081 *0.076 ***0.057 ***0.029 *0.004−0.0110.044 **
Vaccin_ratio−0.048 ***−0.02 ***−0.072 ***−0.031 ***−0.02 ***−0.069 ***−0.014 ***−0.061 ***−0.012 ***
Key: *** significant at 1% level, ** significant at 5% level, * significant at 10% level.
Table 6. Results of the Exponential GARCH (E-GARCH) model for the NGX Sectors.
Consumer DiscretionaryConsumer StaplesEnergyFinancialsHealth CareICTIndustrialsMaterials
Variable
omega−0.046−0.0480.009−0.010.003−0.037−0.0360.353
alpha [1]0.380.212 *0.2290.15 ***0.169 ***0.147 **0.114 *0.652 *
gamma [1]0.0380.056 **0.0360.04 **0.059 *0.010.0030.509 *
beta [1]0.804 ***0.923 ***0.889 ***0.98 ***0.942 ***0.948 ***0.969 ***1.0 ***
∆_Cases00000000
∆_Deaths0.004−0.0020.0070.0020.0060.001−0.002−0.002
+ve Cases0.005−0.43 **0.861 ***0.301 *0.164−0.14−0.0220.607 ***
Vaccin_ratio0.001 ***0.0 *0.001 ***0.001 **0.002 ***0.0 ***0.001 ***0.001 ***
str_index0.003 ***0.002 **0.004 ***0.002 **−0.004 ***−0.002 ***0.001 **0.003 ***
Inflation−0.05 ***−0.029 ***−0.011−0.035 ***−0.078 ***−0.011 **−0.051 ***0.016
FX_rate0−0.002 ***−0.004 ***−0.004 ***−0.001−0.002 ***−0.001 ***−0.001
Ln_Volm0.04 ***0.054 ***0.04 ***0.099 ***0.068 ***0.0010.009 **0.014 **
Key: *** significant at 1% level, ** significant at 5% level, * significant at 10% level.
Table 7. Results of the GJR model for the ZSE Sectors.
Consumer
Discretionary
Consumer
Staples
FinancialsICTIndustrialsMaterialsReal Estate
Variable
Omega0.2830.3540.245 ***1.735 **0.2980.050.678
alpha [1]0.0830.272 **0.162 ***0.801 **0.161 **0.156 **0.241
gamma [1]0.024−0.053−0.085−0.567 *−0.035−0.04−0.115
beta [1]0.83 *0.648 ***0.757 ***0.482 ***0.751 ***0.855 ***0.74 ***
∆_Cases−0.0010.0130.003−0.004−0.002−0.024 *−0.015
∆_Deaths−0.0080.0020.018−0.072−0.0060.0110.01
+ve_Cases1.092 ***1.506 *0.088−0.5020.7790.587−1.312
str_index0.003 **0.01 *0.0040.007−0.0010.008 ***0.013 **
FX_rate4.811 ***8.084 **4.555 *11.380.30713.448 ***11.992 **
Ln_Infl0.123 ***0.258 ***0.114 **0.318 *0.165 ***0.329 ***0.22 *
Ln_Volm0.024 ***0.0520.058 ***0.127 **0.046 ***0.044 ***0.085 ***
Vaccin_ratio−0.005 ***0.014 ***0.0030.028 ***0.007 **0.007 ***0.009
Key: *** significant at 1 % level, ** significant at 5 % level, * significant at 10% level.
Table 8. Results of the GJR model for the LuSE Sectors.
Consumer
Discretionary
Consumer StaplesEnergyFinancialsICTIndustrialsMaterialsUtilities
Variable
omega0.001 ***0.001 ***0.001 ***00.0 ***0.0010.0050.131 **
alpha [1]0.01 ***0.01 *0.01 ***0.9840.01 ***0.725 *0.4240.323 ***
gamma [1]0.010.010.01−0.8280.01 **−0.3360.003−0.235 ***
beta [1]0.869 ***0.965 ***0.965 ***0.4150.965 ***0.1860.4040.794 ***
∆_Cases000−0.00300−0.001−0.01
∆_Deaths00.001−0.001−0.0030.001−0.024−0.003−0.006
str_index000−0.0 **00−0.0 ***0
+ve_cases0.0 ***−0.0 ***−0.0 ***−0.0 **000.0 ***0
FX_rate0−0.004 ***0.001−0.012 ***−0.001 ***0.037 ***−0.001−0.014
Inflation0−0.002 ***−0.007 ***0.006 ***−0.001 ***−0.00300.091 ***
Ln_Volm−0.0 ***0.001 ***0.002 ***0.008 ***00.028 ***0.005 ***−0.018 ***
CF_rate−0.001−0.4392.982 *−6.879 **−0.5533.81410.141 ***15.009
Key: *** significant at 1% level, ** significant at 5% level, * significant at 10% level.
Table 9. R-squared results for the data set training.
JSENGXZSELuSE
SectorRandom ForestXGBoostSVMRandom
Forest
XGBoostSVMRandom ForestXGBoostSVMRandom ForestXGBoostSVM
Consumer Discretionary0.87320.50090.8670.35960.04230.29920.96830.31010.8329−0.310−0.014−0.368
Consumer Staples0.85740.29380.71150.80120.09740.41060.65050.09220.28230.8117−0.001−1.561
Energy0.95230.53840.84870.13330.02410.1586 0.7441−0.0320.2261
Financials0.9673080.40040.89300.88430.28510.63820.57270.08660.16070.536−0.0110.2285
Health Care0.88870.27410.83440.78470.18860.3015
ICT0.95470.44570.90290.8309−0.0000.51300.37200.05910.04020.5411−0.002−6.801
Industrials0.95830.37800.85510.80090.04080.49220.54570.07180.24930.0275−0.015−0.002
Materials0.71850.33430.63840.78910.21610.5900.80760.30810.65340.0712−0.004−0.424
Real Estate0.92610.45300.8477 0.35830.14310.1214
Utilities 0.79550.42430.4196
Note: The table shows the explanatory power (R-squared) for the three machine learning models used in training explanatory variables on the target variable (sector returns). The results are shown for each sector in the stock exchange involved.
Disclaimer/Publisher’s Note: The statements, opinions and data contained in all publications are solely those of the individual author(s) and contributor(s) and not of MDPI and/or the editor(s). MDPI and/or the editor(s) disclaim responsibility for any injury to people or property resulting from any ideas, methods, instructions or products referred to in the content.