1. Introduction
Higher education provides significant benefits to the Canadian economy and the cultural fabric of the nation. Economists refer to these benefits as public goods. Public goods have the property that the individual (the student in this case) cannot capture all the benefits from providing the goods–there are many spill-over benefits received by the public for which they do not pay. In recognition of the huge public benefits higher education confers on society, higher education is subsidized by the Canadian taxpayer. Prior to the 1970s, university subsidies were largely provided by the federal government and the emphasis was to expand the university system in Canada, which was carried out rapidly (
Elbreckt 2015). The federal government passed this responsibility to the provinces and territories in the early 1970s by providing much expanded transfer payments for higher education. Up to the early 1990s, provinces and territories emphasized increasing enrolments, and funding was largely based on full-time equivalents (FTEs). Today, the priorities of provincial and territorial governments have changed improving accessibility, rather than enrolments, resulting in the promotion of some colleges to degree-granting status.
Recent economic events have adversely affected many of the provincial and territorial government’s ability to raise revenue, particularly volatile commodity prices and the general slowdown of economic growth in the Canadian economy. This paper focuses on the sensitivity of spending on higher education to these economic events with emphasis on Canada’s provincial universities. We do not address the distribution of spending to different institutions within each province—that is usually based on a funding formula that uses FTEs and other key performance indicators as inputs, as well as discretionary spending. Instead, we focus on the total provincial revenue as it is influenced by cyclical and random fluctuations in the economy. The total operating grant allocated to each university in our sample is then a portion of the total provincial revenue. We do not include capital expenditures or other special expenditures. By estimating the elasticity of the real growth in the total operating grant to the real growth in provincial revenue, we can test for cyclical and random components and test for smoothing the allocation over the business cycle. Of course, the ability to smooth spending to higher education from revenues also depends upon government priorities, and in particular, the state of the government surplus or deficit and any public debt outstanding. We also incorporate a political spending cycle by including variables for elections and political ideology.
There exists literature on the sensitivity of higher education spending in the United States to economic events; however, we could find no such study for Canada.
Humphreys (
2000) estimated the sensitivity of the real growth rates of higher education spending by U.S. states to the real growth rates of state GDP and found it to have an elasticity of 1.17 by estimating a regression of state education appropriations per FTE on real GDP per capita. He also found a larger elasticity when the economy was in recession that when it was in an expansion. The estimated elasticity arises from a reduced form equation since state higher education appropriations are not a direct function of real GDP per capita. Instead, fluctuations in the economy trigger fluctuations in government revenue that result in fluctuations in higher education appropriations. We address this shortcoming by employing a multiple equation model of this process.
Kane et al. (
2005) also found a procyclical association for state appropriations using the state unemployment rate as a measure of business cycle swings.
Even if a new government is elected, many U.S. states have adopted tax and expenditure limitations (TELs), effectively tying the hands of future governments by placing an upper limit on the abilities of the government to raise specific tax revenues and conduct different types of expenditures (these are not a feature of Canadian governments to our knowledge).
Archibald and Feldman (
2006,
2008) estimate the elasticity of higher education spending to various economic factors in states that have adopted TELs versus states that have not, but find no significant difference in the elasticity value, suggesting that higher education spending is valued more highly by state governments than other types of spending. A balanced budget requirement (BBR) is a more stringent state fiscal policy that requires the state to match spending to revenue and thus not accumulate any new public debt. Alberta is the only Canadian province or territory to adopt a BBR, but several U.S. states have done so.
Serna and Harris (
2014) examined state funding for higher education and found no association between states with BBRs and those without, suggesting that the presence of a BBR is largely ignored when considering higher education spending. We include the previous year’s provincial budget deficit as a constraint in allocating revenue to higher education operating grants.
Private universities are much more prevalent in the United States than Canada; hence, their availability could impact the decisions of state governments to fund public higher education institutions.
Thelin (
2004) found that states with more private universities generally had larger elasticities than those without. The method throughout these papers is to regress total state appropriations to higher education directly on real GDP per capita, a method we hope to improve upon.
Our model has several interesting results. Provincial government revenue is strongly influenced by cyclical changes in provincial GDP, but provincial operating grants respond only weakly to changes in provincial government revenue, resulting in a weak overall cyclical effect. Provincial governments do respond to changes in student demand measured by FTEs that behave countercyclically. This is the main driving force behind changes to the operating grant.
2. Higher Education Funding in Canada
All Canadian provinces receive a transfer payment from the federal government that is targeted towards health care, education, and social services. These transfers are funded through federal income tax and thus offer no specific tax burden to the provinces. Provinces also collect revenue through the broad categories of taxation (income tax, sales tax and corporate tax), user fees, natural resource royalties, and revenues from general government operations. Running a budget deficit is also a form of revenue as it is used to finance valued expenditures (excluding funding debt service payments), although it is a burden for future taxpayers. Tax revenues can be particularly sensitive to the business cycle.
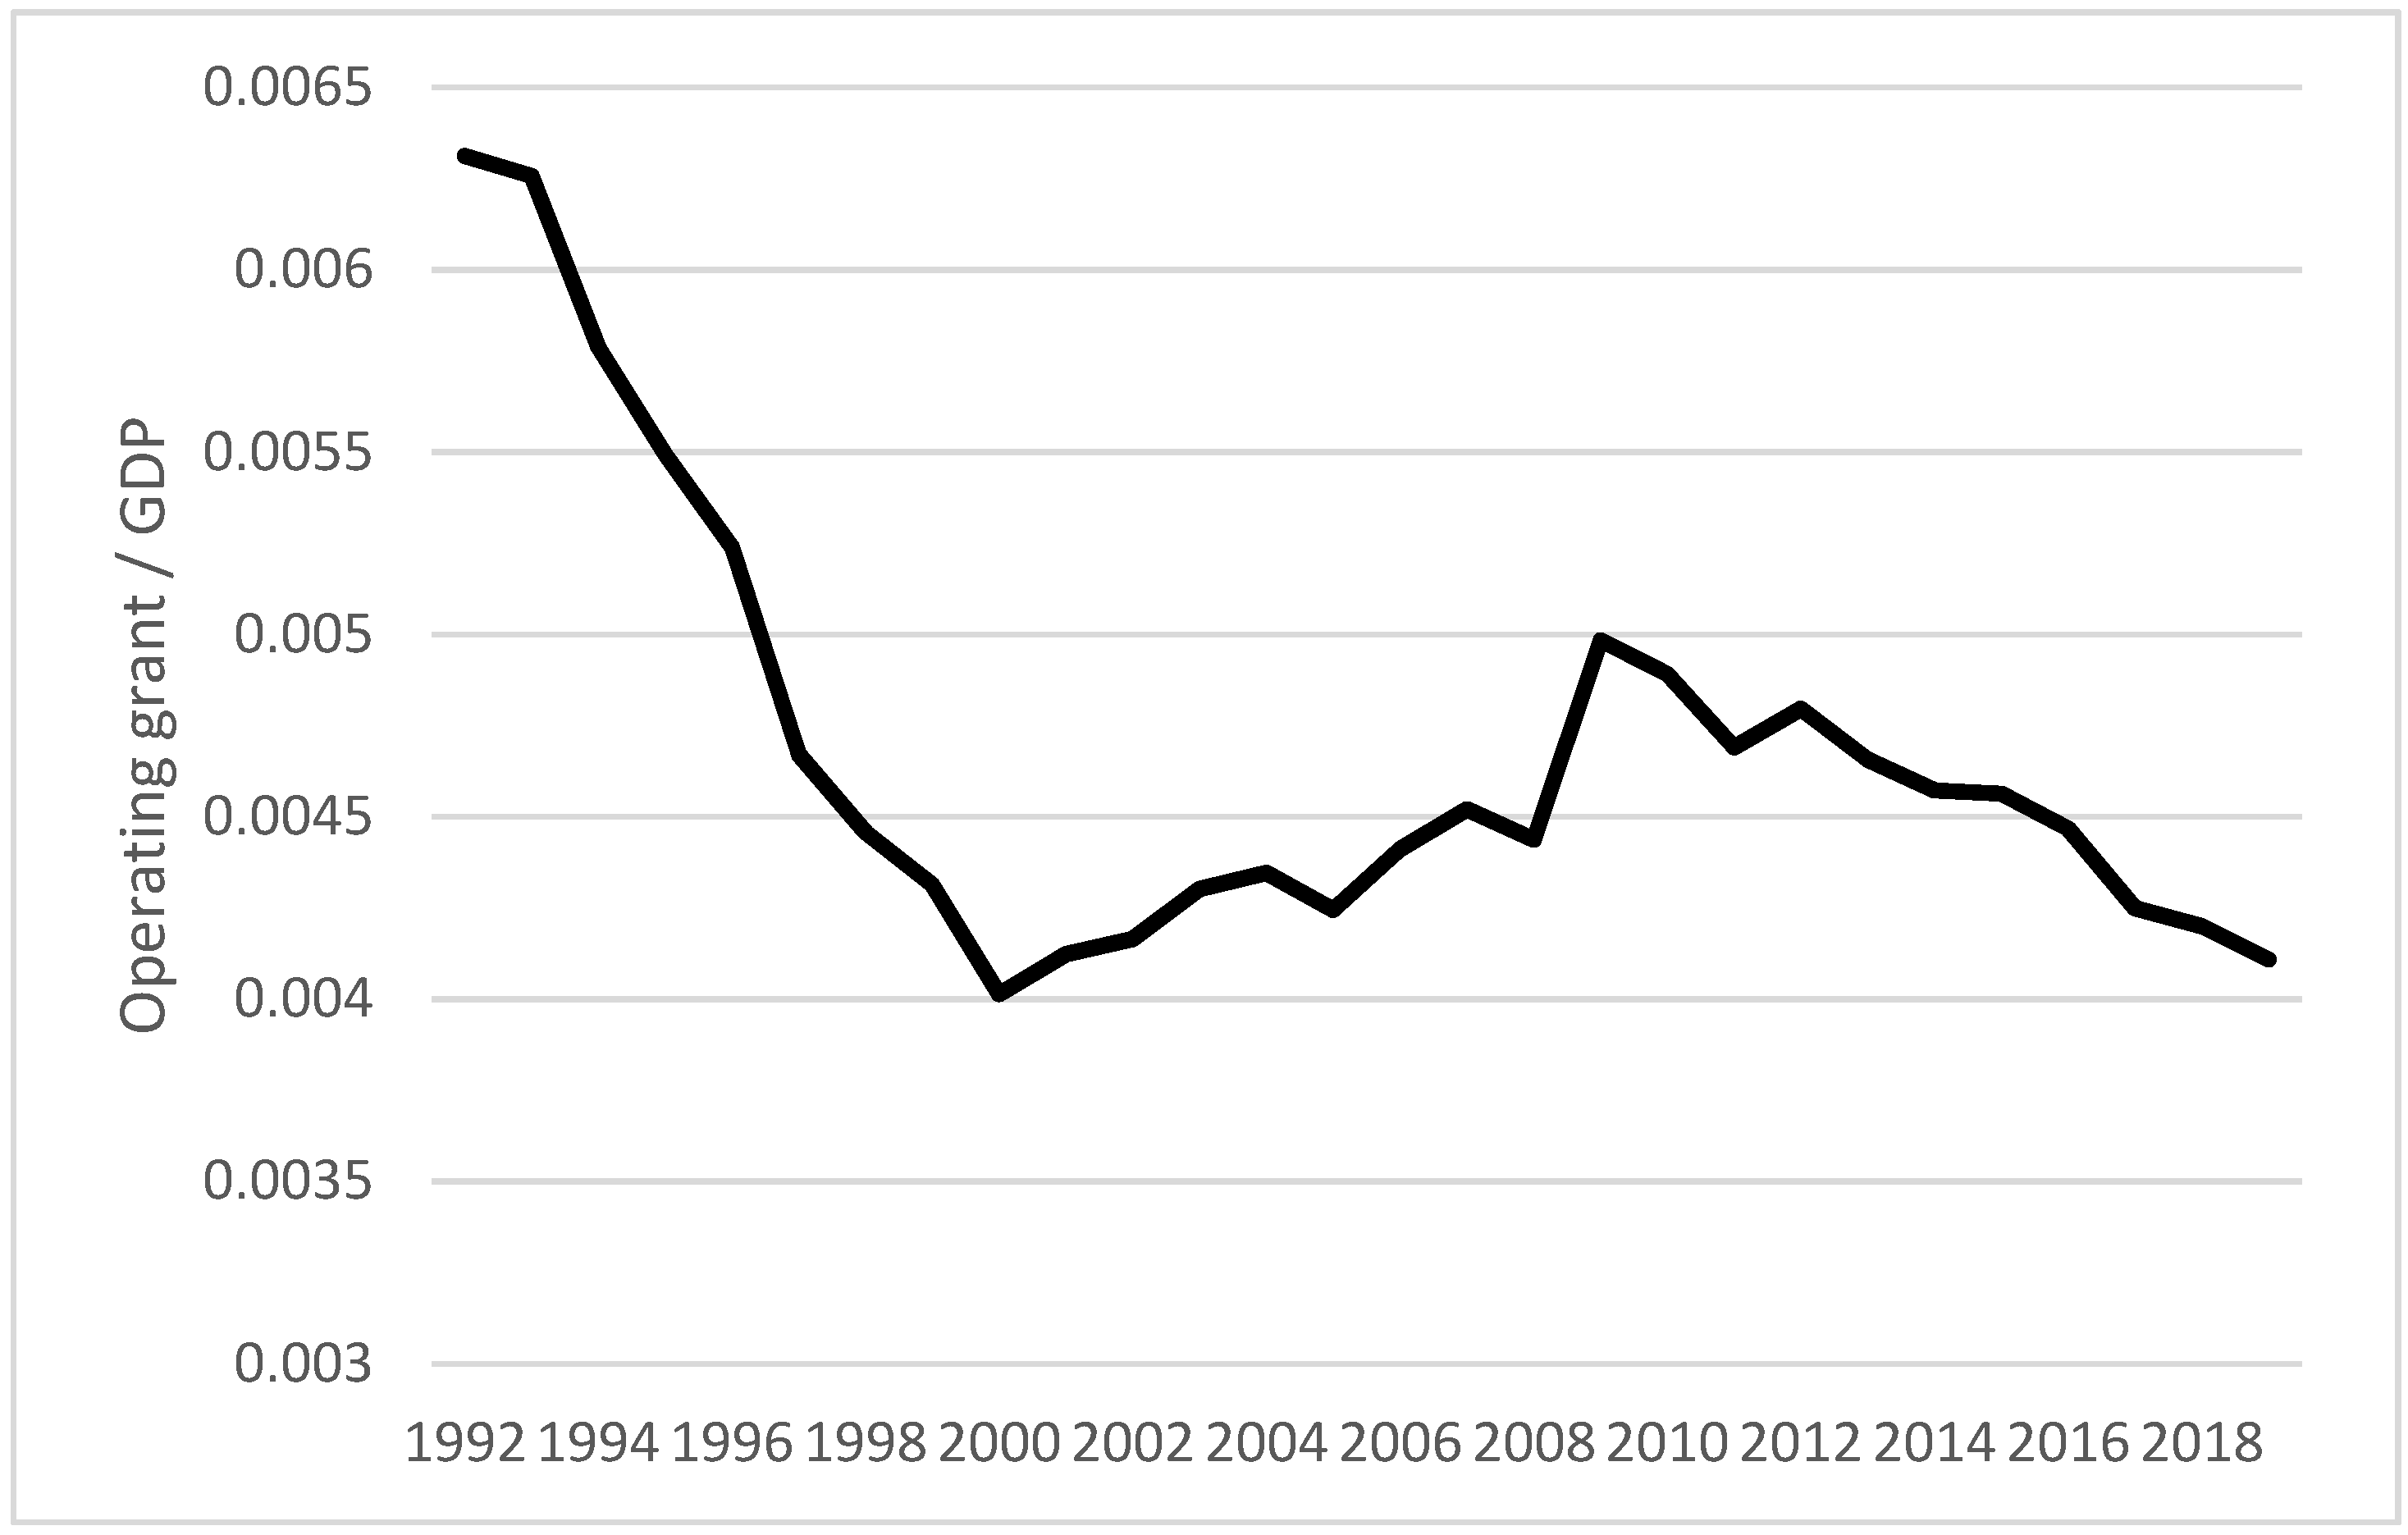
Provincial funding for the operating grant has experienced episodes of increases and decreases.
Figure 1 displays the total provincial operating grants relative to total provincial GDP. The 1990s experienced a significant drop in this measure of funding only to see increased funding in the next decade. Funding has again decreased since 2010.
Ontario is Canada’s largest province both in terms of population and GDP. It also boasts the largest number of universities of any province (17). Ontario adopted a formula-based funding model for the distribution of the total allocation of revenue to the operating grant in 1985 (
Higher Education Quality Council of Ontario 2015). The model is complex but in its basic form, each university is awarded a number of basic income units (BIUs) based on enrolment and the types of programs offered. A university that offers more expensive programs to service, such as sciences, medicine, engineering, etc., will receive more BIUs at a given level of enrolment than one that offers much fewer of these programs. Enrolment growth puts pressure on the number of BIUs to increase as well; however, more funding will be provided only if BIUs increase by over 3% using a five-year moving average to avoid providing an incentive to rapidly increase enrolment merely to obtain more funding. A portion of the total monies made available by the government in its annual budget is divided by the total number of BIUs to determine the dollar value of a BIU. Funds made available for capital projects are not included in the formula.
The total provincial operating grant is subject to changes in political ideology and fiscal realities. The Conservative government of Michael Harris reduced the total operating grant available to universities in the Ontario provincial budget beginning in 1995. Coinciding with this was the deregulation of tuition fees with the objective of reducing the share of university revenues arising from the operating grant.
Figure 2 displays a marked decline in the real operating grant per FTE for the province’s 17 major universities that continued until 2003 when a Liberal government was elected. Nevertheless, by 2013–14, the provincial operating grant composed only 27% of the CAD 13.1 billion in total university revenue, with tuition accounting for 38%, a large decrease from the 70% share of revenue by the operating grant in 1991. An accessibility fund was added to the operating grant in 2001 to enable the increased enrolments due to the elimination of the high school grade 13. This fund has continued today. A small amount (4%) of the operating grant is allocated based on performance indicators submitted by each institution.
Some of Canada’s other nine provinces use a formula method to determine the share of the total monies allocated to university operating grants to each institution. The methods differ in detail with some provinces, such as Alberta, placing more emphasis on responding to market demand for programs than continuing funding to existing programs (
Fletcher 2020). British Columbia does not use a funding formula—increases in operating grants are tied to the previous year’s operating grant with discretionary increases for student demand (
Ministry of Advanced Education and Skill Training 2022). Quebec utilized a funding formula that included 538 factors up to 2018, reducing to 107 factors afterward (
Venne 2018). Tuition fee increases are regulated in all provinces except Ontario (
Barakat 2023).
Canada’s other nine provinces experienced similar declines to Ontario in funding to universities after the 2008 financial crisis. All provincial governments suffered a decline in real per capita revenue in 2009, the largest being Saskatchewan at −21.4%. The average decline across all ten provinces measured −5.01% in 2009, resulting in a decline in real operating grants per FTE for all ten provinces. Fortunately, most of the provinces returned to a level exceeding the 2008 level by 2013. Ontario was an exception. The potential negative effect on operating grants caused by the 2008 financial crisis was partly offset by the countercyclical increase in post-secondary enrolment of 39,000 students across Canada experienced in 2009 (
The Canadian Press 2009). Provincial governments respond to higher enrolment by increasing operating grants as a commitment to maintain post-secondary education.
The approach used in this paper sidesteps the effect of differing funding formulae on operating grants by focusing solely on the total operating grant allocated by each province—operating grants to individual institutions are aggregated. Since the allocation to each institution is formulaic in many cases, it is the sensitivity of the total provincial allocation of operating grants to economic cycles that is worthy of study.
3. Political Factors
Previous research using Canadian provincial government accounts data has focused on two main themes: determining if provincial expenditures are tied to a political cycle, and efficiencies in provincial spending. The political cycle model has two competing effects (
Hibbs 1977). Any ruling political party may wish to increase its expenditures in an election year to increase its chances of re-election (the electoral cycle); however, a right-wing ruling political party may wish to practice austerity in the non-election years to signal its ideology if a majority of voters are perceived to agree with it (the partisan cycle). The empirical evidence has been supportive using Canadian provincial data.
Dickson and Yu (
1997),
Petry et al. (
1999),
Kneebone and McKenzie (
2001), and
Tellier (
2006) found support for the political cycle hypothesis.
Serletis and Afxentiou (
1998) found no evidence of a political cycle using data for the Canadian federal governments. Political considerations could enter how provinces choose to raise revenues and spend them. The marginal political costs, in terms of the reduced probability of re-election, were found to be highest for direct taxes by
Landon and Ryan (
1997), while a greater reliance on indirect taxes (user fees, licenses, etc.) was found to have a much lower marginal cost. Government spending on goods and services was the only spending category to have a high marginal cost.
Abizadeh and Gray (
1992) found that the ideology of the ruling provincial political party had no influence on provincial economic growth.
Dickson (
2009) found that federal government spending per capita was higher in provinces that demonstrated loyalty to the ruling federal government party.
Election cycles and political ideologies could influence the share of Ontario government revenue allocated to the total university operating grant. We account for political and partisan cycle effects using the same method as
Petry et al. (
1999). An election and post-election years are coded with binary independent variables (
Elec and
Postelec).
Petry et al. (
1999) constructed three binary independent variables, one for the year prior to an election, one for the mid-point of an election cycle, and one for the year following an election. The partisan effect is measured using the power index (
Power) detailed in
Petry et al. (
1999) that takes on the maximum values of 1 for a right government and −1 for a left government.
4. Methodology
The regression model’s purpose is to capture the funding process from changes in provincial income to changes in provincial government revenue to changes in the total operating grant each year. Previous studies have modelled this process in a single regression equation that typically includes current and lagged values of income—a reduced form equation from an unspecified system of equations. As such, the contribution of each component of the system cannot be identified; instead, the single regression equation yields coefficients that are mongrels containing the unknown system coefficients. We seek to improve this approach by specifying a regression model composed of four equations that allow for the estimation of the deeper coefficients in the mongrels.
While it is very unlikely that the provincial working age population (15–70 years) has a strong association with the provincial business cycle, the same might not be argued for total FTEs. The extensive literature tends to find that university enrolment behaves countercyclically, possibly due to the lack of employment opportunities.
Charles et al. (
2018),
Sievertsen (
2016),
Barr and Turner (
2015), and
Johnson (
2013) are recent references.
Card and Lemieux (
2000) found a countercyclical effect using Canadian data. Equation (3) captures the possible countercyclical behavior of enrolments using current and one-period-lagged real per capita GDP growth. The growth rate of the current and one-year-lagged provincial unemployment rate (Statistics Canada Table 14-10-0078-01) was contemplated for inclusion in (3) but was not. The growth in the real operating grant is not directly a function of the growth rate of the unemployment rate; since the unemployment rate is not revenue, it is necessary to include a fifth equation that relates real GDP growth to the growth rate of the unemployment rate. However, it is not clear what the direction of causation is between the two. If they are simultaneously determined, this creates endogeneity issues requiring some form of instrumental variable (IV) estimation, an unnecessary complexity. Second, the growth in the operating grant is clearly a function of the growth in real incomes as these are taxed to generate government revenue. The unemployment rate is not taxed. In addition, when (3) is estimated with the growth rates of the current and lagged unemployment rate, the strong correlation with real GDP growth (r = −0.704) renders the coefficients
and
statistically insignificant. The unemployment rate also has measurement issues that makes its inclusion in the model questionable (
Humphreys 2000).
Substituting Equations (1) and (3) into (2) gives the reduced form regression in Equation (4), where , , , , and . Equation (4) is estimated to test the cross-equation restrictions for the validity of Equations (1)–(3). The structure of the system of Equations (1)–(3) presents no apparent issues of endogeneity.
The total provincial operating grant is measured as the sum of the operating grants of each provincial university listed in the appendix over the sample period 1992–2019. The 2020–2021 years were excluded due to the COVID-19 pandemic when spending on healthcare dominated distorted government funding priorities. The sample was limited to 77 public institutions that each received over CAD 1 million in operating grants each year. A list of these institutions is available from the corresponding author upon request. Annual operating grants were obtained from the Canadian Association of University Business Officers (CAUBO) financial database (obtained by request from
https://www.caubo.ca/). Total provincial government revenue was obtained from the database maintained by
Kneebone and Wilkins (
2016) (
https://www.policyschool.ca/publication-category/research-data/ accessed on 21 September 2023). Provincial GDP values were obtained from Statistics Canada (Table 36-10-0222-01). The total operating grant, provincial government revenue, and GDP were deflated using the provincial consumer price index (2002 = 100, Table 18-10-0005-01). The total number of FTE students for the sample universities was collected to scale the total operating grant across provinces (Table 37-10-0011-01). Part-time students were assigned a weight of 0.5 in the total. The real provincial government revenue and real income were divided by the provincial population aged 15–70 to produce per capita values (Table 17-10-0005-01). The complete dataset includes the real operating grant per FTE (
grant), real provincial revenue per capita (
revenue), real provincial GDP per capita (
gdp), and each measured as a growth rate. A dummy variable for an election year (
election), a dummy variable for the year following an election year (
postelection), and a variable measuring the partisan effect of a right-wing government (
power) are also included.
Real provincial revenue is regressed on current and one-period-lagged real provincial gross domestic product in (1) as a large portion of these revenues are direct and indirect tax collections. The average tax collections as a share of revenue ranged from a low of 31.4% for Alberta to a high of 66.8% for Quebec between 1992 and 2019. The overall provincial average was 43.4%. A portion of federal transfer payments are determined by a formula that is procyclical. The remaining revenues are resource revenues and revenues obtained from fees for government services that are captured in the intercept and error term. The total real provincial operating grant to its universities is funded by current and one-period-lagged real provincial revenue in (2) to account for the lag between revenues received and budget allocations that typify the government budgeting process; however, a portion of the total operating grant can be funded with deficit financing and/or reducing spending on other government accounts. This decision is posited to be a function of increases in student demand, represented by full-time equivalents (), the election cycle ( and ), and the ideological position of the provincial government (.
5. Time Series Stationarity
Although two variables may appear to be strongly associated, they may not actually be if a spurious regression error is committed.
Granger and Newbold (
1974) demonstrated that two random walk series that have no meaningful association can be strongly correlated, generating a regression model with good fit. The problem can be addressed by determining the degree of stationarity for each variable using a unit root test. If both series are stationary after first-differencing (I(1)), they can be regressed in first-differences and interpreted in the same manner as a regression model in levels. The panel unit root tests that assume a common root (
Levin et al. 2002 or LLC) and individual cross-section roots (
Im et al. 2003 or IPS) are used here. The null hypothesis in both the LLC and IPS tests is that the series is I(1).
Table 1 presents the results of these tests that can be performed using an intercept and trend variable or an intercept only. The IPS panel test fails to reject a unit root for each variable. Based on these unit root test results, using the growth rates of
grant,
revenue,
gdp, and
fte is deemed appropriate.
6. Results
The system of Equations (1)–(4) was estimated using least squares with a corrected covariance matrix for heteroskedasticity within each province. Serial correlation was not found in any of the provinces in any of the equations. Fixed effects were initially used to account for any time-invariant differences across the provinces; however, the statistical significance of the fixed effects was found only for (3), likely due to the variables being measured in growth rates rather than in levels. Therefore, fixed effects were omitted from Equations (1) and (2). Cross-sectional dependence occurs when the errors across the provinces are correlated in one of the equations. This can occur when all provinces experience the same shock to an unobserved variable. In the case of higher education, innovations to types of programs and how education was delivered since 1992 could be a common shock. Ignoring cross-sectional dependence can result in unreliable estimates and even inconsistent estimators. If the number of correlated cross-section units is small, the problem can be minimal (
Chudik and Pesaran 2015). Cross-sectional dependence could not be rejected for Equations (1)–(4) using the Pesaran CD test, which is appropriate when the number of cross-sections is less than the number of time periods. As a result, a panel SUR model was estimated for each equation that utilizes the variance–covariance matrix of errors in a two-step estimation. The panel size is
N = 260 observations due to the one-period-lagged gdp variable. Including additional lags of gdp did not offer any improvements in the estimated results. The regression results appear in
Table 2 below.
We focus on the statistically significant regression coefficients in
Table 2. The results for (1) suggest a strong positive association between growth in provincial government revenue and GDP growth (both real per capita), which is not surprising as a significant portion of revenue is collected from taxes for all provinces. The elasticity is 0.843 evaluated at the means, suggesting an inelastic response; however, not all revenues are related to GDP (government businesses, resource revenues, etc.). Jumping to the results for (3), the coefficient of −0.102 (elasticity = −0.193) suggests a small, countercyclical effect on enrolment growth that agrees with the results found in previous research. Equation (2) is the most relevant for our study. The growth in the real total provincial government operating grant is positively associated with growth in real total revenue per capita when FTE growth is held constant. The elasticity value is 0.115, suggesting a very inelastic response—governments have other spending priorities than higher education, such as health care, social services, and infrastructure. Holding revenue growth constant, the growth in the total operating grant positively responds to growth in FTEs with a coefficient of 0.204 (elasticity = 0.329). Governments service an increasing number of students when revenue is not growing with a larger operating grant, but not by the amount necessary to maintain a constant operating grant per FTE. The growth in the total operating grant increases significantly during an election year and in the year following, an amount equal to approximately 1.5% in each case. This is positive evidence of an election cycle in Canada’s provinces with regards to higher education spending. However, there is no evidence of a partisan cycle in higher education spending due to the statistical insignificance of the power coefficient.
Equation (4) suggests a significant inelastic response of the real growth in the operating grant to real per capita GDP growth, with a total value of 0.283 (elasticity = 0.347) using the one and two-period-lagged coefficients.
The appropriateness of estimating (4) is evaluated by testing the four restrictions suggested by Equations (1)–(3). Each was tested individually using a Wald test after estimating Equations (1)–(3) as a system of equations using fixed effects in Equation (3). None of the restrictions were rejected at 95% confidence.
The second restriction reveals the two competing effects of current real GDP growth on the total operating grant: a statistically insignificant procyclical effect on government revenue in the term (−0.011) and a statistically significant countercyclical effect on FTEs in the term (−0.021). The third restriction considers the effect of one-period-lagged real GDP growth. The first two terms are the procyclical effect (0.051), and the last term is the statistically insignificant countercyclical effect (0.0002). The immediate effect of positive real GDP growth on the total operating grant is dominated by the negative effect on FTEs, resulting in the statistically insignificant effect estimated in Equation (4). The procyclical effect dominates with one and two-year lags, confirmed by the statistically significant positive coefficients (0.171 and 0.113) in Equation (4).
Humphreys (
2000) noted that there could be an asymmetric response between the real total operating grant and the real state of the economy and found that the elasticity was larger in an economic recession than in an economic expansion, perhaps suggesting that governments are more willing to sacrifice higher education funding to maintain other funding priorities in a recession. We test this assertion by using the same methodology with two dummy variables.
Our conjecture is that an asymmetry should only be observed in (2); hence, each independent variable in (2) is broken into two interaction variables, e.g.,
. The results are summarized as Equation (5) in
Table 2. The revenue interaction coefficients suggest that the growth rate of the real operating grant is positively associated with upturns in the business cycle only after a one-year lag and negatively associated with a current recession but not after a one-year lag. The decrease in the growth of the operating grant in an immediate recession is larger than the increase in an economic recovery, resulting in several years before the growth in the operating grant returns to its original rate. The FTE interaction coefficients are both positive and statistically significant, but larger in a recession due to the countercyclical behavior of enrolments. Provincial governments meet the countercyclical behavior of FTE growth by increasing the growth in the operating grant, even with no growth in revenue. The restriction that the sum of the coefficients for revenue during an expansion equaled the those for a recession could not be rejected using a Wald test (
p = 0.730).
Provincial government operating grants follow an upward growth path with increases above trend in a recession and smaller increases in an economic expansion. The immediate countercyclical effect of enrolments serves to smooth the lagged procyclical government response to the operating grant. Swings in the operating grant because of procyclical changes in revenues are muted since provincial governments need to service the countercyclical changes in student demand. Some provincial governments use a funding formula to do this, but others, including Alberta and British Columbia, react with a discretionary policy.
7. Discussion and Results
The results in this paper suggest that the real growth in the total provincial operating grant to universities is positively associated with real growth per capita in provincial revenue after a one-year lag, holding growth in FTEs constant. The immediate change in the growth of the operating grant is driven by a countercyclical growth in FTEs. Provinces will fund according to FTE growth to service higher demand but will not increase the real growth in the operating grant beyond that by much; hence, the principal cyclical driver of operating grants is FTEs, not the growth in government revenue. We found that the cyclical effects on FTE funding and discretionary funding approximately cancel out over the business cycle, resulting in a consistent growth path for the total operating grant holding the political business cycle constant.
The results suggest that real operating grants increase significantly the year of a provincial election and the year following. Provincial elections typically occur every four years and universities can expect a modest increase in their real operating grant with the political business cycle. This result is independent of the political ideology of the ruling party as we found that the power variable had no statistical significance. That is somewhat surprising as the Canadian media and university administrations often associate austere operating grants with conservative right-wing governments. The political business cycle is not strongly associated with the economic business cycle; hence, the increase in funding during an election and shortly after to universities, while welcome by university administrators, does not serve to smooth operating grants. It is not clear if voters respond to bump ups in operating grants and the return to a political party’s chances of victory could be minimal. The cost is an increase in the volatility of operating grants over the business cycle that can outlive governments. These increases could be better allocated by using them to smooth decreases in funding during recessions.
Canadian universities can increase the growth in their operating grants by increasing their size measured in the number of FTE students. This could make sense when we recognize that most of the operating grant is used to pay faculty and staff wages and benefits whose numbers are largely determined by the number of students. New buildings, large equipment, and new programs are largely financed outside of the operating grant through special allocations that could be tied to the business cycle, although we leave that question for future research.


