1. Introduction
Household decisions about the type of cooking fuel to use have important economic and environmental implications. At the household level, cooking fuel use is influenced by the availability of specific appliance types, the availability of supporting fuel, and the household utility associated with the various options. In addition to availability considerations, households are likely to choose a cooking option that is considered affordable or has a price in line with their budget allocations. In sub-Saharan African nations, the main fuel sources for cooking are firewood and charcoal, with charcoal dominating in urban areas (
D’Agostino et al. 2015;
Rose et al. 2022).
Nzabona et al. (
2021) reported that almost 80% of the households in Kampala, Uganda’s capital, used charcoal for cooking. Households prefer charcoal for cooking, as it is often a cheaper and more dependable energy source than alternative options such as electricity, liquefied natural gas (LNG), and kerosene (
Aarakit et al. 2021;
D’Agostino et al. 2015;
Doggart et al. 2020).
The “Walk-to-Work” protests in Uganda in 2011 were, at least in part, due to sharp increases in fuel and food prices (
Mutyaba 2022). During this time, charcoal prices increased sharply. A common belief is that the increases in charcoal prices were and still are linked to the rise in diesel fuel prices. However, there are other factors that could also influence charcoal prices. Assessing which of these factors, if any, and to what extent they impact the retail price are important for understanding the price formation process and for the design of any policy interventions.
The motivation for this paper is the claim that increasing diesel fuel costs are driving increases in retail charcoal prices. Generally, the prices of goods traded in markets are affected by both demand- and supply-side factors, including transportation costs. Therefore, an increase in the retail price of charcoal could be attributed to increased transportation costs as a result of either increased fuel costs or increased transportation distances due to deforestation and/or land-use conversions. Prices along spatially distributed supply chains are expected to obey a weak law of one price (
Fackler and Goodwin 2001;
Huffaker et al. 2021), where price differences reflect transportation and transaction costs and market conditions (
Acosta et al. 2021).
This article assesses the relationship between charcoal prices and fuel prices to determine whether fuel prices influence the retail price of charcoal. The availability of suitable data for the empirical analysis of price transmission and market integration is generally a challenge (
Barrett 1996;
von Cramon-Taubadel 2017). Using monthly price data for the period from July 2010 to January 2021 for charcoal at different locations along the supply chain, we empirically test whether there are long-term and/or short-term relationships between charcoal prices and the prices of diesel and other fuel types using an error-correction model.
This paper continues with a review of the literature in
Section 2.
Section 3 first describes the charcoal supply chain in Uganda and then presents a theoretical land-rent model for the price of charcoal in a central market. The data, data sources, and autoregressive distributed lag (ARDL) model are described in
Section 4. The results are presented and discussed in
Section 5, and
Section 6 concludes this paper.
2. Literature Review
The published literature on charcoal, or, more broadly, woodfuel, has focused on three areas: (i) the environmental impact and sustainability of production (
Chidumayo and Gumbo 2013;
Mensah et al. 2022), (ii) the livelihood and poverty of producers (
Brobbey et al. 2019;
Khundi et al. 2011), and (iii) the usage of charcoal, including poverty and health issues, and households’ choice of fuel, or type of energy, especially for cooking (
D’Agostino et al. 2015;
Doggart et al. 2020;
Nzabona et al. 2021;
Poblete-Cazenave and Pachauri 2018).
Arnold et al. (
2006) provided a broad overview of the literature on the woodfuel situation in developing countries.
Rose et al. (
2022) analyzed the current demand for charcoal in sub-Saharan Africa, and their forecasts indicated that strong urban growth will maintain charcoal use at high levels for decades.
Mensah et al. (
2022) reviewed charcoal production in the same area and raised concerns about how an informal sector based on small-scale production using inefficient technologies can meet the increasing demand for charcoal.
The literature on charcoal production, consumption, and prices is predominantly descriptive and often not based on formal empirical analysis. A recent comprehensive review of the published literature on charcoal in Tanzania by
Nyamoga and Solberg (
2019) was instructive. The authors identified 42 studies that deal with the production and consumption of charcoal; however, only six of these studies included statistical analyzes. Of these six studies, only four stated an explicit behavioral model for producers or consumers. Three of these studies investigated the determinants of charcoal consumption (
D’Agostino et al. 2015;
Hosier and Kipondya 1993;
Nyamoga et al. 2022), whereas
Monela et al. (
2007) investigated the socioeconomic factors that influence charcoal production decisions. However, none of these studies investigated market integration or price transmission along the supply chain.
Agbugba and Obi (
2013) collected prices on a daily basis for a single month from charcoal producers, wholesale agents, and retailers in the Abia State of Nigeria. Granger causality tests showed that there is a positive influence of the producer’s price on the wholesale price but not the other way around. Furthermore, there is a bilateral relationship between wholesale and retail prices.
Using survey data obtained from charcoal producing households in the Amhara region of Ethiopia,
Worku et al. (
2021) estimated a linear regression model with the market supply of charcoal as the dependent variable, and household characteristics, the distance to the market, and the price paid to producers as the explanatory variables. They found a positive relationship between the quantity supplied and the price but no relationship between the quantity and the distance to the market. The relationship between the price and distance to the market was not analyzed.
In contrast to
Worku et al. (
2021),
Hofstad and Sankhayan (
1999) and
Sankhayan and Hofstad (
2000), informed by economic theory, used regression models with local charcoal prices as the dependent variable and the linear distance to the central marketplace as the single regressor. They found a clear negative relationship between the distance to the market and the price of charcoal in both Tanzania and Uganda.
5. Results and Discussion
The estimated parameters for the error-correction model parameterization of the ARDL model are reported in
Table 5. Schwartz’s Bayes Information Criteria (BIC) were used to select the lag lengths in the model, resulting in an ARDL(4,0,1,0,0) model. The BIC tend to favor a more parsimonious model specification compared to the AIC, thus reducing the risk of overfitting.
The statistics for the ARDL bounds test are reported in
Table 6. Both the F-test and the t-test are statistically significant at the 5% level, and we conclude that the price variables are cointegrated. The model specification is dynamically complete, as the Breusch–Godfrey LM-tests failed to reject the null hypothesis of no serial correlation for all lags from one to four. The Breusch–Pagan LM-test for heteroskedasticity rejected the null hypothesis of homoskedasticity. Thus, the estimated standard errors reported in
Table 5 are not correct, and care should be taken when drawing inferences.
The estimated error-correction parameter is statistically significant and negative. In the long-run part of the error-correction model, the trend is positive and statistically significant. The parameters of the price of kerosene and the charcoal supply price are both positive and significant. The estimated parameters for the prices of diesel and firewood are clearly not statistically significant.
Table 5 also includes the parameter estimates for the reduced ARDL model, where the diesel and firewood price variables are excluded. The parameter estimates are close to those for the full model specification. Only the parameter for the kerosene price changes noticeably, and now it has a much smaller standard error. The ARDL bounds test indicates that the price variables are cointegrated, and the Breusch–Godfrey LM-tests indicate that the model is dynamically complete. However, the residuals are still heteroskedastic.
The estimated error-correction coefficient is −0.33 for the full model and −0.35 for the reduced model. Thus, about a third of the deviation from the long-run equilibrium price is corrected for between months. The short-run model for both the full and the reduced specifications includes three autoregressive terms, indicating that a short-term dynamic adjustment process is taking place for the market price of charcoal.
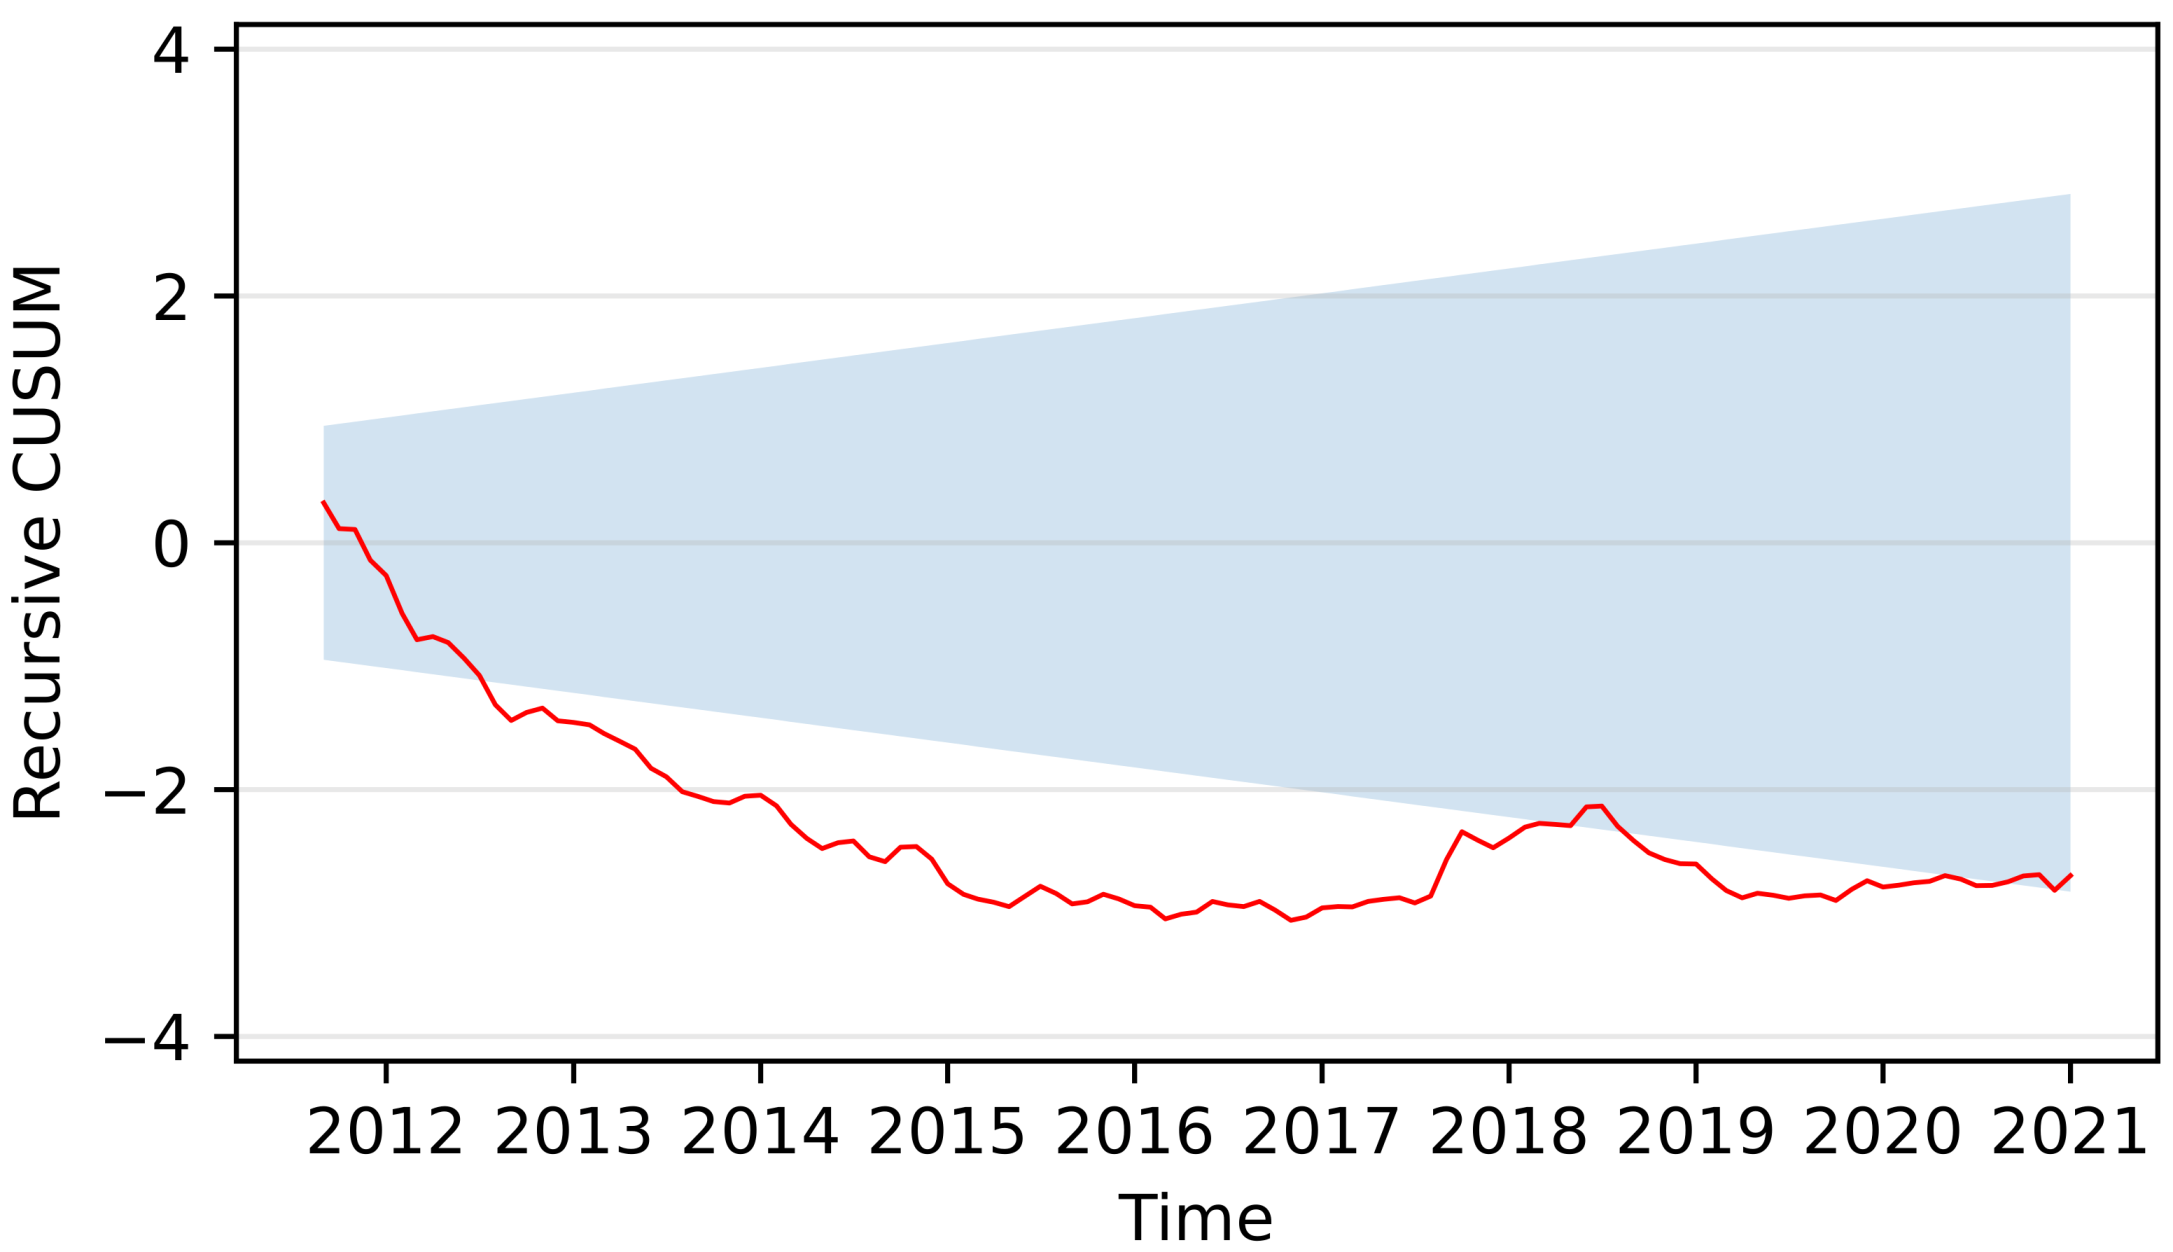
Charcoal prices in Kampala increased by more than 55% between June and September 2011. This transition was not smooth, marked by a large increase in July (+35%), a decrease in August (−22%), and a final increase in September (+45%). This large and concentrated price volatility could influence, in particular, the dynamics of the short-run model, contribute to the heteroskedasticity of the residuals, and potentially result in unstable parameter estimates. The cumulative sum of the recursive residuals (CUSUM) test for parameter stability in the reduced model yielded a value of 1.63, as shown in
Table 5, which is higher than the critical value of 1.14 at the 1% significance level.
Figure 5 shows a graph of the recursive CUSUM along with a 95% confidence band.
The results of the CUSUM test provide evidence of structural breaks in one or more of the price series. Using a sample period starting after the sharp increase in prices between July and September 2011,
Table 7 shows the results of the ADF and KPSS tests, where the lag lengths in the tests were selected by minimizing the AIC. The results remain unchanged from those for the longer period, with charcoal, diesel, and kerosene prices as the
variables and firewood and charcoal supply prices as the
variables.
We estimated both the full and reduced error-correction models using observations from September 2011 onward and the BIC to select the lag length results for the ARDL(1,0,0,0,0) and ARDL(1,0,0) specifications, respectively, and the results are reported in
Table 8. The results of the ARDL bounds tests (
Table 9) are inconclusive with respect to cointegration in the full model specification. The reduced model specification exhibits cointegration between the retail and supply prices for charcoal and kerosene prices. The models are dynamically complete with homoskedastic errors. The models do not include any autoregressive terms. The three autoregressive terms included in the models in
Table 5 were probably related to the three months with high price volatility in 2011.
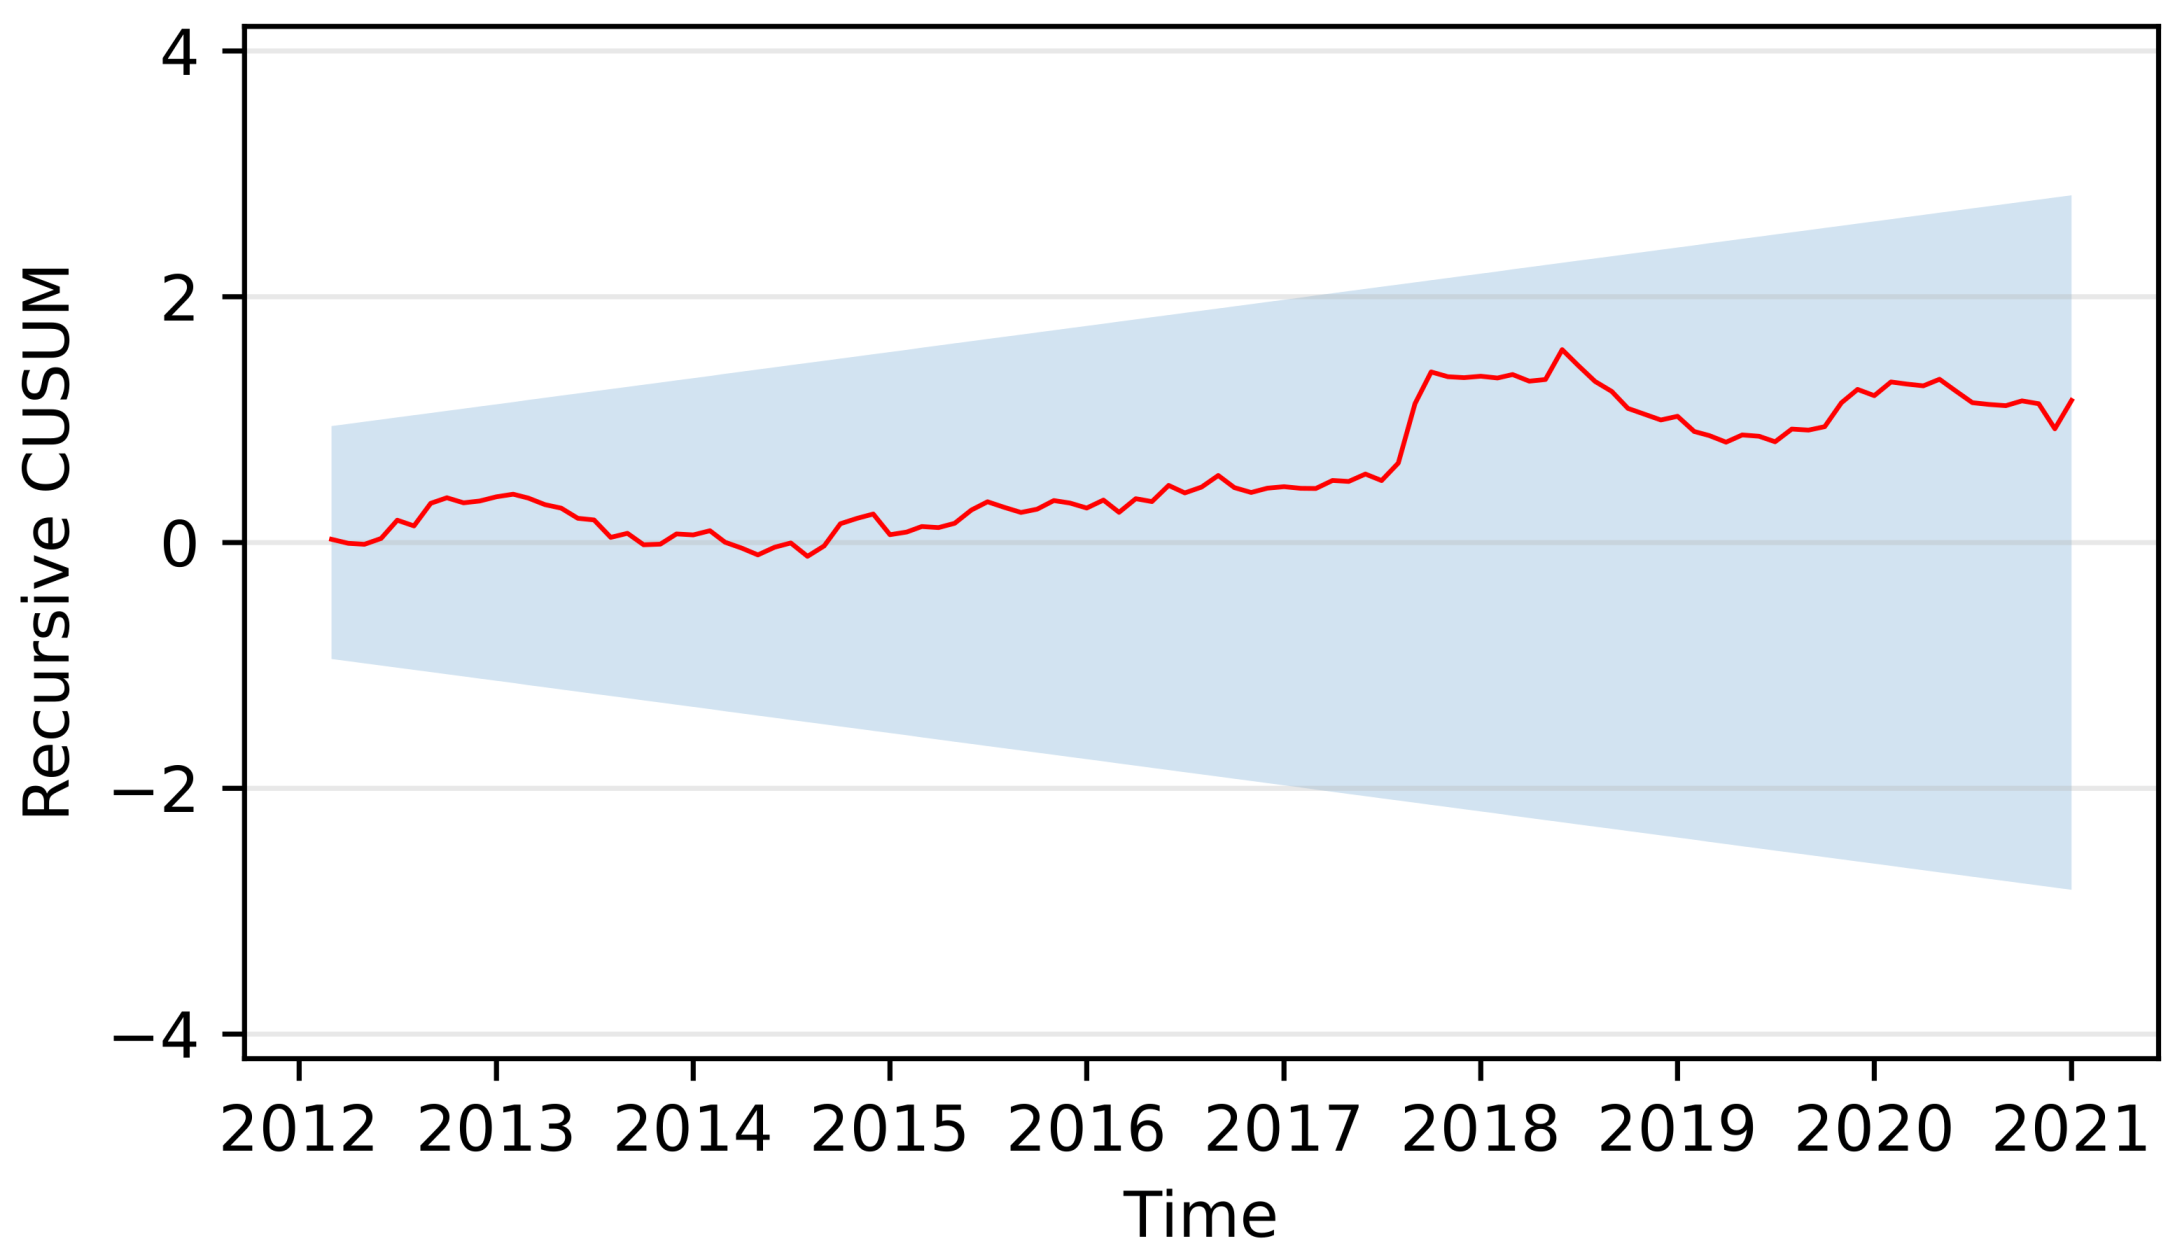
The recursive CUSUM test for the reduced model yielded a value of 0.648, which is less than the 10% critical value of 0.850. The plot of the recursive CUSUM along with a 95% confidence band is shown in
Figure 6. Thus, the parameters remained stable during this shorter sample period.
In the period after the sharp increase in nominal and real prices in 2011, our econometric analysis shows that the retail and supply prices of charcoal and the prices of kerosene are co-integrated, i.e., there exists a long-term relationship between these prices. The long-term link between prices along a supply chain from source to retail is expected, as these prices adjust to reflect changing supply and demand conditions. There are no statistically significant autoregressive or distributed lag terms in the estimated model, reflecting a lack of short-term dynamics in the retail price beyond the long-term equilibrium correction. This implies that it is not possible to test for Granger causality in this model (
Enders 2014).
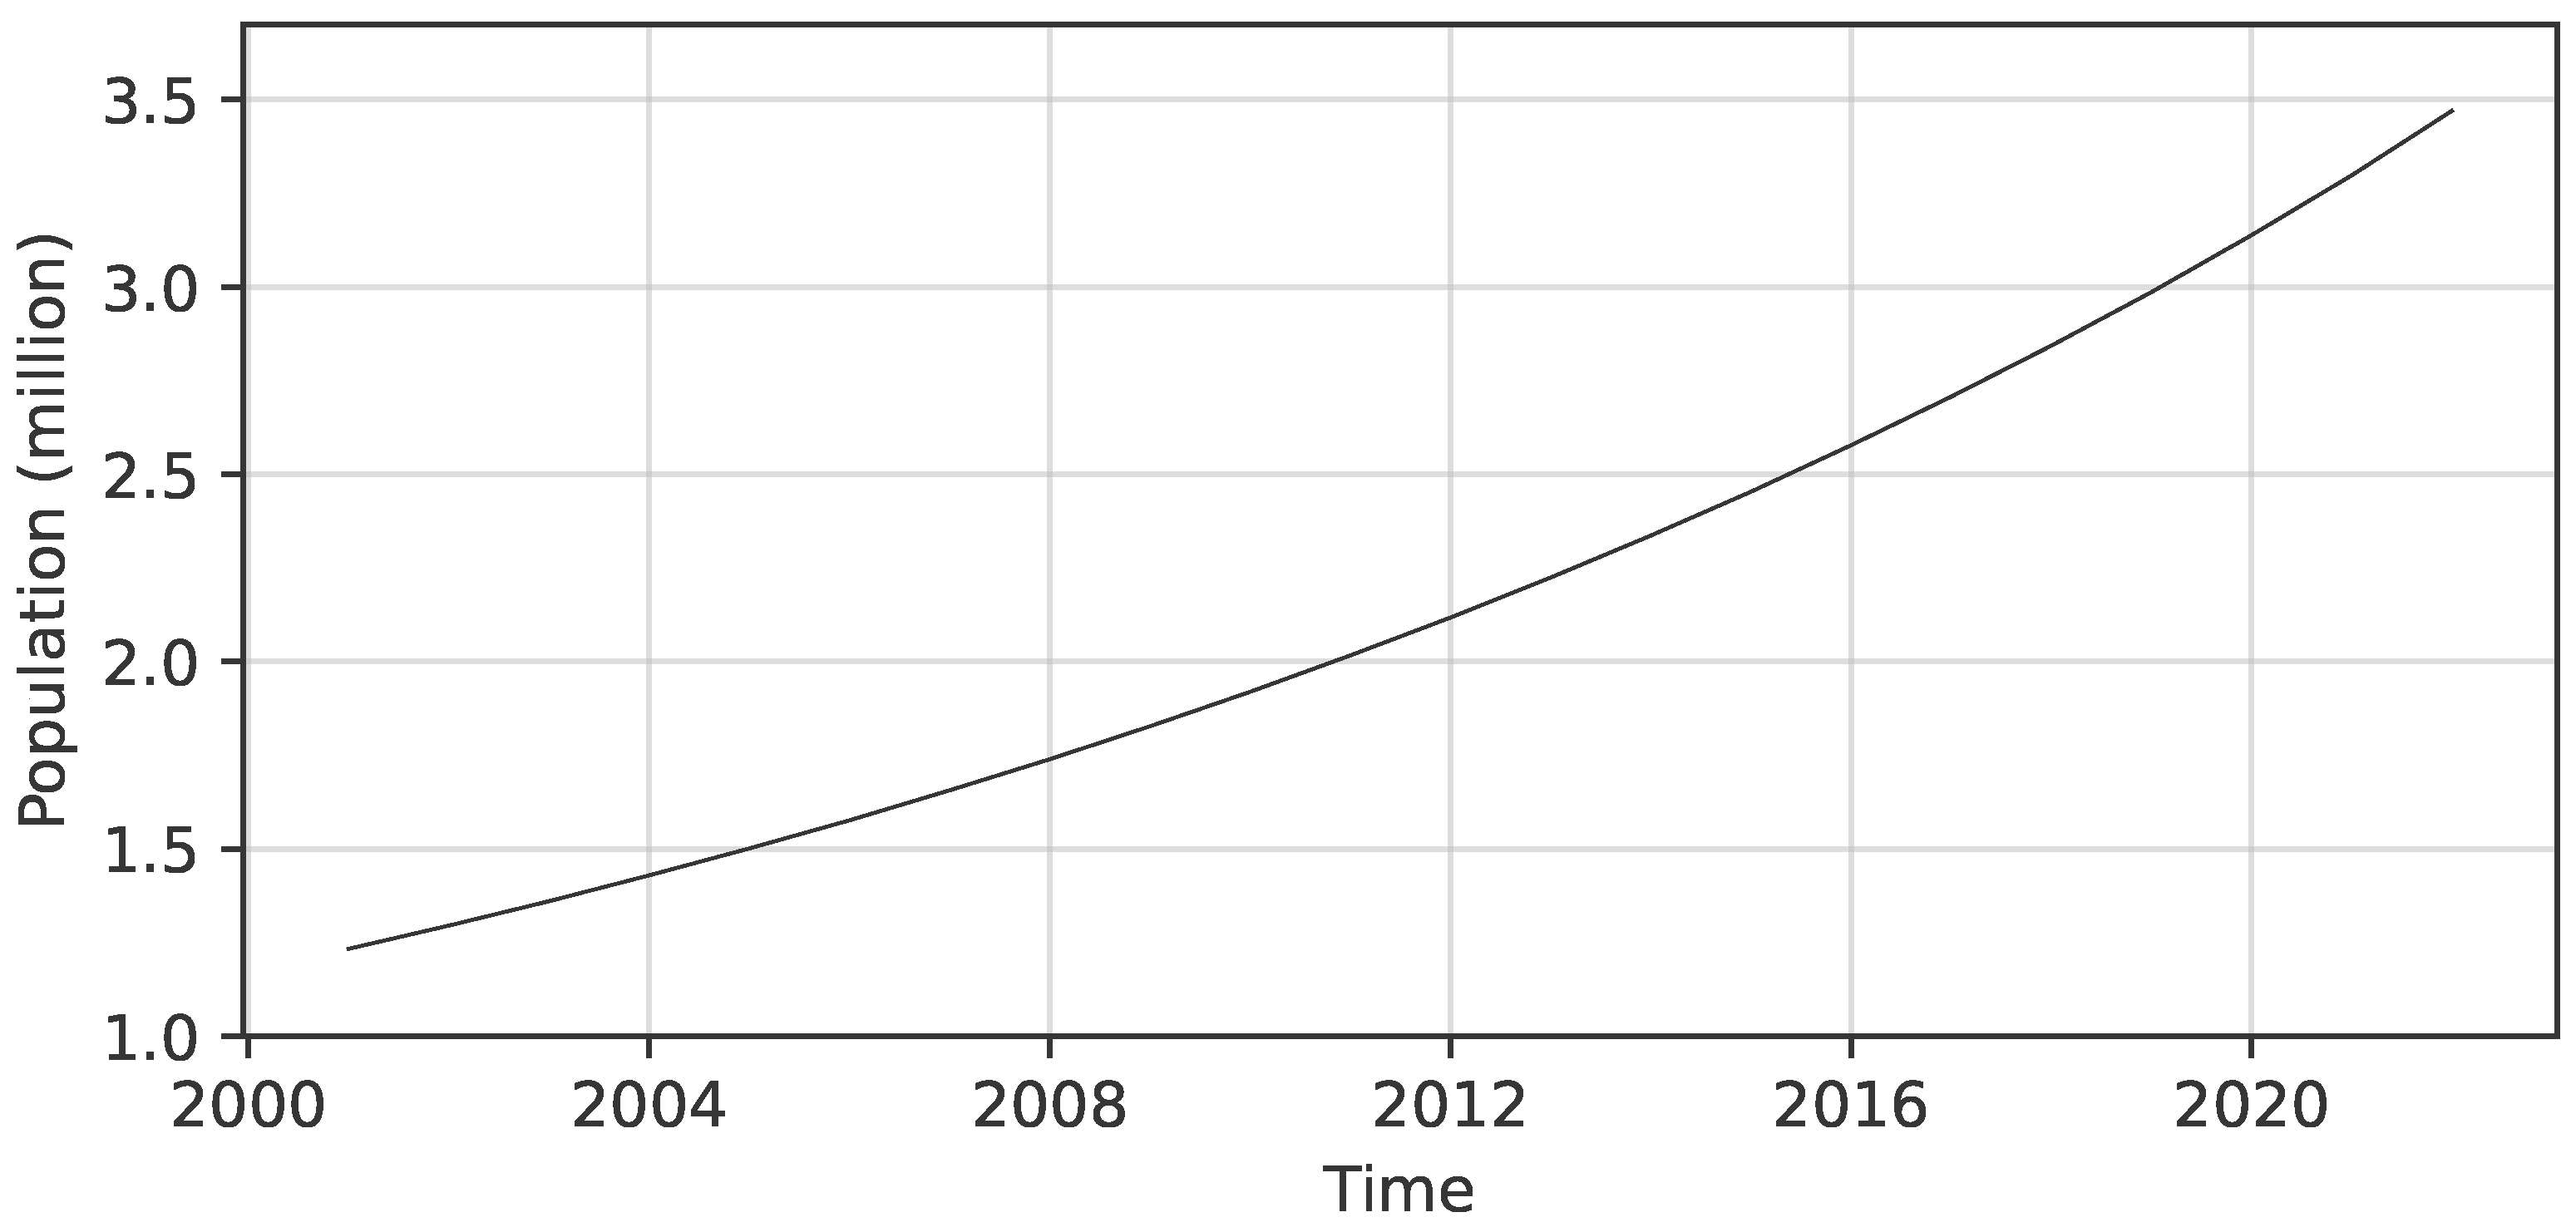
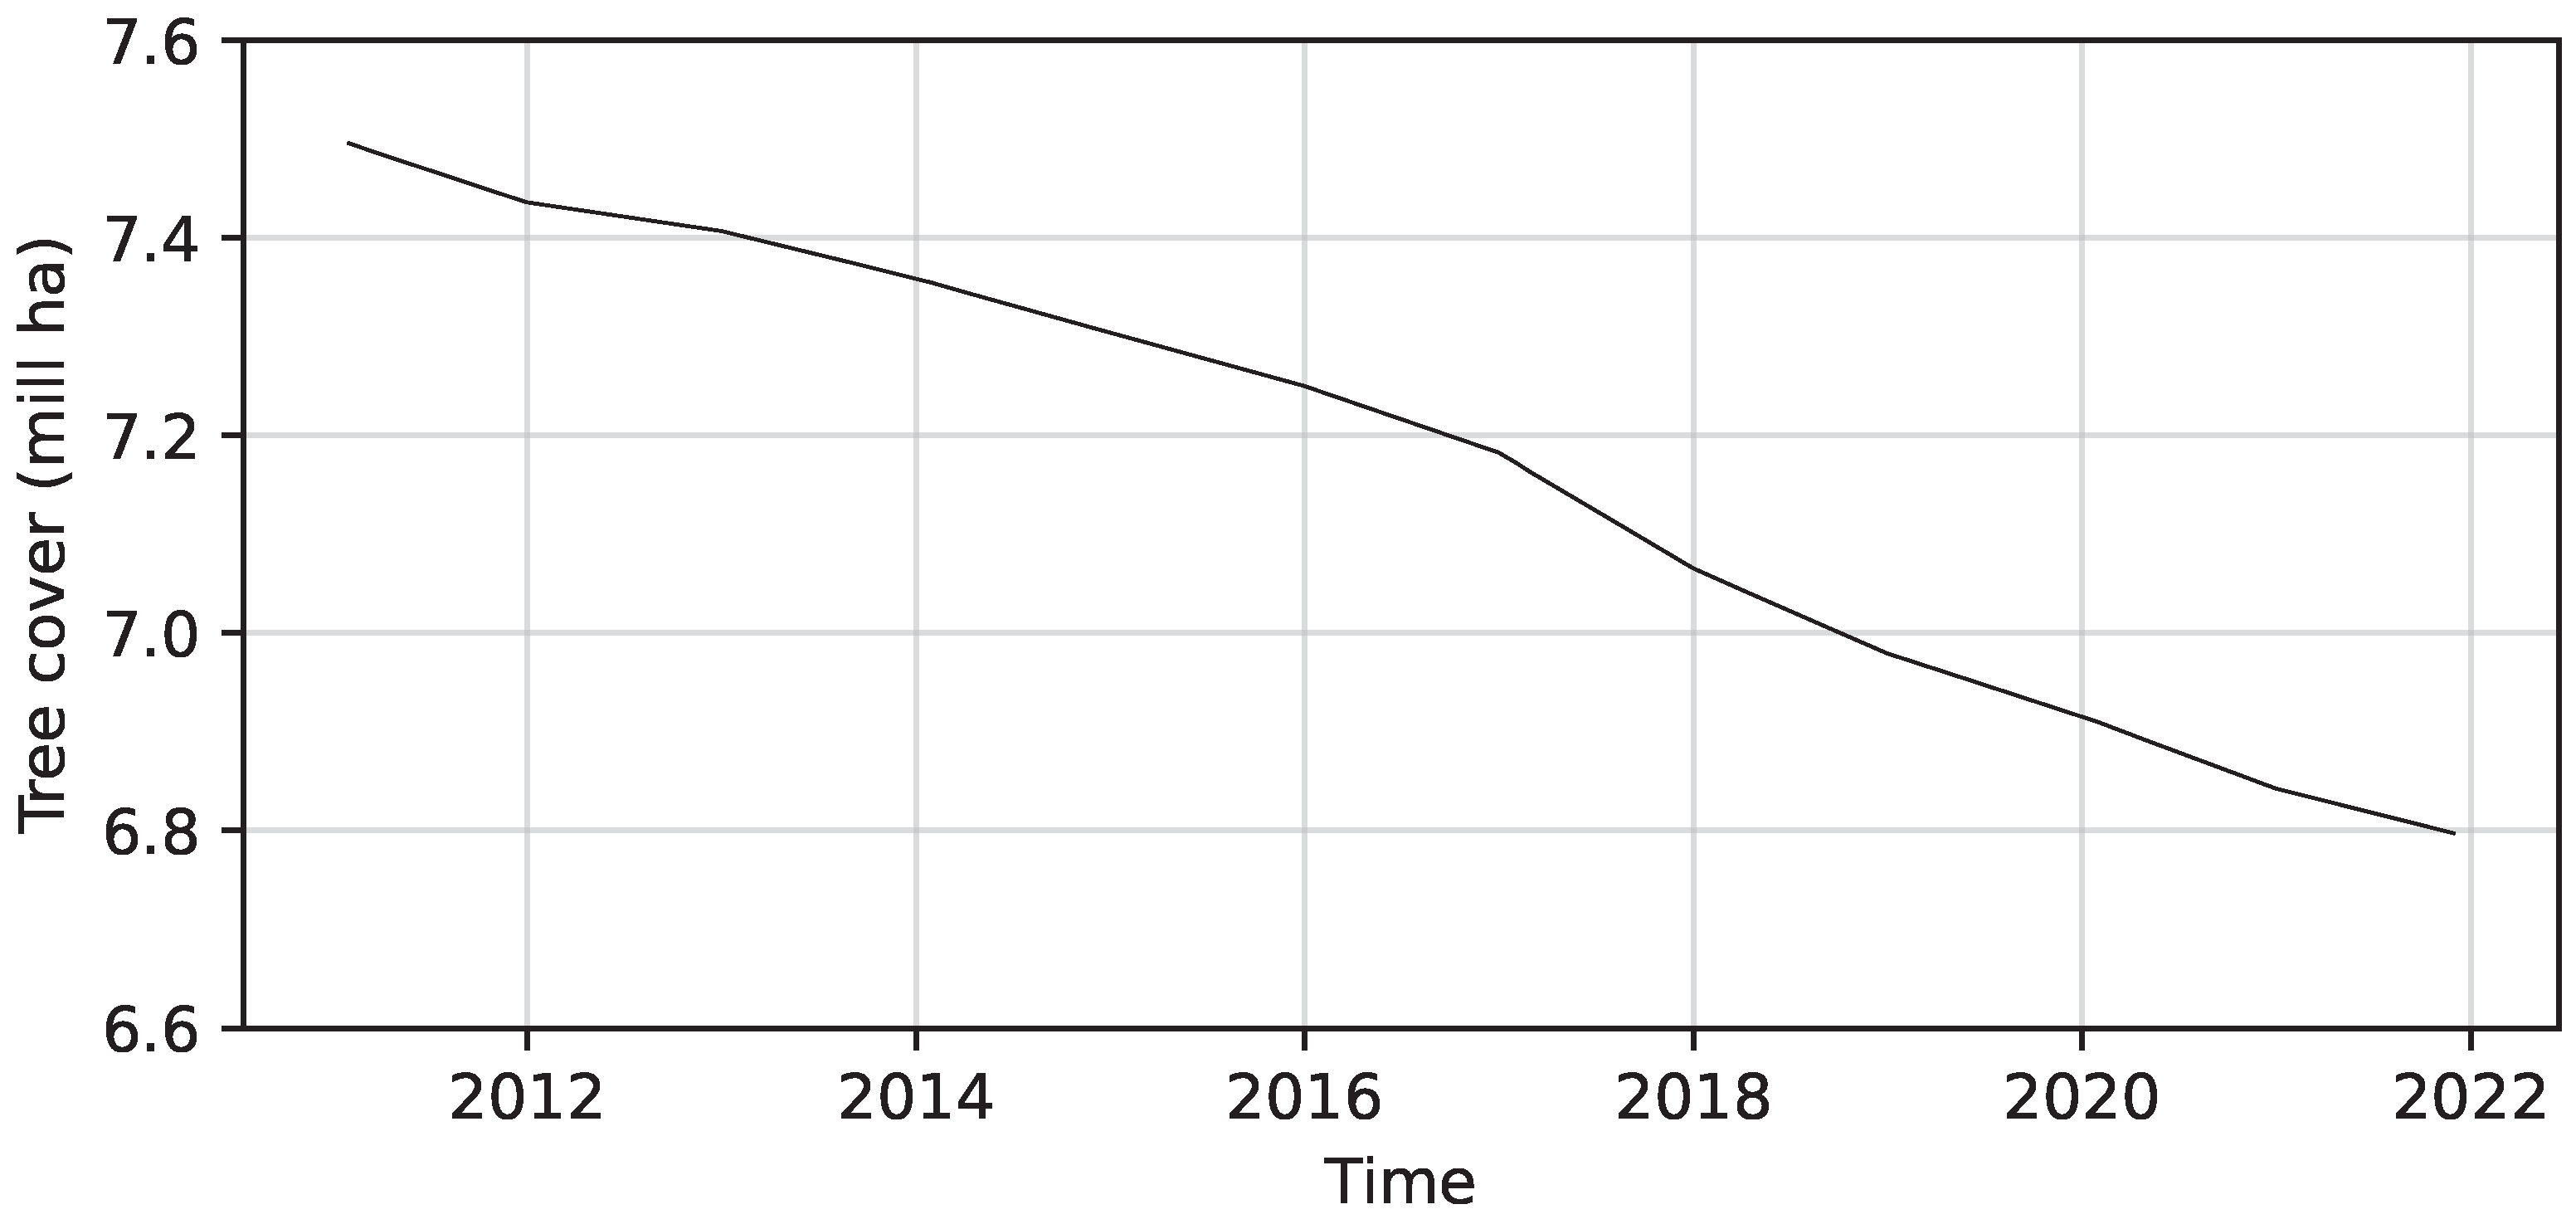
The trend variable has a statistically significant positive parameter value. Increasing demand from a growing urban population and reduced supply from deforestation are trends that are expected to increase the equilibrium price of charcoal, which we observed.
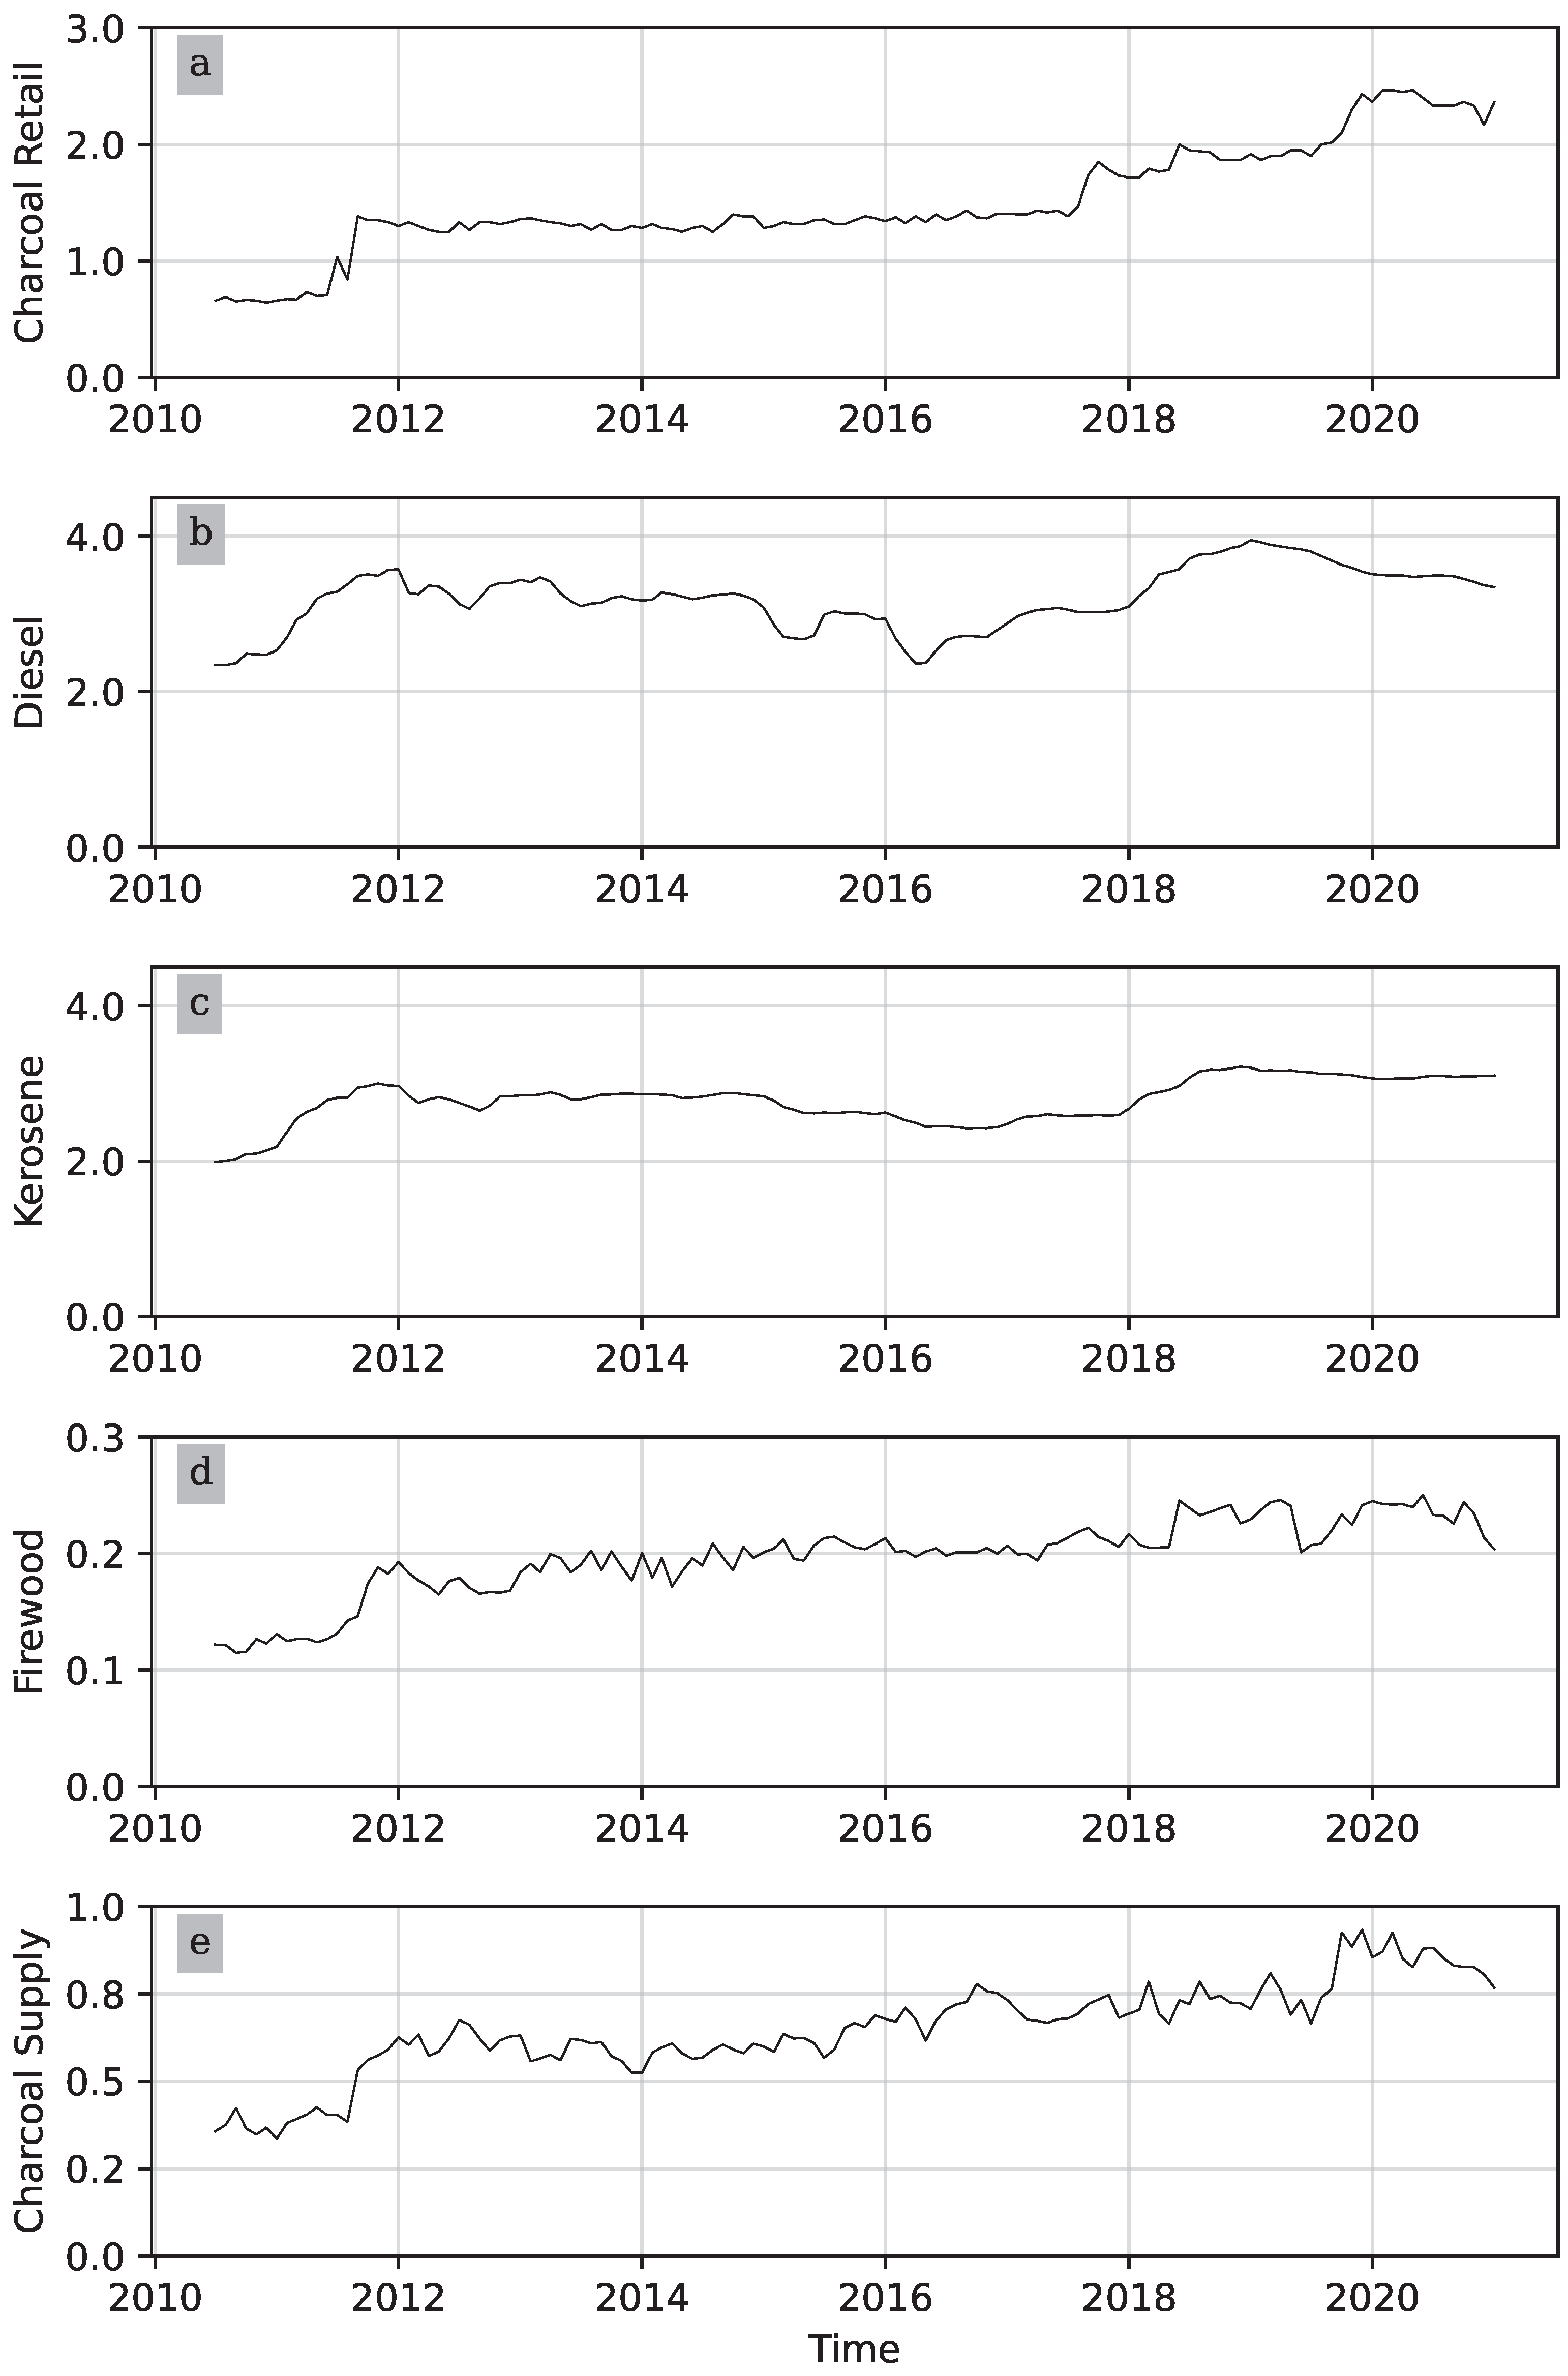
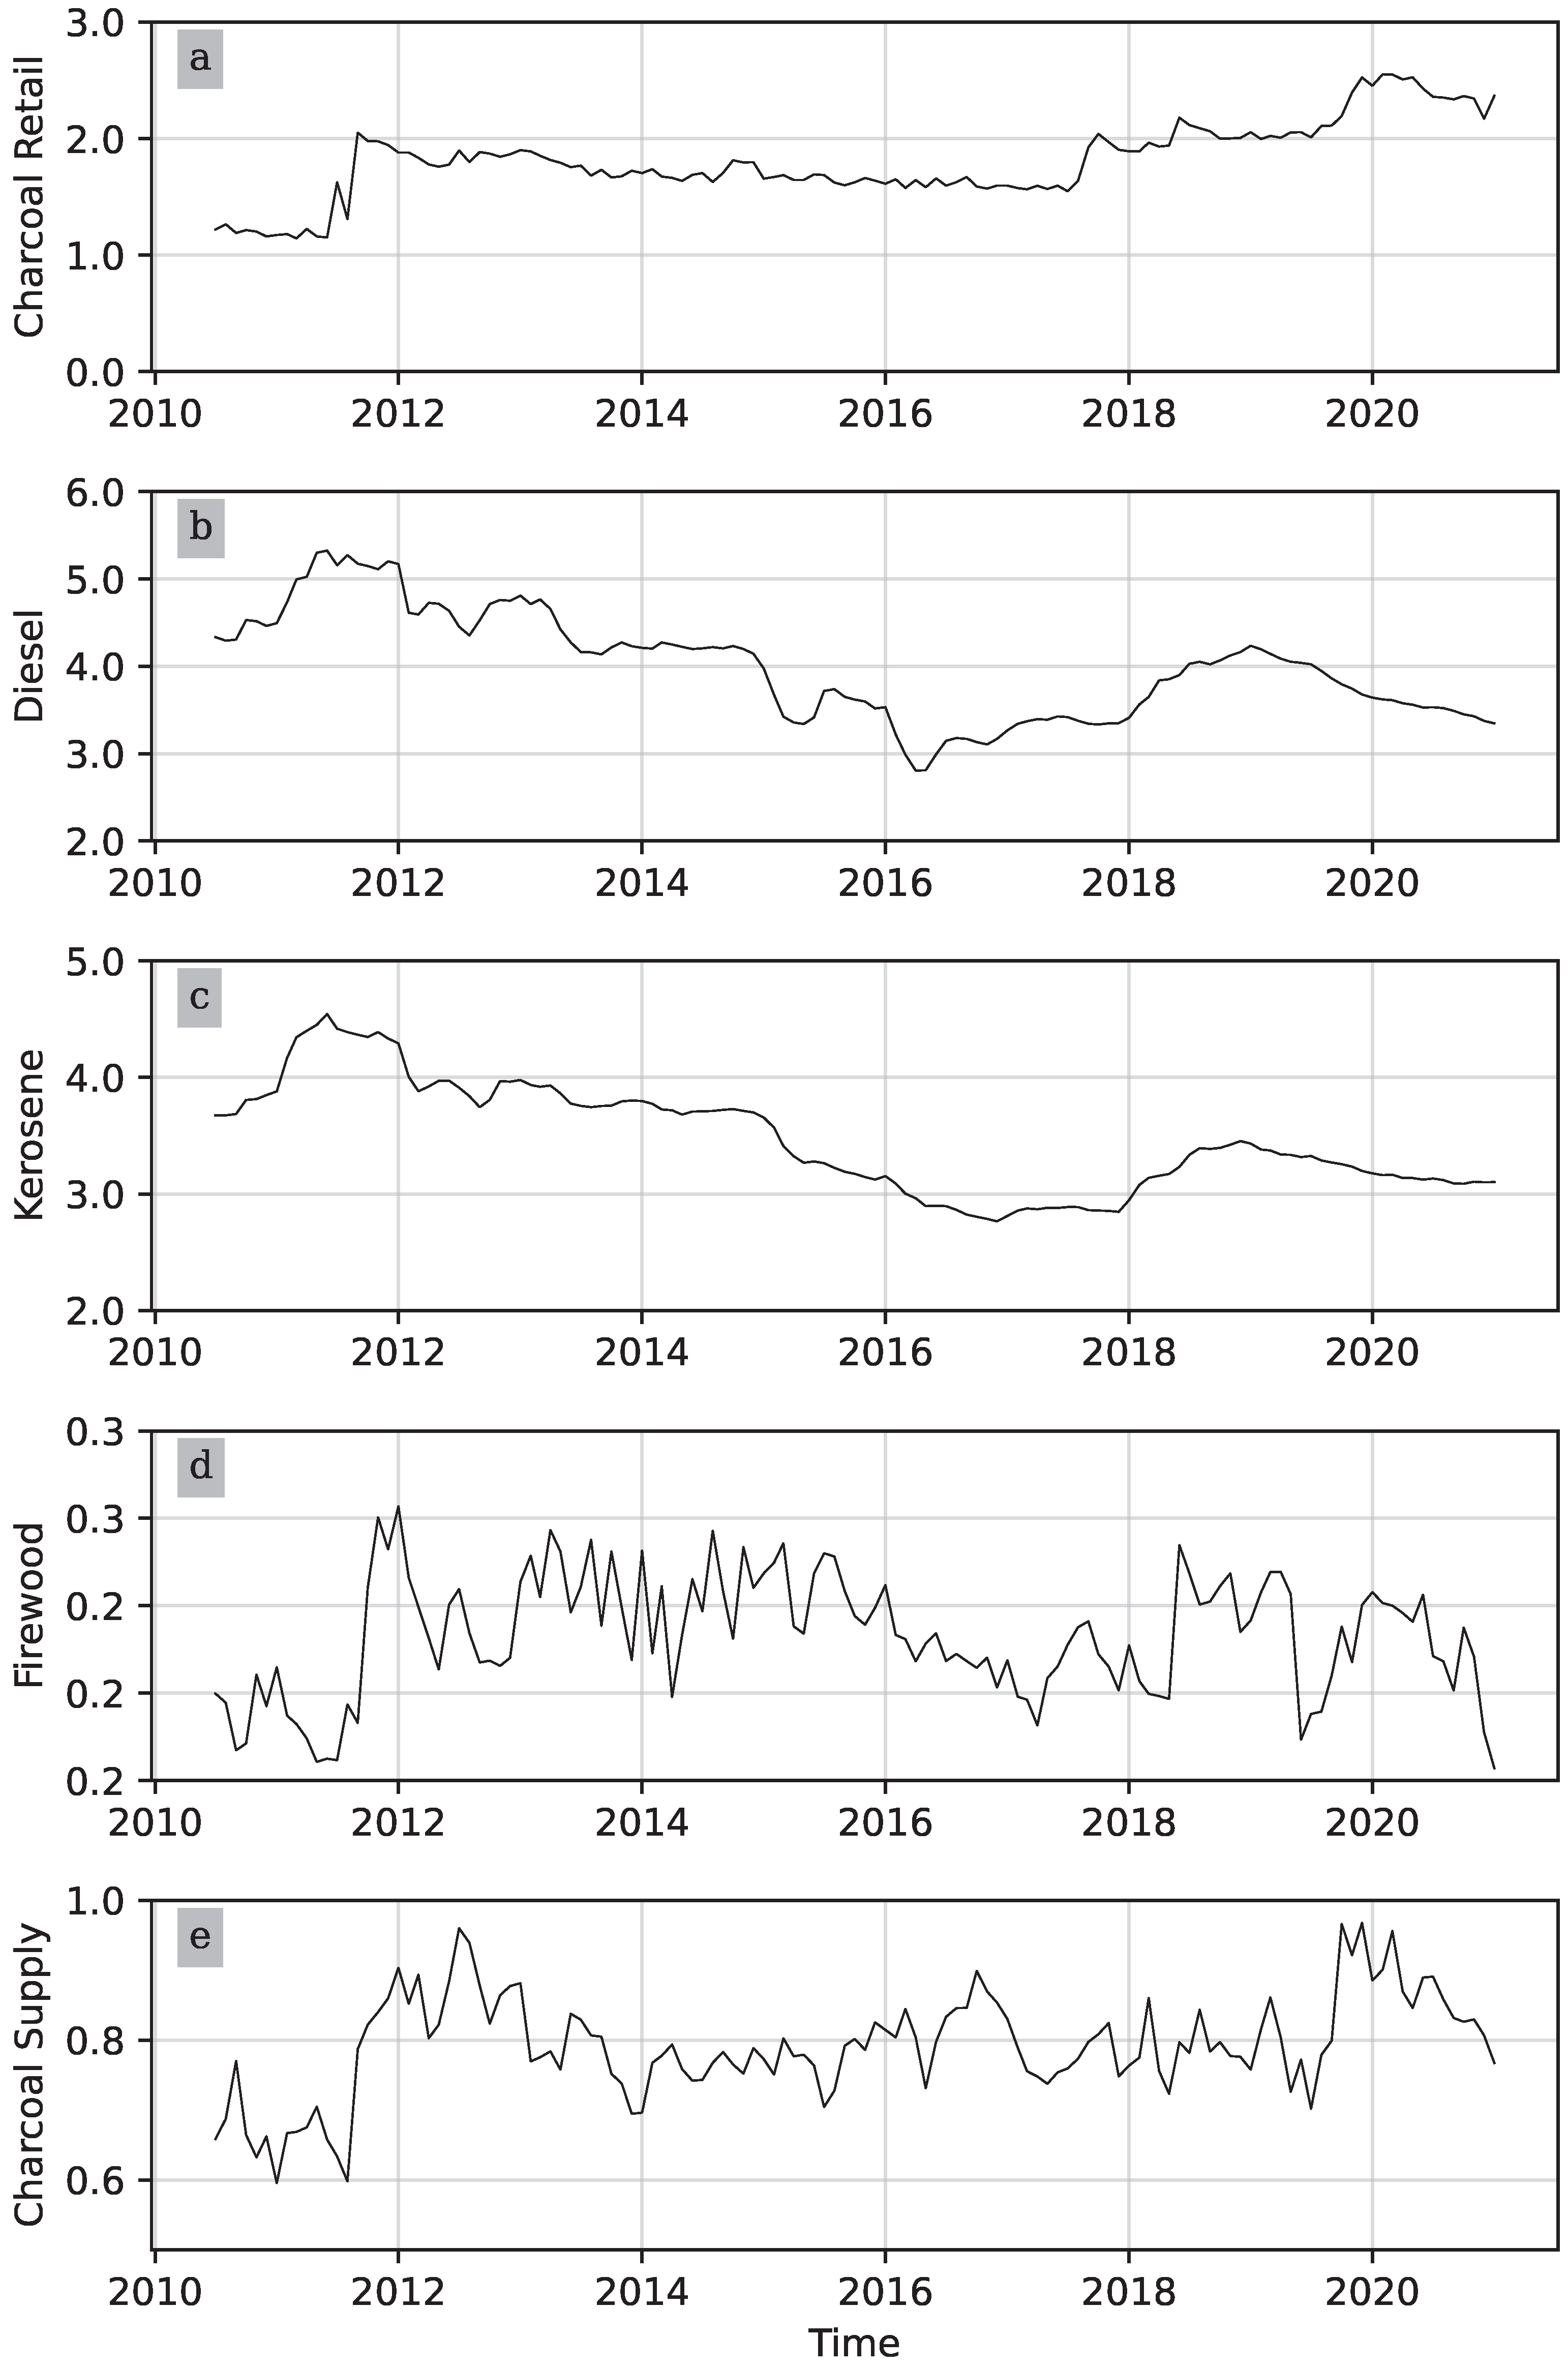
The simple correlation between the retail price of charcoal and the price of kerosene (and diesel) is negative (
Table 3), which can be seen in
Figure 4. However, the results of the ARDL model show a positive long-term relationship between the retail prices of charcoal and kerosene. The price of kerosene, which is an imported petrol product, reflects world market conditions. An increase in the kerosene price could see households substituting kerosene for charcoal, thus increasing the demand and the equilibrium price for charcoal. The absence of a short-term link between kerosene and charcoal prices suggests that there is limited short-term substitution between charcoal and kerosene. This result is consistent with the short-term lock-in effects related to household investments required in new cookstove equipment required to change cooking fuel types.
6. Conclusions
Charcoal is the dominant energy source in urban areas in Uganda, as is the case in many countries in sub-Saharan Africa. The Walk-to-Work protests in 2011 came at a time of high inflation and sharply increasing prices for charcoal and petroleum products. Retail prices are expected to reflect prices, costs, and market conditions along the supply chain. In functioning markets, these prices tend to be in long-term equilibrium. We used monthly price data to test for cointegration in an error-correction model. As the price data were integrated of order zero and one, the ARDL bounds test was used. We found that there was a long-term relationship between the retail price of charcoal and the supply prices of charcoal and kerosene (which is a substitute energy source for end users). Firewood and diesel prices were not statistically significant in the model. The long-term equation exhibited a positive trend, indicating that the retail price of charcoal increased more over time than implied by the supply price of charcoal and the price of kerosene. The specific reasons for this increase in retail prices were not possible to determine with the available data.
Our analysis showed that prices along the supply chain tended to be in long-term equilibrium. Therefore, policies that affect the supply and/or demand sides of charcoal will have ripple effects throughout the chain. The different possible causes of the positive time trend in our model have different policy implications. As discussed by
Rose et al. (
2022) and
Mensah et al. (
2022), the continued growth of urban populations will keep the demand for charcoal high and put further pressure on the supply chain. Improved forest management and replanting are important to maintain supply volume. However, as argued by
Mensah et al. (
2022), there is room for technical improvements in the small-scale production of charcoal.
Another possible reason for the upward trend in charcoal prices could be an increase in transportation costs as a result of increased transportation time, with everything else held constant. Kampala, like many other African cities, experiences severe traffic congestion, leading to long delays. The lockdown and traffic restrictions imposed during the COVID-19 pandemic may serve as a natural experiment to test the effect of traffic congestion on charcoal prices.
With only price data available, we were limited in our analysis of spatial equilibria and price patterns. Additional price data, for example, from sources similar to the CPI base data used here, with spatial information would allow for a more detailed analysis of the spatial patterns of price linkages and price change transmissions. This could also open the possibility for a more detailed analysis of transportation costs and supply-side issues. As several countries are implementing different charcoal policies, including production bans, the analysis of cross-border effects is relevant for understanding domestic price changes. Another avenue could be to explore the margins along the supply chain to better understand how competitive the different segments are and whether there may be excessive margins due to the structure of the market.
