
Falling Short on Long-Term Care Efficiency Change? A Non-Parametric Approach


Abstract
:1. Introduction
2. Background
3. Methodology
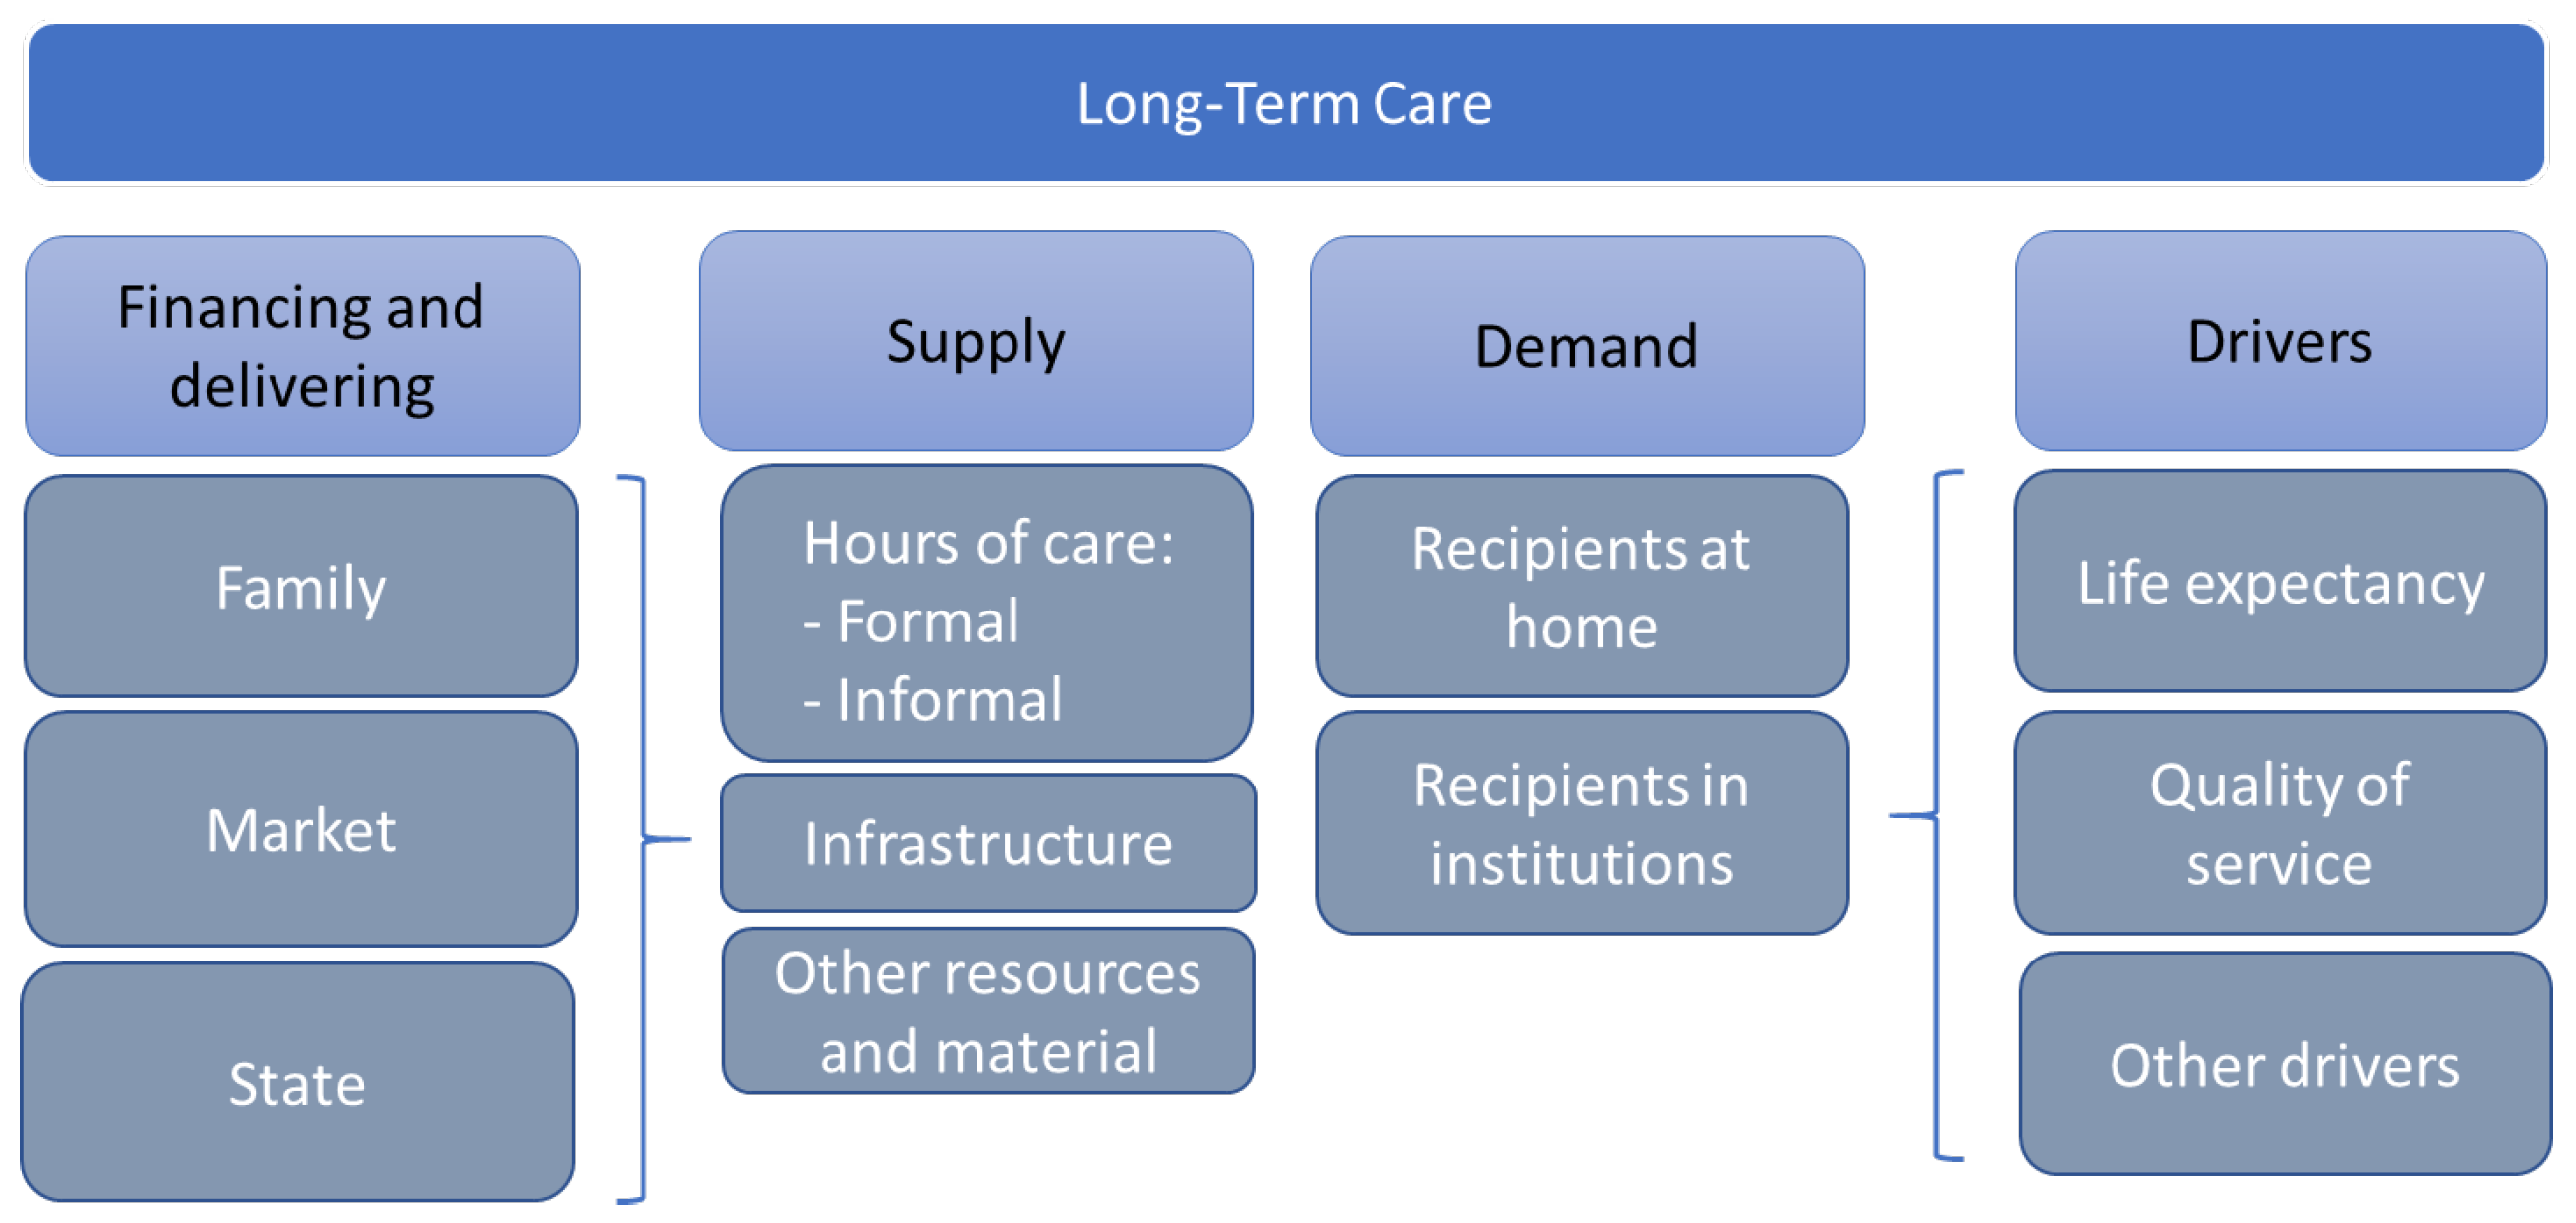
4. Data and Variables
5. Results
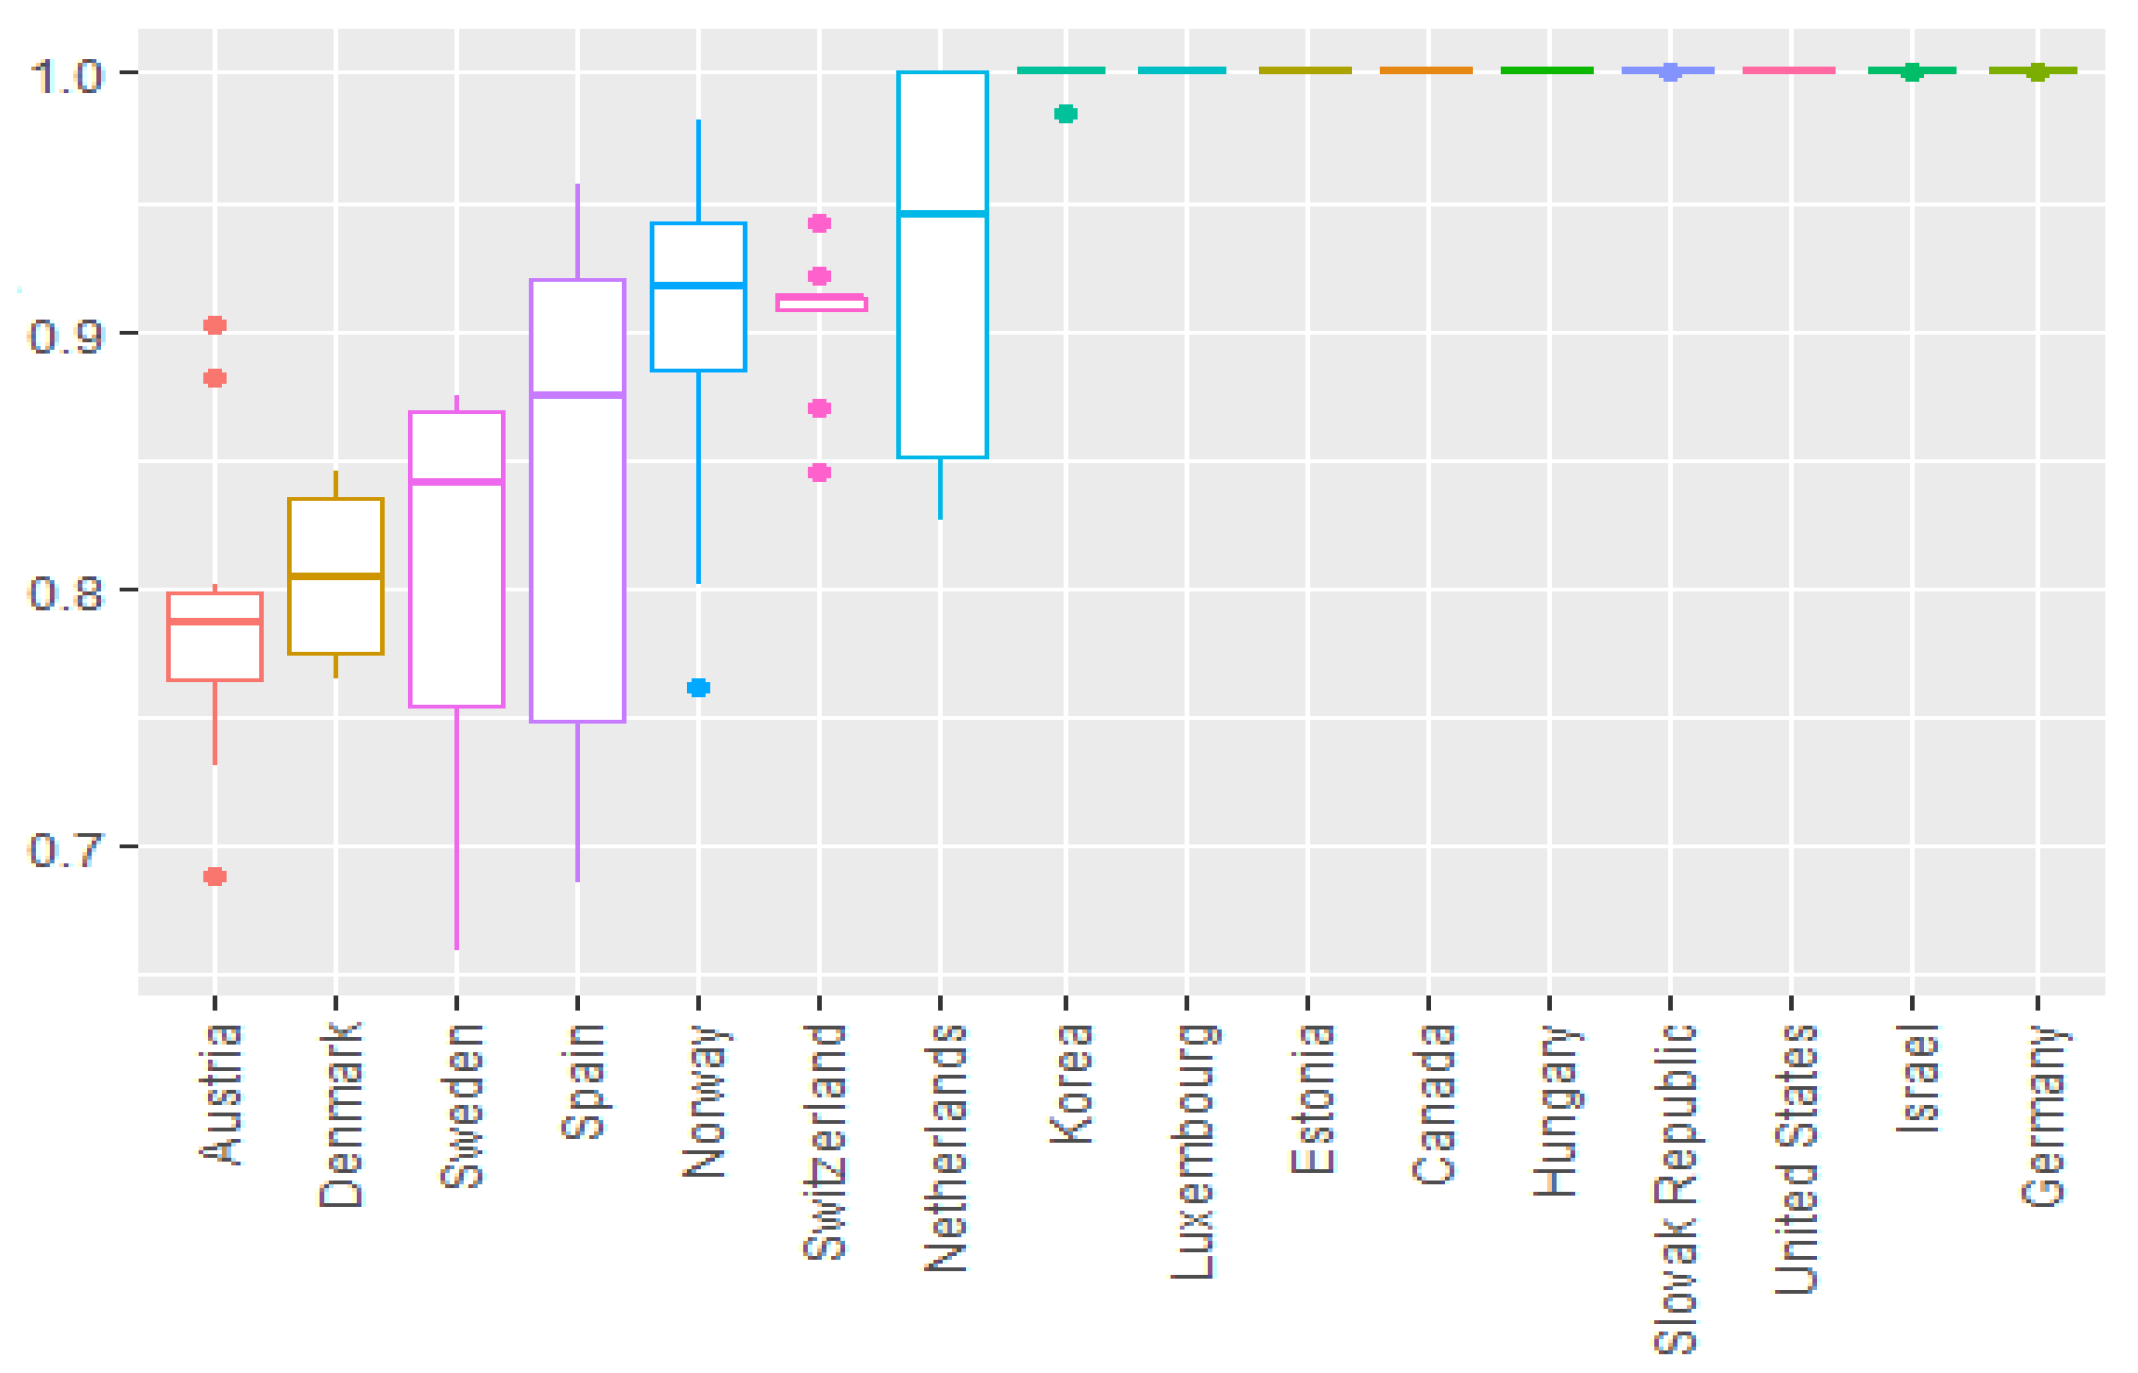
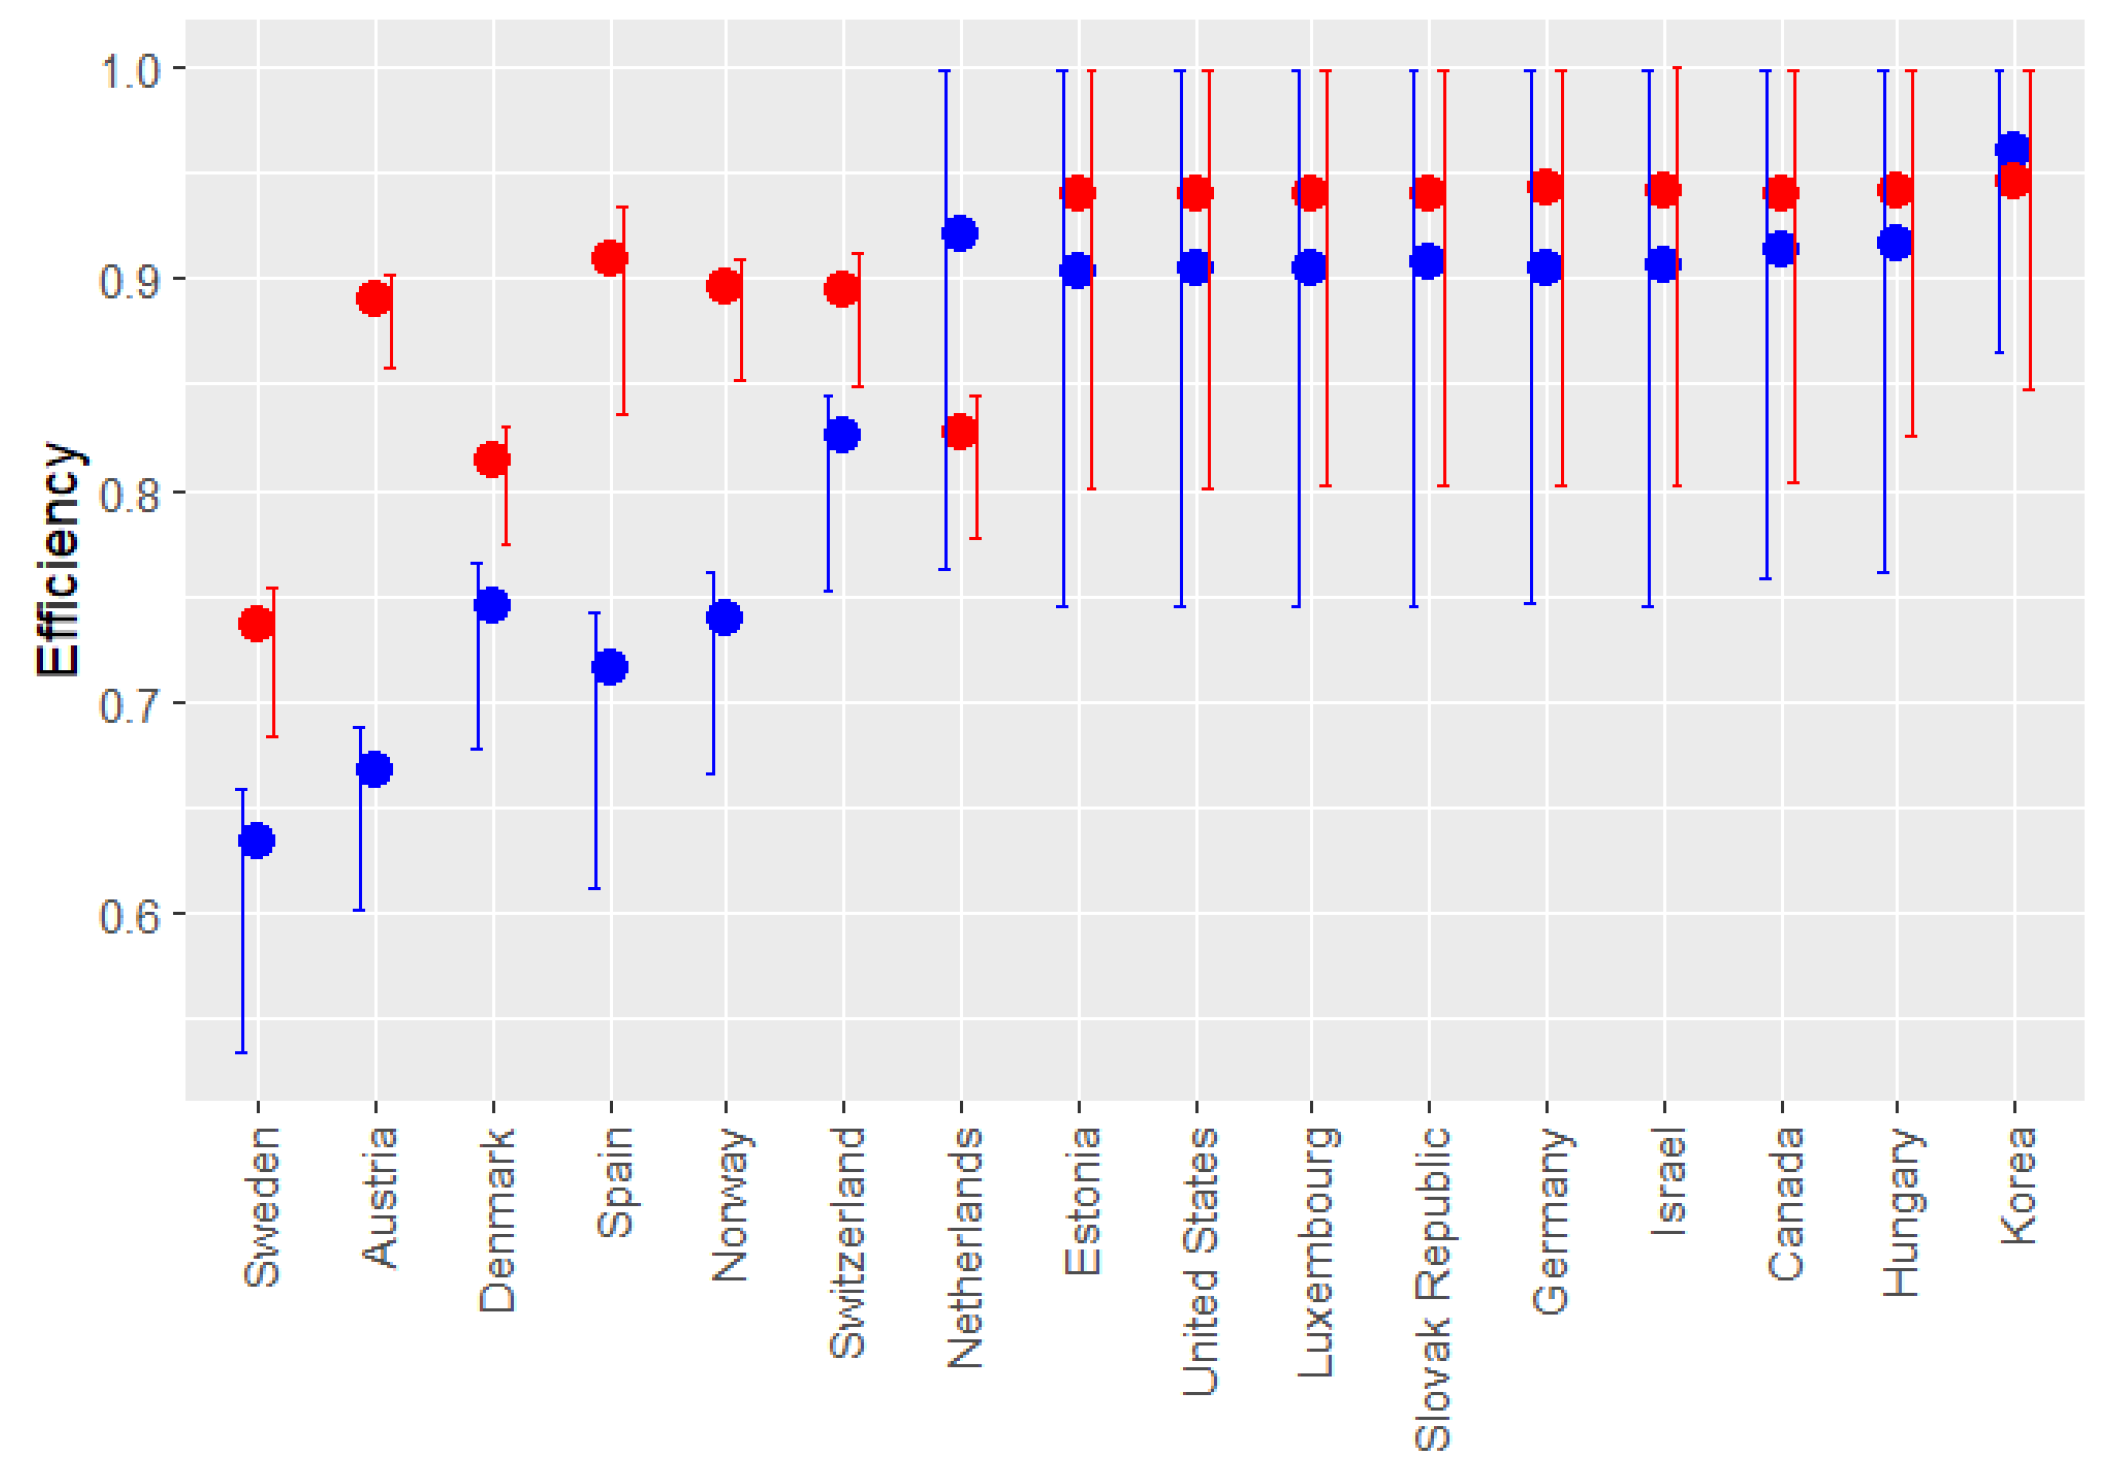
5.1. Technical Efficiency
5.2. Malmquist Productivity Index
6. Conclusions
Author Contributions
Funding
Informed Consent Statement
Data Availability Statement
Conflicts of Interest
Appendix A

| Country | Canada | Estonia | Germany | Hungary | Israel | Korea | Luxem | Neth | Slovak. Repc | United. States | |
|---|---|---|---|---|---|---|---|---|---|---|---|
| 2010 | Austria | 0.049 | - | - | - | 0.031 | - | 0.125 | 0.796 | - | |
| 2011 | Austria | - | - | - | 0.124 | - | - | - | 0.169 | 0.707 | - |
| 2012 | Austria | - | - | - | - | - | - | 0.404 | 0.209 | 0.387 | - |
| 2013 | Austria | - | 0.092 | - | - | - | 0.312 | - | - | 0.595 | - |
| 2014 | Austria | 0.011 | 0.140 | - | - | - | 0.264 | - | - | 0.585 | - |
| 2015 | Austria | - | 0.152 | - | - | - | 0.257 | - | 0.590 | - | |
| 2016 | Austria | - | 0.132 | - | - | - | 0.239 | - | 0.629 | - | |
| 2017 | Austria | 0.028 | - | - | - | - | 0.207 | - | 0.766 | - | |
| 2018 | Austria | - | 0.308 | - | 0.535 | - | 0.157 | - | - | - | |
| 2019 | Austria | - | 0.310 | - | 0.554 | - | 0.137 | - | - | - | |
| Average | Austria | 0.009 | 0.113 | - | 0.121 | 0.003 | 0.175 | 0.040 | 0.100 | 0.505 | - |
| 2010 | Denmark | 0.051 | - | - | - | 0.581 | - | 0.078 | 0.290 | - | |
| 2011 | Denmark | - | - | - | 0.139 | 0.536 | - | - | 0.108 | 0.217 | - |
| 2012 | Denmark | - | - | - | - | 0.438 | - | 0.312 | 0.147 | 0.104 | - |
| 2013 | Denmark | 0.066 | 0.415 | - | - | 0.374 | 0.145 | - | - | - | - |
| 2014 | Denmark | 0.054 | 0.449 | - | - | 0.339 | 0.158 | - | - | - | - |
| 2015 | Denmark | 0.047 | 0.466 | - | - | 0.326 | 0.162 | - | - | - | |
| 2016 | Denmark | - | 0.202 | - | - | 0.349 | 0.184 | - | 0.265 | - | |
| 2017 | Denmark | - | 0.528 | - | - | 0.286 | 0.185 | - | - | - | |
| 2018 | Denmark | - | 0.554 | - | - | 0.268 | 0.178 | - | - | - | |
| 2019 | Denmark | - | 0.619 | - | - | 0.219 | 0.162 | - | - | - | |
| Average | Denmark | 0.022 | 0.323 | - | 0.014 | 0.372 | 0.130 | 0.031 | 0.066 | 0.088 | - |
| 2010 | Korea | - | - | - | - | - | - | - | 0.113 | 0.844 | 0.043 |
| Average | Korea | - | - | - | - | - | - | - | 0.113 | 0.844 | 0.043 |
| 2015 | Neth | 0.385 | - | 0.037 | - | - | 0.577 | - | - | - | - |
| 2016 | Neth | 0.272 | - | 0.025 | - | - | 0.703 | - | - | - | - |
| 2017 | Neth | 0.387 | - | - | - | - | 0.602 | - | - | 0.012 | - |
| 2018 | Neth | 0.382 | - | - | 0.031 | - | 0.588 | - | - | - | - |
| 2019 | Neth | 0.384 | - | - | 0.093 | - | 0.522 | - | - | - | - |
| Average | Neth | 0.362 | - | 0.012 | 0.025 | - | 0.598 | - | - | 0.002 | - |
| 2010 | Norway | - | - | - | - | 0.550 | 0.277 | 0.174 | - | - | |
| 2011 | Norway | - | - | - | - | 0.480 | - | 0.341 | 0.179 | - | - |
| 2012 | Norway | - | - | - | - | 0.352 | - | 0.511 | 0.137 | - | - |
| 2013 | Norway | - | 0.366 | - | - | 0.424 | 0.210 | - | - | - | - |
| 2014 | Norway | - | 0.410 | - | - | 0.397 | 0.192 | - | - | - | - |
| 2015 | Norway | - | 0.427 | - | - | 0.397 | 0.175 | - | - | - | |
| 2016 | Norway | - | 0.453 | - | - | 0.381 | 0.166 | - | - | - | |
| 2017 | Norway | - | 0.461 | - | - | 0.376 | 0.164 | - | - | - | |
| 2018 | Norway | - | 0.476 | - | - | 0.368 | 0.155 | - | - | - | |
| 2019 | Norway | - | 0.575 | - | - | 0.282 | 0.143 | - | - | - | |
| Average | Norway | - | 0.317 | - | - | 0.401 | 0.134 | 0.113 | 0.098 | - | - |
| 2010 | Spain | 0.097 | - | 0.060 | - | 0.750 | - | - | - | 0.093 | |
| 2011 | Spain | - | - | 0.265 | 0.688 | - | - | - | - | - | 0.047 |
| 2012 | Spain | - | - | 0.260 | 0.697 | - | - | - | - | - | 0.042 |
| 2013 | Spain | - | - | 0.235 | 0.717 | - | - | - | - | - | 0.049 |
| 2014 | Spain | - | - | 0.222 | 0.727 | - | - | - | - | - | 0.051 |
| 2015 | Spain | - | - | 0.234 | 0.716 | - | - | - | - | 0.050 | |
| 2016 | Spain | - | - | 0.228 | 0.715 | - | - | - | - | 0.057 | |
| 2017 | Spain | - | - | 0.205 | 0.726 | - | - | - | - | 0.070 | |
| 2018 | Spain | - | - | 0.248 | - | - | - | - | 0.689 | 0.064 | |
| 2019 | Spain | - | - | 0.241 | - | - | - | - | 0.688 | 0.071 | |
| Average | Spain | 0.010 | - | 0.220 | 0.499 | 0.075 | - | - | - | 0.138 | 0.059 |
| 2010 | Sweden | - | - | - | - | 0.098 | - | 0.195 | 0.661 | 0.046 | |
| 2011 | Sweden | 0.053 | - | - | - | 0.353 | - | - | 0.589 | - | 0.006 |
| 2012 | Sweden | - | - | - | - | 0.354 | - | 0.141 | 0.505 | - | - |
| 2013 | Sweden | 0.137 | - | - | - | 0.251 | 0.612 | - | - | - | - |
| 2014 | Sweden | 0.144 | - | - | - | 0.343 | 0.514 | - | - | - | - |
| 2015 | Sweden | 0.136 | - | - | - | 0.364 | 0.501 | - | - | - | |
| 2016 | Sweden | 0.036 | - | - | - | 0.319 | 0.645 | - | - | - | |
| 2017 | Sweden | - | - | - | - | 0.359 | 0.625 | - | - | 0.016 | |
| 2018 | Sweden | - | - | 0.026 | - | 0.398 | 0.571 | - | - | 0.004 | |
| 2019 | Sweden | 0.042 | 0.103 | - | - | 0.235 | 0.620 | - | - | - | |
| Average | Sweden | 0.055 | 0.010 | 0.003 | - | 0.307 | 0.454 | 0.014 | 0.258 | 0.066 | 0.007 |
| 2010 | Switz | 0.207 | - | - | - | 0.267 | - | 0.114 | 0.412 | - | |
| 2011 | Switz | 0.095 | - | - | 0.445 | 0.314 | - | - | 0.147 | - | - |
| 2012 | Switz | - | - | - | 0.344 | 0.312 | - | - | 0.229 | 0.115 | - |
| 2013 | Switz | 0.211 | 0.332 | - | - | 0.244 | 0.212 | - | - | - | - |
| 2014 | Switz | 0.190 | 0.360 | - | - | 0.216 | 0.235 | - | - | - | - |
| 2015 | Switz | 0.223 | 0.312 | - | - | 0.314 | 0.152 | - | - | - | |
| 2016 | Switz | 0.170 | - | - | - | 0.490 | 0.125 | - | 0.215 | - | |
| 2017 | Switz | 0.174 | - | - | - | 0.485 | 0.129 | - | 0.212 | - | |
| 2018 | Switz | 0.197 | 0.241 | - | - | 0.444 | 0.118 | - | - | - | |
| 2019 | Switz | 0.190 | 0.275 | - | - | 0.409 | 0.125 | - | - | - | |
| Average | Switz | 0.166 | 0.152 | - | 0.079 | 0.350 | 0.122 | - | 0.098 | 0.095 | - |
| 1 | Initially, a trend variable was considered to capture the variation in efficiency over time. However, this variable was not significant and generated multicollinearity problems. |
| 2 | Fixed effects were not feasible, as our key variable “Federal” does not vary over time. Additionally, we did not use a spatial econometric approach, as the small number of countries and lack of geographic contiguity would require a distance matrix that would not add relevant insights given our focus on structural, rather than spatial, factors. |
| 3 | Regarding the limitations of the traditional Malmquist Productivity Index (), we acknowledge that its use over a long time span can present issues due to its geometric construction and potential infeasibility in calculations using DEA. However, in our study, no infeasibility problems were detected with the MC, indicating that the data and context were suitable for this methodology. Had we encountered infeasibility issues, we would have used the Global Malmquist Productivity Index (GMI) proposed by Pastor and Lovell (2005), which ensures feasibility in its calculation. |
References
- Aigner, Dennis, C. A. Knox Lovell, and Peter Schmidt. 1977. Formulation and Estimation of Stochastic Frontier Production Function Models. Journal of Econometrics 6: 21–37. [Google Scholar] [CrossRef]
- Albuquerque, Paula. 2022. Met or Unmet Need for Long-Term Care: Formal and Informal Care in Southern Europe. The Journal of the Economics of Ageing 23: 100409. [Google Scholar] [CrossRef]
- Ansah, John P., Victoria Koh, Muhammad Azeem Qureshi, and David B. Matchar. 2017. Modeling to Inform Long-Term Care Policy and Planning for an Aging Society. In Innovative Healthcare Systems for the 21st Century. Edited by Hassan Qudrat-Ullah and Peter Tsasis. Cham: Springer International, pp. 183–224. [Google Scholar]
- Aparicio, Juan, Fernando Borras, Lidia Ortiz, and Jesús T. Pastor. 2014. Benchmarking in Healthcare: An Approach Based on Closest Targets. In Managing Service Productivity. Edited by Ali Emrouznejad and Emilyn Cabanda. International Series in Operations Research & Management Science; Cham: Springer, pp. 67–91. [Google Scholar]
- Avkiran, Necmi Kemal, and Yushu (Elizabeth) Zhu. 2016. Pitching DEA Against SFA in the Context of Chinese Domestic versus Foreign Banks. In Handbook of Operations Analytics Using Data Envelopment Analysis. Edited by Shiuh-Nan Hwang, Hsuan-Shih Lee and Joe Zhu. Boston: Springer, p. 239. [Google Scholar]
- Banker, Rajiv D., Abraham Charnes, and William W. Cooper. 1984. Some Models for Estimating Technical and Scale Inefficiencies in Data Envelopment Analysis. Management Science 30: 1078–92. [Google Scholar] [CrossRef]
- Banker, Rajiv D., Abraham Charnes, William W. Cooper, James Swarts, and Davod Thomas. 1989. An Introduction to Data Envelopment Analysis with Some of Its Models and Their Uses. Research in Governmental and Nonprofit Accounting 5: 125–63. [Google Scholar]
- Barzelay, Michael. 1992. Breaking Through Bureaucracy: A New Vision for Managing in Government. Berkeley: University of California Press. [Google Scholar]
- Besley, Timothy. 2007. Principled Agents? The Political Economy of Good Government. Oxford: Oxford Academic. [Google Scholar]
- Bhat, Vasanthakumar N. 2005. Institutional Arrangements and Efficiency of Health Care Delivery Systems. The European Journal of Health Economics 6: 215–22. [Google Scholar] [CrossRef]
- Blomqvist, Paula. 2004. The Choice Revolution: Privatization of Swedish Welfare Services in the 1990s. Social Policy & Administration 38: 139–55. [Google Scholar]
- Bolin, Karl, Bengt Lindgren, and Petter Lundborg. 2008. Informal and Formal Care among Single-Living Elderly in Europe. Health Economics 17: 393–409. [Google Scholar] [CrossRef]
- Bonsang, Eric. 2009. Does Informal Care from Children to Their Elderly Parents Substitute for Formal Care in Europe? Journal of Health Economics 28: 143–54. [Google Scholar] [CrossRef]
- Caves, Douglas W., Laurits R. Christensen, and W. Erwin Diewert. 1982. The Economic Theory of Index Numbers and the Measurement of Input, Output, and Productivity. Econometrica 50: 1393–414. [Google Scholar] [CrossRef]
- Charnes, Abraham, William W. Cooper, and Edward Rhodes. 1978. Measuring the Efficiency of Decision-Making Units. European Journal of Operational Research 2: 429–44. [Google Scholar] [CrossRef]
- Cheng, Gang, and Panagiotos Zervopoulos. 2014. Estimating the Technical Efficiency of Health Care Systems: A Cross-Country Comparison Using the Directional Distance Function. European Journal of Operational Research 238: 899–910. [Google Scholar] [CrossRef]
- Christianson, James B. 1988. The Evaluation of the National Long Term Care Demonstration. 6. The Effect of Channeling on Informal Caregiving. Health Services Research 23: 99–117. [Google Scholar]
- Coelli, Timothy J., D. S. Prasada Rao, Christopher J. O’Donnell, and George E. Battese. 2005. An Introduction to Efficiency and Productivity Analysis, 2nd ed. Boston: Springer. [Google Scholar]
- Coll-Serrano, Vicente, Vicente Bolos, and Rafael Benitez Suarez. 2023. Package ‘deaR’—Conventional and Fuzzy Data Envelopment Analysis. Available online: https://cran.r-project.org/web/packages/deaR/deaR.pdf (accessed on 13 November 2024).
- Colombo, Francesca, Ana Llena-Nozal, Jerome Mercier, and Frits Tjadens. 2011. Help Wanted? Providing and Paying for Long-Term Care. OECD Health Policy Studies. Paris: OECD Publishing. [Google Scholar]
- Cooper, William W., Lawrence M. Seiford, and Kaoru Tone. 2007. Data Envelopment Analysis: A Comprehensive Text with Models, Applications, References and DEA-Solver Software. New York: Springer, vol. 2. [Google Scholar]
- Cremer, Helmuth. 2014. The Economics of Long-Term Care: An Introduction. The B.E. Journal of Economic Analysis & Policy 14: 339–42. [Google Scholar]
- CSF. 2023. Center for the Study of Federalism. Available online: https://federalism.org/ (accessed on 3 September 2023).
- Da Roit, Barbara. 2021. Long-Term Care Policies Meet Austerity. In Handbook on Austerity, Populism and the Welfare State. Edited by Bent Greve. Cheltenham: Edward Elgar, pp. 312–27. [Google Scholar]
- Dan, Sorin, and Christopher Pollitt. 2015. NPM Can Work: An Optimistic Review of the Impact of New Public Management Reforms in Central and Eastern Europe. Public Management Review 17: 1305–32. [Google Scholar] [CrossRef]
- De Biase, Pietrangelo, and Sean Dougherty. 2023. From Local to National: Delivering and Financing Effective Long-Term Care. OECD Working Papers on Fiscal Federalism, No. 45. Available online: https://www.oecd-ilibrary.org/content/paper/578b296f-en (accessed on 16 October 2023).
- de Cos, Pablo Hernández, and Enrique Moral-Benito. 2014. Determinants of Health-System Efficiency: Evidence from OECD Countries. International Journal of Health Care Finance and Economics 14: 69–93. [Google Scholar] [CrossRef]
- De la Maisonneuve, Christine, and Joaquim Oliveira Martins. 2014. The Future of Health and Long-Term Care Spending. OECD Journal: Economic Studies 2014: 61–96. [Google Scholar]
- Dyson, Robert G., Rachel Allen, Ana S. Camanho, Victor V. Podinovski, Claudia S. Sarrico, and Estelle A. Shale. 2001. Pitfalls and Protocols in DEA. European Journal of Operational Research 132: 245–59. [Google Scholar] [CrossRef]
- European Commission. 2021. Study on Exploring the Incidence and Costs of Informal Long-Term Care in the EU. Luxembourg: Publications Office of the European Union. [Google Scholar]
- European Commission, Council of the European Union, Directorate-General for Economic and Financial Affairs, and Economic Policy Committee. 2015. The 2015 Ageing Report: Economic and Budgetary Projections for the 28 EU Member States (2013–2060). Luxembourg: Publications Office. [Google Scholar]
- Farrell, Maurice. J. 1957. The Measurement of Productive Efficiency. Journal of the Royal Statistical Society. Series A (General) 120: 253–90. [Google Scholar] [CrossRef]
- Färe, Rolf, and Shawna Grosskopf. 1992. Malmquist Productivity Indexes and Fisher Ideal Indexes. The Economic Journal 102: 158–60. [Google Scholar] [CrossRef]
- Fernández, José Luis, and Cristiano Gori. 2016. Introduction. In Long-Term Care Reforms in OECD Countries. Bristol: Bristol University Press, pp. 1–6. [Google Scholar]
- Friedman, Lea, and Zilla Sinuany-Stern. 1997. stanng Units via the Canonical Correlation Analysis in the DEA Context. European Journal of Operational Research 100: 629–37. [Google Scholar] [CrossRef]
- Golany, Boaz, and Yehuda Roll. 1989. An Application Procedure for DEA. Omega 17: 237–50. [Google Scholar] [CrossRef]
- Gore, Al. 1993. From Red Tape to Results: Creating a Government That Works Better & Costs Less: Report of the National Performance Review. Washington: U.S. Government Printing Office. [Google Scholar]
- Gori, Cristiano, José Luis Fernández, and Raphael Wittenberg, eds. 2016. Long-Term Care Reforms in OECD Countries. Bristol: Policy Press. [Google Scholar]
- Gravelle, Hugh, Rowena Jacobs, Andrew M. Jones, and Andrew Street. 2003. Comparing the Efficiency of National Health Systems: A Sensitivity Analysis of the WHO Approach. Applied Health Economics and Health Policy 2: 141–47. [Google Scholar] [PubMed]
- Homburg, Carsten. 2001. Using Data Envelopment Analysis to Benchmark Activities. International Journal of Production Economics 73: 51–58. [Google Scholar] [CrossRef]
- Hood, Christopher. 1991. A Public Management for All Seasons. Public Administration 69: 3–9. [Google Scholar] [CrossRef]
- Klimaviciute, Justina, and Pierre Pestieau. 2018. The Public Economics of Long-Term Care: A Survey of Recent Contributions. Annals of Public and Cooperative Economics 89: 49–63. [Google Scholar] [CrossRef]
- Kordic, Lana, and Josipa Visic. 2023. Total Factor Productivity Change of Long-Term Care System in Selected OECD Countries. Economic Thought and Practice 32: 3–18. [Google Scholar]
- Lopes, Hugo, Céu Mateus, and Cristina Hernández-Quevedo. 2018. Ten Years After the Creation of the Portuguese National Network for Long-Term Care in 2006: Achievements and Challenges. Health Policy 122: 210–16. [Google Scholar] [CrossRef]
- Mann, Henry B., and Donald R. Whitney. 1947. On a Test of Whether One of Two Random Variables Is Stochastically Larger than the Other. Annals of Mathematical Statistics 18: 50–60. [Google Scholar] [CrossRef]
- Mbau, Rahab, Anita Musiega, Lizah Nyawira, Benjamin Tsofa, Andrew Mulwa, Sassy Molyneux, Isabel Maina, Julie Jemutai, Charles Normand, Kara Hanson, and et al. 2023. Analysing the Efficiency of Health Systems: A Systematic Review of the Literature. Applied Health Economics and Health Policy 21: 205–24. [Google Scholar] [CrossRef]
- Meeusen, Wim, and Julien van Den Broeck. 1977. Efficiency Estimation from Cobb-Douglas Production Functions with Composed Error. International Economic Review 18: 435–44. [Google Scholar] [CrossRef]
- Moberg, Linda, Paula Blomqvist, and Ulrika Winblad. 2016. User Choice in Swedish Eldercare—Conditions for Informed Choice and Enhanced Service Quality. Journal of European Social Policy 26: 281–95. [Google Scholar] [CrossRef]
- Mosca, Ilaria, Philip J. van der Wees, Esther S. Mot, Joost J. G. Wammes, and Patrick P. T. Jeurissen. 2017. Sustainability of Long-Term Care: Puzzling Tasks Ahead for Policy-Makers. International Journal of Health Policy and Management 6: 195–205. [Google Scholar] [CrossRef]
- Moscovice, Ira S., Gestur Davidson, and David McCaffrey. 1988. Substitution of Formal and Informal Care for the Community-Based Elderly. Medical Care 26: 971–81. [Google Scholar] [CrossRef]
- Muir, Tim. 2017. Measuring Social Protection for Long-Term Care. In OECD Health Working Papers. Paris: OECD Publishing. [Google Scholar]
- Murtaugh, Charles M., Paul Kemper, and Barbara C. Spillman. 1990. The Risk of Nursing Home Use in Later Life. Medical Care 28: 952–62. [Google Scholar] [CrossRef]
- Naylor, John. C., and Alan F. M. Smith. 1982. Applications of a Method for the Efficient Computation of Posterior Distributions. Applied Statistics 31: 214–25. [Google Scholar] [CrossRef]
- Norton, Edwards C. 2000. Long-Term Care. In Handbook of Health Economics. Edited by Anthony. J. Culyer and Joseph P. Newhouse. Amsterdam: Elsevier, pp. 955–94. vol. 1(B). [Google Scholar]
- Nunamaker, Thomas R. 1985. Using Data Envelopment Analysis to Measure the Efficiency of Non-Profit Organizations: A Critical Evaluation. Managerial and Decision Economics 6: 50–58. [Google Scholar] [CrossRef]
- OECD. 2018. Regions and Cities at a Glance 2018. Paris: OECD Publishing. [Google Scholar]
- OECD. 2019. Health at a Glance 2019: OECD Indicators. Paris: OECD Publishing. [Google Scholar]
- OECD. 2020. Who Cares? Attracting and Retaining Care Workers for the Elderly. OECD Health Policy Studies. Paris: OECD Publishing. [Google Scholar]
- OECD. 2021. Health at a Glance 2021: OECD Indicators. Paris: OECD Publishing. [Google Scholar]
- OECD. 2023. Organisation for Economic Co-Operation and Development: OECD Stat. Available online: https://stats.oecd.org/Index.aspx?ThemeTreeId=9 (accessed on 8 December 2023).
- OECD/Eurostat/WHO. 2017. A System of Health Accounts 2011: Revised Edition. Paris: OECD Publishing. [Google Scholar]
- Ogden, Lydia, and Kathleen Adams. 2009. Poorhouse to Warehouse: Institutional Long-Term Care in the United States. Publius: The Journal of Federalism 39: 138–63. [Google Scholar] [CrossRef]
- Osborne, David. 1993. Reinventing Government. Public Productivity and Management Review 16: 349–56. [Google Scholar] [CrossRef]
- Ozbugday, Fatih Cemil, Abdullah Tirgil, and Elif Gul Kose. 2020. Efficiency Changes in Long-Term Care in OECD Countries: A Non-Parametric Malmquist Index Approach. Socio-Economic Planning Sciences 70: 100733. [Google Scholar] [CrossRef]
- Österle, August. 2024. Long-Term Care. In Research Handbook on Health Care Policy. Edited by Martin Powell, Tuba I. Agartan and Daniel Béland. Cheltenham: Edward Elgar Publishing, pp. 191–207. Available online: https://www.elgaronline.com/edcollchap/book/9781800887565/book-part-9781800887565-16.xml (accessed on 3 December 2024).
- Pastor, Jesús T., and C. A. Knox Lovell. 2005. A Global Malmquist Productivity Index. Economics Letters 88: 266–71. [Google Scholar] [CrossRef]
- Pendergast, John F., Steven J. Gange, Margo A. Newton, Michael J. Lindstrom, Michael Palta, and Mark R. Fisher. 1996. A Survey of Methods for Analyzing Clustered Binary Response Data. International Statistical Review 64: 89–118. [Google Scholar] [CrossRef]
- Peña-Longobardo, Luz María, Juan Oliva-Moreno, Sandra García-Armesto, and Cristina Hernández-Quevedo. 2016. The Spanish Long-Term Care System in Transition: Ten Years Since the 2006 Dependency Act. Health Policy 120: 1177–82. [Google Scholar] [CrossRef] [PubMed]
- Perdrix, Elsa, and Quitterie Roquebert. 2020. Does an Increase in Formal Care Affect Informal Care? Evidence Among the French Elderly. Working Papers of BETA 2020-02, Bureau d’Economie Théorique et Appliquée, UDS, Strasbourg. Available online: https://beta.u-strasbg.fr/WP/2020/2020-02.pdf (accessed on 18 April 2024).
- Peters, B. Guy, and Jon Pierre. 1998. Governance without Government? Rethinking Public Administration. Journal of Public Administration Research and Theory 8: 223–43. [Google Scholar] [CrossRef]
- Pezzin, Liliana, Peter Kemper, and James Reschovsky. 1996. Does Publicly Provided Home Care Substitute for Family Care? Experimental Evidence with Endogenous Living Arrangements. The Journal of Human Resources 31: 650–76. [Google Scholar] [CrossRef]
- Pollitt, Christopher, and Geert Bouckaert. 2011. Public Management Reform: A Comparative Analysis: New Public Management, Governance, and the Neo-Weberian State. Oxford: Oxford University Press. [Google Scholar]
- Raab, Raymond L., and Richard W. Lichty. 2002. Identifying Subareas that Comprise a Greater Metropolitan Area: The Criterion of County Relative Efficiency. Journal of Regional Science 42: 579–94. [Google Scholar] [CrossRef]
- Ranci, Chiara, and Ettore Pavolini, eds. 2013. Reforms in Long-Term Care in Europe: Investigating Institutional Change and Social Impacts. New York: Springer. [Google Scholar]
- Ray, Subhash C., and Evangelia Delsi. 1997. Productivity Growth, Technical Progress, Efficiency Change in Industrialized Countries: Comment. The American Economic Review 87: 1033–39. [Google Scholar]
- Rostgaard, Tine, Filip Jacobs, Teppo Kröger, and Ellen Peterson. 2022. Revisiting the Nordic Long-Term Care Model for Older People—Still Equal? European Journal of Aging 19: 201–10. [Google Scholar] [CrossRef]
- Rudnytskyi, Iegor, and Joel Wagner. 2019. Drivers of Old-Age Dependence and Long-Term Care Usage in Switzerland—A Structural Equation Model Approach. Risks 7: 92. [Google Scholar] [CrossRef]
- Serrano-Alarcón, Manuel, Helena Hernández-Pizarro, Guillem López i Casasnovas, and Catia Nicodemo. 2021. The Effect of Long-Term Care (LTC) Benefits on Healthcare Use. Working Papers 2021–12. Madrid: FEDEA. [Google Scholar]
- Sevim, Ferit, Osman Şenol, and Fevzi Akbulut. 2024. Evaluation of the Efficiency of Long-Term Care Services in OECD Countries by DEA Method. Journal of Midwifery and Health Sciences 7: 376–87. [Google Scholar] [CrossRef]
- Shephard, Ronald W. 1953. Cost and Production Functions. Princeton: Princeton University Press. [Google Scholar]
- Shleifer, Andrei. 1985. A Theory of Yardstick Competition. Rand Journal of Economics 16: 319–27. [Google Scholar] [CrossRef]
- Siciliani, Luigi. 2013. The Economics of Long-Term Care. The B.E. Journal of Economic Analysis & Policy 14: 343–75. [Google Scholar]
- Simar, Leopold, and Paul W. Wilson. 1998. Sensitivity Analysis of Efficiency Scores: How to Bootstrap in Nonparametric Frontier Models. Management Science 44: 49–61. [Google Scholar] [CrossRef]
- Simar, Léopold, and Paul W. Wilson. 2007. Estimation and Inference in Two-Stage, Semi-Parametric Models of Production Processes. Journal of Econometrics 136: 31–64. [Google Scholar] [CrossRef]
- Skrondal, Anders, and Sophia Rabe-Hesketh. 2004. Generalized Latent Variable Modeling: Multilevel, Longitudinal, and Structural Equation Models, 1st ed. Boca Raton: CRC Press. [Google Scholar]
- Theobald, Hildegard, and Elizabeth Ozanne. 2015. Multilevel Governance and Its Effects on Long-Term Care Support. In Long-Term Care Reforms in OECD Countries. Edited by Cesare Gori, José.-Luis Fernandez and R. Wittenberg. Bristol: Policy Press Scholarship Online. [Google Scholar]
- Tobin, James. 1958. Estimation of Relationships for Limited Dependent Variables. Econometrica 26: 24–36. [Google Scholar] [CrossRef]
- UN DESA, United Nations, and Department of Economic and Social Affairs, and Population Division. 2020. World Population Prospects 2019. New York: United Nations, Department of Economic and Social Affairs, Population Division. Available online: https://population.un.org/wpp/DataQuery/ (accessed on 5 October 2023).
- Varabyova, Yauheniya, and Julia-María Müller. 2016. The Efficiency of Health Care Production in OECD Countries: A Systematic Review and Meta-Analysis of Cross-Country Comparisons. Health Policy 120: 252–63. [Google Scholar] [CrossRef] [PubMed]
- Verbakel, Elien, Karen Glaser, Youssef Amzour, Mette B. Brandt, and Marga. van Groenou. 2023. Indicators of Familialism and Defamilialization in Long-Term Care: A Theoretical Overview and Introduction of Macro-Level Indicators. Journal of European Social Policy 33: 34–51. [Google Scholar] [CrossRef]
- Wende, Danny, Alexander Karmann, and Shinya Sugawara. 2024. Does the Design of Welfare Programs Stipulate Nursing Home Utilization? A Comparative Analysis of Long-Term Care Systems in Japan and Germany. Review of Economics 75: 43–61. [Google Scholar] [CrossRef]
- Wranik, Dominika. 2012. Healthcare Policy Tools as Determinants of Health-System Efficiency: Evidence from the OECD. Health Economics, Policy, and Law 7: 197–226. [Google Scholar] [CrossRef]
- Zhang, Liangwen, Ying Han, and Ya Fang. 2023. Non-Human and Human Service Efficiency of Long-Term Care Facilities in China. Frontiers in Public Health 11: 1066190. [Google Scholar] [CrossRef]
| Variable | Variable Definition | N | Mean | St. Dev | Min | Max |
|---|---|---|---|---|---|---|
| (Y1) | Recipients in institutions | 160 | 223,875 | 354,962 | 3881 | 1,400,810 |
| (Y2) | Recipients at home | 160 | 681,272 | 1,161,566 | 7966 | 5,395,496 |
| (X1) | Formal workers | 160 | 335,918 | 642,419 | 4912 | 2,861,973 |
| (X2) | Beds in LTC facilities | 160 | 259,324 | 421,230 | 3881 | 1,663,445 |
| (X3) | Expenditure per capita (PPP) | 160 | 721.00 | 524.00 | 6.00 | 1991.00 |
| Public Expenditure per Capita (USD PPP) | Share of Total Expenditure (%) | ||||||
|---|---|---|---|---|---|---|---|
| Unitary States | Local | State | Central | Total | Local | State | Central |
| Denmark | 17,070 | - | 9203 | 26,273 | 65% | 0% | 35% |
| Estonia | 2797 | - | 9285 | 12,082 | 23% | 0% | 77% |
| Hungary | 1609 | - | 10,856 | 12,465 | 13% | 0% | 87% |
| Israel | 2063 | - | 12,676 | 14,739 | 14% | 0% | 86% |
| Korea | 5089 | - | 6731 | 11,820 | 43% | 0% | 57% |
| Luxembourg | 5033 | - | 37,941 | 42,974 | 12% | 0% | 88% |
| Netherlands | 6961 | - | 14,994 | 21,955 | 32% | 0% | 68% |
| Norway | 9915 | - | 19,966 | 29,881 | 33% | 0% | 67% |
| Slovak Republic | 1998 | - | 10,645 | 12,643 | 16% | 0% | 84% |
| Sweden | 12,238 | - | 11,947 | 24,185 | 51% | 0% | 49% |
| Federal States | |||||||
| Austria | 4298 | 4876 | 16,433 | 25,607 | 17% | 19% | 64% |
| Canada | 3861 | 10,283 | 4428 | 18,572 | 21% | 55% | 24% |
| Germany | 3900 | 6494 | 11,223 | 21,617 | 18% | 30% | 52% |
| Spain | 2095 | 5449 | 7782 | 15,326 | 14% | 36% | 51% |
| Switzerland | 4745 | 8722 | 8464 | 21,931 | 22% | 40% | 39% |
| United States | 10,533 | 11,247 | 21,780 | 48% | 52% | ||
| Country | 2010 | 2011 | 2012 | 2013 | 2014 | 2015 | 2016 | 2017 | 2018 | 2019 | Mean | Year Eff. |
|---|---|---|---|---|---|---|---|---|---|---|---|---|
| Austria | 0.731 | 0.688 | 0.801 | 0.789 | 0.790 | 0.786 | 0.776 | 0.761 | 0.883 | 0.903 | 0.791 | 0 |
| Canada | 1.000 | 1.000 | 1.000 | 1.000 | 1.000 | 1.000 | 1.000 | 1.000 | 1.000 | 1.000 | 1.000 | 10 |
| Denmark | 0.838 | 0.766 | 0.836 | 0.794 | 0.787 | 0.772 | 0.765 | 0.846 | 0.814 | 0.830 | 0.805 | 0 |
| Estonia | 1.000 | 1.000 | 1.000 | 1.000 | 1.000 | 1.000 | 1.000 | 1.000 | 1.000 | 1.000 | 1.000 | 10 |
| Germany | 1.000 | 1.000 | 1.000 | 1.000 | 1.000 | 1.000 | 1.000 | 1.000 | 1.000 | 1.000 | 1.000 | 10 |
| Hungary | 1.000 | 1.000 | 1.000 | 1.000 | 1.000 | 1.000 | 1.000 | 1.000 | 1.000 | 1.000 | 1.000 | 10 |
| Israel | 1.000 | 1.000 | 1.000 | 1.000 | 1.000 | 1.000 | 1.000 | 1.000 | 1.000 | 1.000 | 1.000 | 10 |
| Korea | 0.985 | 1.000 | 1.000 | 1.000 | 1.000 | 1.000 | 1.000 | 1.000 | 1.000 | 1.000 | 0.998 | 9 |
| Luxembourg | 1.000 | 1.000 | 1.000 | 1.000 | 1.000 | 1.000 | 1.000 | 1.000 | 1.000 | 1.000 | 1.000 | 10 |
| Netherlands | 1.000 | 1.000 | 1.000 | 1.000 | 1.000 | 0.889 | 0.870 | 0.838 | 0.827 | 0.845 | 0.927 | 5 |
| Norway | 0.801 | 0.762 | 0.982 | 0.925 | 0.938 | 0.945 | 0.944 | 0.907 | 0.877 | 0.910 | 0.899 | 0 |
| Slovak Republic | 1.000 | 1.000 | 1.000 | 1.000 | 1.000 | 1.000 | 1.000 | 1.000 | 1.000 | 1.000 | 1.000 | 10 |
| Spain | 0.767 | 0.743 | 0.729 | 0.686 | 0.854 | 0.899 | 0.957 | 0.895 | 0.927 | 0.935 | 0.839 | 0 |
| Sweden | 0.874 | 0.659 | 0.834 | 0.873 | 0.869 | 0.865 | 0.848 | 0.757 | 0.753 | 0.754 | 0.809 | 0 |
| Switzerland | 0.870 | 0.845 | 0.913 | 0.907 | 0.910 | 0.922 | 0.942 | 0.913 | 0.912 | 0.913 | 0.905 | 0 |
| United States | 1.000 | 1.000 | 1.000 | 1.000 | 1.000 | 1.000 | 1.000 | 1.000 | 1.000 | 1.000 | 1.000 | 10 |
| Mean | 0.929 | 0.904 | 0.943 | 0.936 | 0.947 | 0.942 | 0.944 | 0.932 | 0.937 | 0.943 | 0.936 | |
| Minimum | 0.731 | 0.659 | 0.729 | 0.686 | 0.787 | 0.772 | 0.765 | 0.757 | 0.753 | 0.754 | 0.659 | |
| Maximum | 1.000 | 1.000 | 1.000 | 1.000 | 1.000 | 1.000 | 1.000 | 1.000 | 1.000 | 1.000 | 1.000 | |
| Standard Dev. | 0.098 | 0.134 | 0.091 | 0.100 | 0.079 | 0.079 | 0.083 | 0.089 | 0.083 | 0.078 | 0.083 |
| Government Structure | N | Mean | St. Dev | Min | Max |
|---|---|---|---|---|---|
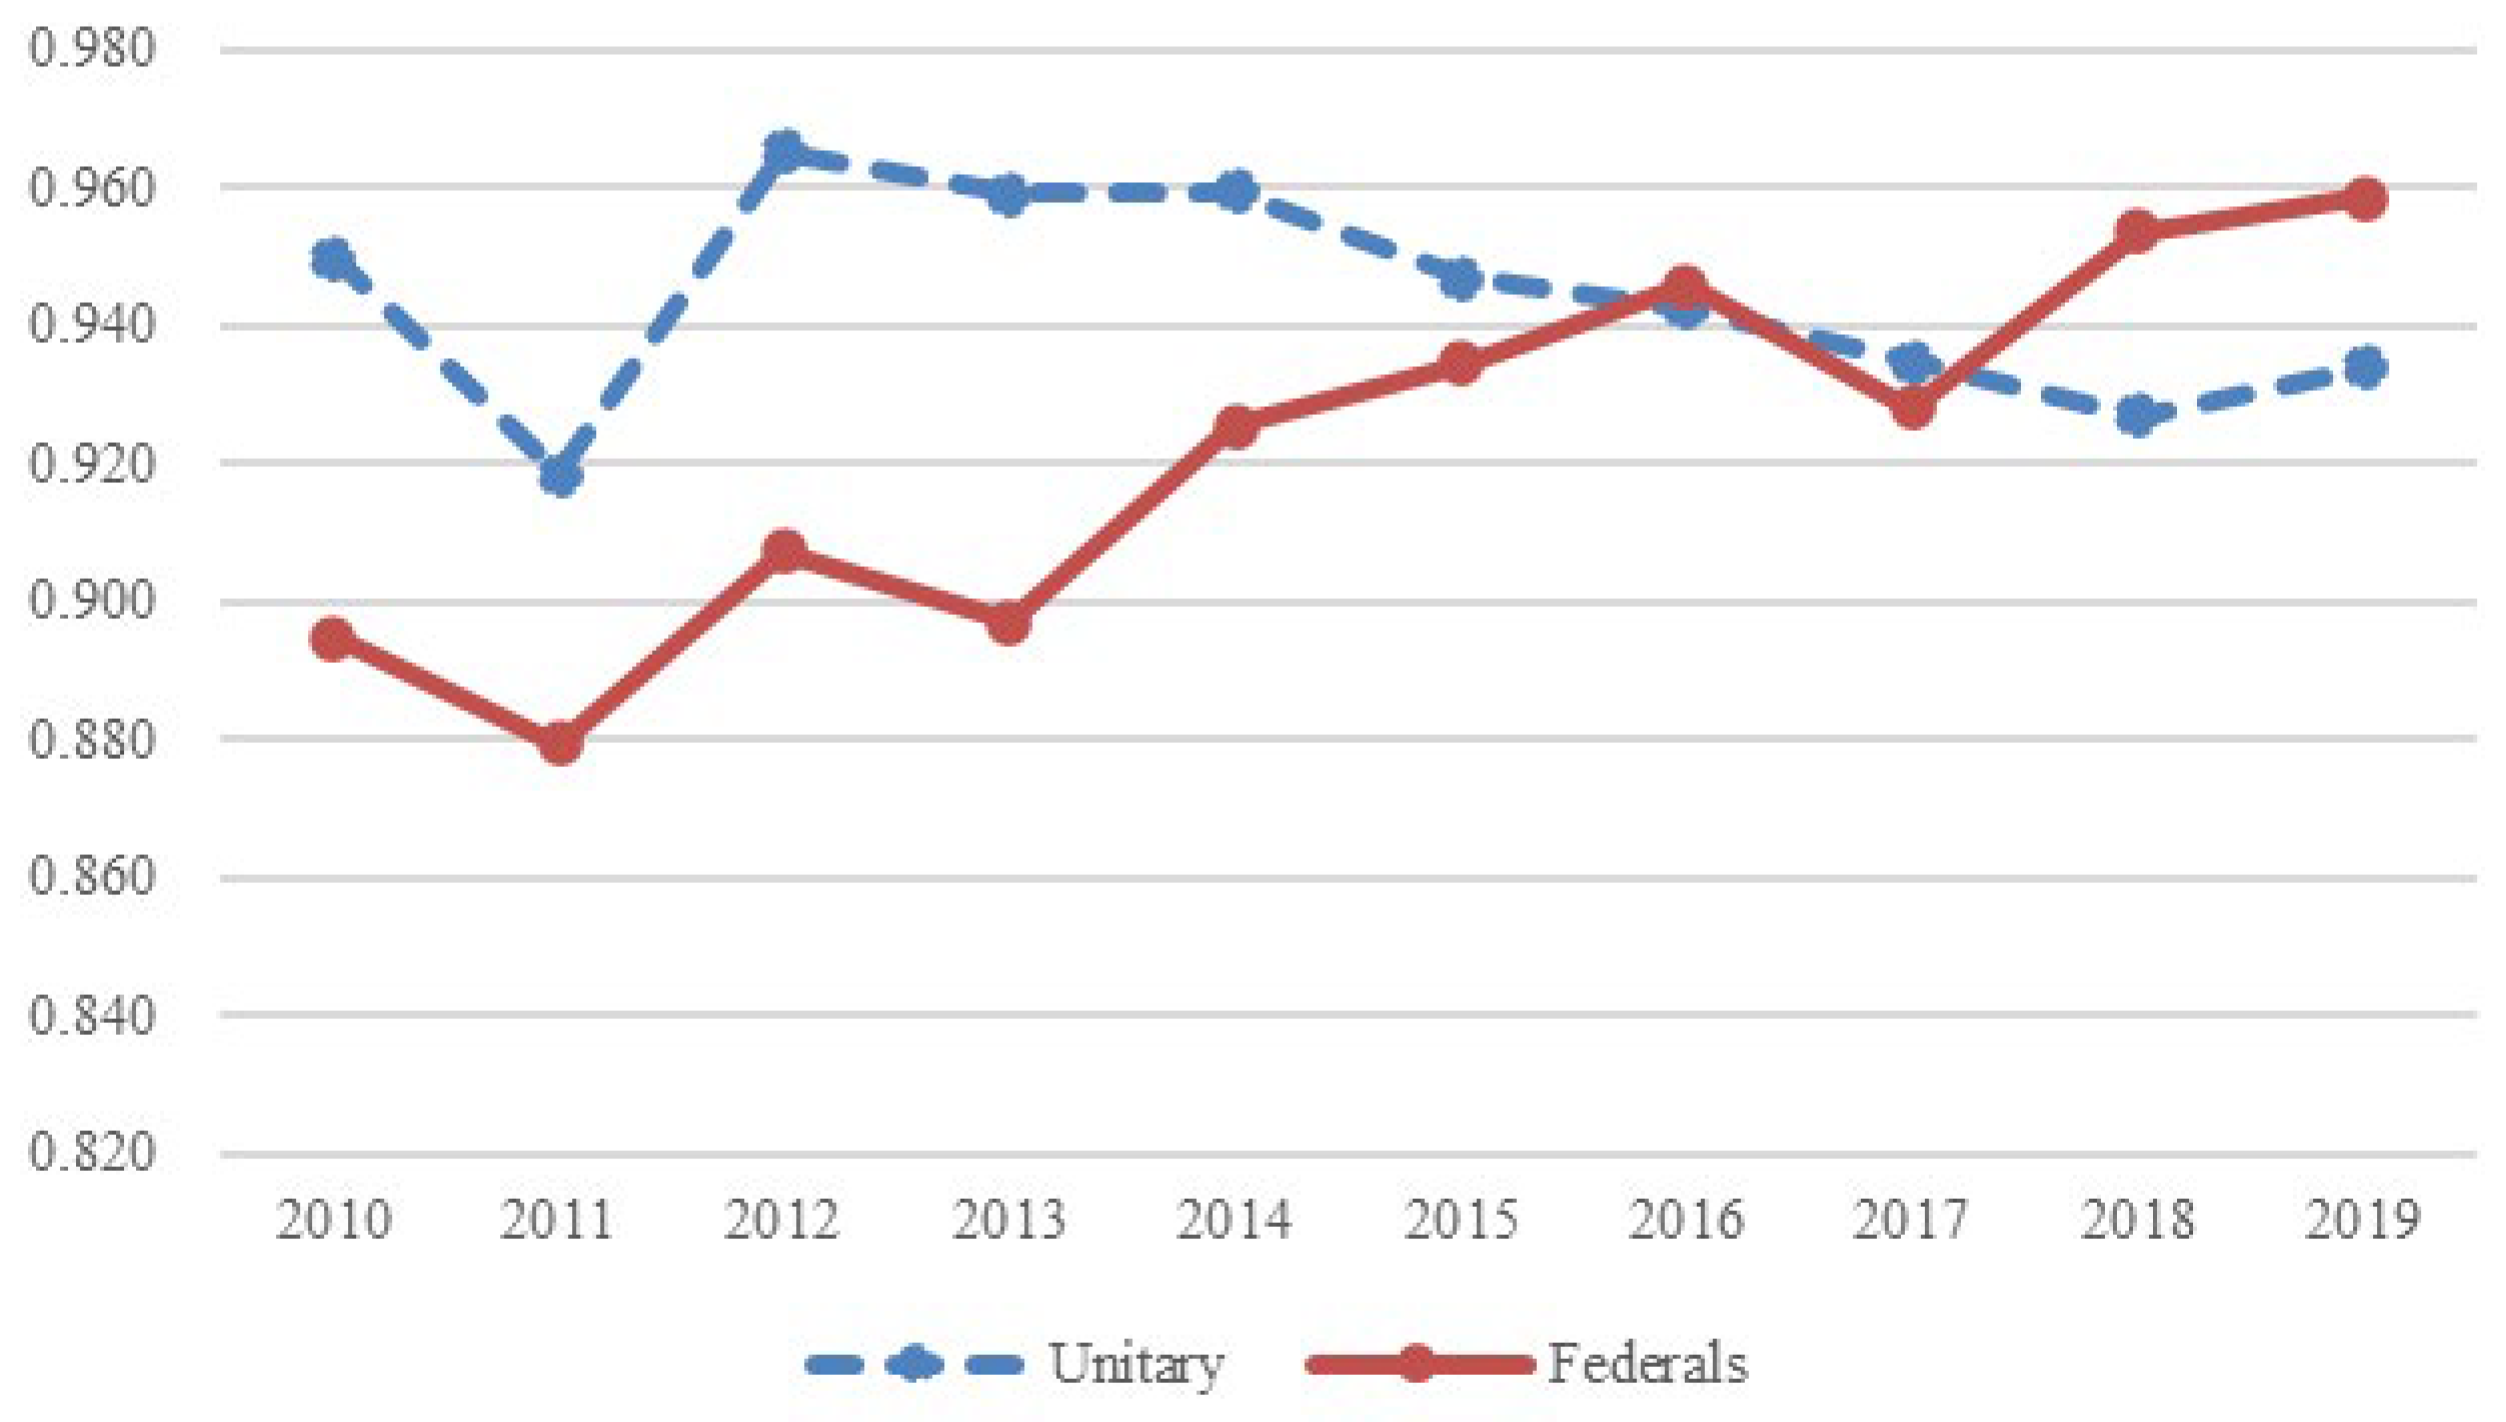
| Unitary | 100 | 0.944 | 0.087 | 0.659 | 1.000 |
| Federal | 60 | 0.923 | 0.097 | 0.686 | 1.000 |
| Efficiency | Coef. | St.Err. | t-Value | p-Value | [95% Conf | Interval] | Sig |
|---|---|---|---|---|---|---|---|
| Federal | −0.112 | 0.093 | −1.20 | 0.23 | −0.294 | 0.07 | |
| Federal*trend | 0.017 | 0.004 | 3.87 | 0 | 0.009 | 0.026 | *** |
| HDI | −0.545 | 0.797 | −0.68 | 0.494 | −2.106 | 1.017 | |
| Constant | 1.615 | 0.71 | 2.28 | 0.023 | 0.225 | 3.006 | ** |
| sigma_u | 0.228 | 0.063 | 3.61 | 0 | 0.104 | 0.352 | *** |
| sigma_e | 0.062 | 0.006 | 10.79 | 0 | 0.051 | 0.074 | *** |
| Mean dependent var | 0.936 | SD dependent var | 0.091 | ||||
| Number of obs | 160 | Chi-square | 17.499 | ||||
| Prob > chi2 | 0.001 | Akaike crit. (AIC) | −101.278 | ||||
| LR test of = 0 chibar2(01) = | 169.86 | Prob ≥chibar2 = | 0.000 | ||||
| Efficiency | Observed Coef. | Bootstrap Std. Err | z | p > z | Percentile 95% Conf. | Interval |
|---|---|---|---|---|---|---|
| Federal | −0.034 | 0.044 | −0.750 | 0.451 | −0.119 | 0.057 |
| Federal*trend | 0.021 | 0.009 | 2.490 | 0.013 | 0.005 | 0.039 |
| HDI | −2.916 | 0.574 | −5.080 | 0.000 | −4.108 | −1.867 |
| _cons | 3.491 | 0.532 | 6.560 | 0.000 | 2.535 | 4.590 |
| 0.142 | 0.013 | 10.800 | 0.000 | 0.116 | 0.167 |
| Period | TEC | TC | SEC | |
|---|---|---|---|---|
| 2010–2011 | 0.981 | 0.967 | 1.033 | 0.982 |
| 2011–2012 | 0.988 | 1.050 | 0.876 | 1.074 |
| 2012–2013 | 1.034 | 0.991 | 1.102 | 0.947 |
| 2013–2014 | 1.000 | 1.014 | 1.016 | 0.971 |
| 2014–2015 | 0.988 | 0.995 | 0.982 | 1.010 |
| 2015–2016 | 1.003 | 1.001 | 1.010 | 0.992 |
| 2016–2017 | 1.016 | 0.987 | 1.005 | 1.024 |
| 2017–2018 | 1.020 | 1.006 | 0.983 | 1.032 |
| 2018–2019 | 1.014 | 1.007 | 0.999 | 1.008 |
| Average | 1.005 | 1.002 | 0.999 | 1.004 |
| Period | TC | TEC | SEC | |||||||||
|---|---|---|---|---|---|---|---|---|---|---|---|---|
| 2010–2015 | 2015–2019 | 2010–2019 | 2010–2015 | 2015–2019 | 2010–2019 | 2010–2015 | 2015–2019 | 2010–2019 | 2010–2015 | 2015–2019 | 2010–2019 | |
| Netherlands | 0.921 | 0.988 | 0.954 | 0.999 | 0.979 | 0.989 | 0.998 | 0.966 | 0.982 | 0.971 | 1.041 | 1.005 |
| Sweden | 0.968 | 0.985 | 0.976 | 0.985 | 0.974 | 0.980 | 0.977 | 0.987 | 0.982 | 0.957 | 1.027 | 0.992 |
| Luxembourg | 0.932 | 1.035 | 0.982 | 1.002 | 0.992 | 0.997 | 1.000 | 1.000 | 1.000 | 0.930 | 1.043 | 0.985 |
| Slovak Rep | 1.011 | 0.979 | 0.995 | 1.011 | 0.979 | 0.995 | 1.000 | 1.000 | 1.000 | 1.000 | 1.000 | 1.000 |
| Denmark | 0.968 | 1.024 | 0.996 | 1.000 | 1.002 | 1.001 | 0.984 | 1.019 | 1.001 | 0.984 | 1.004 | 0.994 |
| Hungary | 1.003 | 0.995 | 0.999 | 0.983 | 0.995 | 0.989 | 1.000 | 1.000 | 1.000 | 1.020 | 1.000 | 1.010 |
| Norway | 0.999 | 1.002 | 1.001 | 0.996 | 0.993 | 0.995 | 1.034 | 0.991 | 1.012 | 0.970 | 1.018 | 0.994 |
| Korea | 1.019 | 1.009 | 1.014 | 0.996 | 1.008 | 1.002 | 1.003 | 1.000 | 1.002 | 1.020 | 1.001 | 1.011 |
| Estonia | 1.082 | 0.974 | 1.027 | 1.007 | 0.974 | 0.990 | 1.000 | 1.000 | 1.000 | 1.075 | 1.000 | 1.037 |
| Israel | 1.016 | 1.046 | 1.031 | 1.016 | 1.046 | 1.031 | 1.000 | 1.000 | 1.000 | 1.000 | 1.000 | 1.000 |
| Mean Unitary | 0.991 | 1.003 | 0.997 | 0.999 | 0.994 | 0.997 | 0.999 | 0.996 | 0.998 | 0.992 | 1.013 | 1.003 |
| Austria | 0.995 | 1.018 | 1.007 | 1.003 | 0.985 | 0.994 | 1.015 | 1.035 | 1.025 | 0.978 | 0.999 | 0.988 |
| Switzerland | 1.007 | 1.010 | 1.009 | 0.999 | 1.006 | 1.003 | 1.012 | 0.998 | 1.005 | 0.996 | 1.007 | 1.001 |
| Canada | 1.009 | 1.014 | 1.011 | 0.994 | 1.008 | 1.001 | 1.000 | 1.000 | 1.000 | 1.015 | 1.006 | 1.011 |
| Germany | 1.000 | 1.051 | 1.025 | 0.998 | 1.013 | 1.005 | 1.000 | 1.000 | 1.000 | 1.002 | 1.037 | 1.019 |
| United States | 1.036 | 1.018 | 1.027 | 1.008 | 1.018 | 1.013 | 1.000 | 1.000 | 1.000 | 1.028 | 1.000 | 1.014 |
| Spain | 1.013 | 1.072 | 1.042 | 0.986 | 1.019 | 1.002 | 1.032 | 1.010 | 1.021 | 0.995 | 1.042 | 1.018 |
| Mean Federal | 1.014 | 1.038 | 1.026 | 0.996 | 1.014 | 1.005 | 1.008 | 1.002 | 1.005 | 1.010 | 1.021 | 1.016 |
| M–W U test | 654 | 509 | 1.865 | 788 | 660 | 2340 | 735.5 | 585 | 2197.5 | 692 | 719 | 2333 |
| p-value | 0.3426 | 0.0168 | 0.0198 | 0.7094 | 0.3738 | 0.7119 | 0.8751 | 0.0714 | 0.2849 | 0.5651 | 0.7572 | 0.687 |
Disclaimer/Publisher’s Note: The statements, opinions and data contained in all publications are solely those of the individual author(s) and contributor(s) and not of MDPI and/or the editor(s). MDPI and/or the editor(s) disclaim responsibility for any injury to people or property resulting from any ideas, methods, instructions or products referred to in the content. |
© 2024 by the authors. Licensee MDPI, Basel, Switzerland. This article is an open access article distributed under the terms and conditions of the Creative Commons Attribution (CC BY) license (https://creativecommons.org/licenses/by/4.0/).
Share and Cite
Mercadier, A.C.; Belmonte-Martín, I.; Ortiz, L. Falling Short on Long-Term Care Efficiency Change? A Non-Parametric Approach. Economies 2024, 12, 341. https://doi.org/10.3390/economies12120341
Mercadier AC, Belmonte-Martín I, Ortiz L. Falling Short on Long-Term Care Efficiency Change? A Non-Parametric Approach. Economies. 2024; 12(12):341. https://doi.org/10.3390/economies12120341
Chicago/Turabian StyleMercadier, Augusto Carlos, Irene Belmonte-Martín, and Lidia Ortiz. 2024. "Falling Short on Long-Term Care Efficiency Change? A Non-Parametric Approach" Economies 12, no. 12: 341. https://doi.org/10.3390/economies12120341
APA StyleMercadier, A. C., Belmonte-Martín, I., & Ortiz, L. (2024). Falling Short on Long-Term Care Efficiency Change? A Non-Parametric Approach. Economies, 12(12), 341. https://doi.org/10.3390/economies12120341