4.1. The Results of the IO Model for Socio-Economic Impact Based on University Spending
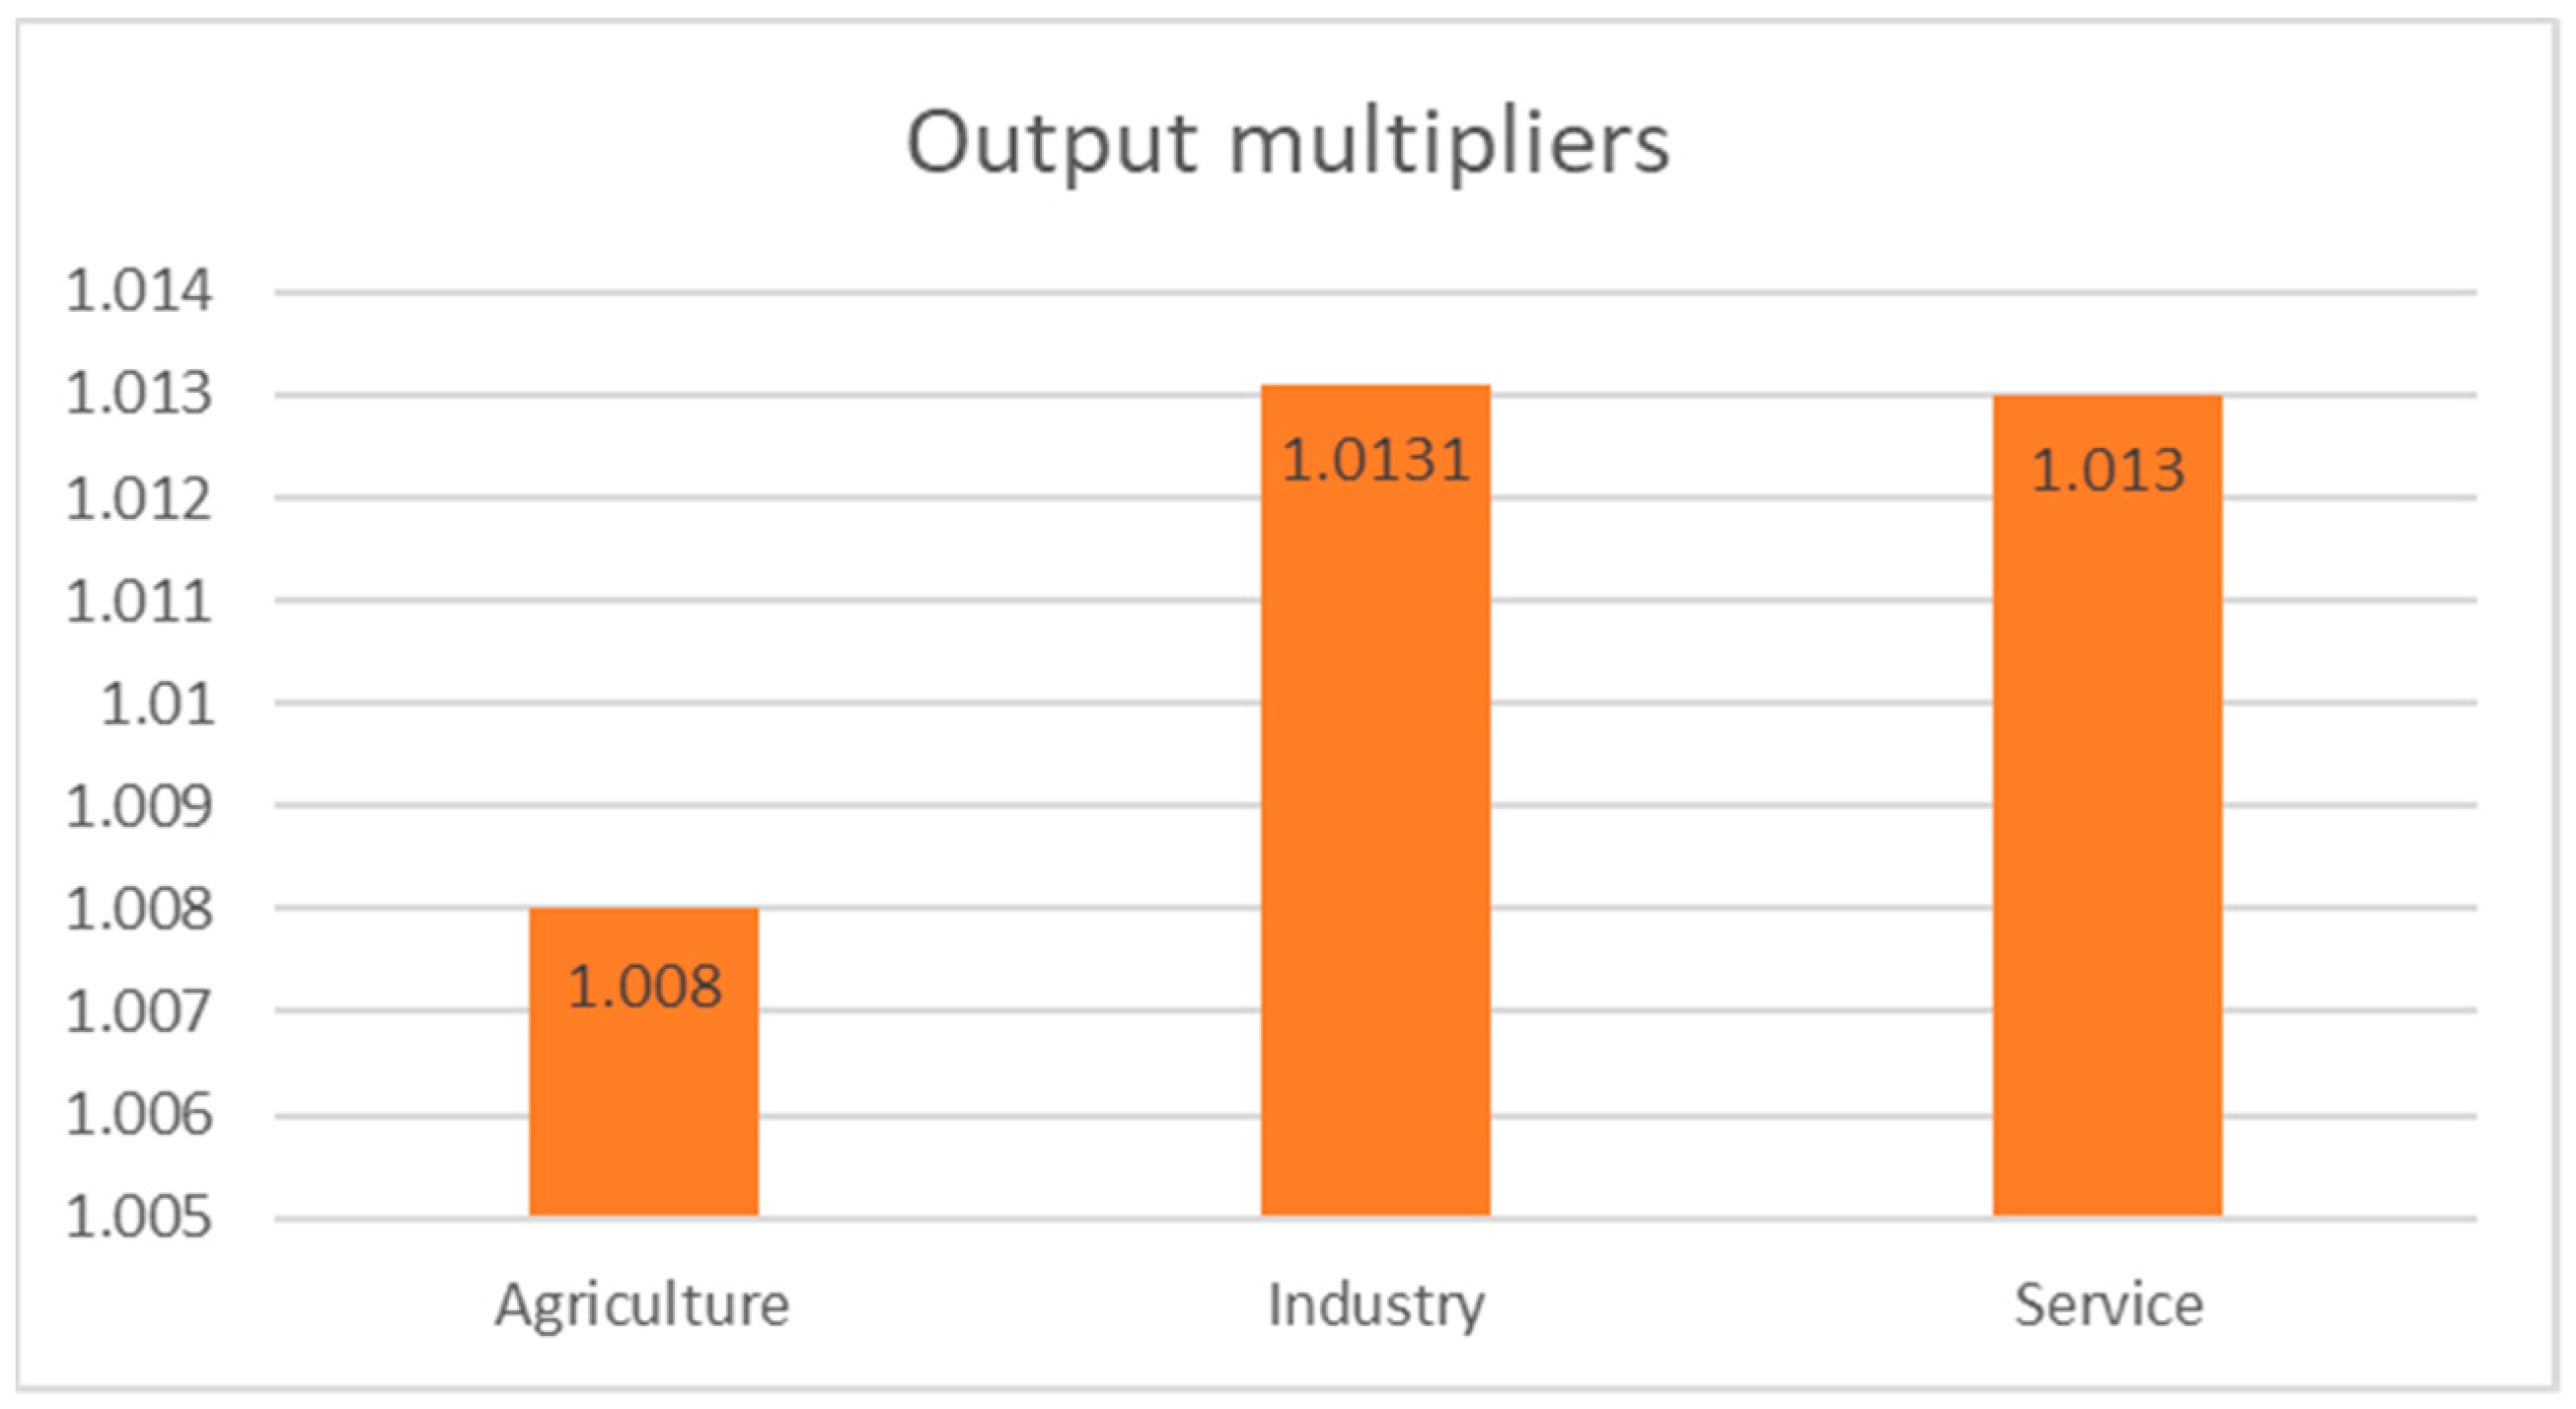
According to Chiang Mai University, it is the largest university in the north of Thailand. This university was allocated a budget supported by the government, ranked number two in the country, amounting to THB 5788 million in 2023. Therefore, this university must play a significant and responsible role in the utilization of the budget, impacting the socioeconomic status of Thailand. From the calculation of output multipliers, it can be summarized and grouped into three sectors. The first sector is the agriculture sector, with an average output multiplier of 1.0080. The second sector is the industrial sector, with an average output multiplier of 1.0131. The last sector is the service sector, with an average output multiplier of 1.0130 (see
Table 1 and
Figure 5).
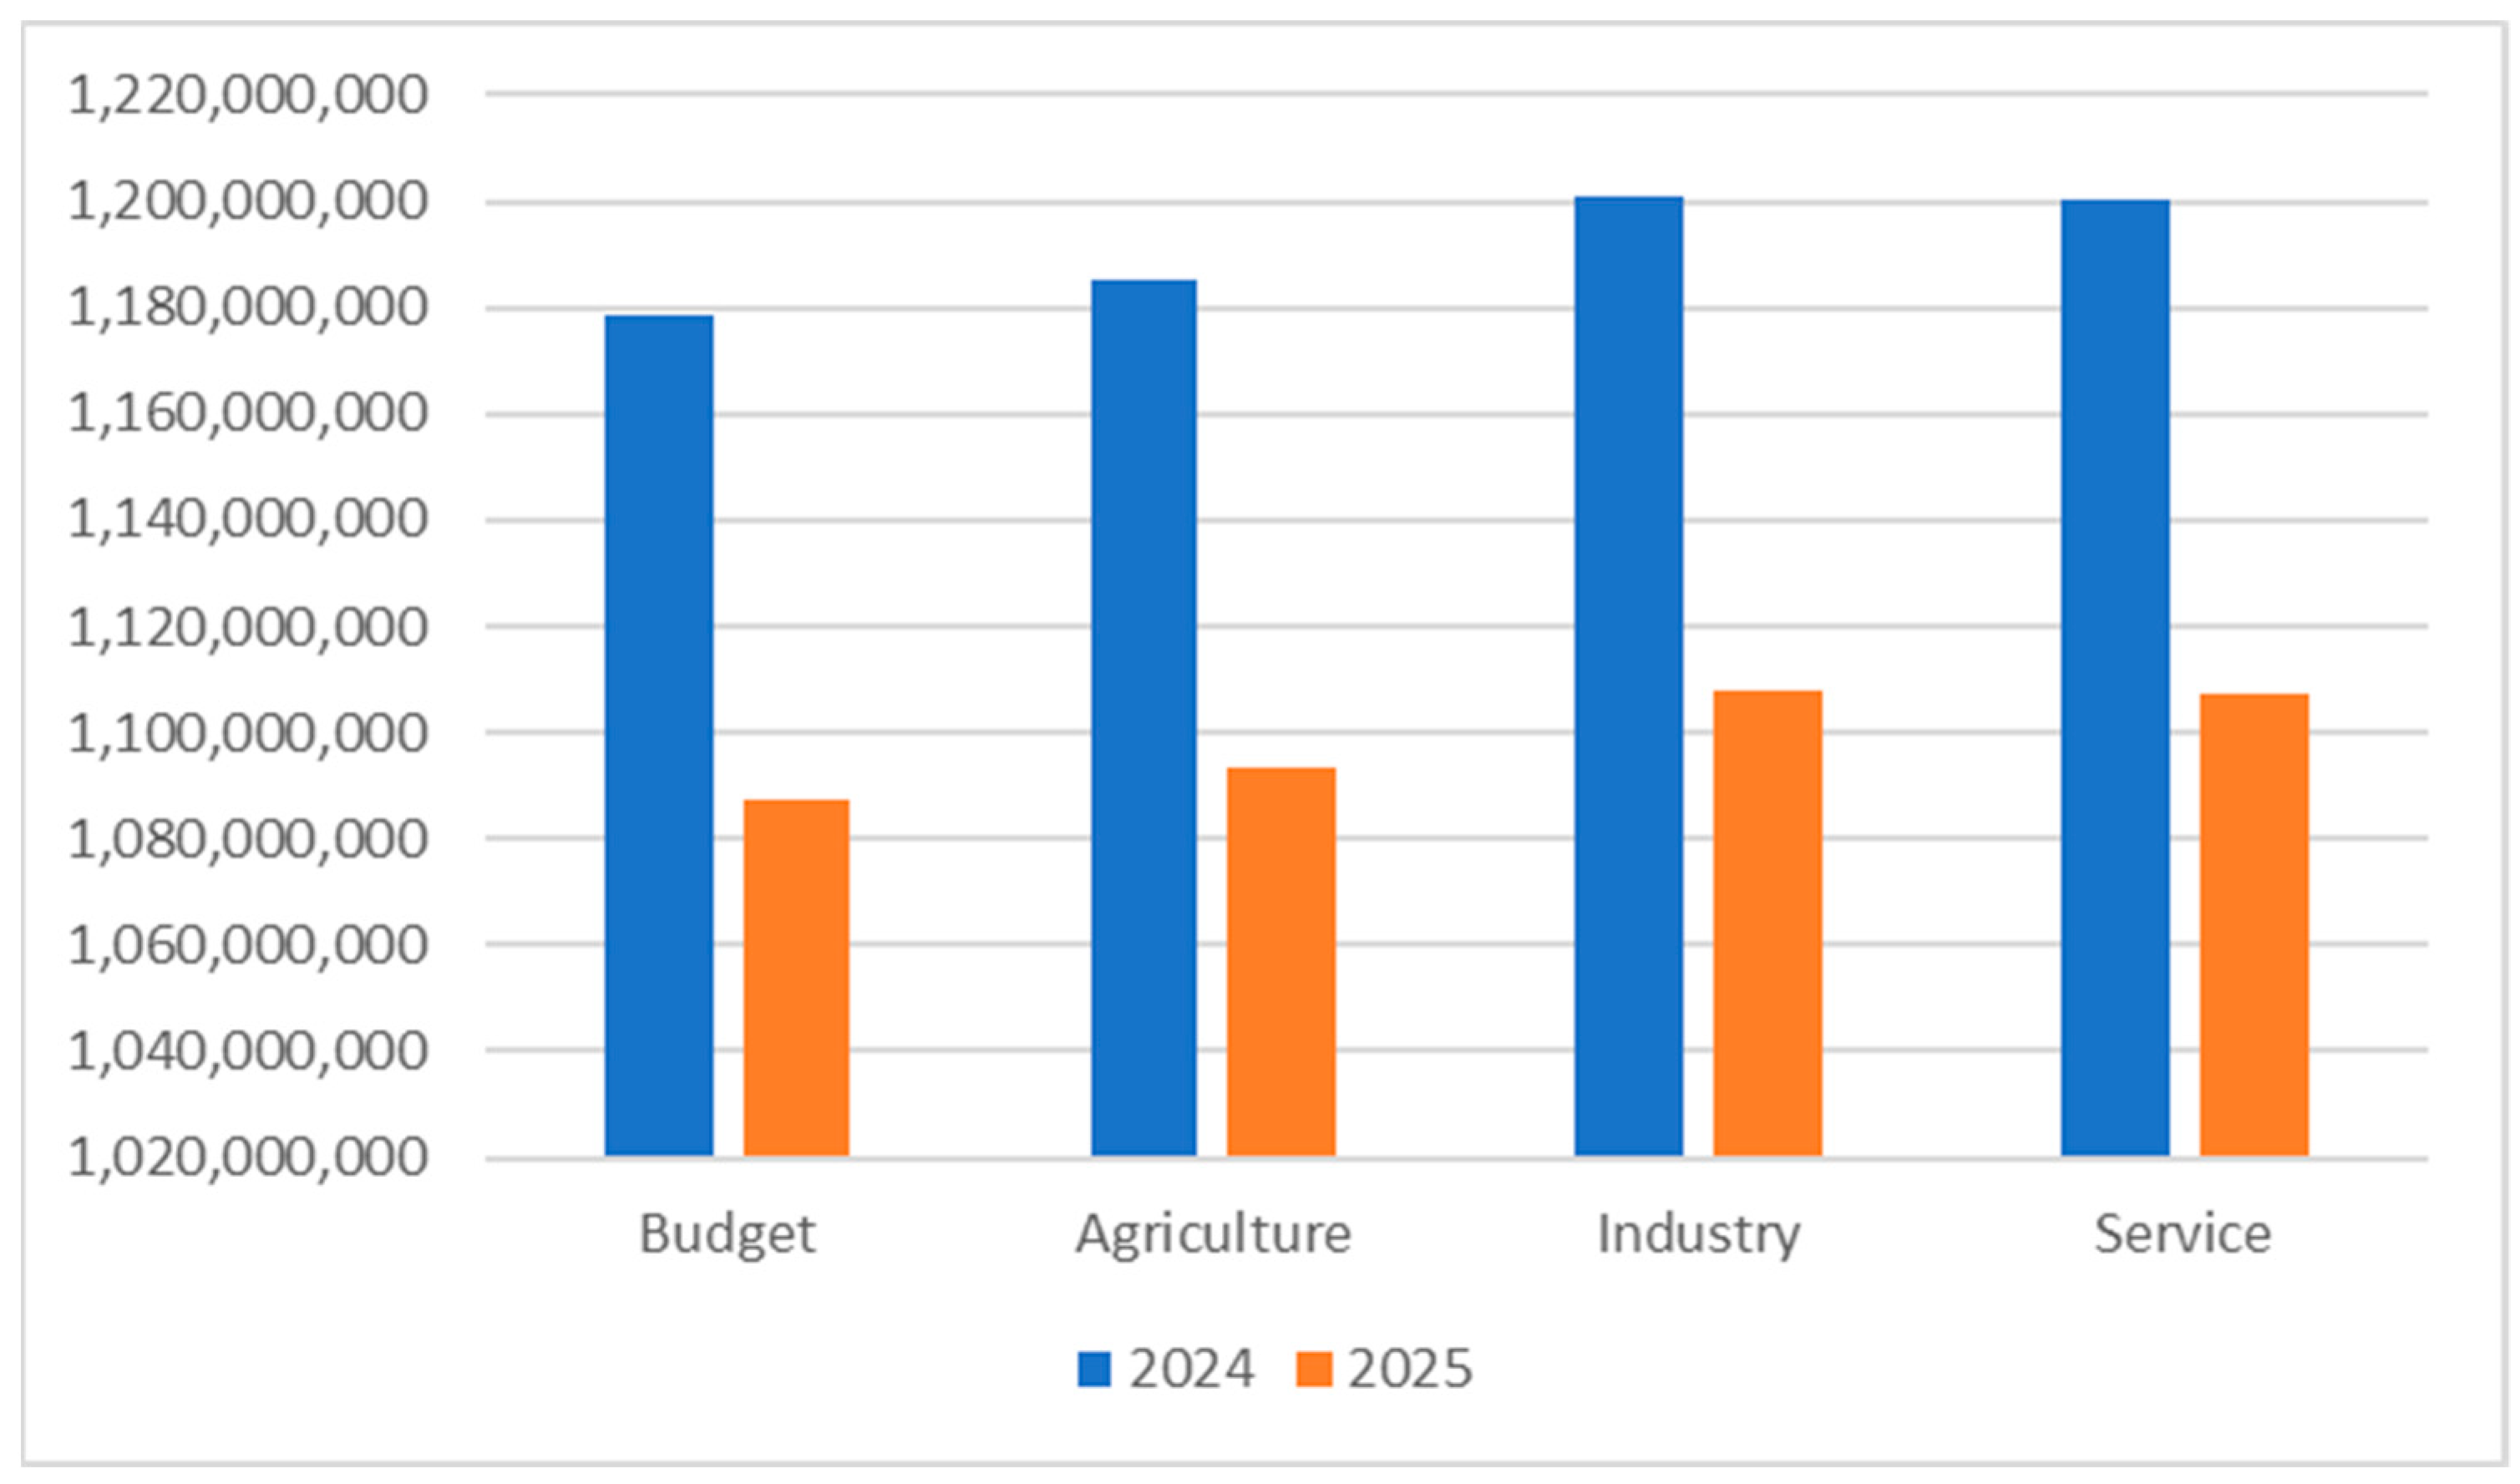
From the economic impact results, the economic impact of Chiang Mai University in terms of output effect on the northern economy from 2024 to 2025 can be summarized in the following
Table 2 and
Figure 6.
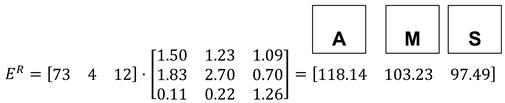
The following are the findings determined from the economic impact of Chiang Mai University in terms of output effect on the northern economy from 2024 to 2025: In 2024, there was an impact on agriculture of THB 1,187,990,194; in the industrial sector of THB 1,194,000,858; and, in the service sector, of THB 1,193,883,002. In 2025, there was an impact on the agriculture sector of THB 1,095,981,970; in the industrial sector of THB 1,101,527,116; and, in the service sector, of THB 1,101,418,388, respectively.
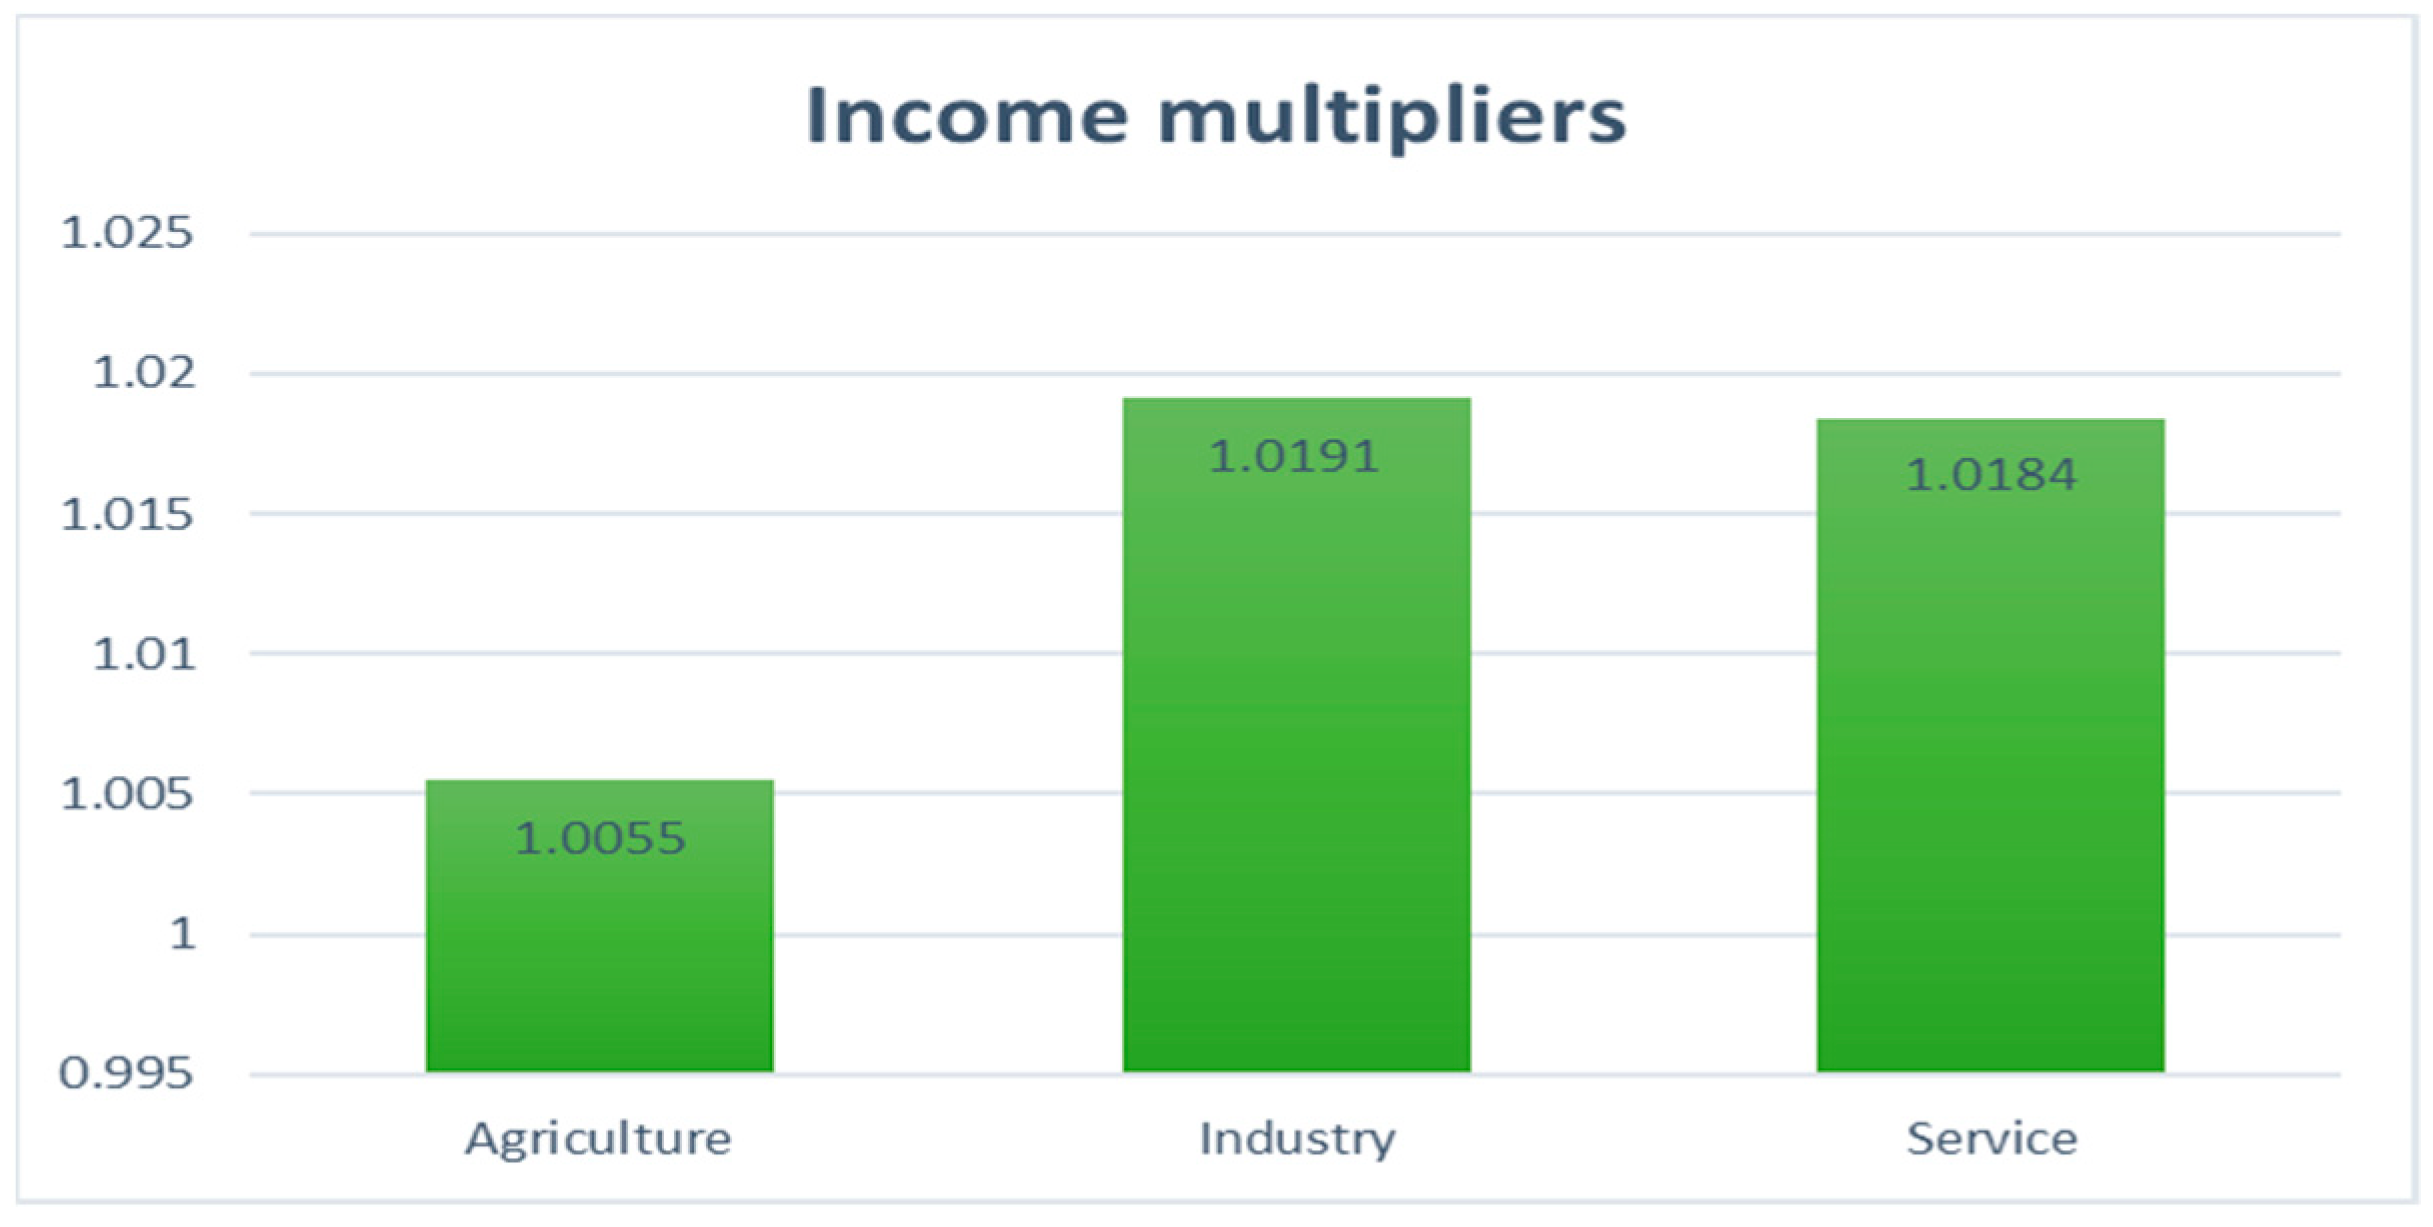
The calculation of income multipliers can be summarized and grouped into three averages. The first aspect is the agriculture sector, with an average income multiplier equal to 1.0055; the second aspect is the industrial sector, with an average income multiplier equal to 1.0191; and the last aspect is the service sector, with an average income multiplier equal to 1.0184, as can be seen in
Table 3 and
Figure 7.
From the economic impact results, the economic impact of Chiang Mai University in terms of income effect on the northern economy from 2024 to 2025 can be summarized in the following
Table 4 and
Figure 8.
The following are the findings determined from the economic impact of Chiang Mai University in terms of income effect on the northern economy from 2024 to 2025. In 2024, there was an impact on the agriculture sector of THB 1,185,043,789; in the industrial sector of THB 1,201,072,228; and, in the service sector, of THB 1,200,247,235. In 2025, there was an impact on the agriculture sector of THB 1,093,263,760; in the industrial sector of THB 1,108,050,819; and, in the service sector, of THB 1,107,289,720, respectively.
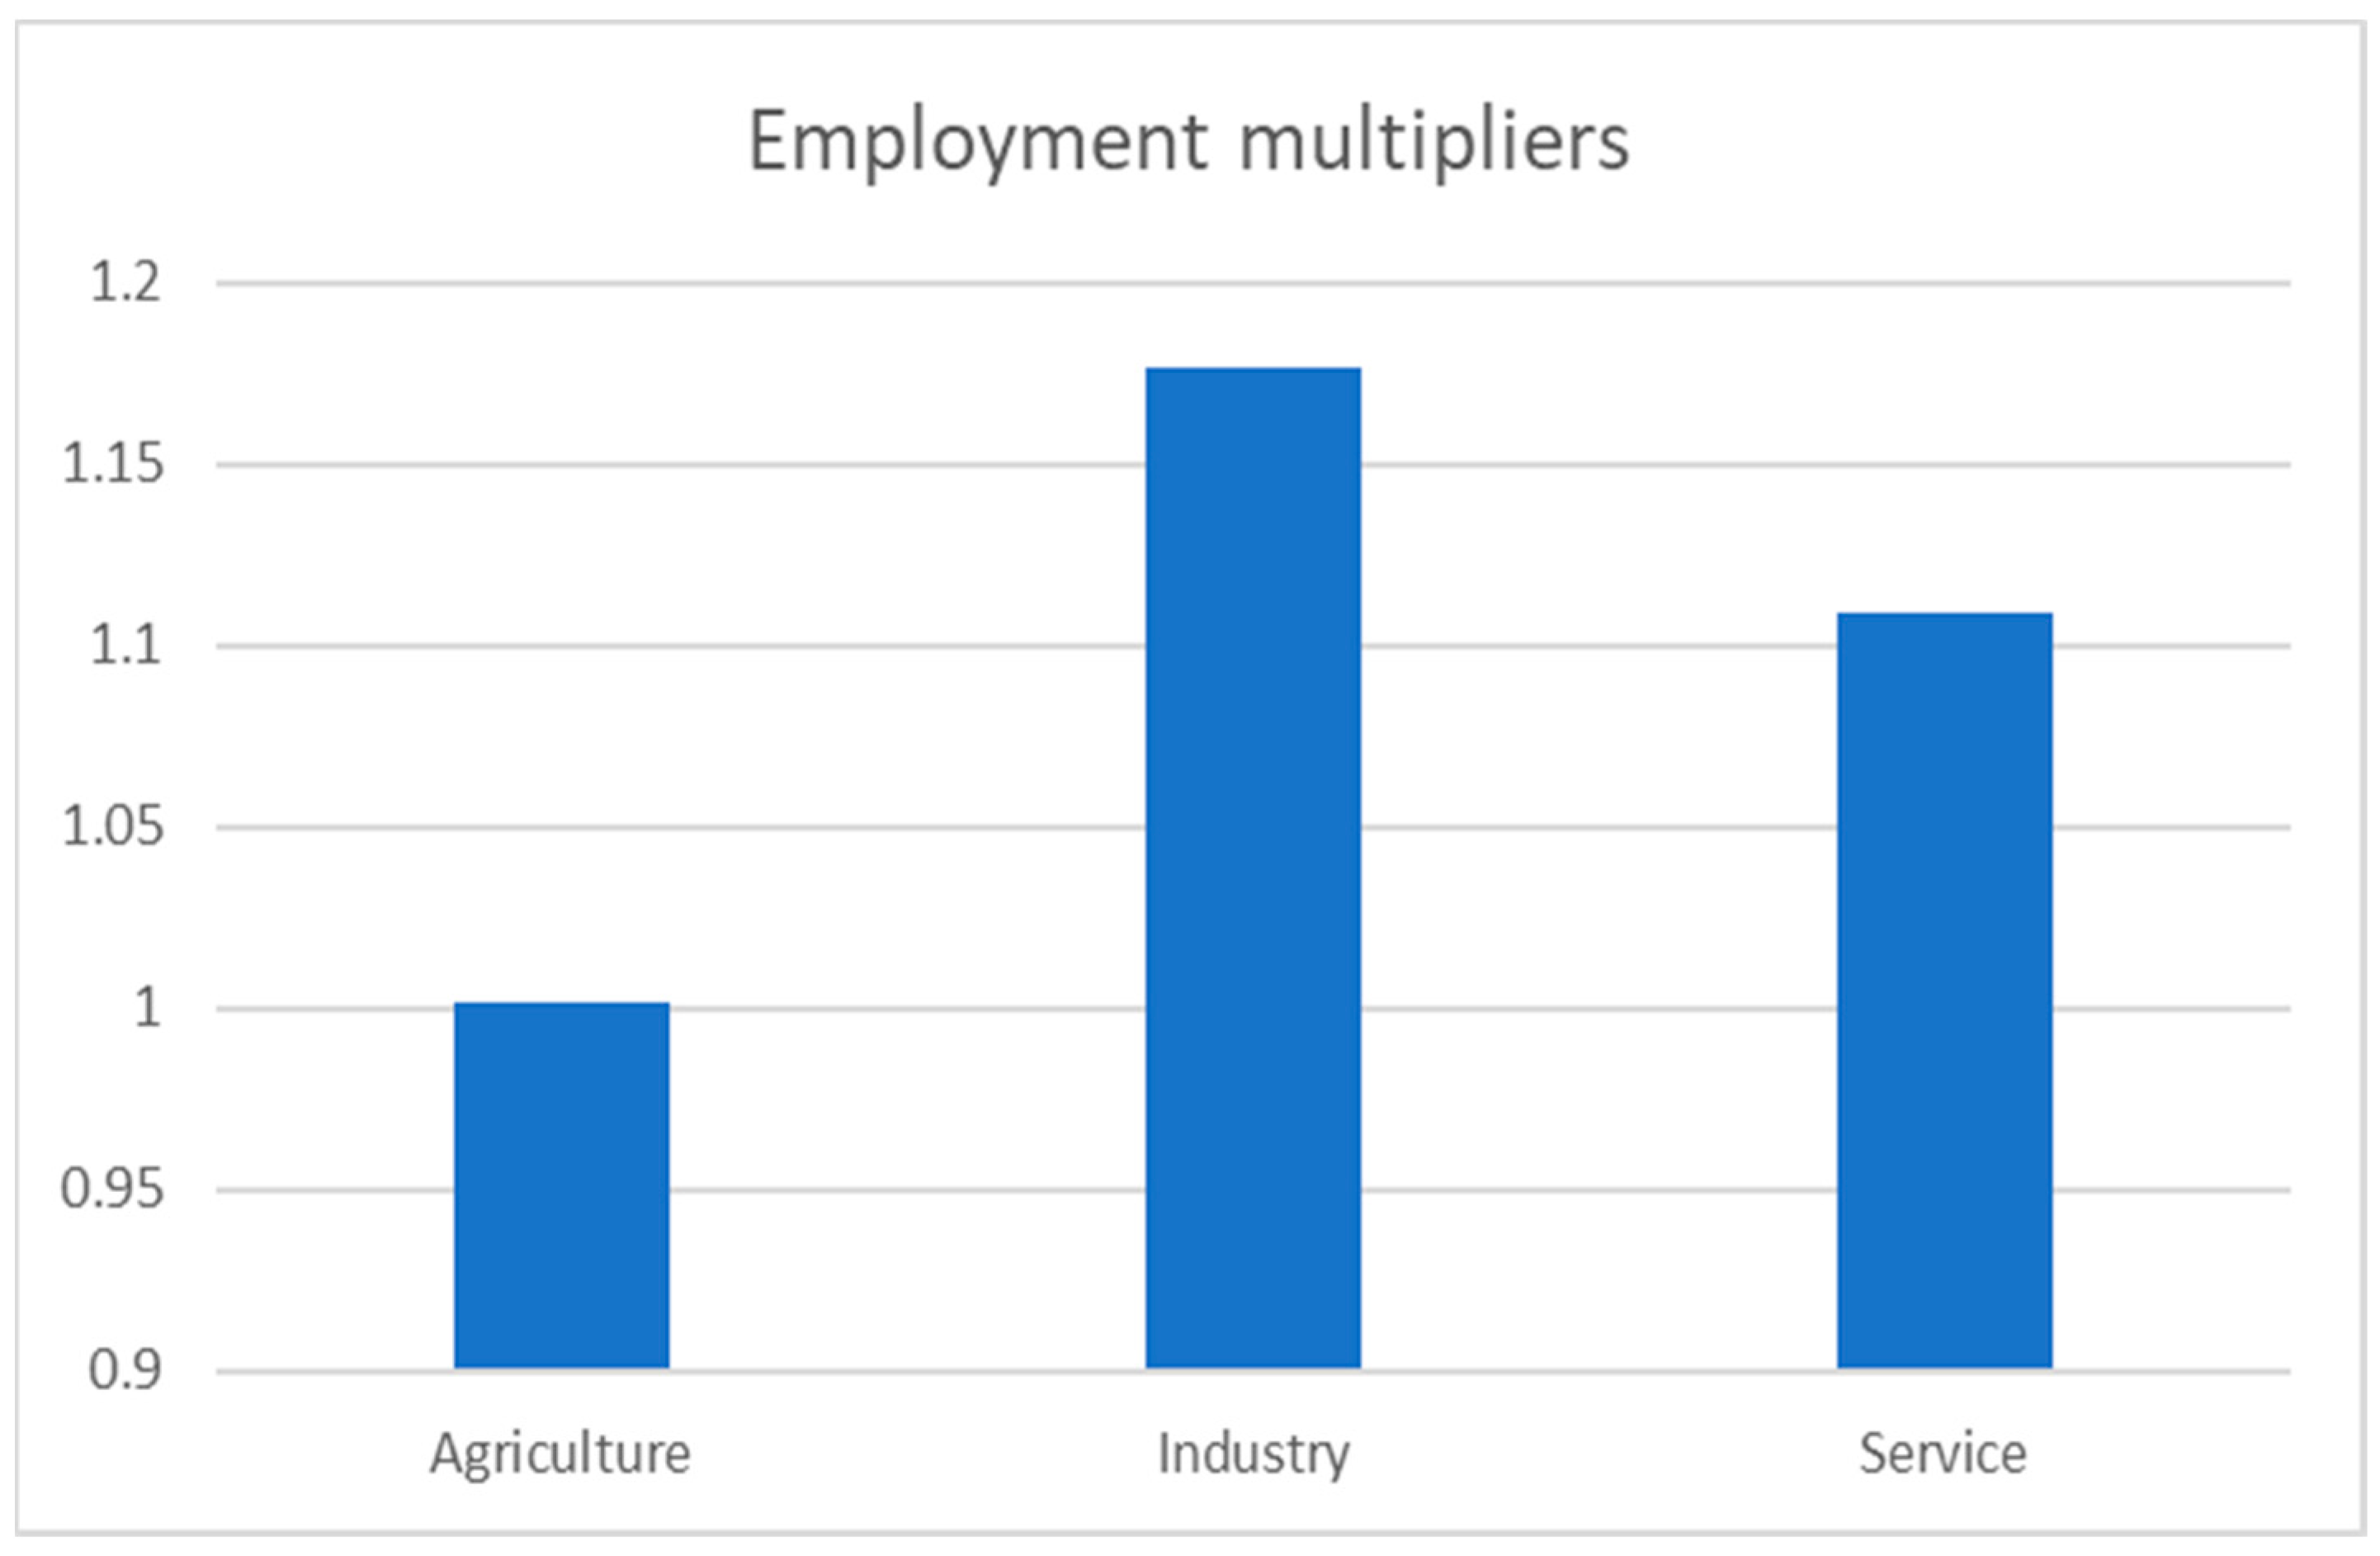
The calculation of employment multipliers can be summarized and grouped into three averages. The first aspect is the agriculture sector, with an average employment multiplier of 1.0021; the second aspect is the industry sector, with an average employment multiplier of 1.1762; and the last aspect is the service sector, with an average employment multiplier of 1.1089, as can be seen in
Table 5 and
Figure 9.
Chiang Mai University’s socioeconomic impact can be assessed through its contribution to employment generation, driven by the institution’s expenditures and activities, utilizing the employment multiplier effect. This effect captures the total employment impact resulting from university operations.
For example, suppose that, when Chiang Mai University’s expenditure and activities are approximately THB 1,000,000 the effect of socioeconomic impact equals 1,002,100 (1,000,000 × 1.0021 = 1,002,100). Because this spending and these activities transfer to the agriculture sector, this money is able to create jobs or employment for more than 704 workers (1 Baht = 0.0007 workers). In the same way, when Chiang Mai University’s expenditure and activities are approximately THB 1,000,000, and it transfers to the industry sector, it would create jobs for more than 133 workers (1,000,000 × 1.1762 = 1,176,200; 1 Baht = 0.0001 workers). For the service sector, when Chiang Mai University’s expenditure and activities are approximately THB 1,000,000, and it transfers to the service sector, it would create jobs for 267 workers (1,000,000 × 1.1089 = 1,108,900; 1 Baht = 0.0002 workers), respectively.
4.2. The Results of Socio-Economic Impact Based on Teaching and Learning Activities
For the result of the economic impact of Chiang Mai University’s expenditure and activities, the direct impact of teaching and learning activities is shown in
Table 6. It is the economic impact based on the educational group, which is classified by the International Standard Classification of Education (ISCED) into ten groups (
UNESCO 2015). The estimated direct economic impact of Chiang Mai University in producing 6972 graduates in 2023 is equal to THB 2,071,874,186.31. The highest average cost per graduate, THB 1,011,296.00, is in the Health and Welfare group, while the lowest average cost per graduate, THB 330,565.90, is in the Business Administration and Law group. The curriculum in the Health and Welfare group includes Medicine, Dentistry, Nursing, Pharmacy, and Medical Sciences, which, on average, takes longer to complete than other groups of education. This longer completion time could be another reason that the cost per graduate in these groups of curricula is notably higher than in other groups, rather than just the fixed and material costs.
The indirect impact, which is estimated from the return on education, is shown in
Table 7. From all models, demonstrates that salary positively correlates with male sex, GPAX, and age. Under control variables are curriculum, hometown, and parental occupation. Under fixed effects in model 3, a one-point increase in GPAX leads to about a THB 2667 increase in salary, which is statistically significant at the 0.01 level. In addition, the male variable also has a positive influence correlated with the salary of CMU’s students. It can be implied that male students can potentially receive a salary higher than that of other sexes by approximately THB 2471, which is statistically significant at the 0.01 level. The last independent variable is age; this factor also positively influences the salary of CMU’s students, which is statistically significant at the 0.01 level. This finding means that the higher age of a student has the potential to receive a salary approximately increased by THB 1189. In terms of control variables, the curriculum, hometown, and parental occupation are appropriate to control for and explain the salary of CMU’s students because the R
2 of this model estimation is the highest (see
Table 7).
Next, this research study utilizes the estimated coefficients in model 3 to predict individual salaries based on their personal characteristics (highest R
2). The predicted salary is then multiplied by the number of graduates in each curriculum and the regional multiplier in income, 1.006. Therefore, the result portrays the total indirect economic impact categorized by the educational group in
Table 8.
The group that generates the highest economic return is the Information and Communication Technology (ICT) group, which, on average, generates THB 42,040.89 of monthly income. To estimate economic impact, this research study excludes the samples who work abroad. It turns out that the Health and Welfare group generates the highest total indirect economic impact at THB 39,409,458.59. This finding is also influenced by the largest portion of the graduates in the Health and Welfare group compared to others. Among the 6972 graduates, the graduates who are categorized in the Health and Welfare group equal 1331 individuals or about 19 percent of the total graduates. In total, in 2023, the indirect economic impact of teaching and learning activities of Chiang Mai University is estimated to be THB 164,023,280.99.
4.3. The Result of SROI Model Prediction
This research study attempts to look for the best machine learning algorithms to predict the value of the SROI of Chiang Mai University for each academic project before the university grants funding to those projects. In terms of the results for feature selection, it can display the correlation among them (see
Table 9).
In machine learning, the selection of appropriate input features is critical for the model’s accuracy and effectiveness. By analyzing the correlation between features and the target variable (SROI), this research study aims to identify the most influential features. The correlation between each feature and the target variable was assessed, resulting in the following values (see
Table 9). The data indicate that the Budget attribute, with a correlation value of 0.4952, is the most significant predictor of the SROI, while the Time attribute, with a correlation of 0.0374, is the least significant. According to data stability, the stability of each feature was evaluated to ensure that the features contain a diverse range of values, which is essential for effective classification in machine learning tasks. Features with less variation contribute less to the model’s predictive power (see
Table 10).
From
Table 10, the results show that the Time feature exhibits the highest stability at 17.76%, suggesting that it may offer less utility in distinguishing between different SROI outcomes. By employing these methods, we aim to optimize the model’s performance by focusing on the most relevant and variable features, thereby enhancing the accuracy of SROI predictions.
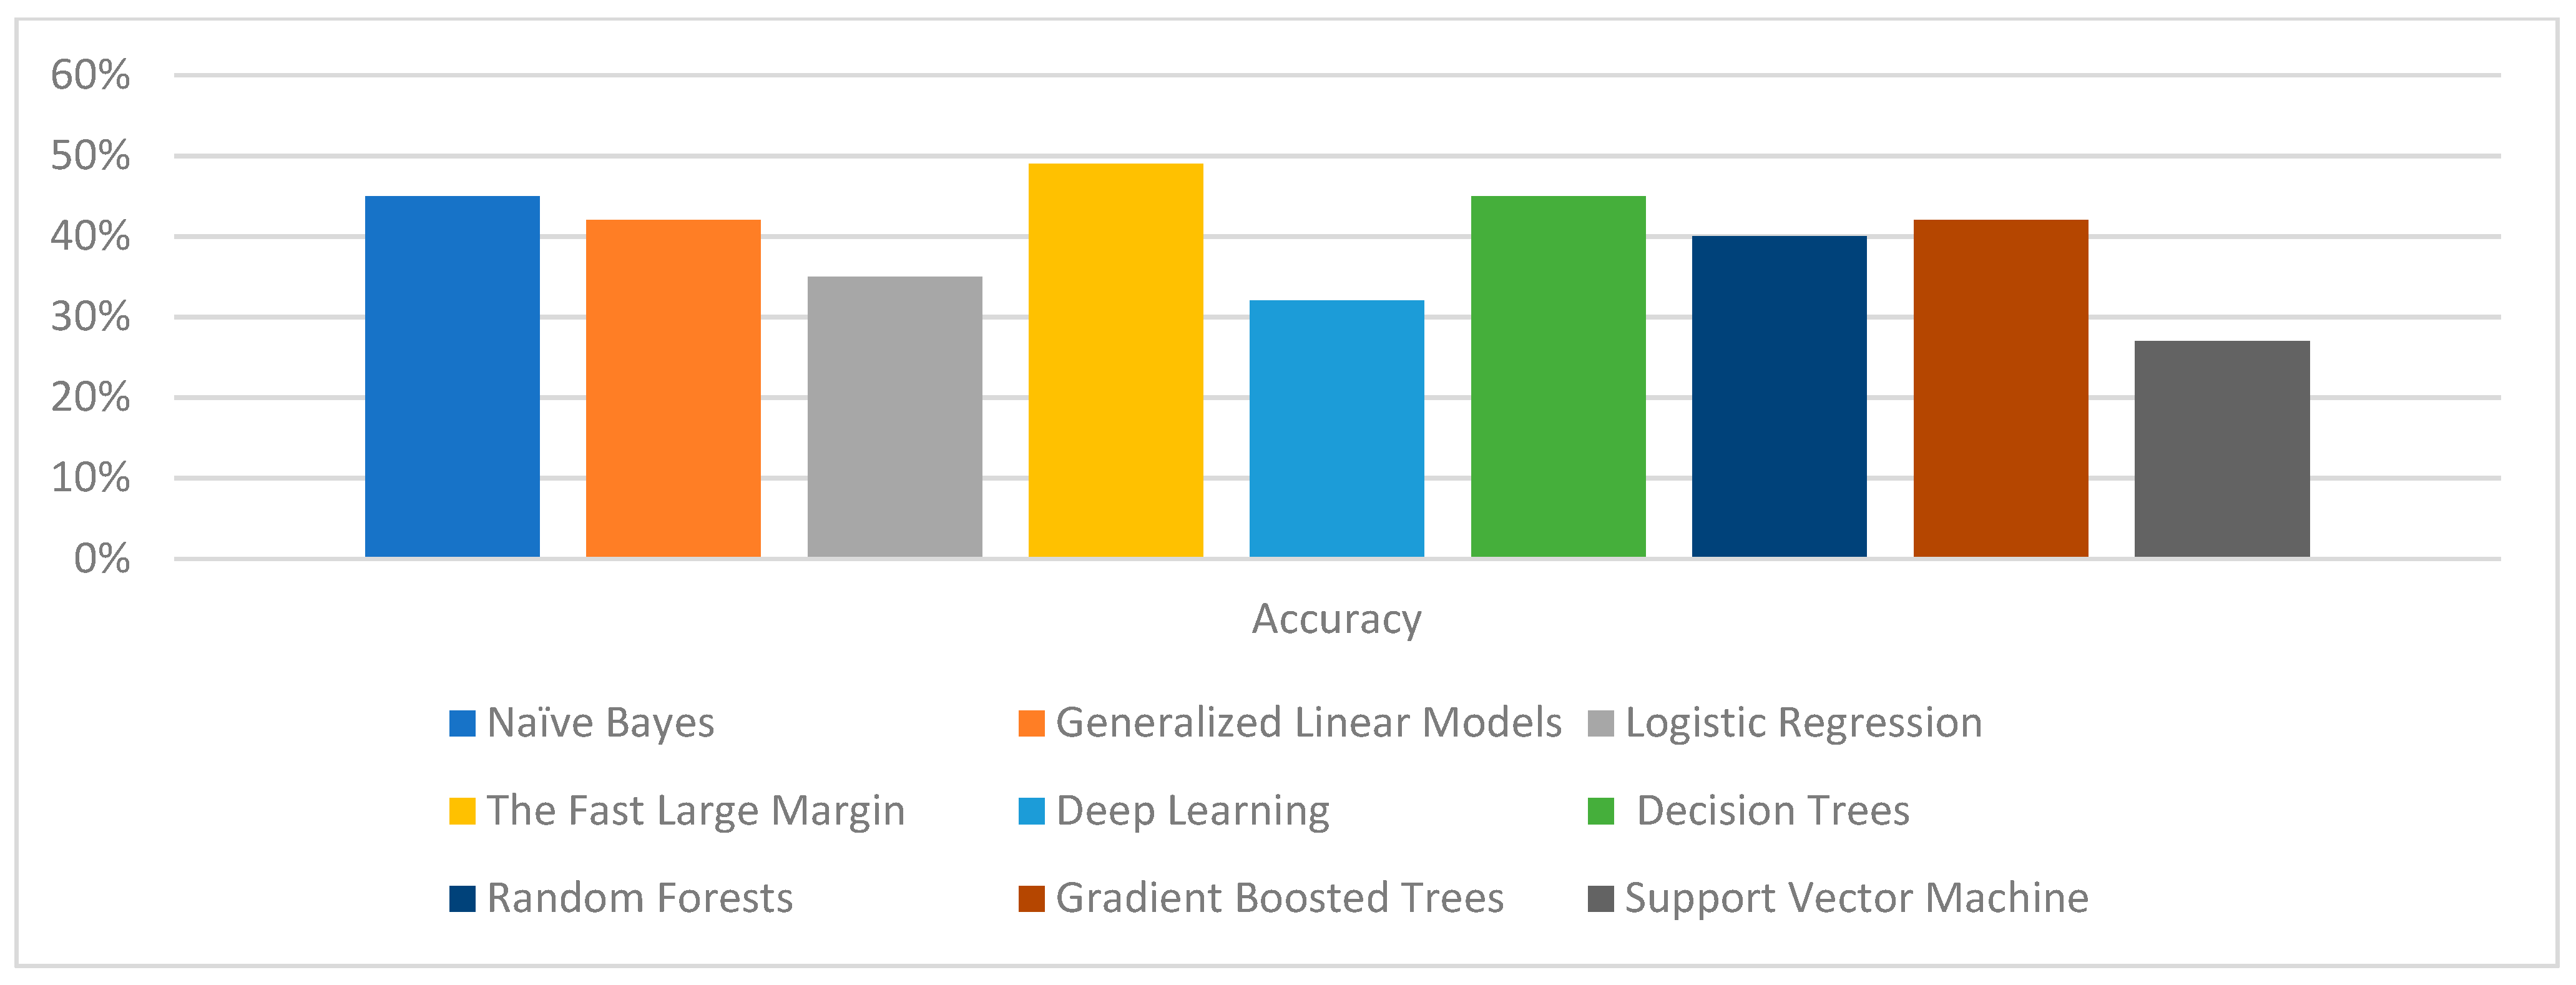
According to the model training and testing results, it is crucial to select an appropriate machine learning algorithm for SROI predictions. The dataset contains input features and output targets (SROIs), making it suitable for a supervised learning approach. Possible algorithms include Naïve Bayes, Generalized Linear Models, Logistic Regression, the Fast Large Margin, Deep Learning, Decision Trees, Random Forests, Gradient Boosted Trees, and Support Vector Machines. This project treats SROI predictions as a classification task, necessitating the grading of the SROI historical dataset (see
Table 11). The choice of grading levels can significantly impact model accuracy, as more grades may increase the risk of incorrect predictions.
Table 11 shows the criteria for various grading levels.
After evaluating the models using Altair AI Studio (see
Figure 10 and
Table 12), the Fast Large Margin model was found to have the highest accuracy among the options. Along with this model, the Decision Tree and Naïve Bayes were also selected for their notable performance in predicting the SROI (see
Table 12).
However, the Fast Large Margin model, initially selected for its high accuracy, showed a slight decrease from 49% in Altair Studio to 45% in Python (see
Table 12). Despite this decrease, it remains a key model for forecasting SROI grades due to its overall performance. The Decision Tree model improved in accuracy when implemented in Python, while the Naïve Bayes model maintained consistent accuracy across both platforms (see
Table 12).


 ,
, 


