
Can the Use of Digital Finance Promote the Enhancement and Quality Improvement of Household Consumption Among Farmers?


Abstract
1. Introduction
2. Theoretical Analysis and Research Hypothesis
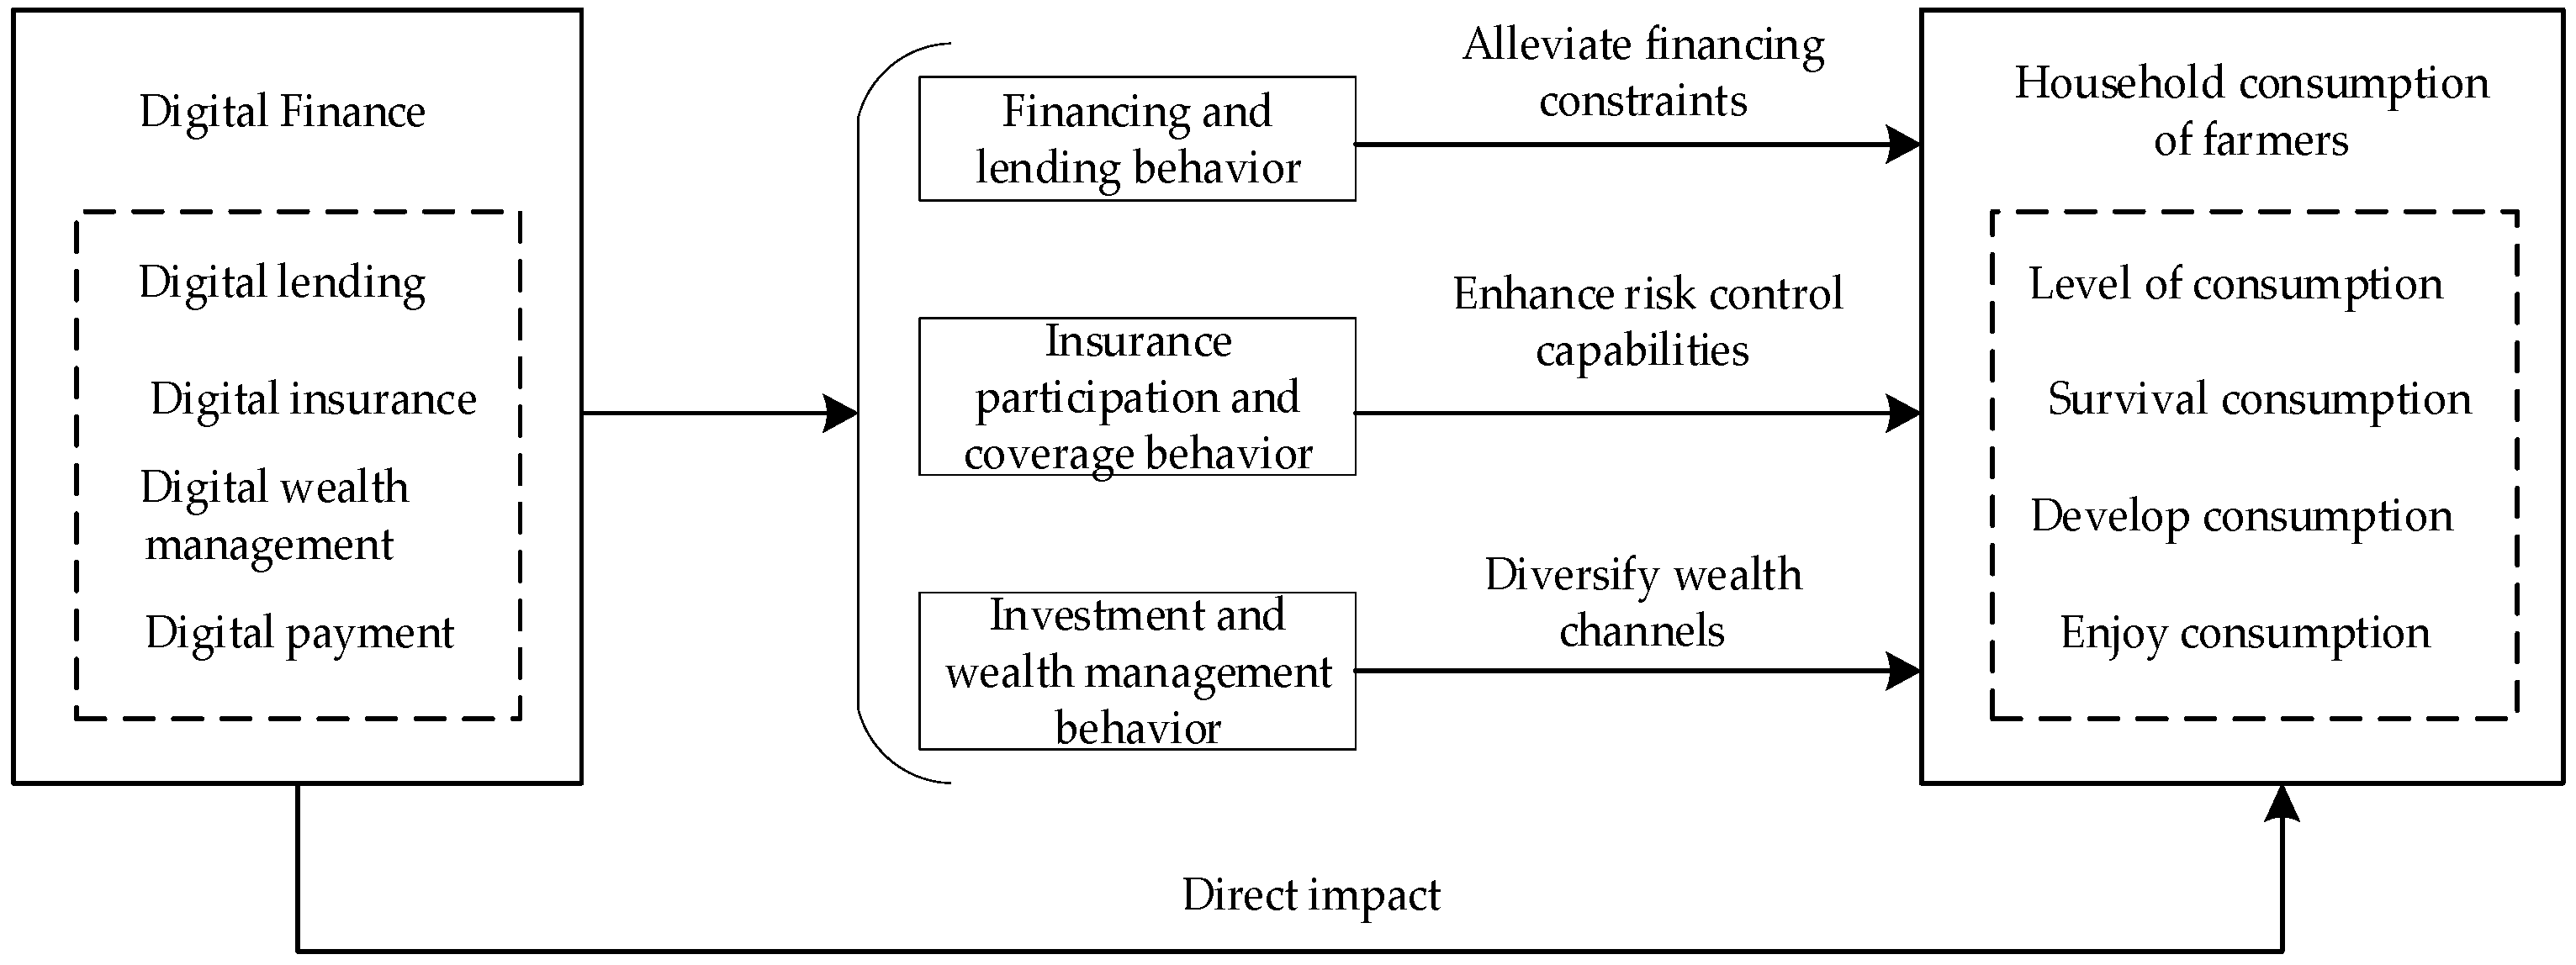
2.1. The Impact of Digital Finance Usage on Household Consumption Behavior Among Farmers
2.2. The Credit Constraint Mechanism Through Which Digital Finance Usage Affects Household Consumption Behavior Among Farmers
2.3. The Risk Prevention Mechanism Through Which Digital Finance Usage Affects Household Consumption Behavior Among Farmers
2.4. The Wealth Management Benefit Mechanism Through Which Digital Finance Usage Affects Household Consumption Behavior Among Farmers
3. Data, Models, and Variables
3.1. Data
3.2. Models
3.3. Variables
3.3.1. Dependent Variable: Household Consumption of Farmers
3.3.2. Explanatory Variable: Digital Financial Usage
3.3.3. Control Variables
4. Empirical Analysis
4.1. Basic Regression Analysis
4.2. Robustness Check Analysis
4.2.1. Based on the Cumulative Scoring Digital Financial Usage Indicator
4.2.2. Changing the Measurement Indicator for the Dependent Variable
4.2.3. Excluding Samples of Households with Self-Reported High Financial Literacy
4.3. Handling Endogeneity Issues
4.4. Impact Mechanism Test
4.5. Heterogeneity Analysis
4.5.1. Analysis Based on Differences in Income Levels and Education Levels
4.5.2. Based on Differences in Community Basic Service Levels
5. Research Conclusions and Implications
Author Contributions
Funding
Informed Consent Statement
Data Availability Statement
Conflicts of Interest
Correction Statement
| 1 | Source: National Bureau of Statistics, https://www.stats.gov.cn/xxgk/jd/sjjd2020/202101/t20210119_1812623.html (accessed on 12 September 2024). |
| 2 | Source: National Bureau of Statistics, “2020 Resident Income and Consumption Expenditure,” https://www.stats.gov.cn/sj/zxfb/202302/t20230203_1900970.html (accessed on 12 September 2024). |
References
- Abreu, Margarida, and Victor Mendes. 2010. Financial literacy and portfolio diversification. Quantitative Finance 10: 515–28. [Google Scholar] [CrossRef]
- Agarwal, Sumit, Souphala Chomsisengphet, and Cheryl Lim. 2017. What shapes consumer choice and financial products? A review. Annual Review of Financial Economics 9: 127–46. [Google Scholar] [CrossRef]
- Allais, Maurice. 1952. Quelques réflexions sur la contrainte et la liberté. Revue Française De Science Politique 2: 356–73. [Google Scholar] [CrossRef]
- Anderson, Anders, Forest Baker, and David T. Robinson. 2017. Precautionary savings, retirement planning, and misperceptions of financial literacy. Journal of Financial Economics 126: 383–98. [Google Scholar] [CrossRef]
- Cao, Guohua, Nan Wang, and Chenglin Ren. 2020. Cognitive ability, financial knowledge, and household demand for commercial insurance. Financial Forum 25: 48–58. [Google Scholar]
- Chamon, Marcos D., and Eswar S. Prasad. 2010. Why are saving rates of urban households in China rising. American Economic Journal 2: 93–130. [Google Scholar] [CrossRef]
- Chen, Zhanbo, Wenji Huang, and Xionglei Hao. 2021. The impact of mobile payment on rural consumption in China. Macroeconomic Research 5: 132–43. [Google Scholar]
- Deuflhard, Florian, Dimitris Georgarakos, and Roman Inderst. 2019. Financial literacy and savings account returns. Journal of the European Economic Association 17: 131–64. [Google Scholar] [CrossRef]
- Dinkova, Milena, Adriaan Kalwij, and Rob Alessie. 2021. Know more, spend more? The impact of financial literacy on household consumption. De Economist 169: 469–98. [Google Scholar] [CrossRef]
- Dohmen, Thomas, Armin Falk, David Huffman, and Uwe Sunde. 2018. On the relationship between cognitive ability and risk preference. Journal of Economic Perspectives 32: 115–34. [Google Scholar] [CrossRef]
- Du, Danqing. 2017. Driving mechanisms of internet-driven consumption upgrading. Economist 3: 48–54. [Google Scholar]
- Fang, Fuqian, and Jian Yu. 2014. Evolution of resident consumption theory and empirical facts. Economic Dynamics 3: 11–34. [Google Scholar]
- Gan, Li, Naibao Zhao, and Yongzhi Sun. 2018. Income inequality, liquidity constraints, and the household savings rate in China. Economic Research Journal 53: 34–50. [Google Scholar]
- He, Zongyue, and Xuguang Song. 2020. How does digital finance development affect household consumption. Finance and Trade Economics 41: 65–79. [Google Scholar]
- He, Zongyue, Xun Zhang, and Guanghua Wan. 2020. Digital finance, digital divide, and multidimensional poverty. Statistical Research 37: 79–89. [Google Scholar]
- Huang, Kainan, and Xiangru Hao. 2021. Analysis of the impact of digital finance development on urban and rural household consumption in China: Micro evidence from Chinese households. Journal of Social Sciences 4: 110–21+215. [Google Scholar]
- Huston, Sandra J. 2012. Financial literacy and the cost of borrowing. International Journal of Consumer Studies 36: 566–72. [Google Scholar] [CrossRef]
- Jiang, Jinglin, Zhengwei Wang, Hongyu Xiang, and Li Liao. 2019. Financial knowledge and fund investment returns: Can delegated investment substitute financial knowledge. World Economy 42: 170–92. [Google Scholar]
- Klapper, Leora, Annamaria Lusardi, and Georgios A. Panos. 2013. Financial literacy and its consequences: Evidence from Russia during the financial crisis. Journal of Banking & Finance 37: 3904–23. [Google Scholar]
- Lan, Leqin, and Zhuoran Yang. 2021. Can digital inclusive finance improve household consumption levels. Research on Financial and Economic Issues 12: 49–57. [Google Scholar]
- Li, Chunfeng, and Yaxuan Xu. 2022. The effects of digital finance driving different consumption structures of households. Modern Finance (Journal of Tianjin University of Finance and Economics) 42: 67–78. [Google Scholar]
- Li, Dongrong. 2020. Enhancing consumer digital financial literacy requires multi-party cooperation. Tsinghua Financial Review 6: 23–24. [Google Scholar]
- Liu, Min. 2021. The path of Chinese household consumption upgrading over a century of CPC history and trends of future consumption. Economic System Reform 2: 5–12. [Google Scholar]
- Luo, Juan. 2020. Can financial knowledge promote the upgrading of household consumption structure: Evidence from China Household Finance Survey data. Consumption Economy 36: 63–73. [Google Scholar]
- Lusardi, Annamaria, and Peter Tufano. 2015. Debt literacy, financial experiences, and over-indebtedness. Journal of Pension Economics & Finance 14: 332–62. [Google Scholar]
- Ma, Junlong, and Guangjie Ning. 2017. Internet and non-agricultural employment of rural labor in China. Finance and Economics Science 7: 50–63. [Google Scholar]
- Mao, Yufei, Xiangquan Zeng, and Huilin Zhu. 2019. Internet usage, employment decisions, and job quality: Empirical evidence based on CGSS data. Economic Theory and Business Management 1: 72–85. [Google Scholar]
- Meng, Defeng, Liang Tian, and Weixiang Yan. 2019. Financial literacy and credit consumption behavior: The case of credit cards. Financial Forum 24: 67–80. [Google Scholar]
- Meng, Hongwei, and Xinhua Yan. 2020. The impact of financial literacy on urban household consumption: Empirical research based on China Household Finance Survey data. World of Survey and Research 3: 16–21. [Google Scholar]
- Mouna, Amari, and Anis Jarboui. 2015. Financial literacy and portfolio diversification: An observation from the Tunisian stock market. International Journal of Bank Marketing 33: 808–22. [Google Scholar] [CrossRef]
- Nan, Yongqing, Haoran Xiao, and Wentao Shan. 2020. Household assets, wealth effects, and household consumption upgrading: Micro evidence from China Family Panel Studies. Journal of Shanxi University of Finance and Economics 42: 1–15. [Google Scholar]
- Peng, Xianqi, and Xiaomei Zhu. 2018. Progress in consumer financial literacy research. Economic Dynamics 2: 99–116. [Google Scholar]
- Qin, Fang, Wenchun Wang, and Jincai He. 2016. The impact of financial knowledge on participation in commercial insurance: Empirical analysis based on China Household Finance Survey (CHFS) data. Journal of Financial Research 10: 143–58. [Google Scholar]
- Shi, Jinchuan, and Weiwei Wang. 2017. The impact of internet usage on entrepreneurial behavior: Empirical research based on micro data. Journal of Zhejiang University (Humanities and Social Sciences) 47: 159–75. [Google Scholar]
- Song, Quanyun, Yu Wu, and Zhichao Yin. 2017. Household credit behavior from the perspective of financial knowledge. Journal of Financial Research 6: 95–110. [Google Scholar]
- Wang, Huiling, Shaoxiong Yang, and Rong Kong. 2021. Does financial literacy reduce household consumption inequality?—Analysis based on the mediating effect of financial behavior. Journal of Northwest A&F University (Social Science Edition) 21: 76–84. [Google Scholar]
- Wang, Zhengwei, Yinghui Deng, and Li Liao. 2016. Knowledge changes fate: Financial knowledge and micro-level income mobility. Journal of Financial Research 12: 111–27. [Google Scholar]
- Wen, Tao, and Zhaoliang Meng. 2012. Research on the evolution of rural household consumption structure in China. Agricultural Technology and Economics 7: 4–14. [Google Scholar]
- Wu, Weixing, and Xueliang Lü. 2013. Asset allocation of urban households in China and international comparison: An analysis based on micro data. International Finance Research 10: 45–57. [Google Scholar]
- Wu, Weixing, Kun Wu, and Jin Wang. 2018. Financial literacy and household debt: Analysis based on micro-survey data of Chinese residents. Economic Research Journal 53: 97–109. [Google Scholar]
- Xiang, Yubing. 2018. Internet development and the upgrading of household consumption structure. Journal of Zhongnan University of Economics and Law 4: 51–60. [Google Scholar]
- Yi, Xingjian, and Li Zhou. 2018. Has digital inclusive finance significantly influenced household consumption: Micro evidence from Chinese households. Journal of Financial Research 11: 47–67. [Google Scholar]
- Yin, Zhichao, and Cheng Zhang. 2019. The impact of female labor participation on household savings rate. Economic Research Journal 54: 165–81. [Google Scholar]
- Yin, Zhichao, Quanyun Song, Yu Wu, and Changyan Peng. 2015a. Financial knowledge, entrepreneurial decisions, and entrepreneurial motivations. Management World 1: 87–98. [Google Scholar]
- Yin, Zhichao, Yu Wu, and Li Gan. 2015b. Financial accessibility, financial market participation, and household asset choices. Economic Research Journal 50: 87–99. [Google Scholar]
- Yin, Zhichao, Zeyu Qin, and An Zhang. 2024. The impact of digital infrastructure construction on household consumption. Study and Practice 8: 74–84. [Google Scholar]
- Zhan, Jing, and Xuying Wang. 2023. The Impact of Digital Rural Development on Farmers’ Financial Asset Allocation. Journal of Xiangtan University Philosophy and Social Sciences Edition 5: 124–37. [Google Scholar]
- Zhang, Menglin, and Guoping Li. 2021. Inclusive finance, household heterogeneity, and consumption structure upgrading. Economic Review 2: 116–28. [Google Scholar]
- Zhang, Xun, Guanghua Wan, and Haitao Wu. 2021. Bridging the digital divide: The unique development of digital finance in China. Chinese Social Sciences 8: 35–51+204–205. [Google Scholar]
- Zhang, Xun, Tong Yang, Chen Wang, and Guanghua Wan. 2020. Digital finance development and household consumption growth: Theory and China’s practice. Management World 36: 48–63. [Google Scholar]
- Zhang, Yongli, and Lamei Xu. 2019. The impact of internet usage on household living consumption in poverty-stricken areas of Western China: Based on a survey of 1735 households in Gansu Province. China Rural Economy 2: 42–59. [Google Scholar]
- Zhou, Guangsu, and Gang Fan. 2018. Internet usage and household entrepreneurial choices: Validation from CFPS data. Economic Review 5: 134–47. [Google Scholar]
- Zou, Xinyue, and Wang Wang. 2020. The impact of digital inclusive finance on household consumption: Empirical analysis based on spatial econometric models. Journal of Financial Economics Research 35: 133–45. [Google Scholar]

| Question | Option |
|---|---|
| Have you ever used internet consumer loans? | ① YES; ② NO |
| Do you have experience with managing investments through internet channels? | ① YES; ② NO |
| Have you purchased internet insurance? | ① YES; ② NO |
| Can you distinguish between a credit card and a debit card? | ① YES; ② NO |
| Do you know how to check your personal credit report online? | ① YES; ② NO |
| Variables | Values for the Variables | Mean | Std. Dev. |
|---|---|---|---|
| Consum_total | Total sum of various household consumption expenditures (in yuan) | 28,297.32 | 31,371.55 |
| Consum1 | Total sum of household expenditures on food, daily necessities, utilities, and other goods and services (in yuan) | 5357.903 | 6651.515 |
| Consum2 | Total sum of household expenditures on transportation, communication, education, medical care, and related services (in yuan) | 14,409.59 | 19,061.38 |
| Consum3 | Total sum of household expenditures on public welfare, social gifts, entertainment, and related services (in yuan) | 8728.027 | 14,931.79 |
| Fin_factor | Index synthesis using factor analysis | 0 | 0.719 |
| Gender | Male = 1, Female = 0 | 0.675 | 0.469 |
| Age | Take actual value (years) | 56.755 | 11.235 |
| Age2 | Respondent’s age squared/100 | 33.472 | 12.486 |
| Education | Illiterate or semi-literate = 0, Primary school = 6, Junior high school = 9, Senior high school or vocational school = 12, Associate degree = 15, Bachelor’s degree = 16, Master’s degree and above = 19 | 8.044 | 3.572 |
| Marriage | Married = 1, Other statuses = 0 | 1.248 | 0.773 |
| Health | Very unhealthy = 1, Unhealthy = 2, Average = 3, Fairly healthy = 4, Very healthy = 5 | 4.017 | 1.012 |
| Chronic | Has chronic disease = 1, No chronic disease = 0 | 0.611 | 0.488 |
| Size | Number of household members sharing actual income and expenses | 3.18 | 1.499 |
| Income | The actual amount of household total income minus total expenses (in yuan) | 97,656.42 | 263,000 |
| Debt | The actual amount of household debt (in yuan) | 7824.074 | 21,051.74 |
| Cash | The amount of current liquid assets in the household (in yuan) | 29,675.93 | 24,866.4 |
| Vill_income | The ratio of village net income to the current population of the village (in yuan) | 16,295.93 | 6075.836 |
| Vill_pop | Current population of the village (number of people) | 900.861 | 616.307 |
| Variables | (1) | (2) | (3) | (4) |
|---|---|---|---|---|
| Consum_Total | Consum1 | Consum2 | Consum3 | |
| Fin_factor | 3568.74 *** | 961.24 *** | 1153.90 | 1419.96 *** |
| (1142.229) | (303.879) | (804.790) | (543.230) | |
| Gender | 4677.67 *** | 1617.04 *** | 2298.83 ** | 1794.00 ** |
| (1581.555) | (420.758) | (1114.330) | (752.169) | |
| Age | 362.32 | 188.56 | −358.73 | 706.89 *** |
| (514.371) | (136.844) | (362.415) | (244.629) | |
| Age2 | −738.48 | −208.01 * | −16.03 | −650.80 *** |
| (458.023) | (121.853) | (322.713) | (217.830) | |
| Education | 42.42 | −95.66 | 72.12 | −93.03 |
| (220.561) | (58.678) | (155.403) | (104.896) | |
| Marriage | 840.59 | 145.56 | 779.47 | 157.26 |
| (956.085) | (254.357) | (673.637) | (454.703) | |
| Health | 263.59 | 116.46 | 382.52 | −225.50 |
| (892.127) | (237.342) | (628.574) | (424.285) | |
| Chronic | 1547.52 | 176.99 | 1004.14 | 132.34 |
| (1866.928) | (496.679) | (1315.397) | (887.889) | |
| Size | 5185.78 *** | 879.89 *** | 3326.58 *** | 973.34 *** |
| (539.489) | (143.526) | (380.113) | (256.575) | |
| Income | 0.05 *** | 0.00 *** | 0.01 *** | 0.04 *** |
| (0.003) | (0.001) | (0.002) | (0.001) | |
| Debt | 0.10 *** | 0.01 | 0.06 ** | 0.03 * |
| (0.035) | (0.009) | (0.025) | (0.017) | |
| Vill_income | 0.14 | 0.12 *** | 0.05 | 0.03 |
| (0.118) | (0.031) | (0.083) | (0.056) | |
| Vill_pop | 1.80 | 1.02 *** | 0.12 | 1.20 ** |
| (1.209) | (0.322) | (0.852) | (0.575) | |
| Constant | −571.85 | −5477.80 | 16,637.51 | −17,817.52 ** |
| (15,121.436) | (4022.916) | (10,654.240) | (7191.575) | |
| Observations | 1080 | 1080 | 1080 | 1080 |
| R-squared | 0.467 | 0.161 | 0.283 | 0.468 |
| Variables | (1) | (3) | (4) | (5) |
|---|---|---|---|---|
| Consum_Total | Consum1 | Consum2 | Consum3 | |
| Fin_score | 2812 *** | 762.2 *** | 980.8 | 992.4 ** |
| (985.8) | (262.3) | (694.2) | (468.7) | |
| Controls | YES | YES | YES | YES |
| Constant | −364.1 | −5262 | 16,375 | −17,400 ** |
| (15,185) | (4040) | (10,693) | (7220) | |
| Observations | 1080 | 1080 | 1080 | 1080 |
| R-squared | 0.466 | 0.160 | 0.283 | 0.468 |
| Variables | (1) | (2) | (3) | (4) |
|---|---|---|---|---|
| Consum_Total | Consunp1 | Consum2 | Consum3 | |
| Fin_factor | 3223.74 *** | 274.9 *** | 35.83 | 741.8 * |
| (1042) | (89.75) | (732.2) | (441.7) | |
| Controls | YES | YES | YES | YES |
| Constant | −634 | −2131 * | 16,214 * | −14,580 ** |
| (14,283) | (1188) | (9693) | (5847) | |
| Observations | 1080 | 1080 | 1080 | 1080 |
| R-squared | 0.467 | 0.264 | 0.135 | 0.537 |
| Variables | (1) | (2) | (3) | (4) |
|---|---|---|---|---|
| Consum_Total | Consum1 | Consum2 | Consum3 | |
| Fin_factor | 4294 *** | 1025 *** | 1817 ** | 1617 *** |
| (1231) | (335.9) | (853.6) | (597.5) | |
| Controls | YES | YES | YES | YES |
| Constant | −16,144 | −6281 | 6530 | −20,797 *** |
| (15,476) | (4223) | (10,730) | (7511) | |
| Observations | 999 | 999 | 999 | 999 |
| R-squared | 0.473 | 0.160 | 0.285 | 0.484 |
| Panel A: Factor Digital Finance Usage as an Endogenous Variable | ||||
| Variables | (1) | (2) | (3) | (4) |
| Fin_Factor | Consum_Total | Fin_Factor | Consum_Total | |
| Phase One | Phase Two | Phase One | Phase Two | |
| Phone | 0.167 *** | |||
| (0.0447) | ||||
| Fin_factor | 21,362 * | 42,352 *** | ||
| (11,072) | (14,890) | |||
| Community | 0.0342 *** | |||
| (0.00948) | ||||
| Controls | YES | YES | YES | YES |
| Constant | 3.355 *** | −63,379 | 3.544 *** | −136,523 ** |
| (0.390) | (41,787) | (0.389) | (55,934) | |
| F-value | 13.91 | 13.03 | ||
| DWH Chi2 | 1.75 | 14.205 | ||
| p-value | (0.0747) | (0.0002) | ||
| Observations | 1080 | 1080 | 1080 | 1080 |
| R-squared | 0.277 | 0.345 | 0.277 | 0.274 |
| Panel B: Cumulative Scoring of Digital Finance Usage as an Endogenous Variable | ||||
| Variables | (1) | (2) | (2) | (4) |
| Fin_Score | Consum_Total | Fin_Score | Consum_Total | |
| Phase One | Phase Two | Phase One | Phase Two | |
| Phone | 0.236 *** | |||
| (0.0517) | ||||
| Fin_score | 15,094 ** | 32,853 *** | ||
| (7565) | (10,966) | |||
| Community | 0.0441 *** | |||
| (0.0110) | ||||
| Controls | YES | YES | YES | YES |
| Constant | 3.968 *** | −51,610 | 4.229 *** | −125,350 ** |
| (0.451) | (35,035) | (0.451) | (49,665) | |
| F-value | 22.34 | 42.12 | ||
| DWH Chi2 | 16.23 | 15.245 | ||
| p-value | (0.0000) | (0.0001) | ||
| Observations | 1080 | 1080 | 1080 | 1080 |
| R-squared | 0.288 | 0.388 | 0.285 | 0.283 |
| Variables | (1) | (2) | (3) | (4) | (5) | (6) |
|---|---|---|---|---|---|---|
| Credit | Risk | Profit | Credit | Risk | Profit | |
| Fin_factor | 0.526 *** | 0.213 ** | 764.1 *** | |||
| (0.0696) | (0.0860) | (127.4) | ||||
| Fin_score | 0.443 *** | 0.212 *** | 923.9 *** | |||
| (0.0587) | (0.0726) | (107.9) | ||||
| Controls | YES | YES | YES | YES | YES | YES |
| Constant | −0.207 | −1.371 | 1263 | −0.143 | −1.545 | 85.68 |
| (0.967) | (0.993) | (1687) | (0.963) | (1.000) | (1662) | |
| Observations | 1080 | 1080 | 1080 | 1080 | 1080 | 1080 |
| R-squared | 0.079 | 0.110 |
| Variables | (1) | (2) | (3) | (4) | (5) | (6) |
|---|---|---|---|---|---|---|
| Low Income | Middle Income | High Income | Low Education | Middle Education | High Education | |
| Fin_factor | 637.0 | 5594 * | 5096 ** | 6499 * | 8607 ** | 3250 ** |
| (1871) | (2980) | (2211) | (3532) | (3327) | (1556) | |
| Controls | YES | YES | YES | YES | YES | YES |
| Constant | 20,464 | −453.9 | −92,632 ** | −39,847 | −13,374 | 8899 |
| (19,744) | (36,850) | (43,005) | (35,700) | (40,090) | (21,470) | |
| Observations | 270 | 270 | 540 | 111 | 208 | 761 |
| R-squared | 0.349 | 0.138 | 0.481 | 0.553 | 0.728 | 0.335 |
| Part A: Based on Community Building and Skills Training | |||||
| Variables | (1) | (2) | (3) | (4) | (5) |
| Low Community | High Community | Low Train | Meddle Train | High Train | |
| Fin_factor | 13,505 *** | 11,378 *** | 13,786 *** | 12,497 *** | 7195 ** |
| (1955) | (1651) | (1976) | (1830) | (3217) | |
| Controls | YES | YES | YES | YES | YES |
| Constant | 27,065 *** | 29,749 *** | 28,326 *** | 28,092 *** | 28,370 *** |
| (1344) | (1238) | (1331) | (1530) | (1993) | |
| Observations | 560 | 520 | 600 | 320 | 160 |
| R-squared | 0.079 | 0.084 | 0.075 | 0.128 | 0.031 |
| Part B: Based on Logistics and Medical Services | |||||
| Variables | (6) | (7) | (8) | (9) | (10) |
| Delivery_YES | Delivery_NO | 0_Clinic | 1_Clinic | 2_Clinic | |
| Fin_factor | 13,377 *** | 11,450 *** | 6382 ** | 11,553 *** | 22,457 *** |
| (1961) | (1679) | (2737) | (1487) | (3968) | |
| Controls | YES | YES | YES | YES | YES |
| Constant | 31,959 *** | 26,250 *** | 22,141 *** | 28,847 *** | 32,098 *** |
| (1588) | (1114) | (1586) | (1111) | (2774) | |
| Observations | 380 | 700 | 160 | 780 | 140 |
| R-squared | 0.110 | 0.062 | 0.033 | 0.072 | 0.188 |
Disclaimer/Publisher’s Note: The statements, opinions and data contained in all publications are solely those of the individual author(s) and contributor(s) and not of MDPI and/or the editor(s). MDPI and/or the editor(s) disclaim responsibility for any injury to people or property resulting from any ideas, methods, instructions or products referred to in the content. |
© 2024 by the authors. Licensee MDPI, Basel, Switzerland. This article is an open access article distributed under the terms and conditions of the Creative Commons Attribution (CC BY) license (https://creativecommons.org/licenses/by/4.0/).
Share and Cite
Xu, S.; Liu, X.; Zhang, L.; Xiao, Y. Can the Use of Digital Finance Promote the Enhancement and Quality Improvement of Household Consumption Among Farmers? Economies 2024, 12, 325. https://doi.org/10.3390/economies12120325
Xu S, Liu X, Zhang L, Xiao Y. Can the Use of Digital Finance Promote the Enhancement and Quality Improvement of Household Consumption Among Farmers? Economies. 2024; 12(12):325. https://doi.org/10.3390/economies12120325
Chicago/Turabian StyleXu, Sheng, Xichuan Liu, Lu Zhang, and Yu Xiao. 2024. "Can the Use of Digital Finance Promote the Enhancement and Quality Improvement of Household Consumption Among Farmers?" Economies 12, no. 12: 325. https://doi.org/10.3390/economies12120325
APA StyleXu, S., Liu, X., Zhang, L., & Xiao, Y. (2024). Can the Use of Digital Finance Promote the Enhancement and Quality Improvement of Household Consumption Among Farmers? Economies, 12(12), 325. https://doi.org/10.3390/economies12120325