Article

Impacts of the COVID-19 Pandemic on the Production Costs and Competitiveness of the Brazilian Chicken Meat Chain

by
Luiz Clovis Belarmino
1,*,
Margarita Navarro Pabsdorf
2 and
Antônio Domingos Padula
3
1
Embrapa Temperate Climate, Brazilian Agricultural Research Corporation, POB 403, Pelotas 96010-971, Brazil
2
Faculty of Economic and Business Sciences, University of Granada, P. de Cartuja, 18011 Granada, Spain
3
School of Administration, Federal University of Rio Grande do Sul, Porto Alegre 90010-460, Brazil
*
Author to whom correspondence should be addressed.
Economies 2023, 11(9), 238; https://doi.org/10.3390/economies11090238
Submission received: 9 August 2023 / Revised: 12 September 2023 / Accepted: 13 September 2023 / Published: 18 September 2023

Abstract

:
Sanitary requirements, geopolitical crises, and other factors that increase price volatility have an impact on the organization of markets and changes in investment policies and business strategies. The COVID-19 pandemic interrupted the trade of chicken meat, due to the drastic reduction in the circulation of goods, interrupted the supply of production chains, changed consumption habits, and made it difficult to reorganize business due to the slow resumption of operations by suppliers of inputs and in distribution logistics. The magnitude of these impacts has not been studied despite the high relevance of this economic dimension and the managerial implications for sector governance and trade management. The purpose of this study was to evaluate the economic impact of the COVID-19 pandemic on the production costs and competitiveness of the Brazilian chicken meat production chain. The methodology consisted of the detailed collection of information and data on private and social prices carried out using the Policy Analysis Matrix (PAM) method. The competitiveness coefficients and policy effects in the Brazilian broiler production chain before (2015) and during (2022) the COVID-19 pandemic were quantified and compared. Generally, the significant increases in the production costs of chicken meat (30.49%) caused a decrease in total factor productivity (−19.54%), a reduction in gross revenue, and lower tax collection. The pandemic has reduced the profitability of the chicken production chain in Brazil by 32.31%, reduced the competitiveness of exports, and worsened other economic indicators of the production chain. To the best of our knowledge, no other study has investigated the impacts of the COVID-19 pandemic on the competitiveness of the Brazilian chicken meat production chain. The PAM method allows for prices paid and received to be updated in real terms in projects representative of Brazil, the world leader in exports. This information is important for both national and international stakeholders. Additionally, this model is applicable to other meats traded in the international market, as it provides greater precision in business management and can estimate the impacts of risks on the availability or quality of food and health crises with robust results.

1. Introduction

A close and complex link exists between domestic food production, international trade, and price impacts (Nonnenberg et al. 2021). This link is created via the interconnections between aggressive competition and industrial concentration associated with the commercial diplomacy of governments, in which increases in import tariffs and cultural issues associated with demand are predominant (Nkgadima and Muchopa 2022; Yeong et al. 2021). In contrast, animal products are the main sources of protein and energy available for human consumption, and territories with serious increases in hunger persist worldwide (Wijerathna-Yapa and Pathirana 2022). Therefore, it is expected to increase the supply of quality food, either via local production or imports (Soendergaard et al. 2023), where the global consumption of poultry meat will increase by 16% and represent 41% of all meat protein by 2031 (OECD-FAO 2022).
In this sense, in times of deep globalization with capital movements (Clapp 2019), specifically foreign direct investment (Bargoni et al. 2022; Chen 2017; Manning and Baines 2004), the availability of useful information for the formulation, monitoring, and evaluation of investment and governance policies, both public and private, is scarce, outdated, and poorly parameterized. In the last four decades, the chicken meat supply chain has been consolidated. Concurrently, it was necessary to assess factors that affect development, such as exchange rate fluctuations, technology transfer and innovation, the evolution of transnational companies, new clusters (Chen 2017), technological growth, digitalization (Qi and Chu 2022), lower prices, greater diversity and convenience (Chen et al. 2023; Martindale and Schiebel 2017; Bargoni et al. 2022), new investment patterns, and anti-competitive policies (Clapp 2017).
Competitiveness is a broad and complex concept (Constantin et al. 2023) but generally expresses the economic condition of an industry, company, product, or cluster to dispute markets or attract investments from competitors (Clapp 2017). The competitiveness of agricultural commodities can be conceptualized as the ability of organizations to gain, maintain, or expand their market share compared to competitors (Belarmino et al. 2022). The main factors determining this market condition are the use of universal production standards, permanent investments in innovation, and steady increases in productivity and efficiency (Almeida et al. 2020).
Competitiveness coefficients and policy effects on the Brazilian broiler production chain before (2015) and during (2022) the COVID-19 pandemic were identified, quantified, and compared. The economy of agri-food systems, management of the Food Supply Chain, and Global Value Chain (GVC) were prioritized.

2. Theoretical Background

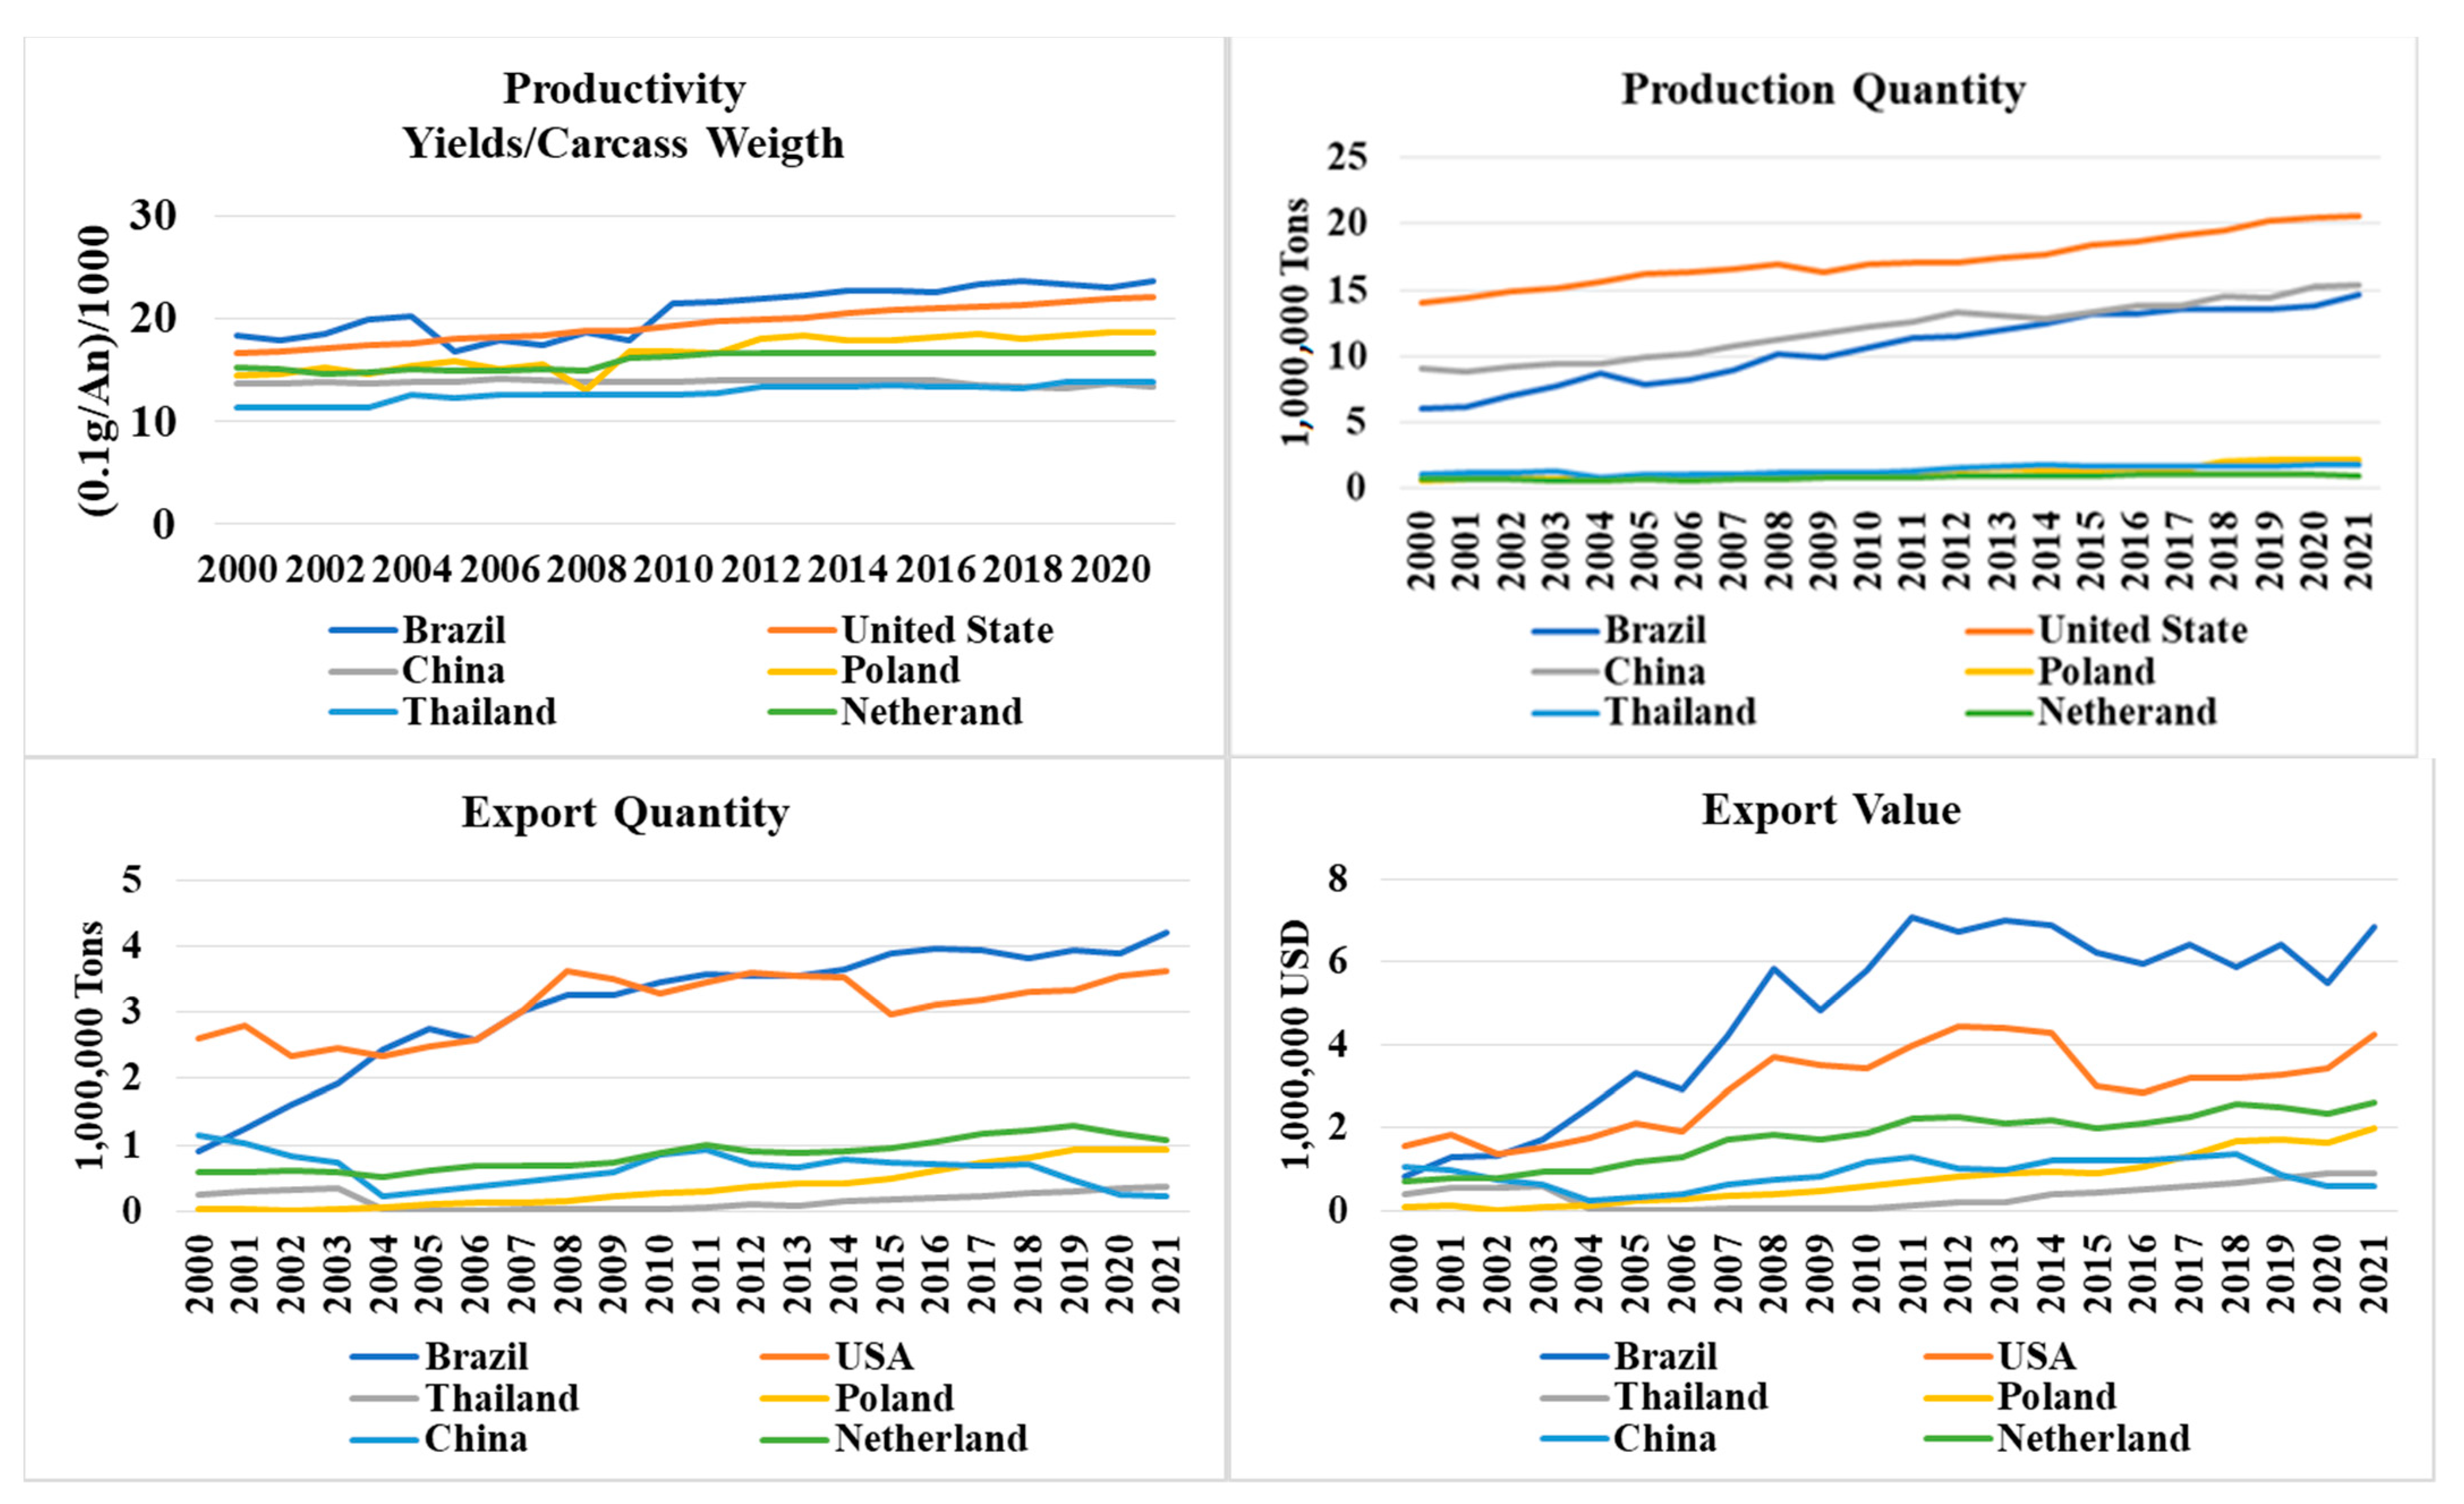
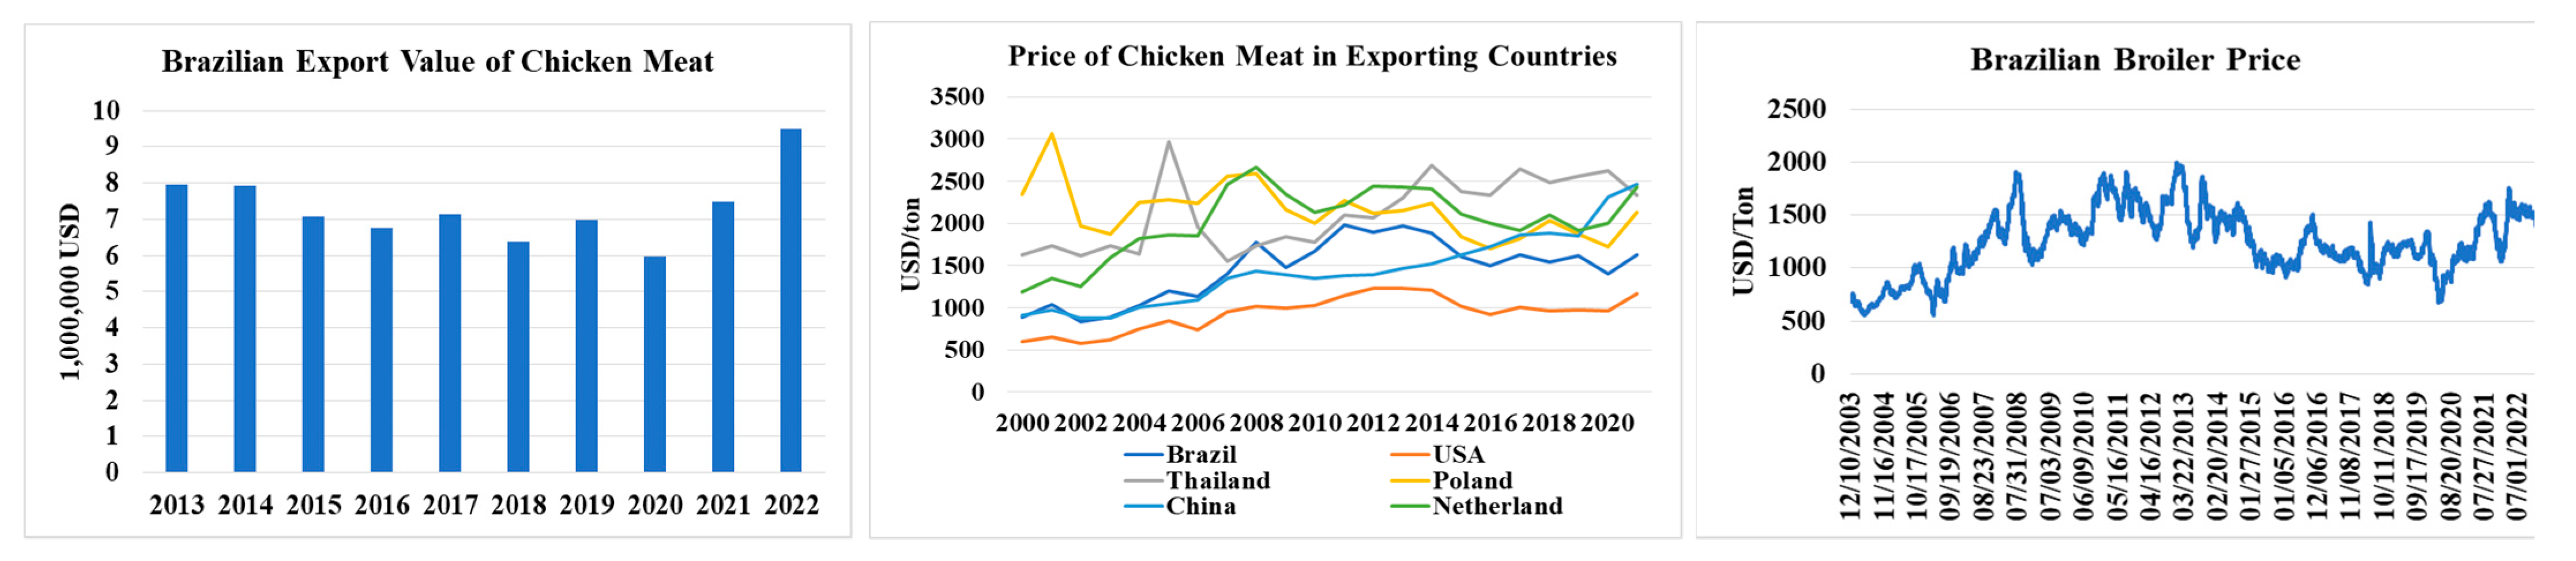
2.1. The Production and Export of Meat Worldwide and in Brazil

Fruits, vegetables, and meat are typically the foods most recommended and valued by nutritionists. Their supply is conditioned by seasonality, the availability of productive resources, consumer income levels, and items of access and entry into markets. Generally, the production and trade of these foods are facing greater sanitary and quality controls, less regular supply, local or short chains, and greater price volatility (Aday and Seckin-Aday 2020). In this dynamic of linking prices and costs in the chains, economic impacts and supply crises arise, as in the case of agricultural fertilizer prices, which recently rose, thus indirectly increasing the costs of producing grains and, consequently, animal feed, all of which impacts meat competitiveness (CEPEA 2023; MAPA 2023; USDA-FAS 2022).
Figure 1 presents the most significant countries in the international market in terms of quantity produced, yield/carcass weight, and quantity and value of exported chicken meat. Brazil is the third-largest producer of chicken meat (14.38% of the total) and the largest exporter (34.61%) and domestically consumes 10.03% of the global production.
Figure 2 presents additional information on the main market variables. This trend is relevant for the growth of the Brazilian economy and in other countries that produce and sell chicken meat, especially, for example, those that value this economical source of protein to supply low-income populations. Domestic production amounted to 14.705 million tons in 2022, and exports reached 4.6 million tons (FAOSTAT 2023; MAPA 2023). In 2020, the top exporters of poultry meat were Brazil (USD 5.59 billion), the United States (USD 3.93 billion), Poland (USD 2.61 billion), the Netherlands (USD 2.36 billion), and Thailand (USD 921 million). That year, the top importers of poultry meat were China (USD 2.99 billion), Germany (USD 1.79 billion), the United Kingdom (USD 1.34 billion), France (USD 1.27 billion), and Hong Kong (USD 1.08 billion).
The foreign trade of chicken in the USA represents 17% of national production (USDA-FAS 2022). The main destinations for Brazilian exports are China (USD 1.27 billion), Saudi Arabia (USD 690 million), Japan (USD 660 million), the United Arab Emirates (USD 426 million), and Hong Kong (USD 236 million) (CEPEA 2023; ABPA 2023).

2.2. Global Competitiveness of Poultry Meat

The recent dynamics of these economic variables and competitiveness factors express important indicators and coefficients for understanding the state of the art in the production and international trade of chicken meat in Brazil and other leading countries in this global value chain. Thus, for example, they indicate the competitive advantage revealed by the respective market share, the current levels of productivity (increase in weight/animal carcass), different prices or costs per ton of the national offers, and also the revenue obtained. These cost and revenue indicators in each country indicate the profitability or private profit margin, which can be transformed into a competitive advantage and also form the basis for calculating social profit (when taxes and other market failures are removed), which corresponds to the comparative advantage of each production chain studied. Therefore, the difference between private and social profitability monetarily scales the effects of national policies on the ability of exported commodities to compete in international trade.
Brazilian leadership in chicken exports is mainly due to the lower cost of production and marketing compared to competitors such as the United States (USDA-FAS 2022) and the European Union (EC 2021). Yields observed as weight gain (Figure 1), expressed in grams divided by the weight of gutted chicken, revealed that Brazil has the best conversion rate among the main exporters. In 2021, it surpassed the United States (−6.4%), Poland (−21.0%), the Netherlands (−29.5%), Thailand (−41.7%), and China (−43.4%). Generally, international meat prices should remain high in the short term, and the export price of chicken meat should closely follow grain prices, given the high share of feed costs in production (MAPA 2023).
Poultry meat consumption has increased in virtually all countries and regions and is expected to reach 154 million tons, as consumers are attracted to lower prices, consistency, the adaptability of the product, and higher protein/low fat content (USDA-FAS 2022). The price of chicken should stabilize above the pre-COVID level after peaking in the first half of 2022 and stabilize at approximately EUR/USD 2000/ton by 2032, mainly owing to sustained demand in the European Union (EC 2021). Consequently, the price difference with Brazil (which produces EUR 1500/ton) will continue (USDA-FAS 2022), making it almost impossible for Europe to compete on the same ground (FAOSTAT 2023; ABPA 2023). As shown in Figure 2, the average price in 2021 in Poland was 30.6% higher than in Brazil, and in the Netherlands, prices were 49.5% higher than in Brazil, which recorded USD 1629.22/ton this year, slightly above the average for this millennium (USD 1454.56/ton). In the United States, this average was lower (USD 937.75/ton) since most exports were whole chicken, which receives a lower price than chicken meat cut into specific pieces.
Contrarily, in Brazil, approximately 2/3 of sales are of cuts (ABPA 2023), and prices are higher than those paid for the whole chicken. These fluctuations in value were also observed by a 6.3% increase in food prices in general, which occurred in the first half of 2022 (World Bank 2023) but showed consecutive declines in the second half, as confirmed by the FAO Food Price Index (FAO FFPI 2023). In Brazil, the Index of Producer Prices of Agricultural Products Groups of CEPEA (2023) accumulated a nominal increase of 10.1% in 2022 (Figure 2), whereas the Index of Prices of Industrial Products (FGV IBRE 2023) increased by 10.7% during the same period. Between 2021 and 2022, international food prices increased by 14.3% (FAO FFPI 2023). For the remainder of 2022 and early 2023, USDA-FAS (2022) predicted that domestic food prices in Brazil would continue to rise owing to rising inflation.
The costs, revenues, and national and international trade in Brazil are monitored and disclosed periodically by Embrapa Suínos e Aves (2023), MDIC COMEX STAT (2023), CEPEA (2023), IBGE PPM (2023), CONAB (2023), and ABPA (2023). State agencies such as CEPA EPAGRI-SC (2023), DERAL-PR (2023), and IEA APTA (2023) also monitor the price fluctuations in the Brazilian chicken meat chain.
By 2030, the global demand for chicken meat is expected to increase by 47% (CEPEA 2023). However, collectives of producers and other stakeholders have warned about the challenges posed by higher costs, which concern the industry, especially after corn and soybean meal prices rose by 3.4 and 2.5 times, respectively, in the last seven years (CEPEA 2023). Supply and demand may drive prices more significantly in 2023, stimulating production with continued shipments at high levels, in addition to domestic demand in Brazil’s remaining firm (GEF-WFP 2023).
The impact of these foreign trade variables and domestic policies on the production, distribution, and consumption of chicken meat allows for the evaluation of the competitive positioning of each national production chain, the results of which increase knowledge on the subject and, thus, support decision making on investments and adjustments in the sector’s governance, as well as supporting management measures in companies (Constantin et al. 2023).

2.3. Impacts of COVID-19 on the Production Processes and GVC of Chicken Meat

Generally, isolation measures and restrictions on the movement of people affected all sectors of the economy, creating serious difficulties in industrial operations. The primary sector was not the target of these activity restrictions, as it does not involve crowds of people. Even so, production typically takes place in open, isolated, and ventilated environments with other contamination difficulties. Aviaries are not work intensive and do not require significant manpower. Agri-industries concentrate many people on slaughter and cutting lines, but the interruption was partially adopted only at the beginning of the first contamination peaks, as these environments are regulated via hygiene standards and personal safety, strict surveillance of workers’ health, and constant public inspection. Table 1 summarizes information from the bibliographic review, which selected the events and consequences of the pandemic in chicken meat GVC.
The export quantities in Figure 1 provide evidence that the COVID-19 pandemic did not affect the flow of Brazilian chicken meat export production chains. The prices of the main grains (corn and soybeans) experienced a period of high inflation at the global level. This was confirmed via the statistics of the volumes generated (IBGE PPM 2023; MAPA 2023; ABPA 2023) and the constancy of exports (MDIC COMEX STAT 2023; FAOSTAT 2023). Figure 1 shows the positive growth in production (7.56%) and exports by volume (22.25%) and value (35.25%) during the COVID-19 pandemic and between 2015 and 2022. The average price of exports of chicken meat between 2017 and 2022 was USD 1604.19/ton, increasing by 10.63% in the same period. However, some countries reported problems in operation due to the pandemic, especially at the beginning of the outbreak. Interruptions occurred in food supplies, vaccines, medicines, and equipment in Bangladesh, with losses estimated at USD 825 million in the poultry sector (Sattar et al. 2021). In Indonesia, while the demand and price of chicken remained unaffected, economic growth decreased from 4.97% to 2.97% (Surni et al. 2021). The COVID-19 pandemic also impacted the consumption, transport, and trade of chickens in Saudi Arabia (Hafez and Attia 2020). In India, losses exceeded USD 3.035 million, among other dramatic impacts on specific territories (Biswal et al. 2020). Similar effects of the pandemic have been reported in Nigeria (Fafiolu and Alabi 2020), Egypt (Abu Hatab et al. 2021), Ghana (Obese et al. 2021), and Myanmar (Fang et al. 2021). The impact of the pandemic has also been reported on energy supplies in China (Wu and Ma 2021) and other G7 countries (Awan et al. 2021), on macroeconomic indicators such as inflation in China (Feng et al. 2021), and on the supply chain for chicken feed (Attia et al. 2022).
In the United States and Europe-27, online shopping has increased sharply in the last decade; at the start, it accounted for only 11% of total retail trade (OECD-FAO 2022). According to Zeballos et al. (2023), the COVID-19 pandemic altered the entire food sector and induced a large increase in online food purchases (Ellison et al. 2021; Muresan et al. 2022; Todua and Jashi 2015). Another important aspect to consider is that in Brazil, the consumption of chicken meat should remain unchanged owing to low economic growth and high inflation, which can keep purchasing power weak. In this context, the USDA-FAS (2022) estimated that per capita consumption in Brazil would increase by 2.8% from 2022 to 2023 and pointed to a 3.8% increase in Brazilian chicken meat exports in 2023. The ABPA (2023) predicted an increase of 8.5% in international sales, reaching 5.2 million tons. CEPEA (2023) predicted that chicken meat production could reach 15.1 million tons in 2023, 2.3% above the forecast for 2022, with 6.2 billion animals slaughtered and a growth of 2.4% in the period.
The economic analysis of these variables and factors underlies several studies on the ability of companies to generate profits, monitor business results, predict the development or otherwise of the organization, practice business intelligence, monitor the trend of the segment in which the company operates as well as the economic situation and the country’s fiscal policy, participate in the definition of credit sources and conditions, and also select the best logistics with suppliers and distributors (Lopes et al. 2012; FAO RLC 2007).

3. Methods

Data collection for analysis was carried out at a representative establishment (RE) (Lopes et al. 2012; Monke and Pearson 1989), which was prioritized in the southern region of Brazil, the oldest and most traditional production center of chicken farms and agri-industries. This region represents a stabilized industry with consolidated productive and commercial experience and is recognized as a competitive agri-export cluster. Production costs, physical yields, revenues, and taxes were collected directly from RE accounting in the form of expenses and receipts actually incurred and not average estimates from the literature or databases. This ensured greater fidelity to market values and provided more credibility to the results of the competitiveness metrics (FAO RLC 2007; Lopes et al. 2012).
To compare the data collected in 2015 with those obtained in 2022, the effect of the pandemic was isolated by selecting the same RE, repeating the export corridor and the same mode of transport (road) between the links in the chain, in addition to using the same metrics as in the Policy Analysis Matrix (PAM) method. Furthermore, the production chain in Brazil continued to be free of avian flu and to participate in the global chicken meat value chain; the macroeconomic policies to control exchange rates and interest rates did not change, nor were there interruptions in the use of credit and insurance instruments; the feeding and sanitary control processes were not modified; commercialization strategies followed the same transaction practices, and no innovations in operations occurred in the periods; and the levels of taxes and other charges on intermediate inputs and sold products also remained the same in the two periods.
Moreover, the structures and functions of the technology transfer organizations followed the same recommendations for handling the fattening batches in the aviaries and conducting the production lines in the slaughterhouse processing; the genetics of the birds and the content of the different types of diets did not differ between the two collection periods; the coordination of chain development and governance standards continued to be exercised by the third link (meatpacking plant); and the integration structure and quality standards remained unchanged.
Thus, it was understood that there was no change in the use of productive resources (land, capital, and labor), as there were no changes in the use of physical and human capital. The effects of the war in Ukraine, which started in 2022 (Sohag et al. 2023), did not affect the isolation implemented for measuring the effects of the COVID-19 pandemic, as the collection for 2022 was made with data and information prior to the outbreak of the conflict.
Based on these experimental conditions, the effect of the pandemic was isolated to assess costs, prices, and revenues, as the PAM method allows the maintenance of the physical yield indices in the chain, such as feed conversion rate per chicken fed, use of meat from the weight of the finished chicken at the slaughterhouse, performance of physical inputs, and maintenance of labor productivity. Thus, by collecting only private price variations between the two periods, the other chain competitiveness variables were isolated. Therefore, the products and services traded on the four links changed due to restrictions on the movement of goods and people. This segregation of price variation and guarantee of no change in other conditions allowed for a comparative analysis before and after COVID-19.

3.1. Economic Analyses with the Policy Analysis Matrix (PAM) Method

The PAM method generates the product of two economic identities. The first horizontally defines profit as the difference between revenues and costs, and the second vertically determines the effects of divergence and the impacts of both distorted policies and market failures (Table 2). To build the PAM spreadsheets, a production system based on territory or RE and the respective logistics corridor where transactions occur was previously defined (Lopes et al. 2012).
Revenues and costs with domestic factors (land, labor, and fixed capital) in the PAM and marketable inputs (variables) were calculated at private and social prices. The values at private prices were determined from the actual prices charged in the market. These private values include the effects of policies, market failures, and shortcomings. Values at social prices corresponded to the economic valuation. However, this prevails in markets without policies or failures.

3.2. Indicators of Comparative Advantage and Competitiveness in the Chain

The first line of the PAM (Table 2) represents private profit (D). This is achieved by excluding sales revenues (A), the costs of marketable inputs to the market (B), and costs of domestic factors (C). A positive result indicates that the system is profitable and competitive because it exceeds input costs and positively remunerates capital, labor, and land. The second line estimates the profit at social prices (H), which is equal to social income (E) minus the social costs of marketable production factors (F) and internal factors (G). When H is positive, an economically efficient system with a comparative advantage exists. However, a negative result for social profits indicates that the system cannot survive without (in)direct payments, which wastes scarce resources and will make the value obtained for revenue exceed the import price (Lopes et al. 2012).
In this model, the concept of efficiency considers the use of resources in activities that provide higher levels of production and revenue, reflecting the cost of social opportunities (FAO RLC 2007). The indicators and coefficients were obtained for each of the four links in the chain, starting with the prices paid and received in the production of chickens in the aviaries, the transport of live chickens from the poultry farmer to the slaughterhouse, expenses, and revenues in agri-industrialization, and the transport of processing and packaging to the port of embarkation. All amounts are expenses incurred effectively, taken directly from the accounting of the RE previously chosen in the sector, with the consolidation of data made with market agents and in the records of official and reliable databases. Therefore, data and information represent the area that best employs productive resources and has the best management of organizational innovation (Lopes et al. 2012).

3.3. Coefficients of Productivity, Profitability, and Protection or Subsidy in the Chicken Meat Chain

Table 3 presents the main performance coefficients of the competitiveness analyses used to assess the economic impact of the COVID-19 pandemic on the chicken meat chain in Brazil. They are separated into coefficient types: performance, formula, interpretation, and importance.

3.4. Collection of Primary Data and Analysis

The lots consisted of an average of 39,000 broilers distributed over 2.970 m2 (13 chickens/m2), resulting in 250,965 chickens/aviary/year or 752,895 tons/aviary/year, with an average production cycle of 45 days and 6.5 cycles or lots/year. A mortality rate of 3.0% results in the effective delivery of 37,830 finished chickens/batch with a median weight of 3039 g. The agri-industry processes 75,000 chickens per day, with standards of international technology, using refrigerated road transport to take the whole chicken to the Rio Grande-RS port (648 km away). Although the agri-industry selected as the RE has 149 officially enabled chicken cuts, the present study established whole gutted and frozen chicken as the base product for comparison with international reference prices. The average yield of the chickens varied according to the cuts and, in the case of whole chickens, was 85.63%. However, most exports from Brazil’s agri-industry (70%) are composed of different chicken cuts, such as thighs, breasts, wings, and feet, and other preparations (MAPA 2023). The international prices used in this study were obtained from the values observed for social prices, which were generated by converting the private prices. The option of using conversion factors has been consolidated in national publications (Lopes et al. 2012; Torres et al. 2013) and accepted internationally (FAO RLC 2007).

4. Results

The description of the results consists of a socioeconomic overview and analyses in micro-, meso-, and macroeconomic dimensions, according to the theoretical bases of the competitiveness of GVC used in the PAM method.

4.1. Results of the Analyses of Brazilian Chicken Meat Competitiveness after the COVID-19 Pandemic

The results are divided into the accounting and economic coefficients of competitive performance. The most affected factors were the magnitude of revenue sources and cost items (variable and fixed), in addition to the business environment surrounding the companies, especially tax encumbrances, which reached 40% of the total gross amount of revenue. This influence occurred via macroeconomic policies such as interest rates, exchange rates, and various taxes. Also relevant were credit and insurance policies, the promotion of research, innovation, and fiscal deregulations to expand investments in basic infrastructure (transport, communications, and energy), the promotion of exports, and other interventions in the market via reforms for greater economic freedom, simplification, and tax justice.

4.2. Accounting Indicators of the GVC of Chicken Meat Competitiveness and Comparative Advantages

The first row in Table 4 presents the accounting matrix for the GVC of the chicken meat corridor in southern Brazil. Letter D, in the years 2015 and 2022, shows that the existing economic performance proves competitiveness in international trade, as private profits were USD 950.39 and USD 564.24 per ton of frozen whole chicken, respectively. Social profit (letter H) amounted to USD 1312.75/ton in 2015 and USD 792.65/ton in 2022, values that prove the productive efficiency and comparative advantage of this chain in Brazil compared to international market prices. On the other hand, these figures also show that competitiveness reduced during the COVID-19 pandemic, owing to the significant differences in profitability between the figures for 2015 and 2022.

4.3. Economic Coefficients of the Competitiveness of Brazilian Broiler Chickens during the COVID-19 Pandemic

The PAM method generated several economic performance coefficients for the chicken meat chain, such as the returns for the production factors and the inputs used, expressed in terms of efficiency (productivity and profitability) and taxation encumbrances on inputs and chicken meat (Table 5) as a result of existing policies.
The results for the broiler chain are shown in Table 5, and the coefficients for September 2015 and March 2022 were obtained using the same technologies and tax policies.

5. Discussion and Managerial Implications

5.1. Transformations in Brazilian Chicken Meat Prices and Competitive Performance after the COVID-19 Pandemic

This study found relevant effects of the pandemic on chicken meat prices in Brazil, with a strong reduction in competitiveness, and revealed numerous opportunities to increase organizational and technical innovation capabilities in industrial poultry farming. This knowledge about the transformations that have occurred can support the formulation of production and trade policies that seek the competitiveness of companies and the sustainability of the productive sector, as well as suggest the promotion of more management and governance changes such as, for example, prioritizing new assessments of reducing production costs and prioritizing value addition, as increasing the technical performance indices and improving the financial indicators can determine new economic advances and enable the reorganization of companies and the sector to increase performance.
The results that support these implications were divided into micro-, meso-, and macroeconomic dimensions, as the PAM method generated new information that allows us to understand the relevant points of the competitiveness of chicken meat and quantify the impacts for management purposes.

5.1.1. The Microeconomic Dimension: Changes in Costs, Revenues, and Profitability in the Brazilian Chicken GVC

The results come from a chain comprising an aviary and high-performance slaughterhouse with a high standard of management and governance. In the evaluations using the data of each cost and revenue item of each of the four links, which constituted Table 4, the items with the greatest impact on the cost of chicken meat were recognized as the cost of live chicken (finished chicken) coming from the farm, whereas, in poultry, the highest weights were attributed to intermediate inputs, such as the purchasing of chicks, feed, and medication, as also observed by other authors in Brazil (CONAB 2023; Santos Filho et al. 2018). It was observed that in 2015, the cost of producing chicken meat on the farm was USD 739.13 per ton of live chicken and was based on the price of BRL 2.92 per dollar, while in 2022, the cost was USD 963.46/ton and the per-dollar price was BRL 5.13.
Therefore, there was an increase of 30.49% in the cost of chicken meat production in Brazil. The largest increase in expenses occurred in the purchase of intermediate inputs, which represented 94.19% and 89.18% of the cost of production in the farm in 2022 and 2015, respectively. Day-old chick prices increased, as did grain expenditure. These went from USD 165.21/ton (25.06%) in 2015 to USD 241.44/ton (25.06%) in 2022. Generally, the percentage shares of these items in expenses are similar to those in other studies found in the literature (CEPEA 2023). In the agri-industry, the processing cost to obtain a ton of chicken meat was USD 94.06/ton in 2015, which increased to USD 137.16/ton in 2022.
During the pandemic, intermediate inputs in the agri-industry contributed 29.70% of total costs/ton of chicken meat, while labor accounted for 47.85%. In the logistical analysis, the fixed cost represented 3.87% of the total cost from the farm (USD 0.43/ton) and 6.37% of the total cost from the slaughterhouse to the port (USD 0.88/ton) in 2015. In 2022, the respective percentages were 9.69% (USD 0.26/ton) and 1.24% (USD 1.05/ton). Diesel was the main component of the transport cost in 2022, representing 27.22% of the total cost for the transfer of the whole frozen chicken to the port, whereas this participation was 39.75% for the live chicken transferred from the farm to the port. This is likely due to the high prices of this fuel in the international market following the pandemic.
The relationship between gross revenue and total expenses in the Brazilian poultry chain also changed owing to the COVID-19 pandemic. In 2015, in the agri-industry, this ratio, calculated using the formula “revenue/expenditure*100,” showed a result of 218.02%, while in 2022, this fell to 129.74%. The causes of this reduction were variations in exchange and interest rates, as reported by several Brazilian authors (ABPA 2023; CEPEA 2023). This generated information on new costs, revenues, and profits proves that the pandemic has increased expenses and reduced revenues and profits. These microeconomic changes represent a new theoretical framework and describe how firms can optimize production and cost efficiency given existing technologies and input prices.

5.1.2. The Mesoeconomic Dimension: Sectorial Variations That Impacted Prices in the Chicken GVC during the COVID-19 Pandemic

The international demand for meat is vigorous, and the market in Brazil has experienced sustained growth in recent years (USDA-FAS 2022) despite discussions about the possible threats of climate change (Lara and Rostagno 2013) and the emergence of alternative proteins (Andreoli et al. 2021). The national per capita consumption of chicken meat (45.27 kg) and pork (17.58 kg) increased by approximately 3 kg per capita in 2021, whereas that of beef (32.69 kg) reduced by 2 kg (Talamini and Martins 2022). Chicken and pork meat have much lower consumer prices than beef, in values that can reach up to 20% of the average prices of cuts, despite the large increase in animal feed costs (UNCTAD 2022; USDA-FAS 2022; World Bank 2023).
The production cost of a ton of live chicken in the aviary at the end of the process increased during the pandemic period, as it was 71.49% of a ton of chicken eviscerated and frozen in the agri-industry in 2022, while the share in 2015 was 38.32%. The percentage share of the cost of chicken at the end of the process in a ton of meat transported to the port was 59.34% in 2022, higher than in 2015 (31.13%).
Similarly, increases in the costs of intermediate inputs also occurred during this period of the pandemic because the expenses added up throughout the production chain; the values per ton of chicken conducted to the port of embarkation were USD1055.98/ton in 2015 and USD1193.28/ton in 2022 (Table 4), which indicates a 13% increase in the variable spending of the poultry chain during this period. Similarly, the costs of domestic production factors, such as capital and labor, especially in the Brazilian currency BRL/ton, increased in value and weight in the actual RE expenses, which impacted 10.43% of the total costs of the value chain in 2015, and 14.52% in 2022. This result is linked to an increase in the exchange rate, as reported by numerous authors (Talamini and Martins 2022; Zylbersztajn et al. 2015). Brazilian public policies in force since 2005 have considered several sectorial measures, such as aggressive trade policy and the valorization of family farms (USITC 2012).
Nevertheless, Brazilian logistics are considered uncompetitive in international trade (World Bank 2017). In Brazil, although logistics is the last frontier for reducing expenditure in the supply chain, further studies are lacking (Lepchak and Voese 2020). The reduction in the competitiveness of Brazil’s chicken meat chain was due to a shortage of inputs, which increased prices (Bairagi et al. 2022; Yu et al. 2020). This information is also supported by the fluctuations that occurred in Brazil’s gross domestic product (IBGE POF 2023), which fell by 3.9% in 2020 but grew by 4.6% in 2021 and 3.0% in 2022 (FGV IBRE 2023).

5.1.3. The Macroeconomic Dimension: Post-Pandemic Modifications to the Chicken GVC’s Comparative and Competitive Advantages

The estimates in Table 5 were divided into the following competitive capabilities.
(a) Competitive advantage (PPR: profit sharing in revenue, PAVR: value-added share in revenues, and VCP: profitability coefficient): The pandemic decreased the total profitability of the chicken chain by 32.31%, measured using the share of profit on revenue (PSRP). This means that the chain’s private revenue continued to outperform the costs of domestic inputs and factors, but with a sharp drop, likely due to an economic recession of 5% in 2020 (OECD-FAO 2022). The drop in levels of value aggregation over total revenue (PAVR) was 25.83% in 2022 compared to 2015.
(b) Comparative advantage (PDFAV: participation of domestic factors in the added value and total TFP: productivity): The total factor productivity (TFP) decreased from 1.74 to 1.40 from 2015 to 2022, a significant reduction of 19.54%. Therefore, the production chain obtained lower revenue from the expenses of intermediate inputs and the use of domestic factors. For a company, productivity indicates the possibility of increasing employees’ salaries, making new investments, or even continuing to operate (Lopes et al. 2012). On a national scale, productivity can be defined as the difference between quality-of-life standards. In comparative advantage analyses, stagnant or contracted productivity reveals future problems for individuals, organizations, and nations. This implies that management and governance measures should be promoted to value this coefficient.
(c) Impacts of protection and subsidy policies (NPNC: nominal product protection coefficient, nominal protection coefficient of the inputs, and EPC: effective protection coefficient): The policy vulnerability of Brazilian aviculture increased during the COVID-19 pandemic because the effective protection coefficient (the sum of the effects on the product and intermediate inputs) increased from 0.81 in 2015 to 0.85 in 2022. Similarly, the level of overall profitability of the chain fell slightly from 0.72 in 2015 to 0.71 in 2022, as the effects of policies increased slightly from 27.60% to 28.82%. This means that there was interference from policies that distorted the prices paid in the chain, as there was no change in the specific coefficient of the price received by the product. This result’s implication is related to the tax incident, which motivates producers to seek solutions to increase the added value to production because it is lower than the value added in economic terms (Lopes et al. 2012).

5.2. Conclusions and Future Research

This study evaluated the socioeconomic impact of the COVID-19 pandemic on the competitiveness of the Brazilian chicken meat production chain. The economic analysis of private and social prices in the four links used the PAM method. Competitiveness coefficients and the effects of policy on the chain before 2015 and during the 2022 COVID-19 pandemic were characterized and compared. The results revealed that there were significant increases in the production costs of chicken meat (30.49%). In the agro-industry, the cost of processing more than doubled, from USD 94.06/ton in 2015 to USD 137.16/ton in 2022. This caused a drop in total factor productivity (−19.54%) and gross revenue and lowered the tax collection volume. The pandemic reduced the chain’s profitability by 32.31% and reduced the competitiveness of exports.
The political vulnerability of Brazilian poultry farming increased during the pandemic due to high percentages of taxes, fluctuations in input prices, and significant distortions in production costs. This had an important impact on the Brazilian chicken meat chain’s competitiveness, with useful managerial and financial implications for stakeholders (Caetano 2022; Valdes 2022). This new condition revealed in the results of this study indicates that investments in the chain are viable and can be continued (Miller et al. 2022; Yuzaria et al. 2021). These results match market trends that indicate that chicken meat will be the most consumed livestock product in the world in the coming decades (Miller et al. 2022), especially in emerging and developing countries (UNCTAD 2022).
Another implication of the results was the perception that it is essential to continue and accelerate innovation and the exploration of the successful combination of physical capital and human capital with new and transparent business practices. This can be undertaken by incorporating more automation and digitalization via affordable financing and better basic infrastructure, such as with new agile and loss-reducing transport and storage logistics. Therefore, even with a historically competitive Brazilian chicken meat production chain, albeit given the reduction in its profitability, as demonstrated in this article, it is believed that future diagnoses of priority challenges will be essential and, therefore, listing the fundamental increases in productivity and continued investments in technological and organizational innovation capabilities, such as the remodeling of impacted businesses and strategic planning for the recovery of competitiveness indices prior to the COVID-19 pandemic event, will also be crucial.
To the best of our knowledge, no other study has investigated the impacts of the COVID-19 pandemic on the competitiveness of the Brazilian chicken meat production chain. The MAP method has proven to be a verifiable metric and can be reported as suitable for measuring the effects of crises and related policies that affect food markets. Additionally, methodological originality allows for periodic updates in real terms and in support of the formulation, monitoring, and evaluation of projects in agri-food systems. Specifically, this model is applicable to other meats traded on the international market, as it provides greater precision in business management and can estimate the impacts of risks on the availability or quality of food in health or geopolitical crises with robust results.
The limitations of this study involve the data collection time, as the economic condition in the Brazilian chicken meat chain was measured and compared in 2015 and 2022. The pandemic changed prices and competitiveness, as shown in this study; however, the initial disorganization of transactions in the chain is gradually recovering to the pre-pandemic levels. Therefore, despite this likely recovery of normality in the markets occurring, it was not studied. Another limitation of this study involves the use of the option of the internationalization of prices, which can be expanded in new studies, especially regarding the faithful capture of values transacted in international centers of price formation. This option could qualify the obtaining of social prices, enrich the formulation of public policies of interest to other countries, and subsidize new economic strategies in companies, in addition to generating information and insights for new studies.
Studies with the PAM method use the general equilibrium model of international trade and in this study they demonstrated how and how much divergence (distorting police and market failures) affects the values of outputs and inputs associated with global chicken meat systems. Future studies could focus on assessing the impacts of restrictive and distortionary non-tariff measures.

Author Contributions

Conceptualization, L.C.B.; methodology, L.C.B.; software, L.C.B.; validation, A.D.P. and M.N.P.; formal analysis, A.D.P. and M.N.P.; investigation, L.C.B.; resources, L.C.B. and A.D.P.; data curation, L.C.B.; writing—original draft preparation, L.C.B.; writing—review and editing, A.D.P. and M.N.P.; visualization, A.D.P. and M.N.P.; supervision, M.N.P.; project administration, L.C.B. and A.D.P.; funding acquisition, L.C.B. and A.D.P. All authors have read and agreed to the published version of the manuscript.

Funding

This research received no external funding.

Informed Consent Statement

Not applicable.

Data Availability Statement

Data are available upon reasonable request.

Acknowledgments

This research had institutional support from the Faculty of Economic and Managment Palmeira das Missões Campus-Federal University of Santa Maria, Embrapa-Brazilian Agricultural Research Corporation, School of Administration at the Federal University of Rio Grande do Sul (UFRGS) and the Department of International and Spanish Economics at the University of Granada, and the CNPq-National Council for Scientific and Technological Development (Brazil).

Conflicts of Interest

The authors declare no conflict of interest.

References

  1. Abu Hatab, Assem, Zhen Liu, Asmaa Nasser, and Abourehab Esmat. 2021. Determinants of SARS-CoV-2 impacts on small-scale commercial broiler production systems in Egypt: Implications for mitigation strategies. Animals 11: 1354. [Google Scholar] [CrossRef] [PubMed]
  2. Aday, Serpil, and Mehmet Seckin-Aday. 2020. Impact of COVID-19 on the food supply chain. Food Quality and Safety 4: 167–80. [Google Scholar] [CrossRef]
  3. Almeida, Mario Augusto Gouvêa, Hoyêdo Nunes Lins, and Eva Yamila da Silva Catela. 2020. Cadeias globais de valor, inovação e uppgrading: Estudo sobre empresas industriais Argentinas com base em microdados. Revista de Economia Contemporânea 24: 1–33. [Google Scholar] [CrossRef]
  4. Andreoli, Vania, Marco Bagliani, Alessandro Corsi, and Vito Frontuto. 2021. Drivers of protein consumption: A cross-country analysis. Sustainability 13: 7399. [Google Scholar] [CrossRef]
  5. Associação Brasileira de Proteína Animal (ABPA). 2023. Mercados, Estatísticas Setoriais e Relatório Anual. Available online: https://abpa-br.org/mercados/ (accessed on 19 January 2023).
  6. Attia, Youssef A., Md Tanvir Rahman, Md Jannat Hossain, Shereen Basiouni, Asmaa F. Khafaga, Awad A. Shehata, and Hafez M. Hafez. 2022. Poultry production and sustainability in developing countries under the COVID-19 crisis: Lessons learned. Animals 12: 644. [Google Scholar] [CrossRef]
  7. Awan, Tahir Mumtaz, Muhammad Shoaib Khan, Inzamam Ul Haq, and Sarwat Kazmi. 2021. Oil and stock markets volatility during pandemic times: A review of G7 countries. Green Finance 3: 15–27. [Google Scholar] [CrossRef]
  8. Bairagi, Subir, Ashok K. Mishra, and Khondoker A. Mottaleb. 2022. Impacts of the COVID-19 pandemic on food prices: Evidence from storable and perishable commodities in India. PLoS ONE 17: e0264355. [Google Scholar] [CrossRef]
  9. Bargoni, Augusto, Bernardo Bertoldi, Chiara Giachino, and Gabriele Santoro. 2022. Competitive strategies in the agri-food industry in Italy during the COVID-19 pandemic: An application of K-means cluster analysis. British Food Journal 124: 4782–99. [Google Scholar] [CrossRef]
  10. Belarmino, Luiz Clovis, Antonio Domingos Padula, and Margarita Navarro Pabsdorf. 2022. Economic sustainability in emerging agro-industrial systems: The case of Brazilian olive cultivation. Agriculture 12: 2085. [Google Scholar] [CrossRef]
  11. Biswal, Jyotsnarani, Kennady Vijayalakshmy, and Habibar Rahman. 2020. Impact of COVID-19 and associated lockdown on livestock and poultry sectors in India. Veterinary World 13: 1928–33. [Google Scholar] [CrossRef] [PubMed]
  12. Caetano, Gerardo. 2022. Analysis and foresight of the European Union-Mercosur Association Agreement. Madrid, Fundación Carolina. Fundación EU-LAC, Documentos de Trabajo. Occasional Paper, No. 4, p. 56. Available online: https://eulacfoundation.org/sites/default/files/2022-04/Especial_FC_EULAC_4_EN.pdf (accessed on 12 September 2023).
  13. CEPA EPAGRI-SC. Centro de Socioeconomia e Planejamento Agrícola-Empresa de Pesquisa de Santa Catarina. 2023. Boletim Agrícola. Available online: https://cepa.epagri.sc.gov.br/index.php/publicacoes/boletim-agropecuario/ (accessed on 19 January 2023).
  14. CEPEA. Centro de Estudos Avançados em Economia Aplicada. 2023. Frango. Série de Preços. Available online: https://cepea.esalq.usp.br/br/indicador/frango.aspx (accessed on 19 January 2023).
  15. Chen, Lurong. 2017. Globalization and trade liberalization in supporting GVCs upgrade: The case of the Republic of Korea. Journal of Korea Trade 21: 161–70. [Google Scholar] [CrossRef]
  16. Chen, Xiangfeng, Chenyu Wang, and Shuting Li. 2023. The impact of supply chain finance on corporate social responsibility and creating shared value: A case from the emerging economy. Supply Chain Management 28: 324–46. [Google Scholar] [CrossRef]
  17. Clapp, Jennifer. 2017. Concentration and power in the food system: Who controls what we eat? Global Environmental Politics 17: 151–52. [Google Scholar] [CrossRef]
  18. Clapp, Jennifer. 2019. The rise of financial investment and common ownership in global agrifood firms. Review of International Political Economy 26: 604–29. [Google Scholar] [CrossRef]
  19. CONAB. Companhia Nacional de Abastecimento. 2023. Preços Agrícolas. Available online: https://www.conab.gov.br/info-agro/precos (accessed on 19 January 2023).
  20. Constantin, Marius, Juan Sapena, Andreea Apetrei, and Simona Roxana Pătărlăgeanu. 2023. Deliver smart, not more! Building economically sustainable competitiveness on the ground of high agri-food trade specialization in the EU. Foods 12: 232. [Google Scholar] [CrossRef]
  21. DERAL-PR. Departamento de Economia Rural-Secretaria de Agricultura e Abastecimento do Paraná. 2023. Estatísticas Básicas. Available online: https://www.agricultura.pr.gov.br/Boletins-Informativos-Atuais (accessed on 19 January 2023).
  22. EC. 2021. EU Agricultural Outlook for Markets, Income and Environment, 2021–31. Brussels: European Commission, DG Agriculture and Rural Development, 83p. Available online: https://agriculture.ec.europa.eu/system/files/2023-01/agricultural-outlook-2021-report_en_0.pdf (accessed on 30 June 2023).
  23. Ellison, Brenna, Brandon McFadden, Bradley J. Rickard, and Norbert L. W. Wilson. 2021. Examining food purchase behavior and food values during the COVID-19 pandemic. Applied Econonomis Perspectives and Policy 43: 58–72. [Google Scholar] [CrossRef]
  24. Embrapa Suínos e Aves. 2023. Centro de Inteligência em Aves e Suínos. Available online: https://www.embrapa.br/suinos-e-aves/cias (accessed on 19 January 2023).
  25. Fafiolu, A.O., and Joal Alabi. 2020. Beyond COVID-19 pandemic period: Strategies for sustainable livestock feed and food production. Nigerian Journal of Animal Science 22: 107–21. [Google Scholar]
  26. Fang, Peixun, Ben Belton, Xiaobo Zhang, and Hnin Ei Win. 2021. Impacts of COVID-19 on Myanmar’s chicken and egg sector, with implications for the sustainable development goals. Agricultural Systems 190: 103094. [Google Scholar] [CrossRef]
  27. FAO FFPI. Food and Agriculture Organization of the United Nations. 2023. FAO Food Price Index. Available online: https://www.fao.org/worldfoodsituation/foodpricesindex/en/ (accessed on 19 January 2023).
  28. FAO RLC. Organización de las Naciones Unidas para la Agricultura y Alimentación-Oficina Regional para América Latina y Caribe. 2007. Competitividad de la agricultura em América Latina y el Caribe, matriz de analisis de política: Ejercicios de cómputo. Santiago: FAO-RLC, 113p. Available online: https://www.cepal.org/sites/default/files/courses/files/03_3_map_manual_fao.pdf (accessed on 23 January 2023).
  29. FAOSTAT. Food and Agriculture Organization of the United Nation-Statistics Division. 2023. Food and Agriculture Data. Available online: https://www.fao.org/faostat/en/#home (accessed on 25 February 2023).
  30. Feng, Yanhong, Shuanglian Chen, Xuan Wang, and Aaron Tan. 2021. Time-varying impact of U.S. financial conditions on China’s inflation: A perspective of different types of events. Quantitative Finance and Economics 5: 604–22. [Google Scholar] [CrossRef]
  31. FGV IBRE. Fundação Getúlio Vargas-Instituto Brasileiro de Economia. 2023. Índice de Preços. Available online: https://portalibre.fgv.br/indices-de-precos (accessed on 19 February 2023).
  32. GEF-WFP. Global Economic Forum-United Nations World Food Programme. 2023. Food Security. Available online: https://intelligence.weforum.org/topics/a1Gb0000000pTDPEA2 (accessed on 23 January 2023).
  33. Hafez, Hafez M., and Youssef A. Attia. 2020. Challenges to the poultry industry: Current perspectives and strategic future after the COVID-19 outbreak. Frontiers in Veterinarian Science 7: 516. [Google Scholar] [CrossRef]
  34. IBGE POF. Instituto Brasileiro de Geografia e Estatística. 2023. Pesquisa de Orçamentos Familiares (POF). Available online: https://www.ibge.gov.br/estatisticas/sociais/saude/24786-pesquisa-de-orcamentos-familiares-2.html (accessed on 19 January 2023).
  35. IBGE PPM. Instituto Brasileiro de Geografia e Estatística. 2023. Produção da Pecuária Municipal. Available online: https://www.ibge.gov.br/estatisticas/economicas/agricultura-e-pecuaria/9107-producao-da-pecuaria-municipal.html?=&t=resultados (accessed on 19 January 2023).
  36. IEA APTA. Instituto de Economia Agrícola-Agência Paulista de Tecnologia Agrícola de São Paulo. 2023. Valor de Produção. Available online: http://ciagri.iea.sp.gov.br/bancodedados/valorproducao (accessed on 19 January 2023).
  37. Lara, Lucas J., and Marcos H. Rostagno. 2013. Impact of heat stress on poultry production. Animals 3: 356–69. [Google Scholar] [CrossRef] [PubMed]
  38. Lepchak, Alessandro, and Simone Bernardes Voese. 2020. Evaluation of the efficiency of logistics activities using data envelopment analysis (DEA). Gestão & Produção 27: e3371. [Google Scholar] [CrossRef]
  39. Lopes, Mauro de Resende, Luiz Clovis Belarmino, Antônio Jorge Oliveira, Joaquim Raimundo de Lima, Daniela Parente Torres, Dirceu João Duarte Talamini, and Franco Müller Martins. 2012. Matriz de análise de política. Metodologia e análise. Brasília-DF, Embrapa, 227 pp. Available online: https://ainfo.cnptia.embrapa.br/digital/bitstream/item/197254/1/Matriz-analise-de-politica.pdf (accessed on 23 January 2023).
  40. Manning, Louise, and R.N. Baines. 2004. Globalization: A study of the poultry-meat supply chain. British Food Journal 106: 819–36. [Google Scholar] [CrossRef]
  41. MAPA. Ministério da Agricultura, Pecuária e Abastecimento-Estatísticas de Comércio Exterior do Agronegócio Brasileiro. 2023. Exportação/Importação e Tabelas de Agrupamentos. Available online: https://indicadores.agricultura.gov.br/agrostat/index.htm (accessed on 19 January 2023).
  42. Martindale, Wayne, and Walter Schiebel. 2017. The impact of food preservation on food waste. British Food Journal 119: 2510–18. [Google Scholar] [CrossRef] [PubMed]
  43. MDIC COMEX STAT. Ministério do Desenvolvimento, Indústria e Comércio-Estatísticas de Comércio Exterior. 2023. Exportação e Importação Geral. Available online: http://comexstat.mdic.gov.br/pt/geral (accessed on 19 January 2023).
  44. Miller, Matthew, Adam Gerval, James Hansen, and Grace Grossen. 2022. Poultry Expected to Continue Leading Global Meat Imports as Demand Rises. Washingthon, DC: USDA-ERS/Amber Waves-Features: Poultry & Eggs. Available online: https://www.ers.usda.gov/amber-waves/2022/august/poultry-expected-to-continue-leading-global-meat-imports-as-demand-rises/ (accessed on 19 January 2023).
  45. Monke, Eric A., and Scott R. Pearson. 1989. Policy Analysis for Agricultural Development. Ithaca: Cornell University, p. 294. [Google Scholar]
  46. Muresan, Iulia C., Rezhen Harun, Anca Monica Brata, Vlad Dumitru Brata, Daniel I. Chiciudean, Olivia Paula Tirpe, Andra Porutiu, and Diana E. Dumitras. 2022. Factors affecting food consumers’ behavior during COVID-19 in Romania. Foods 11: 2275. [Google Scholar] [CrossRef]
  47. Nkgadima, Kgothatso, and Chiedza L. Muchopa. 2022. Do import tariff adjustments bolster domestic production? Analysis of the South African-Brazilian poultry market case. Economies 10: 318. [Google Scholar] [CrossRef]
  48. Nonnenberg, Marcelo José Braga, Uallace Moreira Lima, Mateus Azevedo Araujo, Fernanda Pedrosa, and Scarlett Queen Almeida Bispo. 2021. Agribusiness trade between Brazil and China: Pillars and opportunities. IPEA-CAITEC, Brasília-DF. Discussion Paper 259. [Google Scholar] [CrossRef]
  49. Obese, Frederick Y., Richard Osei-Amponsah, Eric Timpong-Jones, and Edwin Bekoe. 2021. Impact of COVID-19 on animal production in Ghana. Animal Frontiers 11: 43–46. [Google Scholar] [CrossRef] [PubMed]
  50. OECD-FAO. Organisation for Economic Co-operation and Development-Food Agricultural Organization. 2022. OECD-FAO Agricultural Outlook 2022–31. Paris: OECD Publishing. [Google Scholar] [CrossRef]
  51. Qi, Yudong, and Xi Chu. 2022. Development of the digital economy, transformation of the economic structure and leaping of the middle-income trap. China Political Economy 5: 14–39. [Google Scholar] [CrossRef]
  52. Santos Filho, Jonas Irineu dos, Dirceu João Duarte Talamini, Gerson Neudi Scheuermann, and Teresinha Marisa Bertol. 2018. Impacto da logística brasileira nas cadeias produtivas de aves e suínos. Revista de Política Agrícola 27: 48–64. Available online: http://www.alice.cnptia.embrapa.br/alice/handle/doc/1097745 (accessed on 23 January 2023).
  53. Sattar, Abdullah Al, Rashed Mahmud, Md Abu Shoieb Mohsin, Nurun Nahar Chisty, Md Helal Uddin, Nusrat Irin, Tony Barnett, Guillaume Fournie, Eve Houghton, and Md Ahasanul Hoque. 2021. COVID-19 impact on poultry production and distribution networks in Bangladesh. Frontiers in Sustainable Food Systems 5: 714649. [Google Scholar] [CrossRef]
  54. Soendergaard, Niels, Camila Dias de Sa, and Ana Flavia Barros Platiau, eds. 2023. Sustainability Challenges of Brazilian Agriculture. Governance, Inclusion, and Innovation. Cham: Springer Nature. [Google Scholar] [CrossRef]
  55. Sohag, Kazi, Md Monirul Islam, Ivana Tomas Žiković, and Hoda Mansour. 2023. Food inflation and geopolitical risks: Analyzing European regions amid the Russia-Ukraine war. British Food Journal 125: 2368–91. [Google Scholar] [CrossRef]
  56. Surni, Nendissa, Doppy Roy, Muhaimin Abdul Wahib, Maria Haryulin Astuti, Putu Arimbawa, Maximilian MJ Kapa, and Evi Feronika Elbaar. 2021. Socio-economic impact of the COVID-19 pandemic: Empirical study on the supply of chicken meat in Indonesia. AIMS Agricultural and Food 6: 65–81. [Google Scholar] [CrossRef]
  57. Talamini, Dirceu João Duarte, and Franco Müller Martins. 2022. A avicultura brasileira e o mercado mundial de carnes. Anuário 2022 da Avicultura Industrial 114: 14–21. Available online: https://www.infoteca.cnptia.embrapa.br/handle/doc/1150191 (accessed on 23 January 2023).
  58. Todua, Nugzar, and Charita Jashi. 2015. Some aspects of social media marketing (Georgian case). Journal of Business, Human and Social Sciences 9: 1160–63. [Google Scholar] [CrossRef]
  59. Torres, Danielle Alencar Parente, Joaquim Raimundo Lima Filho, and Luiz Clovis Belarmino. 2013. Competitividade das cadeias agroindustriais Brasileiras. Brasília, DF, Embrapa, 191p. Available online: https://ainfo.cnptia.embrapa.br/digital/bitstream/item/197253/1/Competitividade-de-cadeias-agroindustriais.pdf (accessed on 23 January 2023).
  60. UNCTAD. United Nations for Conference on Trade and Development. 2022. World Investment Report 2022. Available online: https://unctad.org/publication/world-investment-report-2022 (accessed on 11 November 2022).
  61. USDA-FAS. United State Department of Agriculture-Foreign Agriculture Service-GAIN. 2022. Poultry and Products Annual September. Available online: https://www.fas.usda.gov/data/brazil-poultry-and-products-annual-8 (accessed on 19 January 2023).
  62. USITC. United State International Trade Commission. 2012. Brazil: Competitive factors in Brazil affecting U.S. and Brazilian Agricultural Sales in Selected Third Country Markets. Washington, DC, Investigation No. 332-524, USITC Publication 4310, 422p. Available online: https://www.usitc.gov/publications/332/pub4310.pdf (accessed on 11 November 2022).
  63. Valdes, Constanza. 2022. Brazil’s Momentum as a Global Agricultural Supplier Faces Headwinds. Washinthon, DC: USDA-ERS. Available online: https://www.ers.usda.gov/amber-waves/2022/september/brazil-s-momentum-as-a-global-agricultural-supplier-faces-headwinds/ (accessed on 11 November 2022).
  64. Wijerathna-Yapa, Akila, and Ranjith Pathirana. 2022. Sustainable agro-food systems for addressing climate change and food security. Agriculture 12: 1554. [Google Scholar] [CrossRef]
  65. World Bank. 2017. Brazil-Multimodal Freight Transport: Selected Regulatory Issues. Washington, DC: World Development Sources, WDS 1998-1, 61p. Available online: http://documents.worldbank.org/curated/en/931541468224701179/Brasil-Transporte-multimodal-de-carga-questoes-regulatorias-selecionada (accessed on 19 February 2023).
  66. World Bank. 2023. World Bank Commodities Price Data (the Pink Sheet). Available online: https://www.worldbank.org/en/research/commodity-markets (accessed on 19 January 2023).
  67. Wu, Yilin, and Shiyu Ma. 2021. Impact of COVID-19 on energy prices and main macroeconomic indicators-evidence from China’s energy market. Green Finance 3: 383–402. [Google Scholar] [CrossRef]
  68. Yeong, Siew-Wei, Mukvinder Kaur Sandhu, and Hiram Ting. 2021. The future of food: Responsible production, acquisition, consumption and disposition. British Food Journal 123: 2953–58. [Google Scholar] [CrossRef]
  69. Yu, Xiaohua, Chang Liu, Hanjie Wang, and Jan-Henning Feil. 2020. The impact of COVID-19 on food prices in China: Evidence of four major food products from Beijing, Shandong and Hubei Provinces. China Agricultural Economic Review 12: 445–58. [Google Scholar] [CrossRef]
  70. Yuzaria, D., A. R. Wahyuni, and M. Fajrin. 2021. Competitiveness and effect of government policies on laying hens farming business in West Pasaman Regency, West Sumatra Province. Indonesia. IOP Conference Series: Earth and Environmental Science 757: 012010. [Google Scholar] [CrossRef]
  71. Zeballos, Eliana, Xiao Dong, and Ergys Islamaj. 2023. A Disaggregated View of Market Concentration in the Food Retail Industry. ERR-314, U.S. Department of Agriculture, Economic Research Service, 21p. Available online: https://www.ers.usda.gov/publications/pub-details/?pubid=105557 (accessed on 11 November 2022).
  72. Zylbersztajn, Decio, Marcos Fava Neves, and Silvia Morales de Queiroz Caleman. 2015. Gestão de sistemas de agronegócios. São Paulo: PENSA-FIA-FEA/USP, 328p. Available online: https://edisciplinas.usp.br/mod/resource/view.php?id=3064690 (accessed on 11 November 2022).
Figure 1. Main countries by the quantity produced, yield/carcass weight, and quantity and values exported of chicken meat. Source: FAOSTAT (2023).
Economies 11 00238 g001
Figure 2. Brazilian export values and observed prices in Brazil and in competitors for chicken meat. Sources: FAOSTAT (2023), MAPA (2023), and CEPEA (2023).
Economies 11 00238 g002
Table 1. The COVID-19 pandemic and associated consequences on chicken meat production and markets worldwide and in Brazil.
Impacts of the COVID-19 Pandemic on the Chicken Meat Chain and Causes or Solution Strategies
ImpactsConsequences
WORLDWIDEInitial reduction in consumption and trade
Poor and reduced logistics
Macroeconomic changes
Biggest price increase in history
Uncertainties about harmlessness
Blockages in production
Lower economic growth of countries
Shortage of production inputs
Decreased business
Prices dropped initially and then rose sharply
Discrepancy between supply and demand
Billions in losses in India
Decrease in imports, followed by recovery
BRAZILUninterrupted production and slightly lower exports
Consumption and retail changed at the beginning of forced isolation
Shortages in the supply of imported agricultural inputs in 2020 and 2021
Assistance and social security policies and relative inflation control
Ephemeral reductions in exports in 2020 (volume and value) and in consumption (see Figure 1 and Figure 2)
Increase in online purchases, adaptation to circulation control systems, and full recovery of exports in 2021
Adaptation of aviaries and agri-industries
Substantial replenishment of exports from Ukraine
Source: Constructed by the authors, with updates from the literature cited.
Table 2. Structure of the accounting matrix of the Policy Analysis Matrix method.
PriceRevenueCostsProfits
Inputs TradableDomestic Factors
PrivateABCD (1)
SocialEFGH (2)
Differences I (3) J (4) K (5)L (6)
Source: Monke and Pearson’s (1989) striking indicators; FAO RLC (2007) and Lopes et al. (2012). PAM’s accounting results: (1) private profits (D = A–B–C); (2) social profits (H = E–F–G); (3) revenue transfers (I = A–E); (4) transfers of inputs (J = B–F); (5) factor transfers (K = C–G); and (6) net transfers (L = D–H or L = I–J–K).
Table 3. Productivity, profitability, and taxation coefficients were used in the evaluation of economic performance of the chicken meat chain after the COVID-19 pandemic in Brazil.
Coefficient of PerformanceFormulaInterpretation Importance
1. Profit Sharing in Revenue (PPR)
–Private(D/A)*100Share of profit in revenue Rate of return
–Social(H/E)*100How much of the revenue is profitContinuity of the chain
2. Share of Added Value in Revenue (PAVR)
–Private((A–B)/A)*100Percentage of value additionValue created in the chain
–Social((E–F)/E)*100Value addedCapacity for innovation
3. Share of Domestic Factors in Added Value (PDFAV)
–Private (C/(A–B))*100Domestic factors’ remunerationTendency is to reduce
–Social(G/(E–F))*100Efficiency gain/lossAggregation performance
4. Total Factor Productivity (FTP)
–PrivateA/(B + C)Overall revenue result minus costsChain performance measure
–SocialE/(F + G)Growth of productive efficiencyAbility of the chain to grow
5. Nominal Product Protection Coefficient (NPCP)A/ECalculates the taxation of chicken meatAssesses the economic distortions to be corrected
6. Nominal Entry Protection Coefficient (NPCI)B/FEvaluates the taxation incident on the inputs used in the chainHigher taxation reduces the competitiveness of the chain
7. Effective Protection Coefficient (EPC)(A–B)/(E–F)General measure of taxation that burdens gains in the chainThe weight of public policies in reducing profits
8. Vulnerability of Policy Chains (VCP)((H–D)/H)*100Measures the increase in profitability by removing taxationGreater technification generates less vulnerability
9. Profitability Coefficient (PC) D/HEstimates the value of all policies in the profitability of the chainInterventional terms shuttle income from the chain
10. Chain Taxation Level (CTL)(L/E)*(−1)*100Total amount of taxation levied on chain transactionsExcessive taxation reduces the supply chain competitiveness
Source: Monke and Pearson’s (1989) striking indicators; FAO RLC (2007) and Lopes et al. (2012).
Table 4. Competitiveness indicator results in the Brazilian chicken meat chain, in dollars (USD) per ton before (2015) and after (2022) the COVID-19 pandemic.
PricesRevenuesCosts Profits
Tradable InputsDomestic Factors
PrivateABCD
20152.234, 621.055, 98228, 25950, 39
20221.960, 131.193, 28202, 62564, 24
SocialEFGH
20152.252, 13792, 25147, 131.312, 75
20221.979, 891.073, 66113, 58792, 65
DivergenceIJKL
2015(−17, 51)263, 8581, 12(−362, 36)
2022(−19, 76)119, 6289, 04(−228, 41)
Source: based on search results in Lopes et al. (2012). Note: In September 2015, one US dollar was quoted, on average, at BRL3.92, and in March 2022, it had a change in exchange equal to BRL4.74.
Table 5. Competitiveness coefficients and effects of policy on the Brazilian production chain of broilers before (2015) and during (2022) the COVID-19 pandemic.
Coefficients, Formulas, and Results for Brazilian Chicken Meat Competitiveness 20152022
1. Profit Sharing in Revenue (PPR)
–Private, PPR = (D/A)*10042.53%28.79%
–Social, PPR = (H/E)*10058.29%40.03%
2. Share of Added Value in Revenue (PAVR)
–Private, PAVR = ((A–B)/A)*10052.74%39.12%
–Social, PAVR = ((E–F)/E)*10064.82%45.77%
3. Share of Domestic Factors in Added Value (PDFAV)
–Private, PDFAV = (C/(A–B))*10019.37%26.42%
–Social, PDFAV = (G/(E–F))*10010.08%12.53%
4. Total Factor Productivity (FTP)
–Private, FTP = A/(B + C)1.741.40
–Social, FTP = E/(F + G)2.401.67
5. Nominal Product Protection Coefficient (NPCP), NPCP = A/E0.990.99
6. Nominal Entry Protection Coefficient (NPCI) B/F, NPCI = B/F1.331.11
7. Effective Protection Coefficient (EPC), EPC = (A–B)/(E–F)0.810.85
8. Vulnerability of Policy Chains (VCP), VCP = ((H–D)/H)*10027.60%28.82%
9. Profitability Coefficient (PC), PC = D/H0.720.71
10. Chain Taxation Level (CTL), CTL = (L/E)*(−1)*10016.09%11.54%
Source: results obtained using the PAM method, FAO RLC (2007), Lopes et al. (2012), and Torres et al. (2013).
Disclaimer/Publisher’s Note: The statements, opinions and data contained in all publications are solely those of the individual author(s) and contributor(s) and not of MDPI and/or the editor(s). MDPI and/or the editor(s) disclaim responsibility for any injury to people or property resulting from any ideas, methods, instructions or products referred to in the content.

