1. Introduction
The popularity of cryptocurrencies is increasing year by year with transactions of trillions of dollars every day. The trend of this cryptocurrency wave continues to increase every year with a market capitalization value of more than USD 2.3 trillion as of December 2021. The growth of cryptocurrency market capitalization over the last 10 years has reached more than 1000%. Despite this, Bitcoin’s performance at the end of 2019 has fallen by more than 50% from its peak in May 2019. However, there was a five-fold increase in Bitcoin price from the end of 2019 to USD 50,000 in 2021. This attracted many investors to the cryptocurrency market. The rapid increase in cryptocurrency transactions as exchange rates and investments has become a major attraction for both retail and institutional investors (
Chowdhury et al. 2022;
Nakagawa and Sakemoto 2022).
Several investors believe that cryptocurrency is the currency of the future and make this cryptocurrency a prospective investment. Cryptocurrency as an alternative investment is still being debated. Many practitioners and academics try to evaluate the true value of cryptocurrencies. However, until now, there are no precise guidelines for valuing this instrument. However, one thing to be aware of when investing in cryptocurrency is there are still few regulations that support cryptocurrency operations. However, the development of technology shares in the capital market is also growing rapidly. For example, the S&P 500 Information Technology Index skyrocketed by 48% in 2019. That year saw the biggest increase in the S&P 500 after 2009, which jumped by 60%. One example of a contributor to the surge in the technology stock index is the giant technology company Apple; its shares skyrocketed by 84% in 2019. The technology sector index contained in the Nasdaq 100 Technology Sector also shows an increase of more than 33% over the past year as of 30 November, 2021 (
Chu et al. 2021).
From these two phenomena, some researchers try to find a correlation between the cryptocurrency market and technology company stocks. It is possible that herding behavior may arise in cryptocurrency transactions and technology company stocks. Herding behavior is a behavioral phenomenon among investors who imitate the crowd’s behavior. The phenomenon of herding is more prominent during market stress, which can lead to market imbalances and excessive volatility (
Ah Mand et al. 2021;
Devenow and Welch 1996). Wavelet analysis revealed a substantial correlation between herding behavior in the Chinese market and other developed and emerging markets (BRICS), particularly during the initial wave of the pandemic (
Ghorbel et al. 2022b).
The stock market in China has a higher tendency to exhibit herding behavior. The Chinese stock market has developed tremendously in the last 10 years. This phenomenon is supported by the rapid development of technology stocks in China with the behavior and cultural environment of investors different from the US stock market. Then, the emergence of the COVID-19 pandemic in China strengthened the phenomenon of grazing in the cryptocurrency market due to the lockdown. The lockdown has kept many people at home, and there has been an increase in electronic money transactions, including transactions via cryptocurrency. Every case of COVID-19 that is spread around the world, on average, is positively correlated with trading volume and cryptocurrency market capitalization. Herding behavior is likely to reduce investors’ fears and restore their confidence in the market because they move together in a crowd (
Agyei et al. 2022;
Cheng et al. 2019;
Jabotinsky and Sarel 2020;
Rubbaniy et al. 2021).
In the initial period of COVID-19, cryptocurrencies experienced the biggest drop in their history on 12 March, 2020. Bitcoin experienced a 37.17% drop, and Ethereum also experienced a 42.35% drop in one day. However, on the same date, the price of technology stock indexes in China and India also decreased. For example, India (NSEIT) fell by 8.83%, and Chinese technology stocks (XA90) fell by 1.13%. This phenomenon allows for a structural break to occur. There were unexpected changes in stock prices and cryptocurrencies due to the COVID-19 pandemic that started in China. The simultaneous decline in the prices of Asian technology stock indices and cryptocurrency markets suggests that there is a possibility of herding behavior and co-movement between the two markets. This herding and co-movement phenomenon is allegedly related to the technology stock business model, which indirectly exists in the technological ecosystem environment related to cryptocurrencies such as the use of blockchain technology as a token. Blockchain technology is a new technology developed for digital data storage. This technology is often associated with cryptocurrencies. This blockchain technology is closely related to the business models carried out by technology companies so that the two can be interrelated (
Bejaoui et al. 2023;
Chu et al. 2021;
Ghorbel et al. 2022a;
Ghorbel et al. 2022b;
Wang et al. 2020). This phenomenon is reinforced by the research of Jeribi and Ghorbel, which found that there is a dynamic relationship between the cryptocurrency market and the stock market in the BRICS (Brazil, Russia, India, China, and South Africa). During the financial crisis due to the COVID-19 pandemic, the cryptocurrency market has become a safer place for developing countries compared to the stock market. The results of their research show that there is a high rate of adoption of cryptocurrencies in developing countries (
Jeribi and Ghorbel 2021).
Chainalysis (
2022) issued a Global Crypto Adoption Index report in which India ranked first and China ranked second in the categories “Centralized service value received” and “Retail centralized service value received.” The value of on-chain cryptocurrency received on centralized exchange metrics is a calculation of the total cryptocurrency received by users of centralized services in each country. Then, the calculation results are weighted on-chain value based on purchasing power parity per capita (PPP). The value of on-chain cryptocurrency received on centralized exchange metrics is a calculation of the total cryptocurrency received by users of centralized services in each country. Then, the calculation results are weighted on-chain value based on purchasing power parity per capita (PPP). Meanwhile, the on-chain retail value received on centralized exchanges is a calculation of individual cryptocurrency transaction activity. This variable measures the amount of cryptocurrency transferred in any retail transaction with a cryptocurrency value below USD 10,000. The results of the report show that retail investors in India and China are actively conducting transactions via cryptocurrencies. This contrasts with the policies of the two countries, which have repeatedly banned cryptocurrency transactions. Therefore, this study aims to analyze the extent to which herding behavior changes the pattern of co-movement between technology stock indices in China and India with Bitcoin and Ethereum cryptocurrencies (
Chainalysis 2022).
Previous research on the relationship that the cryptocurrency market has with stock indexes has yielded mixed and contradictory results. Mariana et al. 2020 found Bitcoin and Ethereum to be suitable short-term havens when compared to the American stock market (S&P 500 Compared to Bitcoin). Ethereum is the preferred asset as a safe haven during stock market crashes, such as during the COVID-19 pandemic. Apart from that, Ethereum also has a higher volatility and rate of return than Bitcoin, so it is highly sought after by retail investors. In contrast,
Conlon et al. (
2020) note that it was Tether that acted as a safe haven for global stock markets during the financial crisis due to COVID-19. Their research concluded that neither Bitcoin nor Ethereum was a safe haven during the COVID-19 pandemic. However, so far, no one has examined the relationship between technology indices in India and China and the cryptocurrency market specifically based on the herding behavior of changes in co-movement patterns during the COVID-19 pandemic. This study poses a research question: How is herding behavior through changes in the pattern of co-movement between Chinese and Indian technology stock indices and cryptocurrency markets during the COVID-19 pandemic? Furthermore, the bi-wavelet analysis method will be used to analyze herding behavior with the phenomenon of changing patterns of co-movement based on
Ghorbel et al. (
2022b). This method has advantages in visualizing patterns and “heat maps” of the co-movement of an asset graphically with Monte Carlo simulation of the relationship.
This paper will be presented in six main sections. The first part is the introduction, which explains the background of the problem and research questions. In
Section 2, a review of the literature on technology stock indices and cryptocurrencies is reviewed based on related references.
Section 3 presents an explanation regarding the research method using coherence analysis using the bi-wavelet method.
Section 4 describes the research data used in this study.
Section 5 presents the research results in the form of descriptive statistics and bi-wavelet images.
Section 6 is a discussion of the results and implications of the research. Then,
Section 7 will provide conclusions and suggestions for further research.
2. Literature Review
2.1. Cryptocurrency Market and Technology Stock Indices
Cryptocurrency is an electronic money system with the concept of peer-to-peer transactions without a third party as an intermediary. Transactions of exchange of ownership of assets and settlement of direct payments from one party to another are carried out directly. Cryptocurrencies use modern cryptographic methods to control the creation of transaction units and ensure the security of transaction data through an encrypted distributed ledger. The data are stored in a blockchain system to maintain data security and validity (
Bech and Garratt 2017;
Mo et al. 2022).
Bitcoin is a pioneer of cryptocurrency, namely a new form of money with the concept of “peer to peer.” That is, transactions are carried out without intermediaries, but using modern mathematical models and cryptographic encryption. Bitcoin operates independently and automatically using peer-to-peer technology that processes transactions and issues collectively by members of a blockchain-based network. The Bitcoin network is built on distributed ledger records. The record uses a blockchain method that contains a linked data set of related transaction units. The data in the distributed ledger contain information related to data for each transaction, total value, date, time, buyer, and seller. Each transaction is assigned a unique encrypted identifier. Transactions of data entries are arranged chronologically by creating an encrypted digital data blockchain (blockchain). The blockchain system is a decentralized system, so it is not controlled by any central party or organization. Any changes to transaction data are permitted by a consensus method that requires the approval of many network members. Then, the blockchain ledger is distributed to all members of the network, which can be accessed by those who have the encryption key. The contents of the note are encrypted with modern cryptography so that only those with the encryption key can view or link to the next block of data (
Bech and Garratt 2017;
Jeris et al. 2022).
From 2009 to 2021, the cryptocurrency market has circulated 18.9-million Bitcoins on the cryptocurrency market with a total market capitalization of approximately USD 875.9 million. Then, around 10,363 active cryptocurrencies with various functions were circulated at the end of December 2021 with an aggregate value of more than USD 2.2 trillion. Bitcoin represents around 40.22% of the total value of the entire cryptocurrency market, and Ethereum ranks as the second-largest market capitalization at 20.51%. The Bitcoin price touched USD 47,910.66, even though it fell in 2022 to USD 27,000 (
Assaf et al. 2023;
Lahiani et al. 2021).
Besides Bitcoin, Ethereum, as the second-largest market capitalization cryptocurrency in the cryptocurrency market, takes advantage of the advantages of blockchain with a feature called “smart contracts.” These smart contracts can be replicated and processed on all computers on the network without a central coordinator with the help of a consensus system. Ethereum is a blockchain technology that consists of transaction data or public records of transactions linked together by a cryptographic set. Each data block is difficult to modify because it is stamped with user data, time, and date, and it requires consensus on making data changes to be approved by all or most users. The Ethereum system can replace an escrow agent, notary, identity-providing bank teller, or mortgage originator for instant digital transactions. Data up to 31 December, 2021, shows that the price of Ethereum has reached USD 3783.67, making it the second-largest cryptocurrency by market cap in the world. Ethereum does have a smart contract feature that can track and facilitate all transactions on its network (
Apergis 2022;
Dwita Mariana et al. 2021).
Academics are increasingly conducting research into the relationship that cryptocurrency markets have with technology stock indices. Cryptocurrencies and conventional assets, such as the S&P 500, crude oil, and gold, have a dynamic relationship to external economic and financial shocks. The response caused by Bitcoin to the United States stock market indices was lower than the response of the American stock market to Bitcoin, especially the S&P 500 (
Charfeddine et al. 2020;
Wang et al. 2020).
Several studies show that the impact of the Bitcoin cryptocurrency on the US stock index shows a unidirectional relationship between Bitcoin and the S&P 500 Index. The results of these studies identify that a positive shock to Bitcoin can cause a negative shock to the S&P 500 Index. Meanwhile, if there is a negative shock to Bitcoin, it can cause both negative and positive shocks on the S&P 500 Index (
Chu et al. 2021;
Conrad et al. 2018).
The stock price index, especially the technology sector, was also affected by external factors, such as economic conditions due to the subprime mortgage in 2008 and the COVID-19 pandemic in early 2020. When COVID-19 appeared, panic occurred in the stock market. The volatility index (VIX) rose sharply in the past few days. The global stock market continues to fall, even triggering a circuit-breaker mechanism in several countries. The US stock market suffered the biggest decline. The Dow Jones Index fell by 2353 points on 12 March, 2020, as COVID-19 increased sharply in America. This was the biggest decline in the Dow Jones Index after the 1987 Black Monday incident. In addition, stock indices in Europe and Asia, such as China and India, also experienced a similar sharp decline during the early days of the COVID-19 pandemic around March 2020 (
Dong et al. 2022).
China’s technology stock index is also responding to the COVID-19 pandemic. China’s technology stock index is driven by tech companies such as Huawei, JD.com, Alibaba, and Tencent. These companies have become global technology companies. Apart from China, the development of the technology stock index in India is no less interesting. India’s vibrant software as a service (SaaS) industry will be worth USD 1 trillion in fewer than 10 years. Not only in terms of valuation, but the workforce in India will also be used to develop this industry so that it will have an incredibly good impact on the entire Indian economy. NSEIT consists of 10 companies in the IT services and consulting industry, which are listed under the National Stock Exchange of India. It has a return of 48.78% in one year and 135.89% in the last two years. Founded in 2005, NSEIT has an average volume for 3 months, namely 27,261,097, which is quite high in Asian countries (
Garg 2021). The BRICS stock market is the most unstable compared to developed markets such as America. The research did not find cryptocurrency to be a “Safe Haven” for the BRICS market. The correlation of five cryptocurrencies, namely Bitcoin, Ethereum, Ripple, Dash, and Monero, with the BRICS market does not show any substantial correlation with the stock market. Many researchers predict that Bitcoin can be treated like new gold, but the cryptocurrency is poorly correlated with the stock markets of the BRICS countries (
Jeribi and Ghorbel 2021;
Jeris et al. 2022;
Lahiani et al. 2021;
Wang et al. 2020).
Bitcoin and Ethereum are considered weak hedges or safe havens for the equity market. The dependency relationship between cryptocurrencies and Japanese stock market indices is mostly positive, which is consistently developing. The stock market is vulnerable to price fluctuations in the cryptocurrency market, especially technology stocks. However, Bitcoin has not shown much impact on the stock market in China (
Corbet et al. 2020;
Jiang et al. 2022;
Umar et al. 2021).
2.2. Impact of the COVID-19 Pandemic on Stock and Cryptocurrency Markets
COVID-19 is a pathogen that targets the human respiratory system. COVID-19 became a pandemic in early 2020, which became a major threat to humans worldwide. The beginning of COVID-19 is known to have started in Wuhan, China. There are many symptoms caused by COVID-19; the most found are coughs, runny nose, fever, and difficulty breathing, among others. From 1 January, 2020 to 31 December, 2021, there were 94-million people affected by COVID-19 worldwide. The global death rate is predicted to reach 2 million. The steps taken by the authorities of various countries are trying to prevent the spread of COVID-19. These steps range from lockdowns, to making and injecting vaccines, to tracking COVID-19 patients to slow the spread of COVID-19. The world economy is slowing down and affecting the stock market, so it can be concluded that the COVID-19 pandemic has had a significant impact on stock returns (
Bakry et al. 2022;
Hamid et al. 2020;
Takyi and Bentum-Ennin 2021;
Topcu and Gulal 2020;
Xu et al. 2022).
Several previous studies have found a relationship between cryptocurrencies and stock market indices in various countries. Gil-Alana, Abakah, and Rojo revealed that there is not much of a bilateral relationship between cryptocurrency markets, various stock indices, and commodities (
Gil-Alana et al. 2020). Price movements on stock indices and traditional asset markets have no direct influence on cryptocurrencies. They use both integrated and cointegrated fractional models. Then, the research data were obtained from six cryptocurrencies, namely Bitcoin, Ethereum, Tether, Ripple, Litecoin, and Stellar, which were obtained from 7 May, 2016 to 5 October, 2018. Meanwhile the stock indices used for comparison were the S&P 500, S&P GSCI Commodities, VIX, S&P Bond Indices, S&P GSCI Gold, and US Dollar Nominal Broad Index. Wang, Wang, Yin, and Ji (
Wang et al. 2022) find that there is a dynamic relationship between cryptocurrencies, namely Bitcoin and Ether and American stock indexes, namely the NASDAQ-100 Index, Dow Jones Industrial Average Index, and the S&P 500 Index. Therefore, they argue that price movements in the cryptocurrency market can be a tool for predicting fluctuations in traditional financial markets.
In addition, there are also those who are looking for a connection between cryptocurrencies and COVID-19. Based on research conducted by Wang, Chen, and Zhao (
Wang et al. 2020) it is known that there is a relationship between Bitcoin and the United States stock market. However, the response that Bitcoin elicited to the United States stock market was weaker, compared to the reverse relationship. In addition, research conducted by Wang, Wang, Yin, and Ji (
Wang et al. 2022) also states that there is a dynamic relationship between cryptocurrencies and American stock indices. In accordance with the previous research, the group has a conjecture that there is indeed a strong relationship between the price movements of technology stock indexes in Asia and the cryptocurrency market movements. So, the first hypothesis that the group stretches is that there is a strong relationship between the price movements of technology stock indexes in Asia and the movements of the cryptocurrency market.
In the research conducted by Raza, Shah, Guesmi, and Msolli, it was found that COVID-19 caused related impacts in various cryptocurrencies (
Raza et al. 2022). This phenomenon is also supported by research conducted by Kumar, Iqbal, Mitra, Kristoufek, and Bouri at two different time periods. They found that the dynamic relationship between the 10 major cryptocurrencies increased during the COVID-19 period compared to before the COVID-19 pandemic (
Kumar et al. 2022). Another study conducted by Marobhe found that the price shocks experienced by cryptocurrency (Bitcoin) during the COVID-19 pandemic were different from the price shocks experienced by the S&P 500, FTSE 100, and SSE stock indices (
Marobhe 2021). Cryptocurrencies tend to be more resilient during these challenging times and managed to recover in a short time at the start of the pandemic, starting from April 2020. The results further reveal Bitcoin’s strong predictive power on the prices of other cryptocurrencies so that it can be concentrated as a safe-haven investment during the COVID-19 pandemic.
The effects of the COVID-19 pandemic on stock and cryptocurrency market volatility show similarities over time. The frequency scale on the heat map for each period shows the same phenomenon. Using time-frequency analysis, various studies point to high movement and interdependence around the peak of COVID-19 around March 2020. There is a strong dynamic correlation between US stock indices and Bitcoin. Bitcoin underperformed in hedging during the crisis of the COVID-19 pandemic. In contrast to China, Bitcoin does not have a significant relationship with the stock market in China. The decline in Bitcoin price is not only caused by the COVID-19 pandemic but also due to the microstructure of the crypto exchange market. When using high-frequency data, they found a unique relationship between Bitcoin and the Chinese stock market at the start of the COVID-19 pandemic. During the pre-COVID-19 period, there was a negligible overflow of returns and volatility between the cryptocurrency market and the US stock market. Similarly, the volatility spillover was not significant for the S&P 500–Ethereum and S&P 500–Bitcoin pairs during the COVID-19 pandemic period (
Bakry et al. 2022;
Corbet et al. 2020;
Grobys and Junttila 2021;
Umar et al. 2021;
Yousaf and Ali 2020).
Stock market index returns (S&P 500) have a significant impact on Bitcoin returns in times of high uncertainty, such as during the COVID-19 pandemic. However, in the pre-COVID-19 period with low or medium uncertainty, the effect was quite the opposite. During this period, the stock market index (S&P 500) had no significant effect on Bitcoin. This phenomenon indicates that investors need to pay attention to period and time variations as the level of uncertainty increases or decreases. This is necessary to optimize investor portfolios in the future in the event of a financial crisis (
Jeris et al. 2022;
Nguyen 2022).
Research manuscripts reporting large datasets deposited in a publicly available database should specify where the data have been deposited and provide the relevant accession numbers. If the accession numbers have not yet been obtained at the time of submission, please state that they will be provided during review. They must be provided prior to publication.
3. Methodology
This study uses the bi-wavelet approach used by Goodell and Goutte (
Goodell and Goutte 2021). Their research analyzed shifts in COVID-19 mortality with cryptocurrencies and found strong shifts at certain times of the year when COVID-19 deaths increased. Therefore, this study also uses the bi-wavelet analysis method to determine herding behavior from changes in co-movement patterns of Asian technology stock indexes and cryptocurrencies. A time-series analysis using the bi-wavelet coherence method allows for the capturing of the co-movement between two time series in the time and frequency domains in the form of visuals and heat maps. This method is different from standard time series modeling, so the authors choose to use a bi-wavelet coherence approach in exploring herding behavior via the co-movement of Asian technology stock indices with cryptocurrencies.
In this study, the daily rate of return (r) of cryptocurrencies and technology stock indexes is calculated by finding the difference between the t price minus the price at t − 1 divided by the previous price (t − 1): r = (Pt − P(t−1))/P(t−1).
The wavelet model in this study uses the model proposed by Torrence and Compo (
Torrence and Compo 1998). The model proposes a cross-wavelet transform of two time series
x(t) and
y(t) defined using their own cross-wavelet transform
and
:
where the value of u is associated with the location. In addition, the value of s is associated with a scale indicating complex conjugation. The cross bi-wavelet transform highlights areas in the time-frequency domain where the time series exhibits high strength of co-movement. This method is used to capture the local covariance between two time series
x(t) and
y(t) at each scale. The bi-wavelet approach uses a continuous bi-wavelet transform in a bivariate framework that allows for different localization scales. To capture and interpret the existence of co-movement between the time series in the time and frequency domain, this study uses a bi-wavelet coherence approach using cross-wavelet transformation and coherence (
Rua and Nunes 2009).
Torrence and Webster (
Torrence and Webster 1999) also define bi-wavelet coherence, which captures the co-movement between two time series as:
where S is the time and scale smoothing operator and 0 ≤
≤ 1. The quantity
represents square wavelet coherence. The value is between 0 and 1. The higher the value, the higher the co-movement between the two time series. Then, the value of “
” is the position–time translation parameter. The value of s is the parameter of wavelet widening or scaling. The values
and
are continuous wavelet transformations of the
x and
y series. The S(.) value is the wavelet-smoothing operator. This definition is near square correlation because it measures the covariation between two similar series divided by their variation at different scales and time points (
Rua and Nunes 2009). The coherence box
obtains a value between zero (i.e., no coherence) and one (i.e., perfect coherence).
Goodell and Goutte note that the coherence of square waves is limited to positive values. This phenomenon is unlike the classical correlation of two time series (
Goodell and Goutte 2021). Therefore, at this stage, the methodology cannot distinguish positive or negative co-movements, or between positive and negative correlations. The method from Terrence and Compo is used to capture two co-movements with positive and negative values (
Torrence and Compo 1998). Then, the square wavelet coherence is displayed graphically so that it can describe the causal relationship between the two time series with the following formula:
where
Im and
Re are the imaginary and real parts of the smoothed cross-wave transform, respectively. The black arrows on the wavelet coherence plot indicate phases where the phase difference is zero consistent with the time series moving together. Black arrows pointing right (left) indicate positively (negative) or positively or out-of-phase correlated time series. The black arrow pointing downwards indicates the second time series leading the first time series by π/2 phase. Meanwhile, the black arrow pointing up indicates that the first time series precedes the second time series by π/2 phase.
The wavelet method has emerged as a crucial tool in finance research.
Ghorbel et al. (
2022b) employed Wavelet analysis, revealing a significant correlation between herding behavior in the Chinese market and other BRICS countries during the initial wave of the COVIC-19 pandemic. This study establishes the presence of global herding behavior, highlighting the wavelet method’s ability to unveil interconnected global financial phenomena.
Sharif et al. (
2020) applied coherence wavelet and wavelet-based Granger causality tests to recent daily data in the United States, revealing the profound impact of COVID-19 and oil price shocks on geopolitical risk, economic policy uncertainty, and stock market volatility. Their findings underscore the wavelet method’s role in comprehending nuanced risk perceptions. Additionally,
Aloui et al. (
2018) investigated dynamic linkages between stock indices and stock index futures across 11 markets, unveiling erratic co-movement patterns and distinctions between emerging and developed markets, emphasizing the wavelet method’s significance in analyzing complex financial dynamics amid global events.
4. Research Data
This study uses daily data on technology and cryptocurrency stock indices from 2018 to 2021. The pre-COVID-19 period is from 2018 to 2019, while 2020–2021 includes the COVID-19 pandemic. Technology stock index data in Asia use a purposive sampling method based on certain criteria, namely XA90 and NSEIT. Cryptocurrency data are cryptocurrency daily price data from the two cryptocurrencies with the largest market capitalization, namely Bitcoin (BTC) and Ethereum (ETH). Both cryptocurrencies have a trading volume per day of more than USD 10 million and a market capitalization greater than USD 400 trillion as of December 2021. The research period is from 1 January, 2017, to 31 December, 2021. This study uses data on daily prices for technology stock indices and cryptocurrency prices from 2017 to 2021, which were retrieved through data providers such as Bloomberg and Investing.com. Then, from the daily data, the daily returns from Bitcoin, Ethereum, XA90, and NSEIT are calculated. Please note that data from Bloomberg and Investing.com properties may differ from the scaling and processes underlying major cryptocurrency databases such as Coinmarketcap and exchange platform Coinbase (
Alexander and Dakos 2020);
Vidal-Tomás (
2022).
China’s FTSE technology stock index, namely XA90, was formed in 2003 with an initial price of CNY 3986, while in November 2021 (FTXIN410), the price had reached CNY 11,010.50. In fewer than 20 years, XA90 recorded a return of 176.22%. XA90 is a part of the FTSE China A 600 Index. This technology sector has 80 companies in it with a market share of CNY 2,318,556, and it contributes 12.22% to the overall FTSE China A 600 Index. In this study, the data obtained are daily data from XA90. NSEIT consists of 10 companies in the IT services and consulting industry, which are listed under the National Stock Exchange of India. It has a return of 48.78% in 1 year and 135.89% in the last 2 years. Founded in 2005, NSEIT has an average 3-month volume of 27,261,097, which is quite high in Asian countries.
5. Results
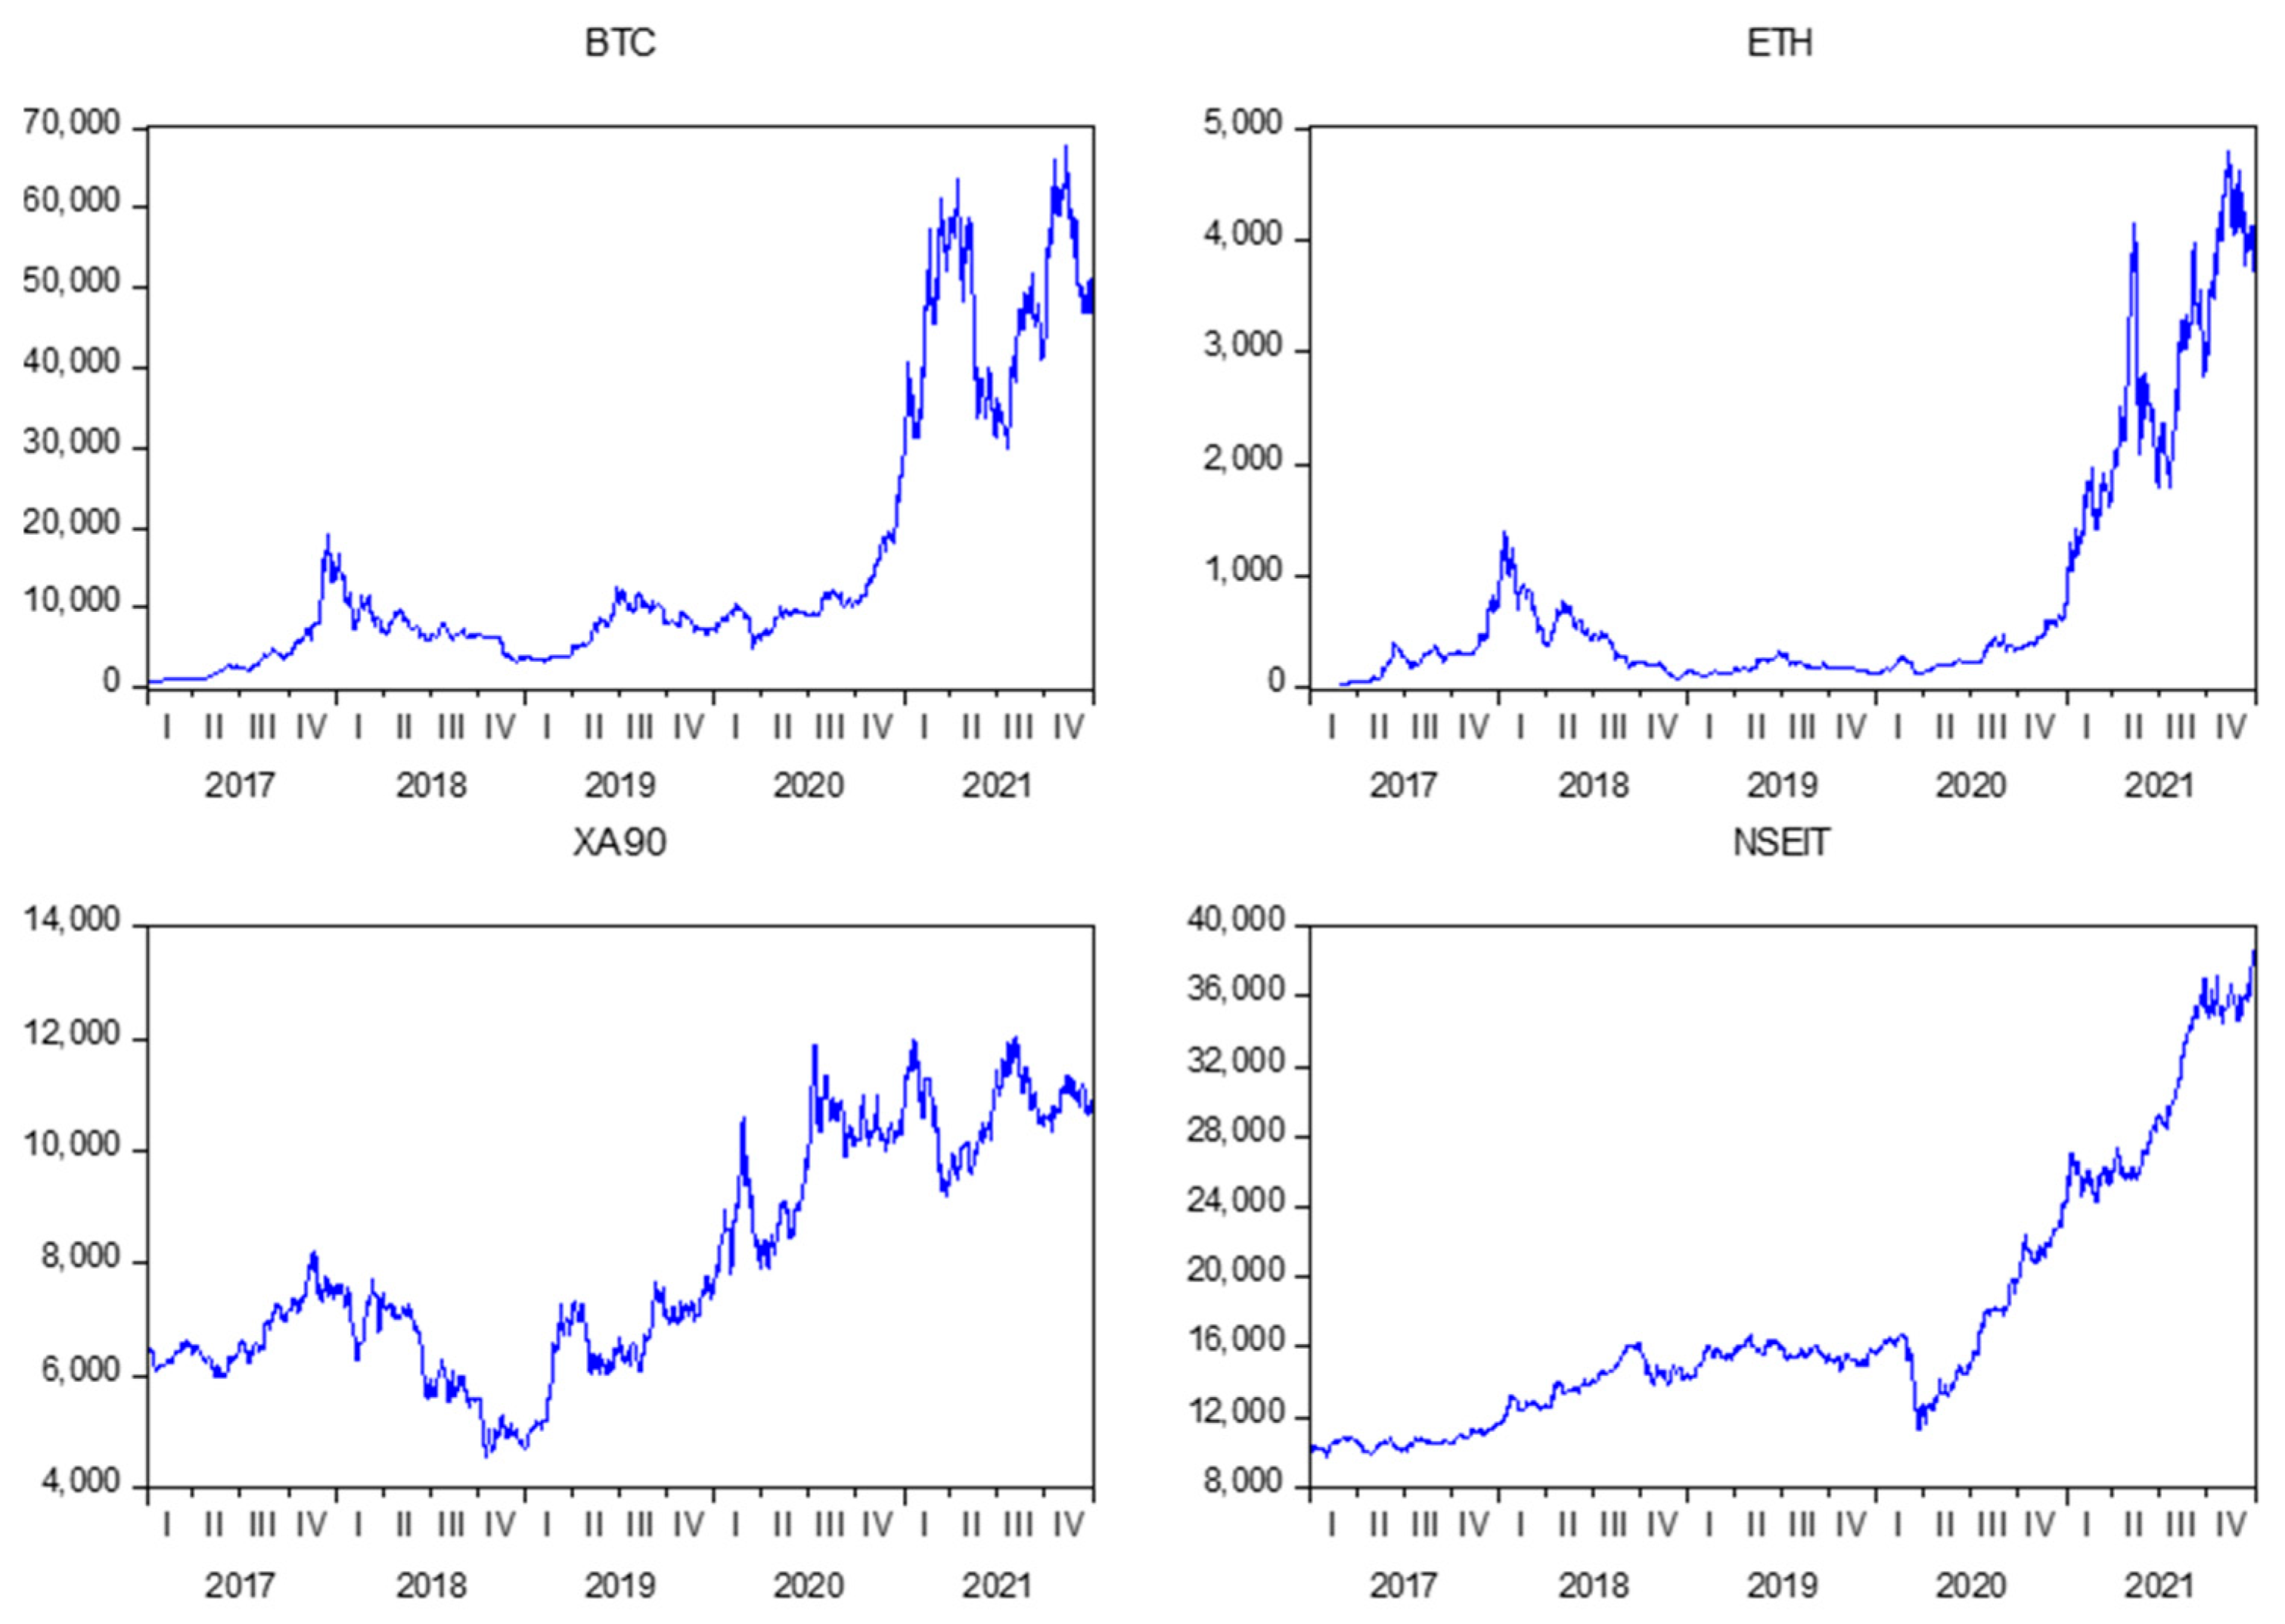
During the first and second quarters of 2020, the onset of the COVID-19 pandemic ushered in a tumultuous period for Bitcoin (BTC) and Ethereum (ETH). In the initial phase of the crisis, this cryptocurrency experienced a significant decline in value due to global uncertainty and panic selling that dominated financial markets. However, BTC saw its price drop from around USD 9000 in January to around USD 4000 in mid-March. Likewise, ETH faced a sharp drop from around USD 130 in March. This drop shows that, to begin with, cryptocurrencies were not immune to the widespread market fears sparked by the COVID-19 pandemic.
However, as central banks around the world introduced unprecedented amounts of monetary stimulus to counter the economic impact of the pandemic, the narrative around cryptocurrencies began to shift. Investors turned to BTC and ETH as a potential hedge against inflation and currency devaluation, thereby contributing to the price rebound during the second quarter. By the end of June 2020, BTC had surged past USD 9000 again, and ETH had climbed to over USD 230. This recovery highlights the resilience of cryptocurrencies and their potential to serve as alternative assets amidst global economic uncertainty, signaling the growing acceptance and adoption of cryptocurrencies in the financial landscape. In general, from
Figure 1, there is a joint movement of technology stock indices and cryptocurrencies.
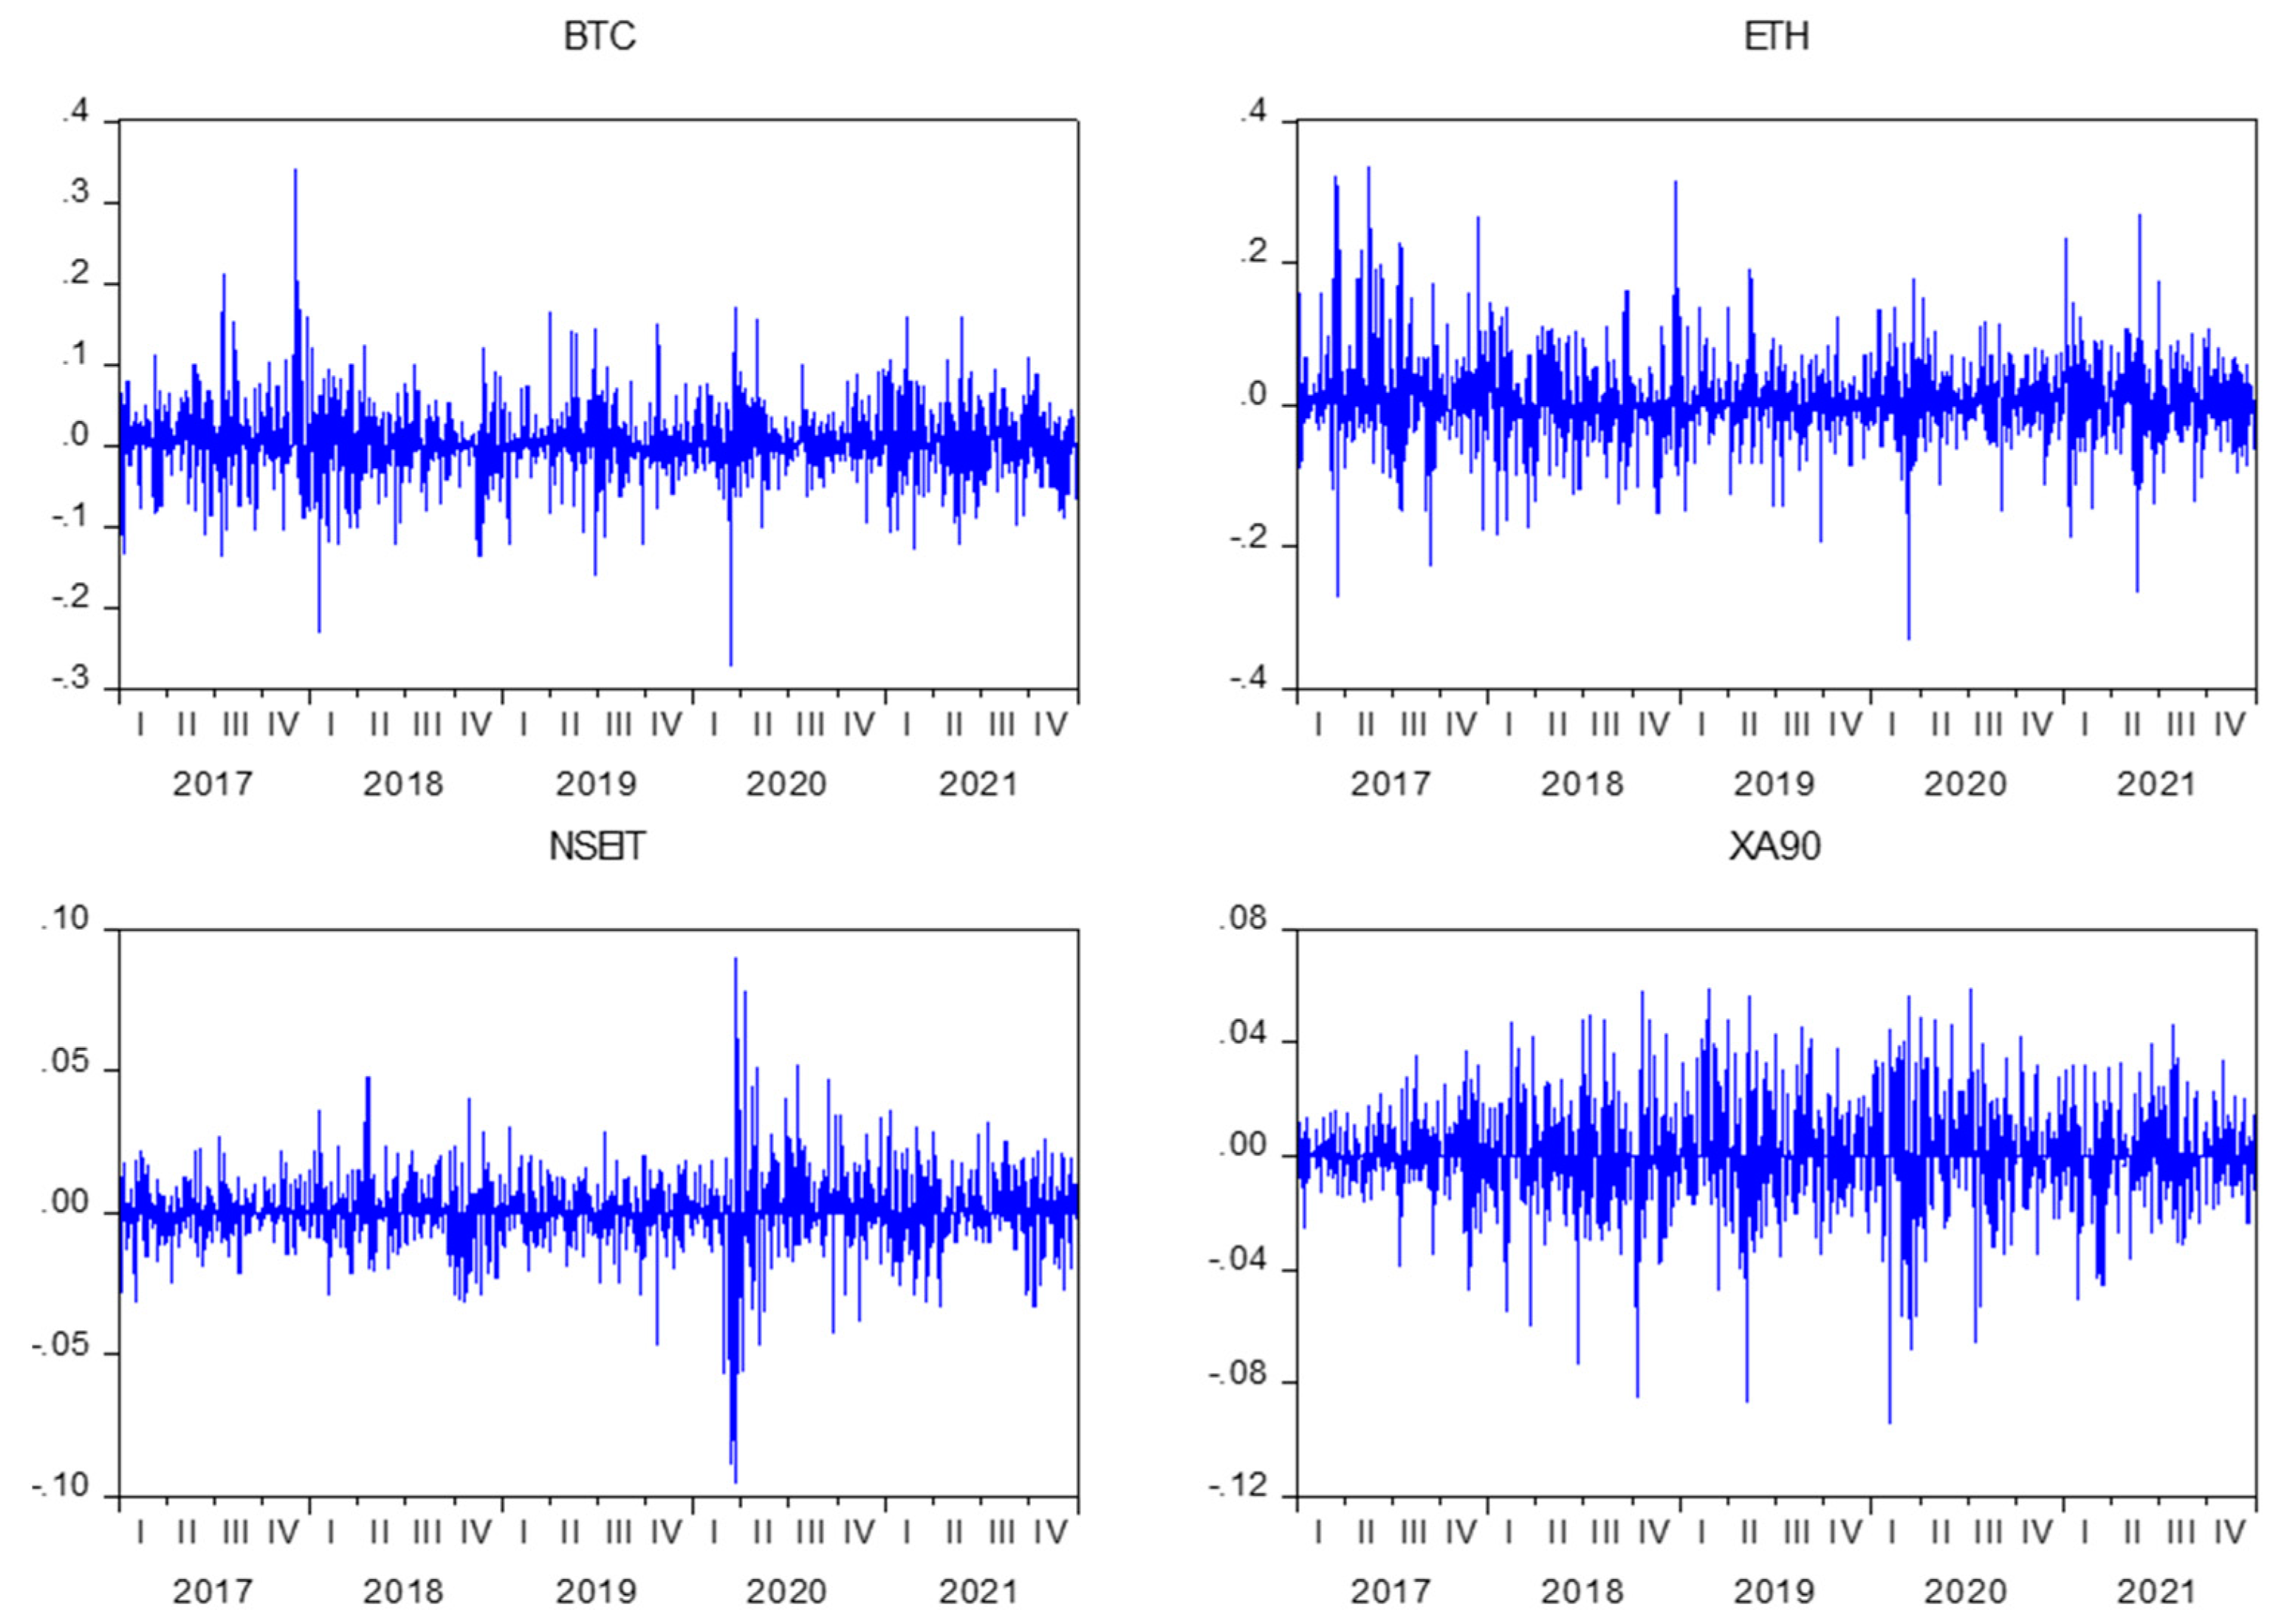
In
Figure 2, the daily return charts for cryptocurrency prices (BTC and Ethereum) and NSEIT show clustering volatility in the first and second quarters of 2020 at the start of the COVID-19 pandemic. Meanwhile, the daily returns for the XA90 technology stock index do not show any stylized factors (for example, clustering volatility).
In
Table 1, a comprehensive overview of the descriptive statistics for the daily returns of two major cryptocurrencies, Bitcoin (BTC) and Ethereum (ETH), alongside the technology stock indices for China (XA90) and India (NSEIT), is provided. The dataset comprises 1826 daily observations, offering valuable insights into the behavior of these assets. Looking at the central tendency measures, the mean daily returns for BTC and ETH are 0.002953 and 0.004905, respectively. However, both cryptocurrencies exhibit median returns of 0.000000, indicating potential skewness in their return distributions. This skewness is further substantiated by positive skewness values of 0.290299 for BTC and a notably higher 0.526050 for ETH, suggesting that returns may be positively skewed, with a longer right tail indicating occasional large positive returns.
Examining the extremities, BTC records a maximum daily return of 0.339921, signifying significant upside potential, but it also experiences a minimum return of −0.271875, highlighting substantial downside risk. ETH follows a similar pattern with a maximum return of 0.336601 and a minimum of −0.332833. These observations underscore the inherent volatility and risk associated with cryptocurrencies. The standard deviation, a measure of volatility, reveals that BTC has a standard deviation of 0.041227, while ETH’s is slightly higher at 0.055810. This higher standard deviation for ETH indicates greater price volatility compared to BTC during the sample period. Kurtosis, a measure of tail thickness, indicates that both BTC and ETH have heavy-tailed distributions. BTC’s kurtosis is 9.207887, while ETH’s is 8.550793. These high kurtosis values suggest that extreme returns (both positive and negative) are more likely to occur compared to a normal distribution. The Jarque–Bera statistic and its associated probability provide further evidence of non-normality in the return distributions. In all cases (BTC, ETH, XA90, and NSEIT), the probability associated with the Jarque–Bera statistic is effectively zero, indicating a significant departure from normality.
In summary, this comprehensive analysis of the descriptive statistics for BTC and ETH daily returns, along with the technology stock indices for China and India, underscores the unique characteristics and risk profiles of cryptocurrencies. Their heavy-tailed, positively skewed distributions and high volatility make them distinct from traditional financial assets, emphasizing the importance of robust risk management strategies when investing in these digital assets.
5.1. Co-Movement Bitcoin (BTC) with China (XA90) and India (NSEIT) Technology Stock Indexes
This study uses a continuous wavelet power spectrum and coherence methodology between the price returns of Bitcoin and Ethereum and technology stock indices in China and India. The wavelet power spectrum image is the absolute squared value of the wavelet transform, which describes the size of the variance in the time series for each time and for each frequency scale. In the wavelet spectrum, the horizontal axis represents the time component (t), while the vertical axis represents the frequency component. It starts from a scale of 1 (a day) to a scale of 256 (more than 256 days). Then, the black contour in the spectrum image shows the area with significance at the 5% level. The significance was estimated using the random-phase replacement series obtained from 1000 Monte Carlo simulations. Then, curved solid lines indicate zones affected by edge effects or cones of influence.
In addition, we analyze the causality and phase differences between the returns of BTC and technology stock indices indicated by the direction of the arrows. For example, → and ← show that the returns of BTC and China’s technology stock index (XA90) are in phase and out of phase. When it is in phase (out of phase), it shows a positive (negative) correlation between BTC returns and the XA90 technology stock index. Additionally, and indicate that BTC returns lead XA90, while and indicate that BTC’s returns lag of XA90.
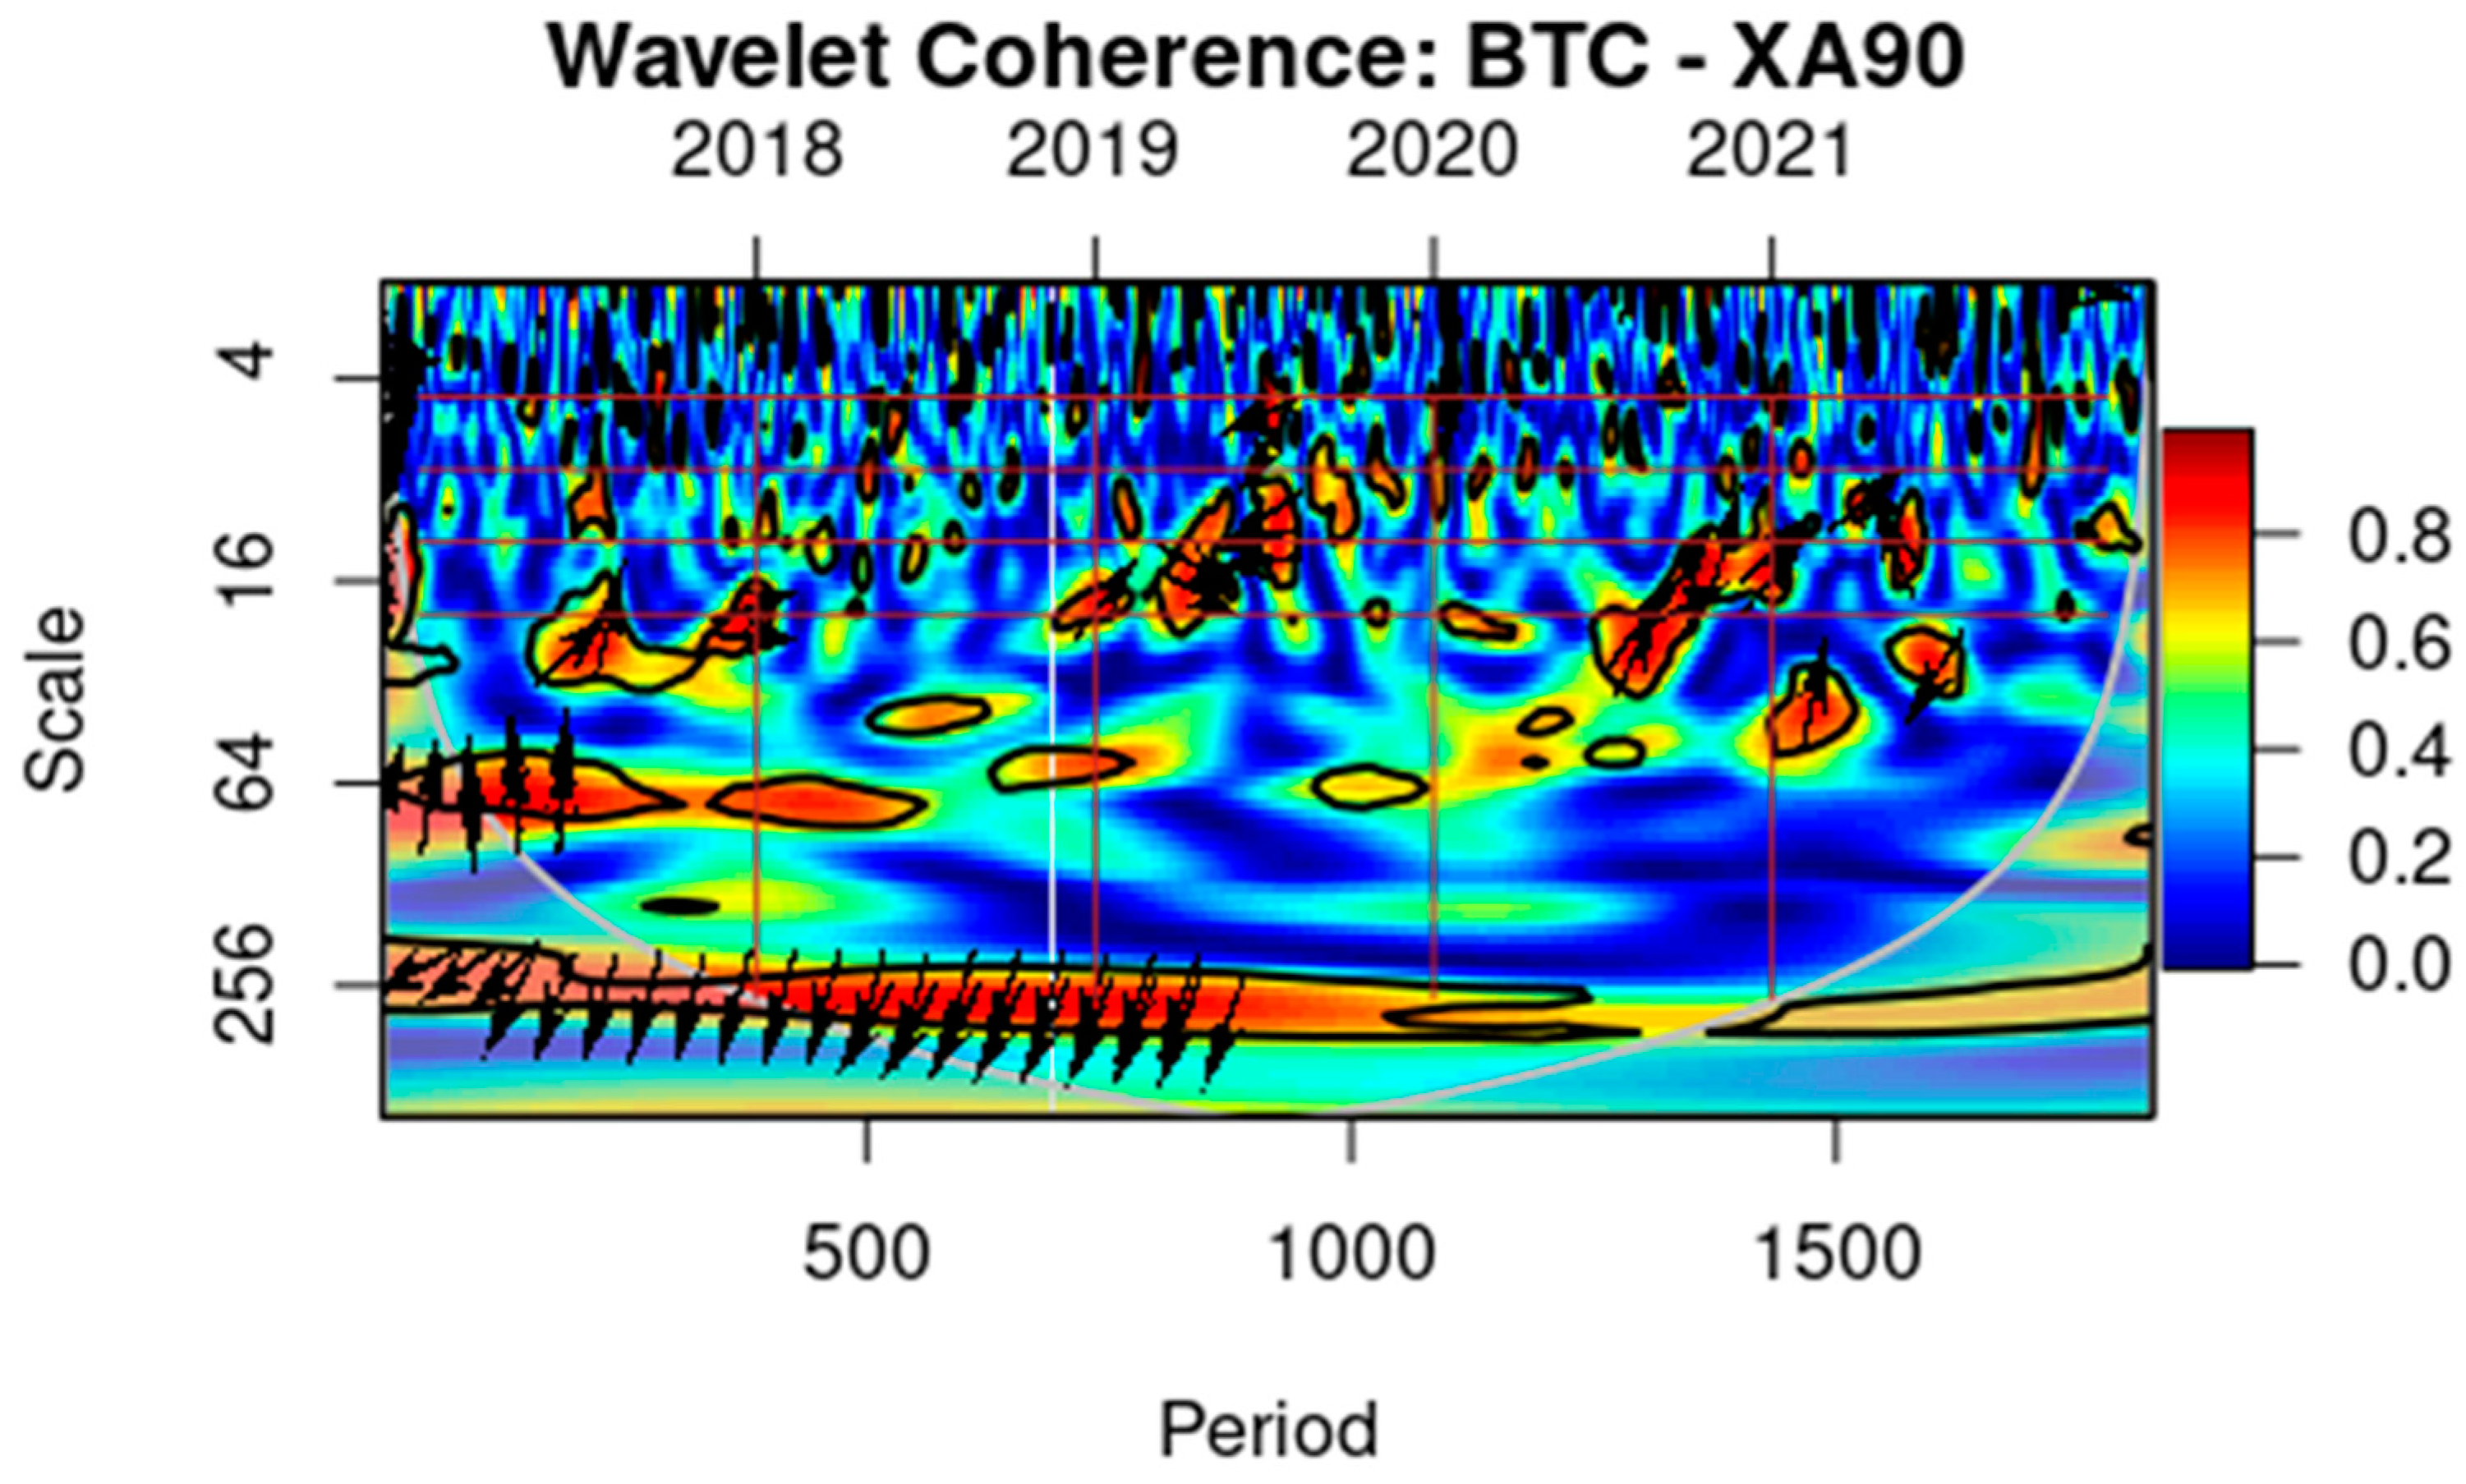
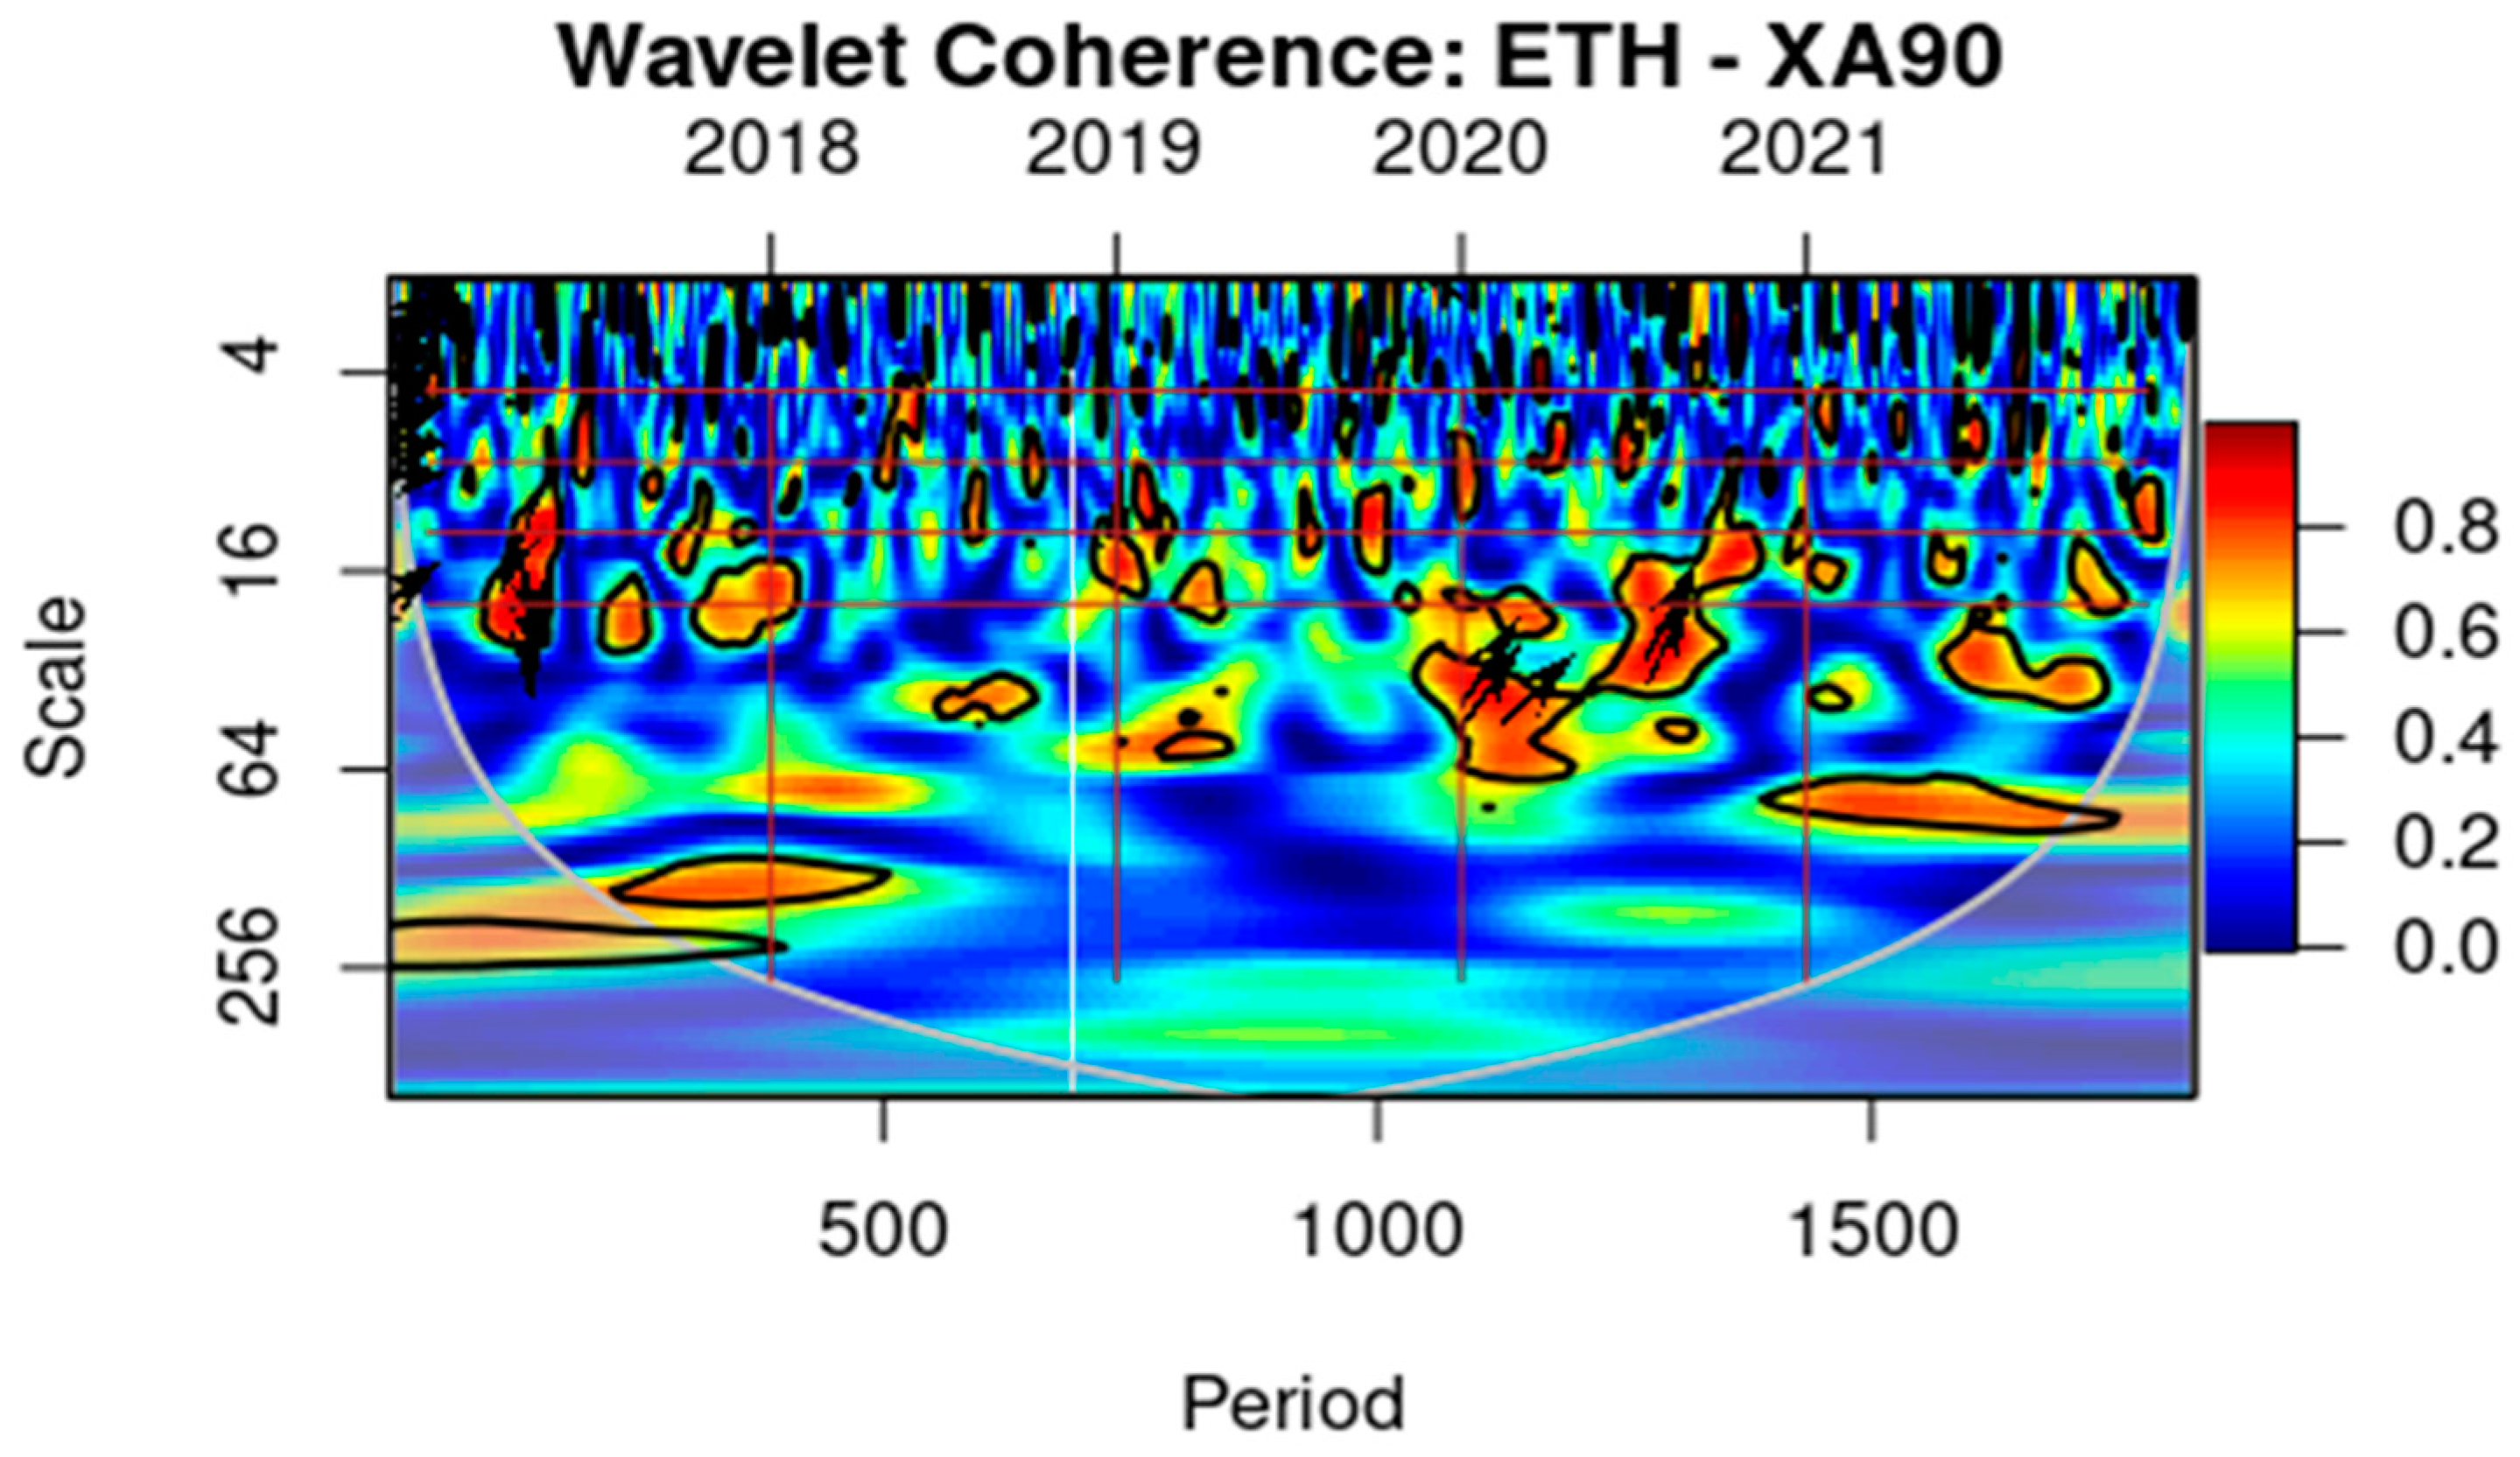
Figure 3 shows the wavelet coherence and phase difference between Bitcoin price returns and the Chinese technology stock index (XA90). Coherence ranging from yellow to red (high coherence) indicates the number of coherent movements that occurred quite strongly on a 256-day scale in 2018 and 2019, or the period before COVID-19 occurred. The color from yellow to red symbolizes a strong joint movement for 256 days; it becomes weaker after 2019, or when China entered the COVID-19 pandemic. However, the blue color, which indicates weak co-movement, is becoming more pronounced. Whereas in the short term, 16 days, there were some moderately strong co-movements (red) in 2021. We will identify significant high-level co-movements on the 256-day scale between Bitcoin price returns and China’s pre-COVID-19 technology stock index (XA90), which weakened from 2020 to 2021.
Figure 3 also shows the direction of the arrow before 2019 with a time scale of 256 dominated by
and
, indicating that BTC returns lead China’s technology stock index (XA90). However, after 2019, no arrows appear at all on the 256-day time scale, even though there are indications of moderate co-movement. Whereas in 2021, when there was a strong joint movement in the short term of the 16–64-day time scale, the direction of the arrows shows mixed directions.
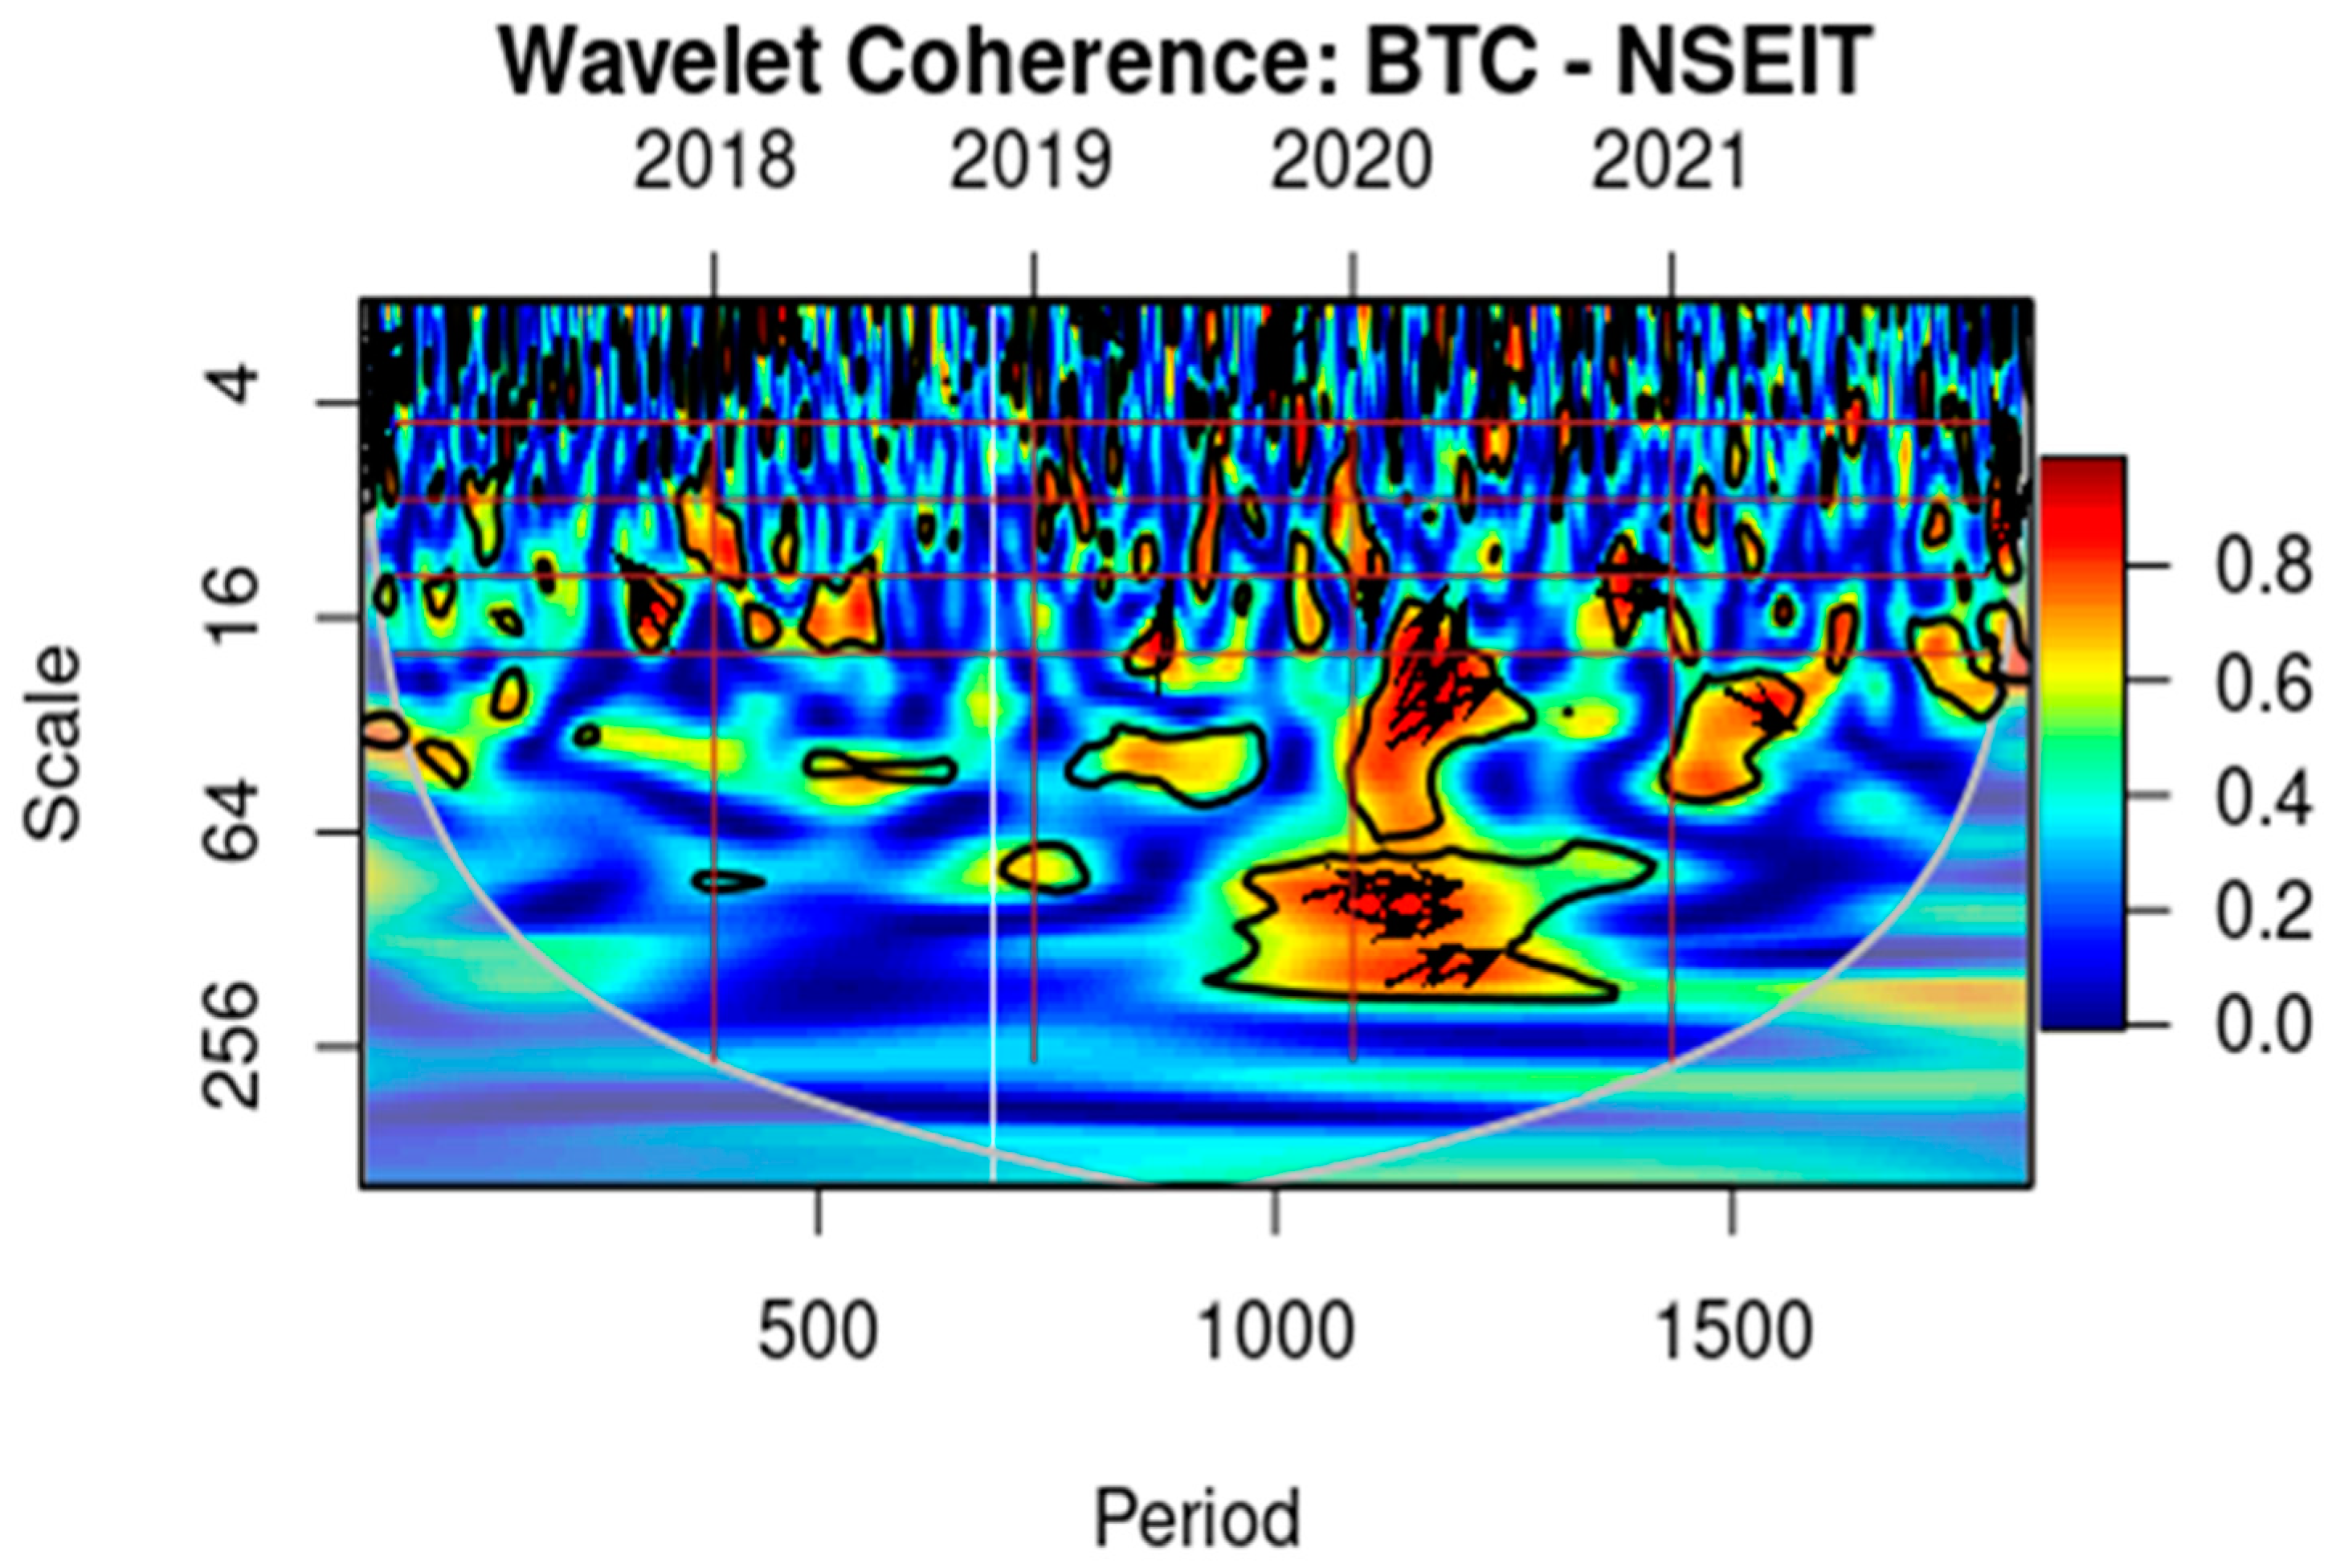
Figure 4 shows the wavelet coherence and phase difference between Bitcoin price returns and the Indian technology stock index (NSEIT). In contrast to the co-movement between BTC and XA90, the Indian technology stock index (NSEIT) did not show high coherence (ranging from yellow to red) on a 256-day scale from 2018 to 2021. However, 2020 saw high coherence, indicating joint movement strong on a 64-day scale. This period of 2020 is associated with a spike in the number of COVID-19 death cases in India. Before the COVID-19 pandemic occurred, this co-movement phenomenon was not that strong. On a short-term scale of 16 days, several co-movements that occurred were quite strong in 2020. Meanwhile, they did not occur in other years. We identified that a significant high-level co-movement on the 256-day scale between Bitcoin price returns and the Indian technology stock index (NSEIT) is not as strong as the co-movement of BTC movement with the China technology stock index (XA90).
From
Figure 4, there are no arrows on the 256-day time scale in all periods. Whereas on a 16–64-day scale, early 2020 early to mid-2020 occurred (→), which shows that the returns of BTC and India technology stock index (NSEIT) are in a phase showing a positive correlation between BTC returns and India technology stock index (NSEIT). In the same year period, on a 16-day scale, (
) occurred, indicating that BTC returns led the Indian technology stocks index (NSEIT). After 2020, arrows appear only on timescales below 16 days.
5.2. Ethereum (ETH) Co-Movement with China (XA90) and India (NSEIT) Technology Stock Indexes
Figure 5 shows the wavelet coherence and phase difference between Ethereum price returns and the Chinese technology stock index (XA90). Unlike coherence with BTC, the Chinese stock index (XA90) shows high coherence ranging from yellow to red with ETH on a 16-to-64-day scale from 2017 to 2018, and there is a slight strength on the 256-day scale period. In 2019, or the period before COVID-19, there was no co-movement. Even on a 256-time scale from 2018 to 2021, it looks very weak. On a time, scale of 64 days, 2020 and 2021 have shown some strong coherence, but still not as strong in coherence with BTC. On a short-term scale of 16 days, there were only a few strong co-movements in 2020 and 2021, but not as strong as the co-movements before 2018. The coherence between ETH and XA90 in 2019 tends to be low. We conclude that there is no significant high-level co-movement on a 256-day scale between the price returns of Ethereum and China’s technology stock index (XA90) during the COVID-19 period from 2019 to 2021.
From
Figure 5, the arrows only appear on a time scale below 16 days in 2017 and do not appear in the following period. At the beginning of 2017, there was (→), which showed that the returns of BTC and the China technology stock index were in a phase showing a positive correlation between the returns of BTC and the China technology stock index (XA90). In the 2021 period on a 16–64-day scale, there is an upward sideways arrow (
), indicating that BTC returns lead China’s technology stocks index (XA90). After 2020, the arrows do not appear on all timescales, but there are some areas of black and yellow lines indicating moderate coherence.
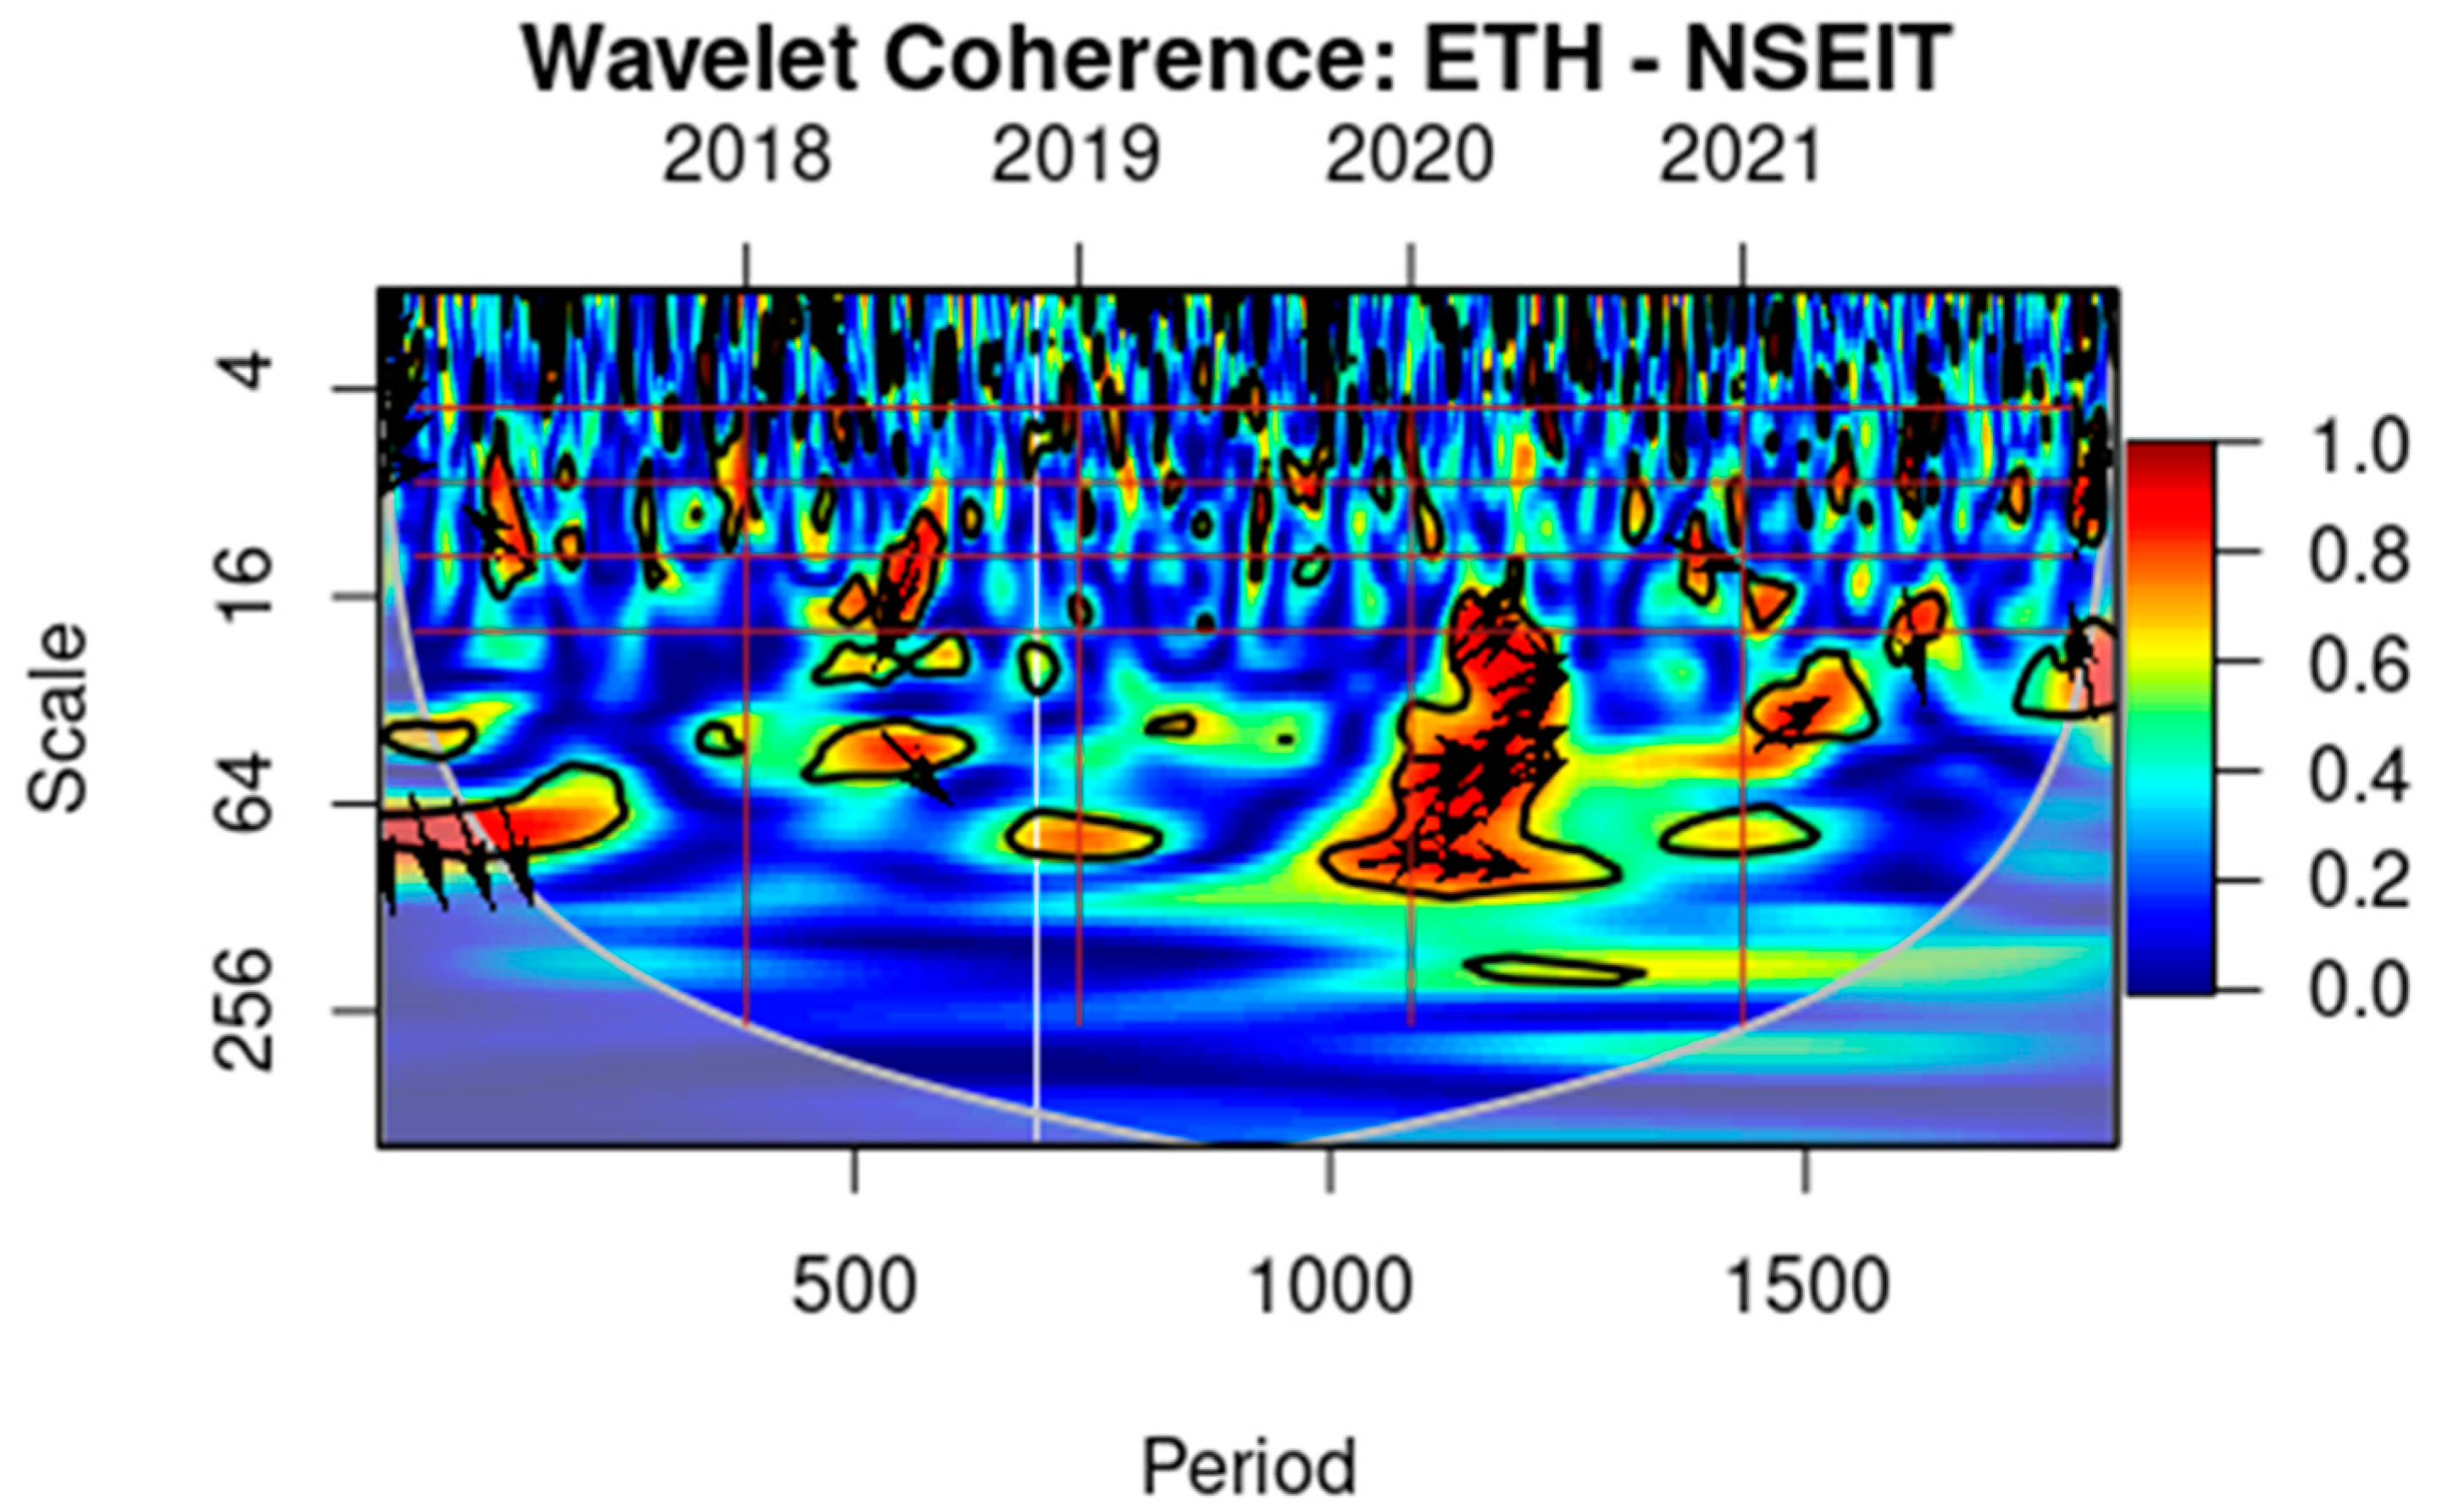
Figure 6 shows the wavelet coherence and phase difference between Ethereum price returns and the Indian technology stock index (NSEIT). The Indian stock index (NSEIT) shows low coherence with ETH on a scale of 256 for all periods from 2017 to 2021. However, on a 64-day scale, there are several periods that show strong, although not long, coherence. From early 2017 to mid-2017, there was a strong co-movement ranging from yellow to red. Then, from the end of 2019 to mid-2020, there was very strong coherence on a scale of 16–64 days (about 2 months) where this period was the initial period of the COVID-19 pandemic entering India. This indicates a co-movement between Ethereum and the NSEIT index, which was quite strong in the initial period of the COVID-19 pandemic. However, this phenomenon did not occur in the following period, after mid-2020.
Figure 4 shows that some coherence still occurs in the short term on a scale below 16 days (about 2-and-a-half weeks) but tends to weaken. We conclude that there was a significant high-level co-movement on a 16–64-day scale between the price returns of Ethereum and the Indian technology stock index (NSEIT) during the COVID-19 period from late 2019 to 2020. However, the co-movement phenomenon has weakened in the short term to under 16 days in 2021.
In
Figure 6, from 2017–2019, several arrows appear on the time scale below 64 days. In early 2017, there were (→) and (
), indicating that the returns of BTC and the India technology stock index (NSEIT) were in a phase showing a positive correlation, and the returns of BTC were lagging that of the India technology stock index (XA90). In the period of 2021 on a 16–64-day scale, there occurred (→), which indicates that the returns of BTC and India technology stock index (NSEIT) are in a phase showing a positive correlation.
6. Discussion
The results of the wavelet coherence study show that there is change in herding behavior via co-movement of cryptocurrency with the Chinese and Indian technology stock indices. However, when explored further based on the scale and period, there are differences in co-movement patterns between each cryptocurrency and the Chinese and Indian technology stock indices. In general, BTC’s co-movement with Asian technology stock indices is still stronger than that of ETH. This phenomenon is different from the findings of Wang, Chen, and Zhao (
Wang et al. 2020), who found that the correlation of BTC to the S&P 500, NASDAQ, and Dow Jones is lower than the effect of the American stock market on BTC. In addition, this study’s findings also differ from those of Chu, Chan, and Zhang (
Chu et al. 2021), which state that BTC has little-to-nothing to do with some technology stock returns. This study is in line with the research of
Ghorbel et al. (
2022b), who found a substantial correlation between herding behavior in China and BRICS countries during the initial wave of the COVID-19 pandemic.
The co-movement between BTC and the Chinese and Indian technology stock indices looks more on a longer period scale or 256 days compared to ETH, which is on a 16–64-day time scale. This price movement is in line with the research of Isah and Raheem (
Isah and Raheem 2019), which shows the predictive ability of cryptocurrency on US stock price movements. BTC-based predictive models can accurately predict stock price movements as technology company stocks are supported by the growth of cryptocurrencies in the time of COVID-19 pandemic. Salisu and Ogbonna (
Salisu and Ogbonna 2021) also found that the positive influence of bitcoin prices in forecasting stock returns for G7 countries is quite large. BTC-based prediction models can predict stock price movements of the G7 economies much better than the overall macroeconomic factors of each country.
From the results of the wavelet analysis based on the time, it is also seen that there was a joint movement of cryptocurrencies with Chinese and Indian technology stock indices during the COVID-19 pandemic. There were changes in movement patterns before and during the COVID-19 pandemic, such as the occurrence of a strong joint movement between BTC and the Indian technology index. This phenomenon is in line with the results of a study by Jeribi and Ghorbel, which found that the COVID-19 pandemic dramatically changed the factors influencing the movement relationship (
Jeribi and Ghorbel 2021). The dynamic relationship between cryptocurrency returns and stock market returns during the COVID-19 pandemic has changed the short-term and long-term correlations. Bitcoin and Ethereum were “safe havens” for Brazil, China, and Russia during the COVID-19 economic crisis. Research from Dwita
Mariana et al. (
2021) also found a relationship between the S&P 500 and two cryptocurrencies (Bitcoin and Ethereum). Ethereum shows a higher return volatility than Bitcoin (
Dwita Mariana et al. 2021). The drop in Ethereum’s price was better (small) than the drop in Bitcoin during the COVID-19 pandemic when the stock market was facing a drastic drop in price. The two cryptocurrencies are suitable as short-term safe havens. Lahmiri and Bekiros argue that the COVID-19 turmoil has affected long-term memory reciprocally and the volatility of cryptocurrencies along with global stock markets (
Lahmiri and Bekiros 2021).
Caferra (
2020) shows financial contagion in March during COVID-19 when cryptocurrencies and stocks plummeted (
Caferra 2020).
The COVID-19 pandemic has had a significant negative influence on global stock markets, including China. This impact was seen in the form of increased return volatility. The release of economic policy events during the pandemic had a direct impact on this volatility (
Liu et al. 2022). Cryptocurrency is considered to recover faster than the stock market, which is still in a bearish phase.
When comparing the period before COVID-19 with the period when the COVID-19 pandemic occurred, in different time periods, the joint movement between technology stock index prices and the cryptocurrency market also shows different co-movements. There was a change in the pattern of co-movement in the form of a period and time transition pattern. Thus, COVID-19 causes herding behavior between the prices of technology stock indexes and the cryptocurrency market. The results of this study are in line with Nguyen’s research, which states that S&P 500 returns have a statistically significant impact on Bitcoin returns during periods of high uncertainty, one of which is COVID-19 (
Nguyen 2022).
Technology stock price indices in Asia had a strong co-movement to the crypto currency market in the initial period of COVID-19, or Semester 1 of 2020. This can be seen on the day when cryptocurrencies experienced the biggest decline in their history, namely at the beginning of the COVID-19 period. To be precise, on 12 March, 2020, Bitcoin experienced a decrease of 37.17%, and Ethereum also experienced a decrease of 42.35%. A similar phenomenon of decline also occurred in the price of technology stock indexes. The Chinese index (XA90) decreased by 1.13% and the Indian index (NSEIT) fell by 8.48%. The results of this study are in line with research by
Wang et al. (
2022), which says that there is a dynamic relationship between cryptocurrencies, namely Bitcoin (BTC) and Ethereum (ETH), as well as the American stock index, namely the NASDAQ-100 Index (NDX), Dow Jones Industrial Average Index (DJI), and S&P 500 Index (SPX). Then, it is also in line with
Caferra and Vidal-Tomás (
2021) research, which shows financial contagion in March during COVID-19 when cryptocurrencies and stocks fell dramatically (
Caferra 2022;
Caferra and Vidal-Tomás 2021).
6.1. Theoretical Implication
The research findings on herding behavior in financial markets, particularly during times of crisis, provide valuable insights into the theoretical implications. The resilience of cryptocurrencies in rebounding faster than traditional stock markets during bearish phases, such as the onset of the COVID-19 pandemic, challenges established beliefs about asset behavior in turbulent times. This disparity in recovery rates between cryptocurrencies and conventional equities calls for a reassessment of prevailing theories and models that explain market dynamics and investor conduct.
The changes in the movements and pricing patterns of technology stock indices and cryptocurrencies following the outbreak of the COVID-19 pandemic have significant theoretical implications for our understanding of herding behavior. The noticeable shifts in coherence wavelet patterns after the pandemic highlight a need to reassess and improve existing frameworks on herding behavior. These findings suggest that market participants may exhibit distinct tendencies to follow others’ actions in response to extraordinary events, which calls for a more nuanced perspective on the underlying mechanisms that drive such behavior. As a result, this study contributes to furthering our knowledge of herding behavior by shedding light on how investor sentiment adapts, as well as its impact on market dynamics (
Ghorbel et al. 2022b).
This research presents theoretical implications that question traditional beliefs in the field of financial markets, providing new perspectives on how assets behave during times of crisis. The unique recovery patterns observed in cryptocurrencies and traditional stock markets call for a reconsideration of established theories. Additionally, the changes in coherence wavelet patterns after the COVID-19 pandemic contribute to a better understanding of the adaptive nature of herding behavior. These theoretical insights pave the way for further research opportunities and encourage the refinement of models that accurately reflect investor sentiment in today’s financial environments.
6.2. Practical Implication
The findings have practical implications suggesting that cryptocurrencies tend to recover faster than the stock market, which is experiencing a bearish phase. Therefore, during financial crises, cryptocurrencies can serve as an alternative for diversifying financial asset portfolios. Additionally, the changes in movement patterns and prices observed in technology stock indices and cryptocurrencies during the COVID-19 pandemic offer theoretical insights into herding behavior. This can be illustrated by the altered coherence wavelet pattern of returns following COVID-19.
The empirical findings have significant practical implications for both investors and portfolio managers. The resilience of cryptocurrencies in recovering faster than traditional stock markets during bearish phases, such as the onset of the COVID-19 pandemic, highlights their potential usefulness as a diversification tool within financial asset portfolios. By including cryptocurrencies in diversified portfolios, investors can potentially reduce risk and improve their ability to navigate turbulent market conditions more successfully. This recognition is particularly relevant in light of recent global financial crises, emphasizing the importance of considering cryptocurrencies as a valuable element of contemporary portfolio strategies.
The findings of this study highlight the increasing importance of considering cryptocurrencies as an asset class in diversified investment portfolios, especially during times of financial turmoil. Moreover, this research contributes to the development of herding behavior theory by illuminating how investor behavior evolves in response to unprecedented events such as the COVID-19 pandemic. These insights offer valuable information for future research and risk management practices in the financial industry.
7. Conclusions
The findings of the study demonstrate alterations in co-movement trends between technology stock indices and cryptocurrencies amid the COVID-19 pandemic. Following this global health crisis, the duration of co-movement instances has been reduced. The modifications in joint movement patterns occurred within a period ranging from 16 to 64 days (about 2 months). This contrasts with the pre-pandemic era where co-movement exhibited an extended period of approximately 256 days during times without financial crises caused by COVID-19. By utilizing wavelet analysis to examine movement chart patterns jointly, it becomes possible to identify shifts in herding behavior tendencies. Before the onset of the COVID-19 pandemic, China’s technology stock index displayed a strong correlation with Bitcoin across a span encompassing 256 days.
However, this co-movement weakened after the COVID-19 pandemic. However, India’s tech stock index showed a strong co-movement with both Ethereum and Bitcoin during the early days of the COVID-19 pandemic. Before the pandemic, India’s tech stock index had a muted co-movement with Bitcoin. This change in the co-movement of prices suggests a shift in herding behavior among investors due to the COVID-19 pandemic. The study also highlights those cryptocurrencies have shown a faster recovery compared to the technology stock market, which is still in a bearish phase.
Before the outbreak of COVID-19, there was a notable correlation between China’s technology stock index and various cryptocurrencies over 256 days. However, the strength of this correlation diminished after the onset of the pandemic. Yet, when considering Ethereum, it was observed that China’s technology stock index only exhibited a short-term and weak co-movement with ETH both before and during COVID-19.
In contrast to China, India’s tech stock index demonstrated a robust co-movement with both ETH and BTC in the initial stages of COVID-19. Before this global health crisis, India’s technology stock index did not demonstrate any significant movement in tandem with BTC. This change in co-movement indicates a shift in herding behavior among investors due to the influence of the COVID-19 pandemic. Investors are now closely following the movements of cryptocurrencies, such as Bitcoin and Ethereum, alongside technology stock indices. The findings suggest that cryptocurrencies, specifically Bitcoin and Ethereum, have shown faster recovery compared to the technology stock market. The results of this study contribute to our understanding of the co-movement between Asia technology stock indices and cryptocurrencies during the COVID-19 pandemic. In conclusion, the study provides insights into the co-movement patterns between Asia technology stock indices and cryptocurrencies during the COVID-19 pandemic. The research findings indicate that there was a change in co-movement patterns between Asia technology stock indices and cryptocurrencies during the COVID-19 pandemic.
Research on the co-movement between Asia technology stock indices and cryptocurrencies during the COVID-19 pandemic has revealed interesting patterns. These findings highlight the dynamic relationship between cryptocurrency markets and traditional stock indices in the face of a global crisis. Further research in this area can provide a deeper understanding of the underlying factors driving co-movement and herding behavior.
Further research on topics related to co-movement at the microstructure level or daily trading level can be conducted, especially regarding the impact of news, issues, or rumors that hit technology companies on cryptocurrencies. Then, news co-movement and impact related to cryptocurrency-related figures can also be conducted. Further research can also explore the influence of government regulations on the co-movement between technology stock indices and cryptocurrencies during the COVID-19 pandemic. Moreover, investigating the impact of different cryptocurrency characteristics, such as market capitalization or transaction volume, on co-movement with technology stock indices could provide valuable insights.


