Article

Dynamic Dependency between the Shariah and Traditional Stock Markets: Diversification Opportunities during the COVID-19 and Global Financial Crisis (GFC) Periods

1
College of Business, Al Ain University, Al Ain P.O. Box 64141, United Arab Emirates
2
Faculty of Business Administration, University of Science and Technology Chittagong, Chattogram 4202, Bangladesh
3
Department of Economics, Federal University Dutse, Dutse 720101, Nigeria
4
Department of Finance and Banking Sciences, Amman University College of Financial and Administrative Science, Al-Balqa Applied University, Al-Salt P.O. Box 19117, Jordan
5
Institute of Business Research, University of Economics Ho Chi Minh City, Ho Chi Minh City 008428, Vietnam
*
Author to whom correspondence should be addressed.
Economies 2023, 11(5), 149; https://doi.org/10.3390/economies11050149
Submission received: 4 February 2023 / Revised: 6 May 2023 / Accepted: 9 May 2023 / Published: 17 May 2023
(This article belongs to the Special Issue Role of Islamic Finance in Modern Economy)

Abstract

:
The aim of the present research is to highlight whether there exist any diversification opportunities from investing in developed and developing countries’ Shariah-compliant and non-Shariah-compliant stock markets during global financial crisis (GFC) and the COVID-19 pandemic periods. For this purpose, we employ daily data for both Shariah and non-Shariah indices from 29 October 2007 to 31 December 2021. The study uses multivariate GARCH-DCC and wavelet approaches to examine if there exist diversification opportunities in the selected markets. Evidence from this study shows that although the developing markets’ stock returns experience high volatility of a similar degree, the conventional indices of Malaysia have the highest volatility among them. This shows that Shariah indices have less exposure to risk and higher possibilities of diversification compared to their conventional counterparts. Regarding developed markets, the Japanese conventional index and the U.S. Shariah indices are more volatile compared to other indices in the market. Moreover, the results of the wavelet power spectrum show significant and higher volatility during the COVID-19 pandemic rather than the GFC. Similarly, the Chinese conventional market experienced minimum variance during the GFC and COVID-19 pandemic period. On the other hand, the results of wavelet-coherence transform indicate that the Japanese Shariah-based market offered better portfolio opportunities for U.S. traders during the GFC and the COVID-19 pandemic periods. Hence, opportunities for investment in this selected market are basically close to zero. Therefore, investors should carefully choose which stocks they can include in their investment portfolio.

1. Introduction

The global financial crisis (GFC) in 2007–2009 and the recent COVID-19 pandemic unprecedentedly affected global financial markets (Borio 2020; Shahzad and Naifar 2022). The nature, consequences, and causes of both crises are different, but the consequences and disturbances of the real economy are prominent in these markets. For instance, many security markets, in both developed and developing economies have faced a sharp decline of at least 30 percent in total assets (IMF 2020). Therefore, an optimum level of co-movement is required for portfolio implications in different asset classes’ dynamics or linkages during crisis periods. In this regard, contemporary empirical research has paid considerable attention to the importance of including new or alternative asset classes in the portfolio, for example, crypto-currencies (Garcia-Jorcano and Benito 2020; Mensi et al. 2020; among others), clean energy indices (Asl et al. 2021; Nguyen et al. 2020; among others), and Islamic indices ( Al-Yahyaee et al. 2020; among others). Interestingly, Islamic products and services have gained popularity from both Muslim and non-Muslim investors due to their unique characteristics. Islamic financial products and services are guided by the principles of Shariah. The Shariah principles condemn any products and services that have elements of Riba (e.g., interest), Gharar (e.g., uncertainty), and Mysir (e.g., gambling or speculation), which are fundamentally prohibited in Islamic finance. Moreover, investment in Islamic financial instruments is less dependent on leverage; rather, it encourages profit and loss-sharing businesses, which have to meet two-stages screening criteria (Hasan et al. 2021). The growth in Islamic finance assets has been remarkable in recent decades (Naz and Gulzar 2022). The Islamic finance industry has shown substantial growth and touched the milestone of an estimated USD 3958 billion in total assets in 2021. Moreover, the growth rate of the Islamic finance industry maintained a double-digit growth rate of approximately 14% that proved resilient during the COVID-19 pandemic in 2020 (IFDI 2022).
Despite this significant growth recorded by the Islamic finance industry, it is not immune to the changing paradigm of financial and economic crises. This motivates us to investigate the dynamic dependency between Shariah and traditional stock indices for portfolio diversification implications in a time-frequency environment. Investors and financial managers usually look to diversify their investments in cross-country economies into different asset classes to save their investments from extreme losses during periods of turmoil. A handful of studies have investigated the time-varying relationship between Shariah and traditional equity markets and arrived at different conclusions (see Ali et al. 2021; Erdoğan et al. 2020; Tuna et al. 2021). The current study is unique from earlier studies because it analyzes the two most important crises that have put stress on the financial market, namely the GFC and the COVID-19 pandemic. To bridge this gap, the current study examines the dependency of the Shariah and traditional equity markets in developed and developing countries by covering the above-mentioned crises by using daily stock price data from 2007 to 2021. Hence, the study employs two techniques, namely (1) multivariate GARCH-DCC and (2) cross-wavelet approaches, which significantly address the research questions due to the dynamic nature of financial data. We therefore discern our study from the existing literature by examining dynamic linkages between cross-country datasets and different asset lines for portfolio diversification (Khan and Jan 2022). The rest of the study is designed as follows. In Section 2, we present theoretical underpinning and empirical related literature on the Shariah and traditional stock markets. We present the empirical methodology in Section 3. In Section 4, we present the results and discussion and finally, we conclude our study in Section 5.

2. Theoretical Underpinning and Related Literature Review

The financial market experiences erratic movement and is hardly predictable. In addition, spontaneous movement may bring a market crash apparently without any vast changes in the essential parameters of an economy. In the international financial literature, the capital asset pricing model (CAPM) is widely used, such as that applied by Sharpe (1964) and Lintner (1965). The main purpose of this theory is to develop a theoretical underpinning between the expected rates of return and systematic risk on asset prices. Furthermore, this theory supports efficient decision making in well-diversified asset lines for better portfolio benefits. However, it provides a comprehensive framework to explain the risk–return trade-off between two investment horizons. The empirical findings suggest that there is a significant and positive relationship between realized return and systematic risk, in line with the linear combination of return and risk. Nevertheless, the CAPM emphasizes market risk (e.g., systematic risk) and the implication of total risk is not in doubt as the return is positively related to both types of risk. Again, an identified drawback is that investors do not embrace the assumptions of the CAPM, even though this does not reduce the importance of the theory. However, analysis of the security market line is also not relevant to the bond analysis, though bonds are included in investors’ portfolios. However, besides some criticisms, the CAPM has become a significant approach for investment-management strategies in the computation of comparative performance and portfolio diversification among the asset classes (Rossi 2016).
The efficient market hypothesis (EMH) theory enunciates that financial markets have informational efficiency, which means that the required information should be accurately assimilated into prices. Moreover, over- or under-reaction may befall, seemingly by noise, traders at any time, who essentially emerge in the market to grant liquidity to rational stakeholders. From experience, pragmatic evidence illustrates that the stock market is not emphatically pronounced by normal random walk theory and normal distribution (Johnson and Soenen 2003; Mantegna 1999; Mantegna and Stanley 1997). Market collapses may occur off and on with zero movement in economic imperatives. Volatility and discrepancies in market price can be triggered by assuming herding behavior, which is directed by the unspecified market system. To explicate the above spectacle and the impasse of the financial market, the FMH as voluminous theoretical and quantitative compensations over the EMH by demonstrating and scrutinizing data. In the FMH, stock markets are delineated as multifaceted vigorous systems that express that the augmentation of mystification could be inevitable (Münnix et al. 2012).
A fractal technique is engaged to evaluate financial time series by employing various intervals of time resolutions. This leads to the heterogeneous market hypothesis, in which several market participants and contributors investigate earlier proceedings and innovative proceedings with different time prospects. Weron and Weron (2000) revealed and introduced a new common technique for the return of assets in the context of the FMH. In modern times, time-series prediction has been a prominent field of research regarding statistics and operational research. Furthermore, the literature on empirical work tries to observe the volatility among Shariah and traditional stock market indices, where different emerging researchers arrive at different conclusions and consequences. Jawadi et al. (2014) used Shariah and traditional stock indices in three leading regions, namely the world, America, and Europe, by employing and approaching several progress ratios and CAPM-GARCH models. Moreover, their study captures pre- and post-recent crisis periods and their findings showed that stock markets’ performance depends on financial risk time-variation and investment horizons. While Islamic stock markets outperformed during the onset of the sub-prime crisis, conventional stock markets performed better during the pre-crisis period. Additionally, their research specified that the influence of the worldwide financial crisis (2007–2009) exposes significant differences between Shariah and traditional stock markets. Another study by Rana and Akhter (2015) found that the performance of Shariah and traditional stock indices from pragmatic evidence of a struggling economy (Pakistan) by applying risk-adjusted methods, e.g., Sharpe ratio, Treynor ratio, MM performance ratio, and GARCH (1,1) analysis, for the period of 2008 to 2013. Empirical evidence shows that the traditional stock index achieves more than the Shariah stock index.
Moreover, Majdoub and Sassi (2017) envisioned volatility spillover between Asian Islamic equity indices and China by employing a bivariate VARMA-BEKK-AGARCH model for the time span of 2011–2016. Considering the conditional volatility of the returns series, they added the effectiveness of portfolio diversification among variables. The evidence shows that there are significant direct and adverse return spillovers from China to selected Asian Shariah stock markets and bidirectional volatility spillovers among China, Korea, and Thailand stock markets. For worldwide portfolio divergence and hedging approaches, they recommended that stockholders in Asia should hold supplementary stocks in the Chinese market in comparison to other stock markets in Asia in order to diminish the hazard without dropping the projected revenues of their portfolios.
El-Alaoui et al. (2018) investigated the leverage consequence of financial shock waves in the framework of a European portfolio by employing mean-variance efficient frontier, the Sharpe ratio, and capital market line inspection. They used 320 firms as an observation by considering 8 European states, e.g., UK, Sweden, Switzerland, Italy, Germany, France, and Austria. Their numeric outcomes revealed that embarking on leverage lessens portfolio incomes, unpredictability, and importance at menace. Additionally, they presumed that optimum portfolio alignment is acquired via a high fraction of minimum debt resources as a consequence of two distinct equity funds, e.g., minimum leverage and maximum leverage portfolios. Using different data from different regions and continents. Dewandaru et al. (2014a), Abbes and Trichilli (2015), and Antar and Alahouel (2019) studied the deviation advantages of capitalizing in different international capital markets. For example, Antar and Alahouel (2019) analyzed the MENA region index with seven other global indices. They found the presence of diversification benefits among the stocks. The authors recommended incorporating the U.S., Canada, and emerging market indices in the MENA index so as to gain the benefit of portfolio diversification. Similarly, Rahim and Masih (2016) employed data from Shariah-compliant stock in Malaysia and compared it with its main trading partners. The authors found no long-term diversification opportunities for Malaysian investors seeking to invest in the selected markets. However, they may gain limited diversification benefits for a very short time period.
Many studies have been made to determine risk and return connections by employing the CAPM strategy (Rahman et al. 2006; Rhaiem et al. 2007; Chang et al. 2011). Compared to the emergence of Islamic stocks, there exists less literature regarding the Islamic market compared to traditional stock. Several studies have explored the progress of Shariah funds and matched their progress with traditional stock. On the other hand, some more scholars have inspected Shariah funds with few Shariah indices as determinants and matched them with non-Shariah funds. Few researchers, e.g., Ismaila and Shakranib (2003) have found the link between return and beta for Shariah component trusts in Malaysia with both provisional CAPM and no provisional CAPM. They established a horizontal, non-provisional, and insignificant liaison between beta and risk premium, whereas with provisional CAMP scrutiny, there is a significant and direct rapport between beta and return. Their consequences also specified that stockholders in Shariah component trusts are risk opposed because of their preparedness to invest in indices with a minimum degree of threat.
Hammoudeh et al. (2014) showed time-varying dependency between Islamic and traditional stock indices, while Saiti et al. (2014) reported evidence that traditional stock markets are mostly affected by the contagious effect rather than the Shariah-based markets during the U.S. sub-prime crisis period in 2007–2009. Al-Yahyaee et al. (2020) supported the evidence that during the crisis and post-crisis periods, the Shariah-based equity markets showed better performance, while the traditional equity markets showed outperformance during the pre-crisis period. In contrast, Shahzad et al. (2017) rejected the decoupling hypothesis between Shariah and traditional stock markets. Similarly, Hasan et al. (2021) pointed out that Shariah and traditional markets are highly associated with risk factors during crisis periods. They suggested that Shariah-based markets fail to provide healthy immunity against economic crises, such as GFC and the COVID-19 pandemic.
The findings of dependency between the Shariah and traditional stock markets are still inconclusive. In a nutshell, the empirical literature has found different results on the relationship between Shariah and traditional stock markets during the 2007/2008 global financial crisis and the recent COVID-19 pandemic. Moreover, previous studies mostly relied on standard time series (Abbes and Trichilli 2015; Saiti et al. 2014), the CAPM (Aarif et al. 2021; Al-Yahyaee et al. 2020; Suryadi et al. 2021), and traditional GARCH model (Ben Rejeb and Arfaoui 2019; Jabeen and Kausar 2022) to investigate the relationship between the Shariah and traditional stock markets. Therefore, to fill the gap, we further investigate the dependency between the Shariah and traditional stock markets in a time-frequency-based dynamic environment.

3. Methodology

3.1. Multivariate GARCH—DCC

The GARCH model has a long and noteworthy history and consists of a big family, including GARCH (1,1), EGARCH, FGARCH, GRACG-BEKK, and others (Dritsaki 2017). Among this big family, the GARCH (1,1) model is a very popular model, which captures the volatility of time-series data. It covers the shortfall of the ARCH model as it captures past information in the time-varying conditional-variance model. However, they are not free from limitations. For example, it cannot capture the asymmetric and dynamic relationship among the variables that arise from the bad or good news from the markets. MGARCH is a developed version of the GARCH model introduced by Bollerslev (1990) that can cover the conditional correlation among the variables. This new model, MGARCH, keeps the correlation among the variables fixed but allows the correlation coefficient to vary over time. However, this mode makes certain estimation assumptions too simple without considering the complexity of reality (Longin and Solnik 2001). Hence, the MGARCH-DCC model was proposed by Engle, which takes care of the dynamic nature of time-series data.
The model is written as follows:
r t = β 0   + k i = 1 k β i   r t 1   + u t   = μ t   u t
μ t = E   [   r t   | Ω   r t 1   ]
μ t     |   Ω t 1   ~   N   ( 0 ,   H t   )
H t   = G t R t G t
G t     d i a g   {   h i i , t   }
Z t = G t   1   u t
Source: Ku (2008).
Where h i i , t represents the estimated univariate GARCH models of conditional variance, G t represents the diagonal matric of conditional standard deviations, the time-varying conditional correlation coefficient matrix of returns is represented by R t , while Z t is a vector for standardized residuals with zero mean and variance of one. Therefore, the DCC model of dynamic correlation coefficient matrix can be written as follows:
R t = ( d i a g   ( Q t   ) ) 1 2 Q t   ( d i a g   ( Q t ) ) 1 2  
Q t = ( q i j , t )
d i a g ( Q t ) ) 1 2 = d i a g   ( 1 q 11 , t   , .. ,   1 q n n , t     )      
q i j , t = ρ i j + α ( z i , t 1 z j , t 1 ρ i j )
+ β (   q i j ,   t 1   ρ i j   )
where ρ i j   represents the unconditional correlation coefficient, while ρ i , j , t q 11 , t is the time varying conditional correlation. In order to take care of the leptokurtic nature of the time series data, t distribution is introduced in to the model to solve the problem. Therefore,   μ t     | Ω t 1     ~   N ( 0 , H t ) is replaced by   μ t     | Ω t 1     ~   f s t u d e n t 1   ( u t : v ) , where v represents the degree of freedom.

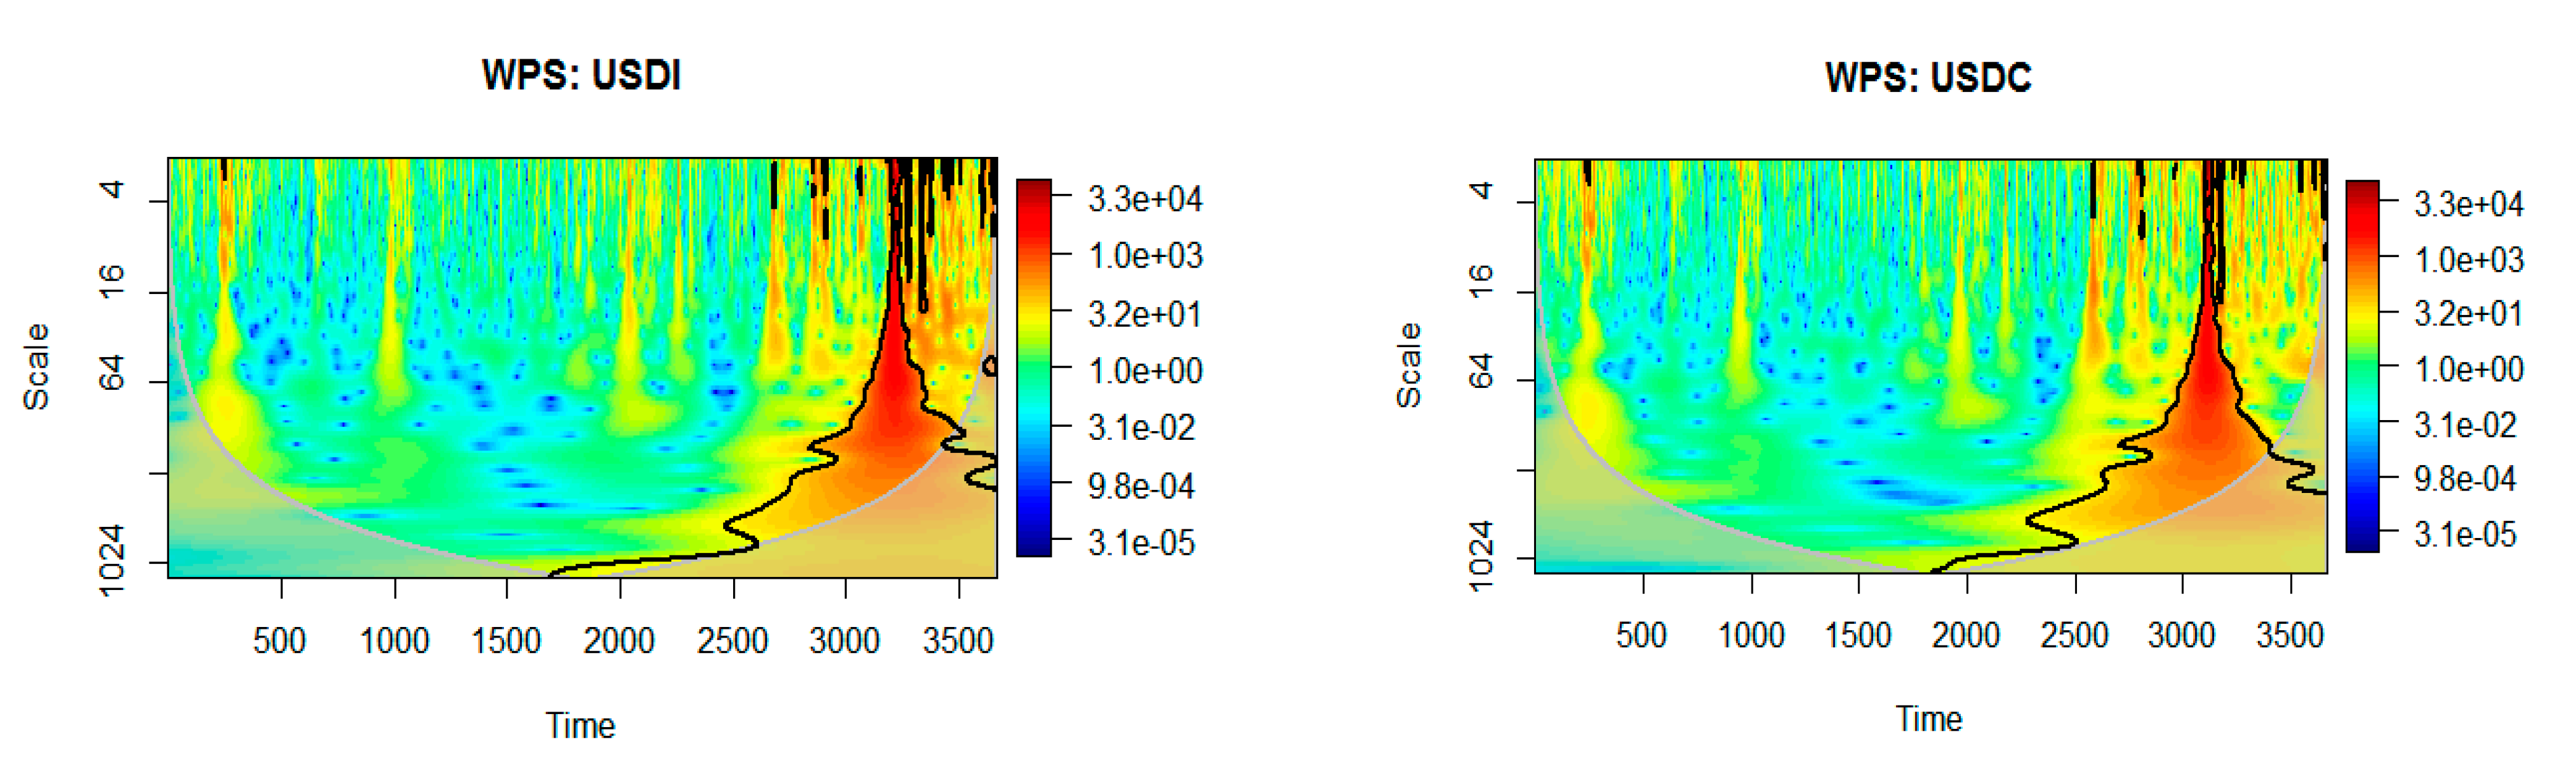
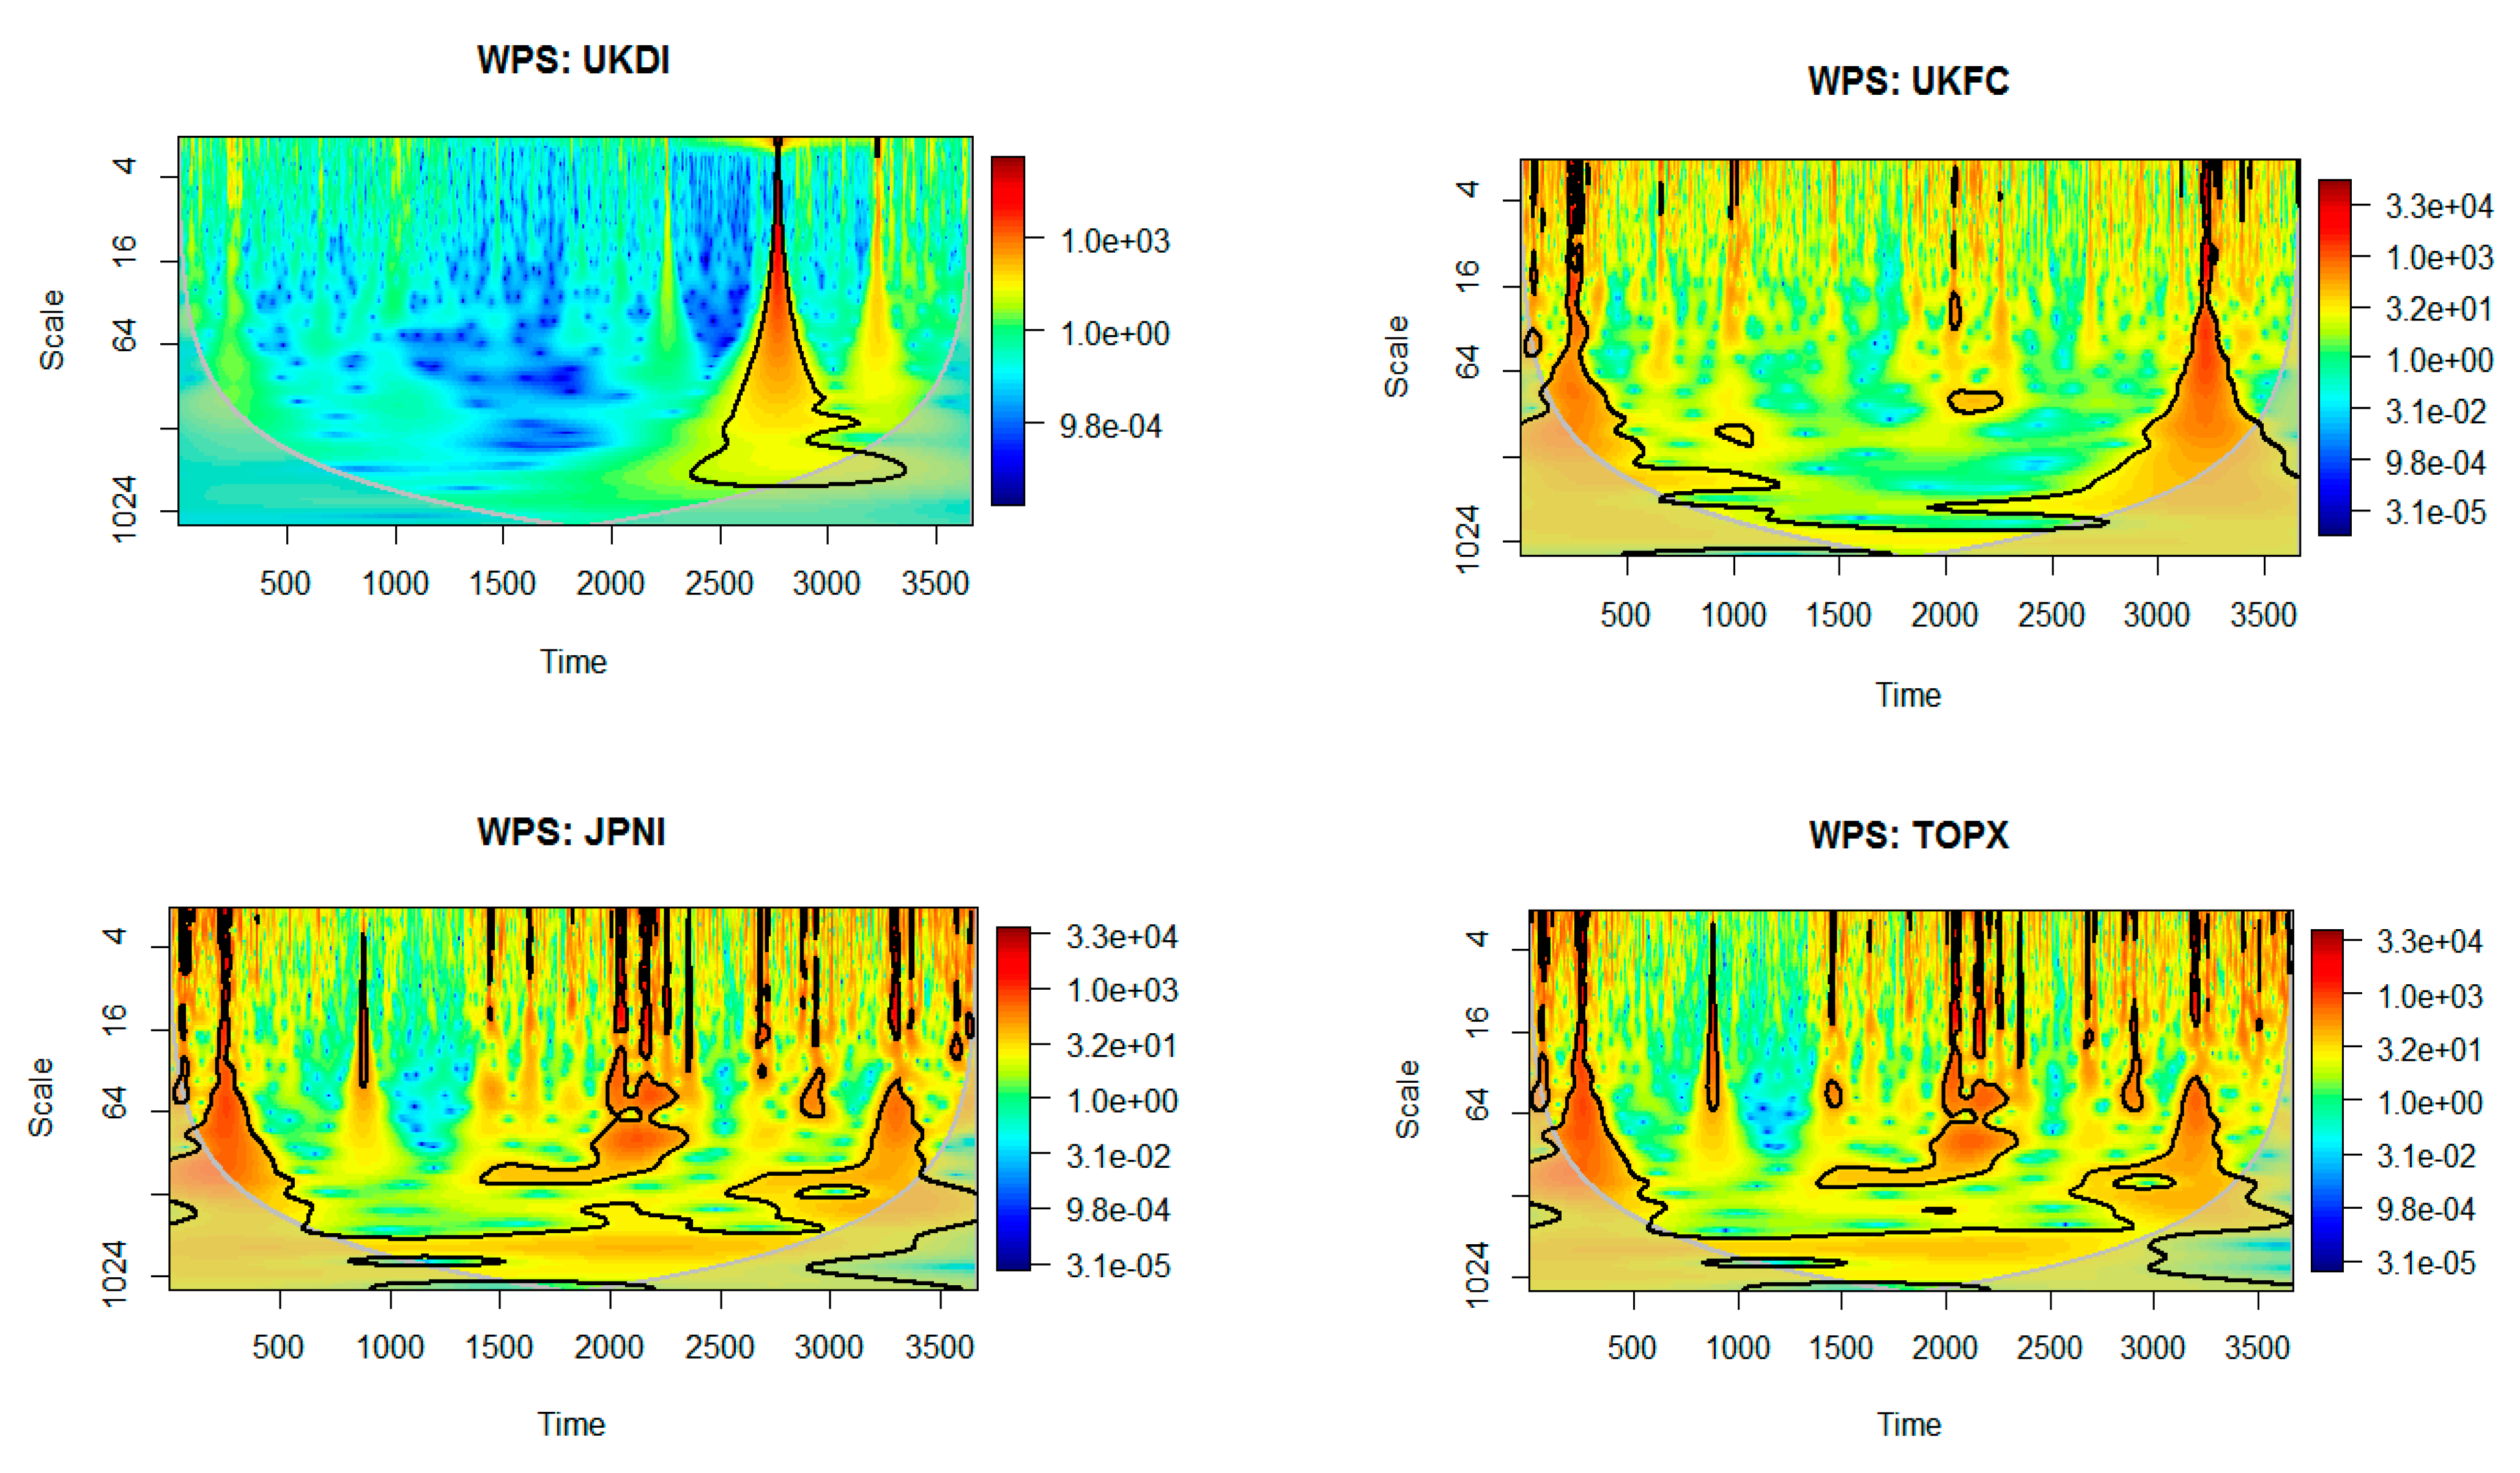
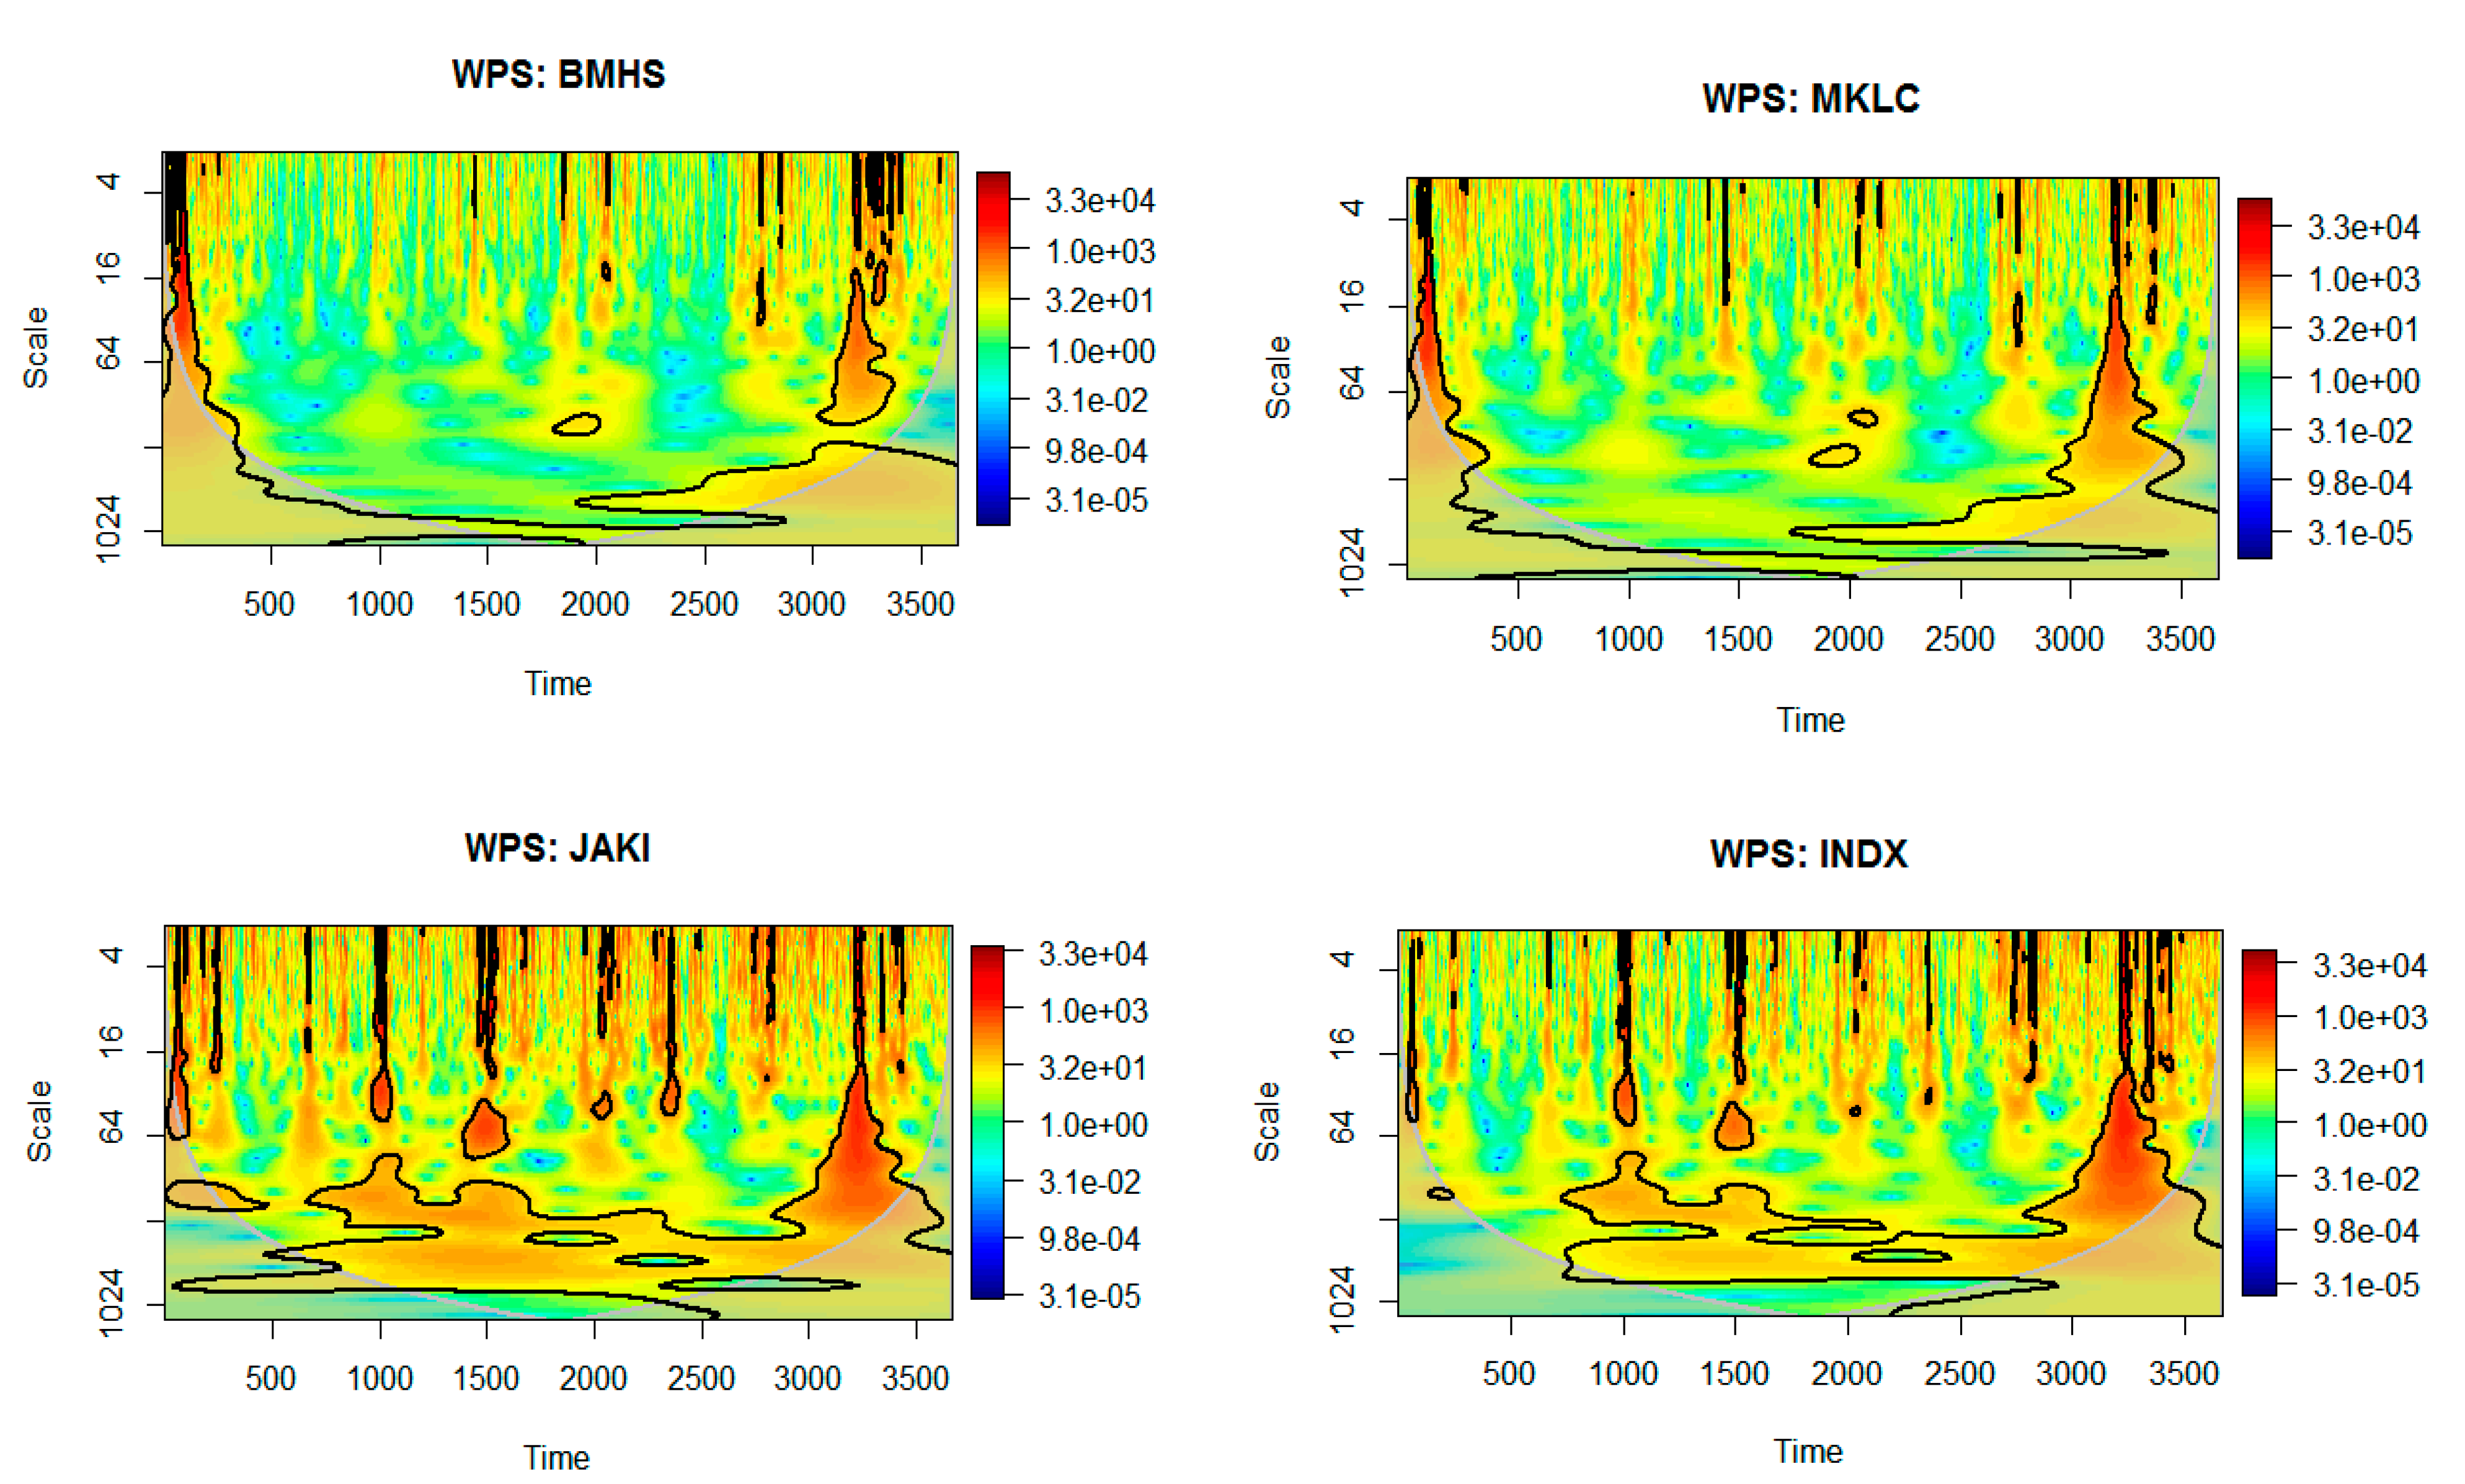
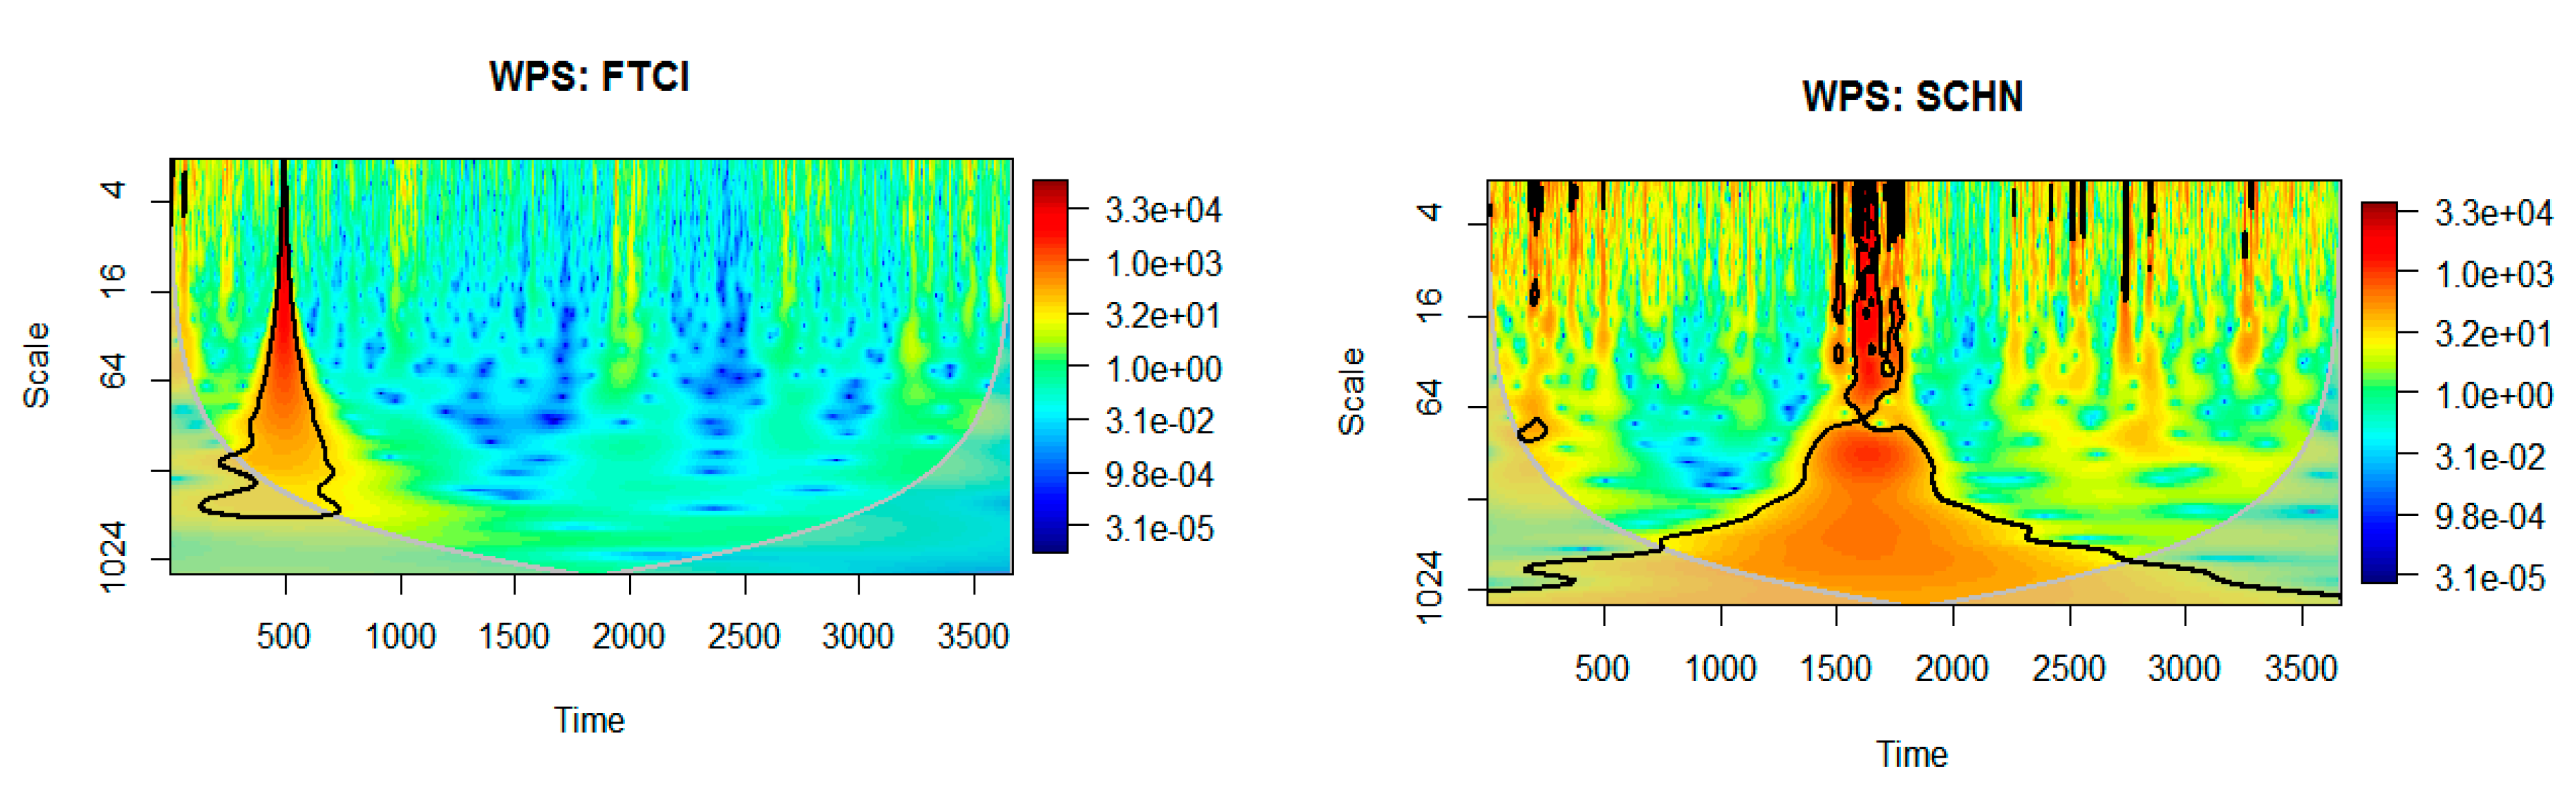
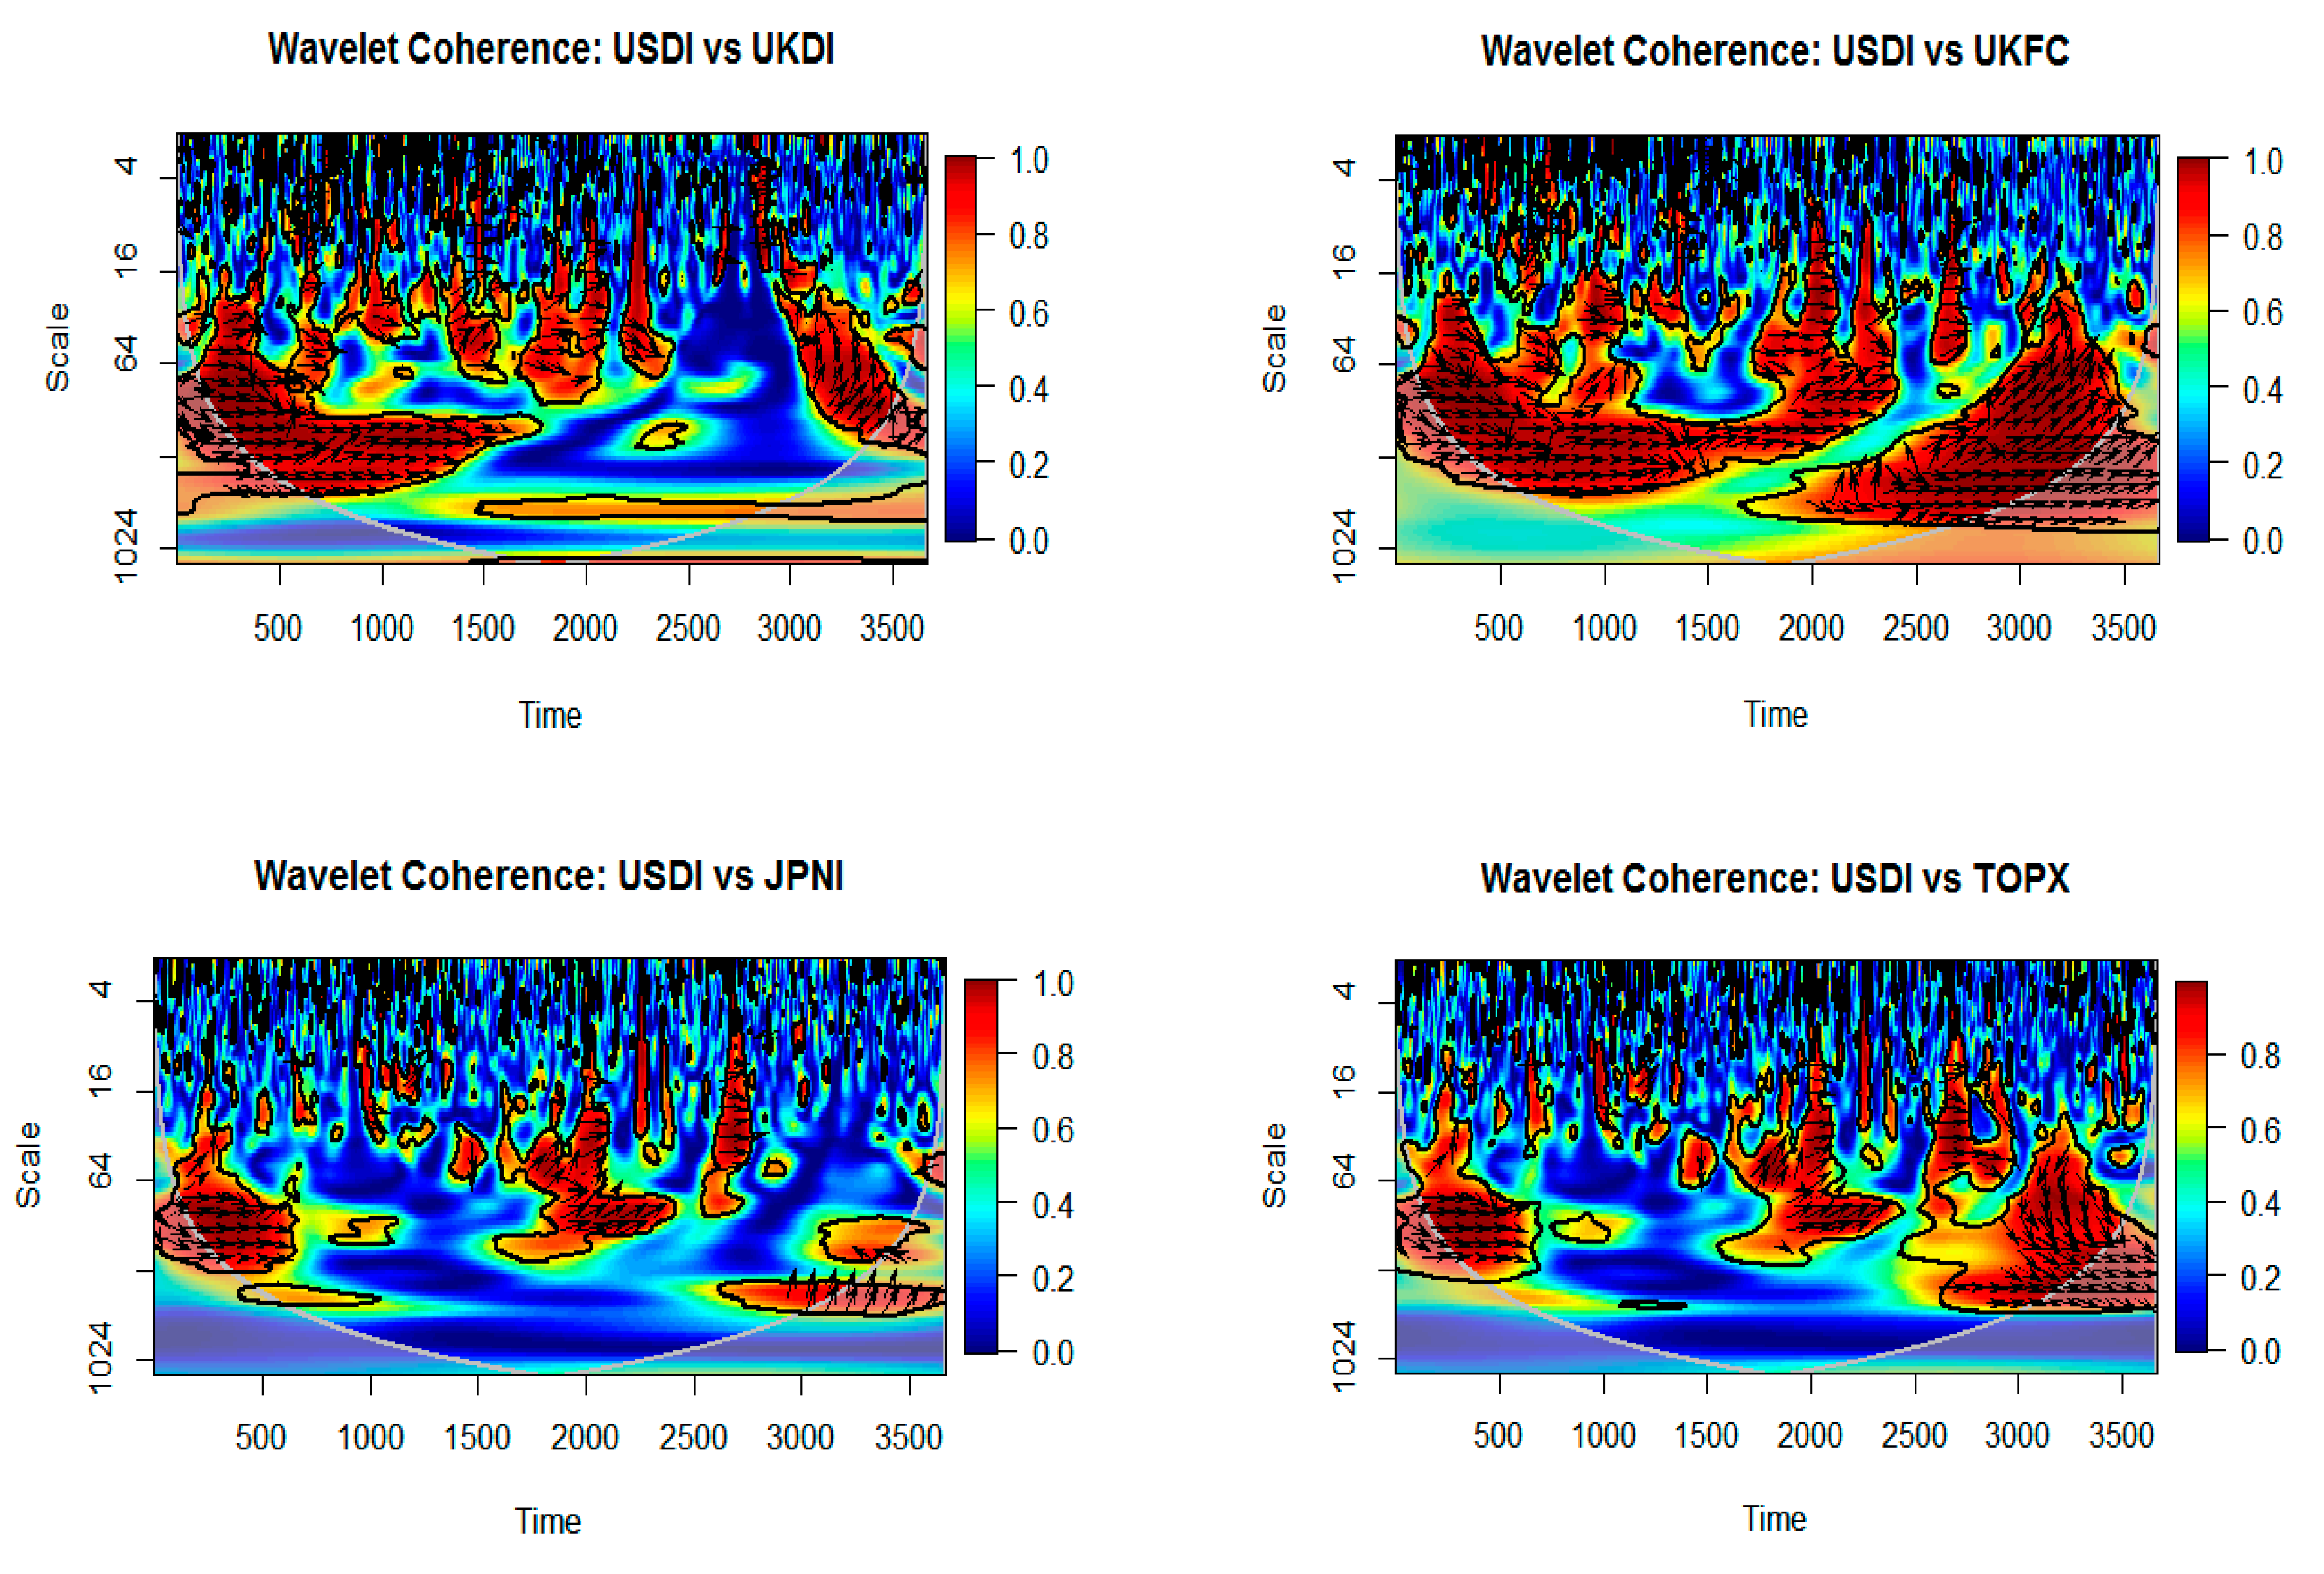
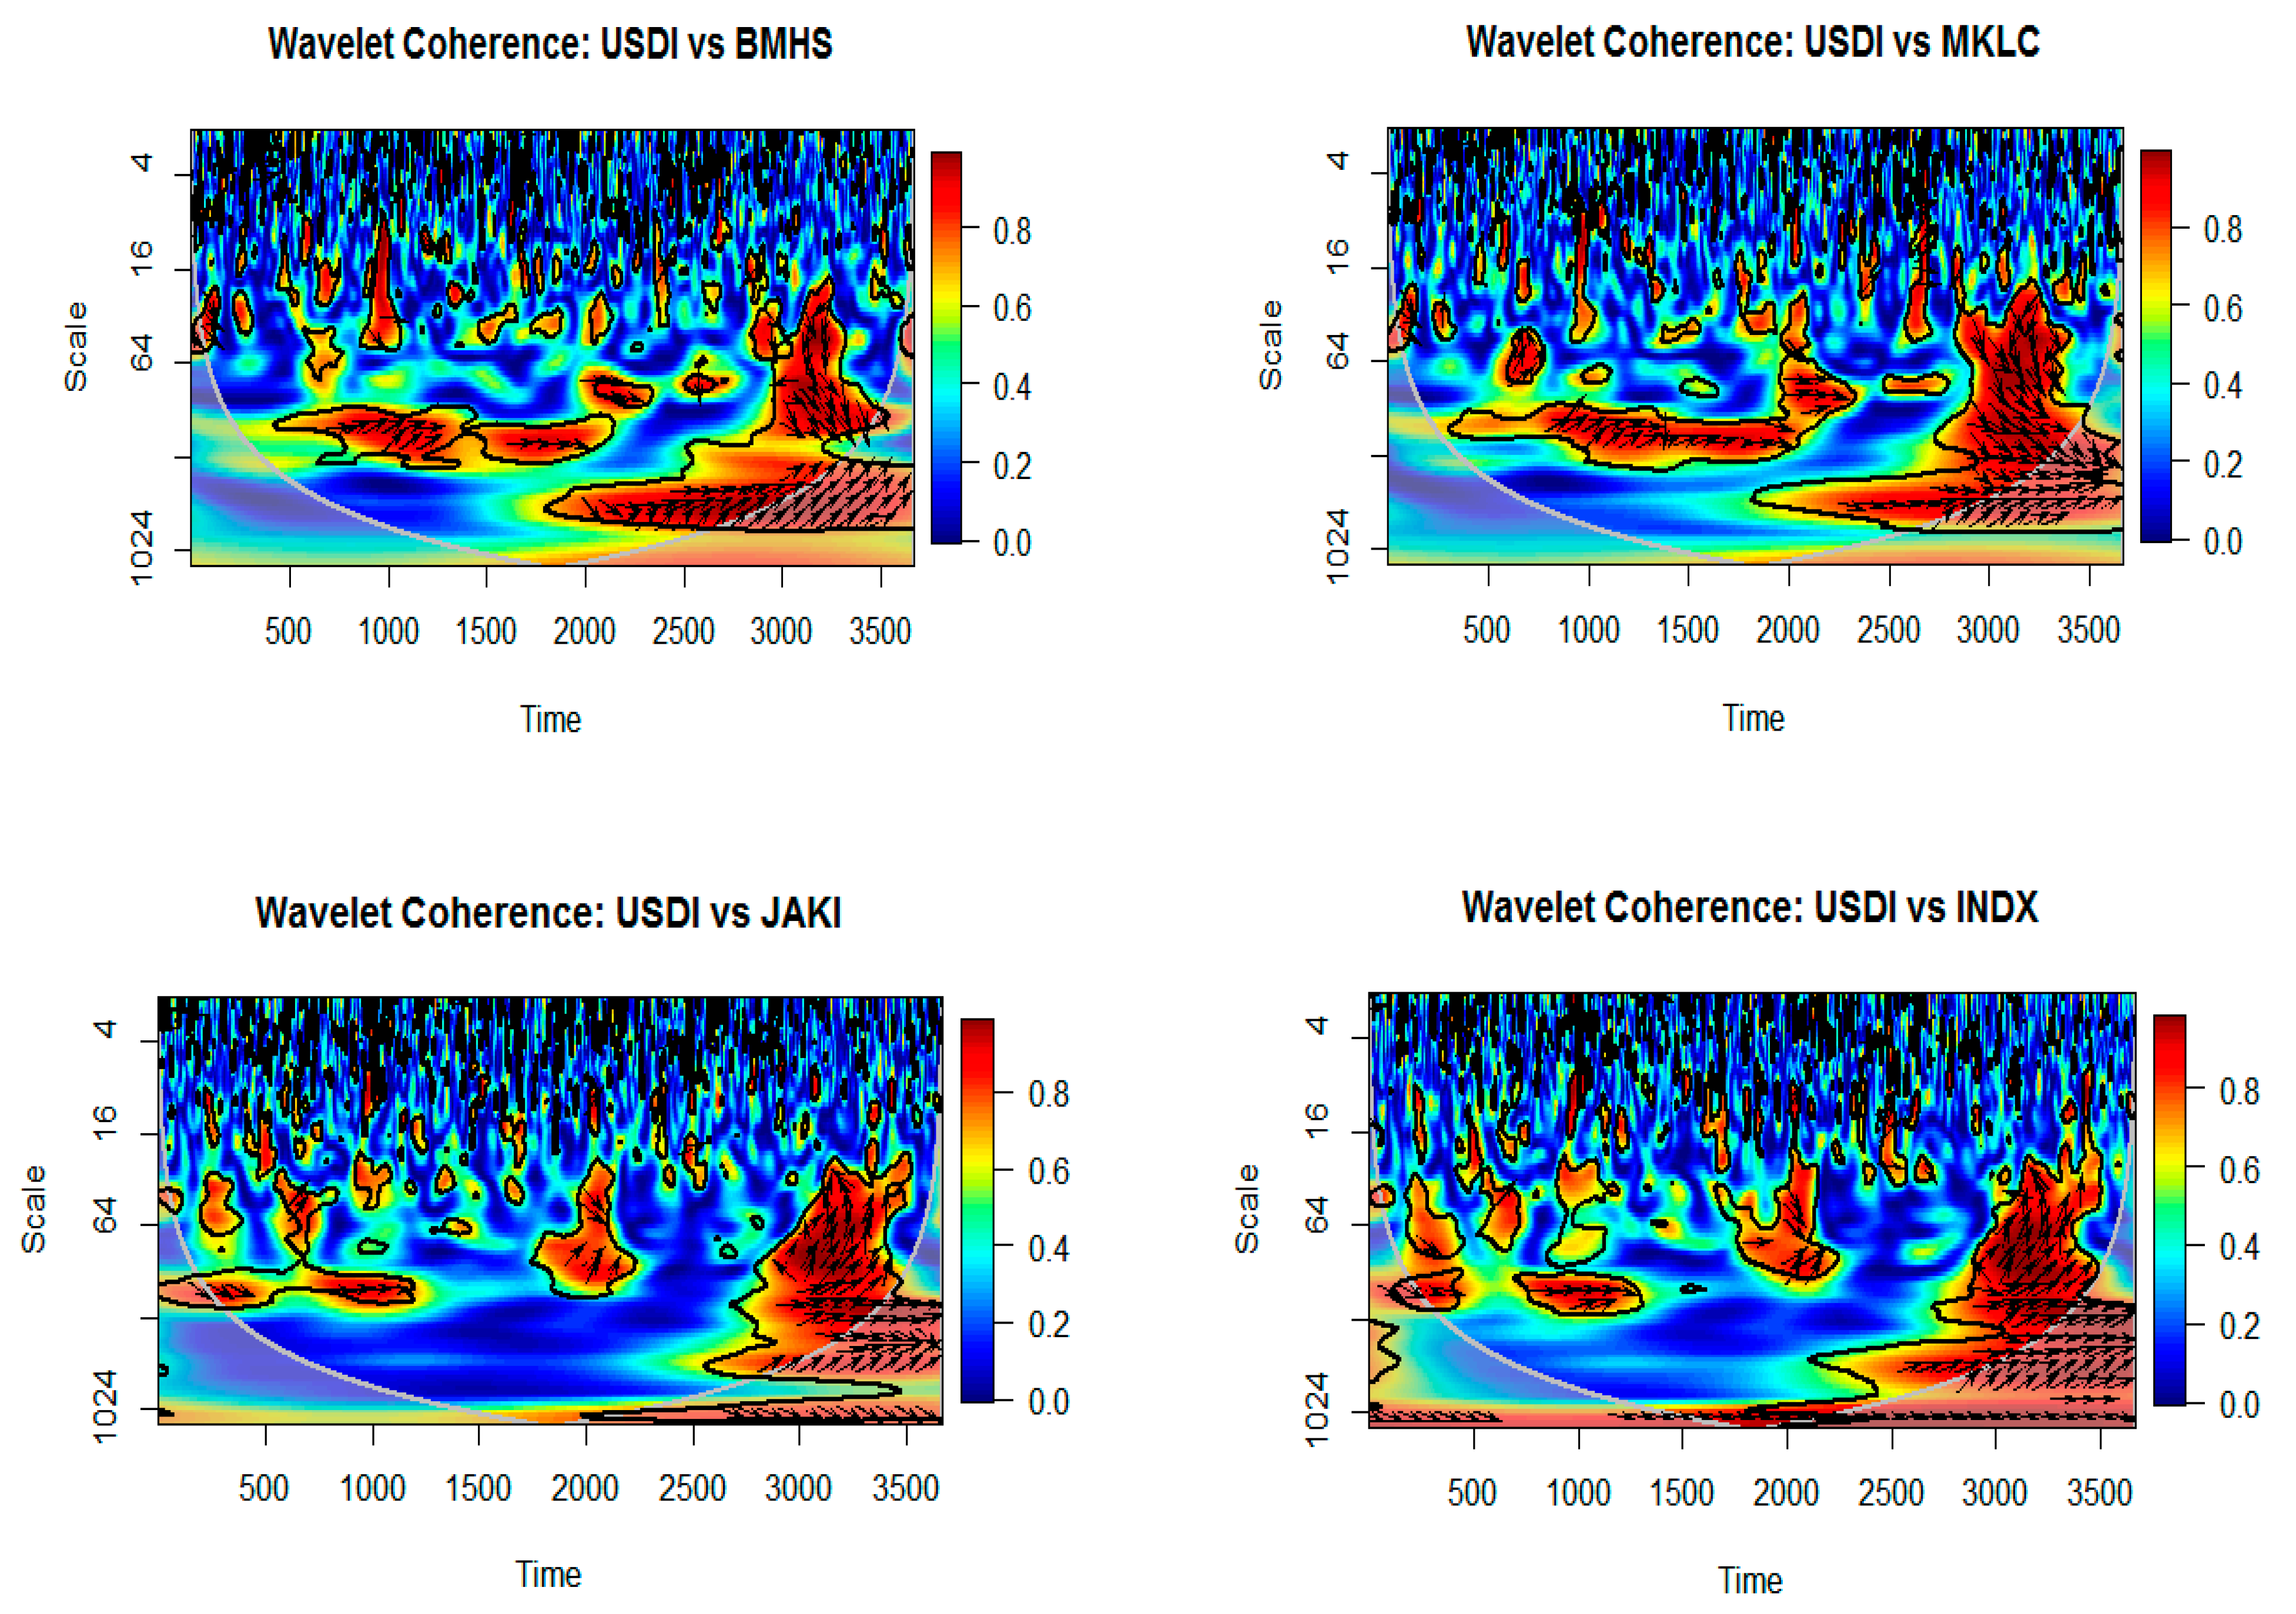
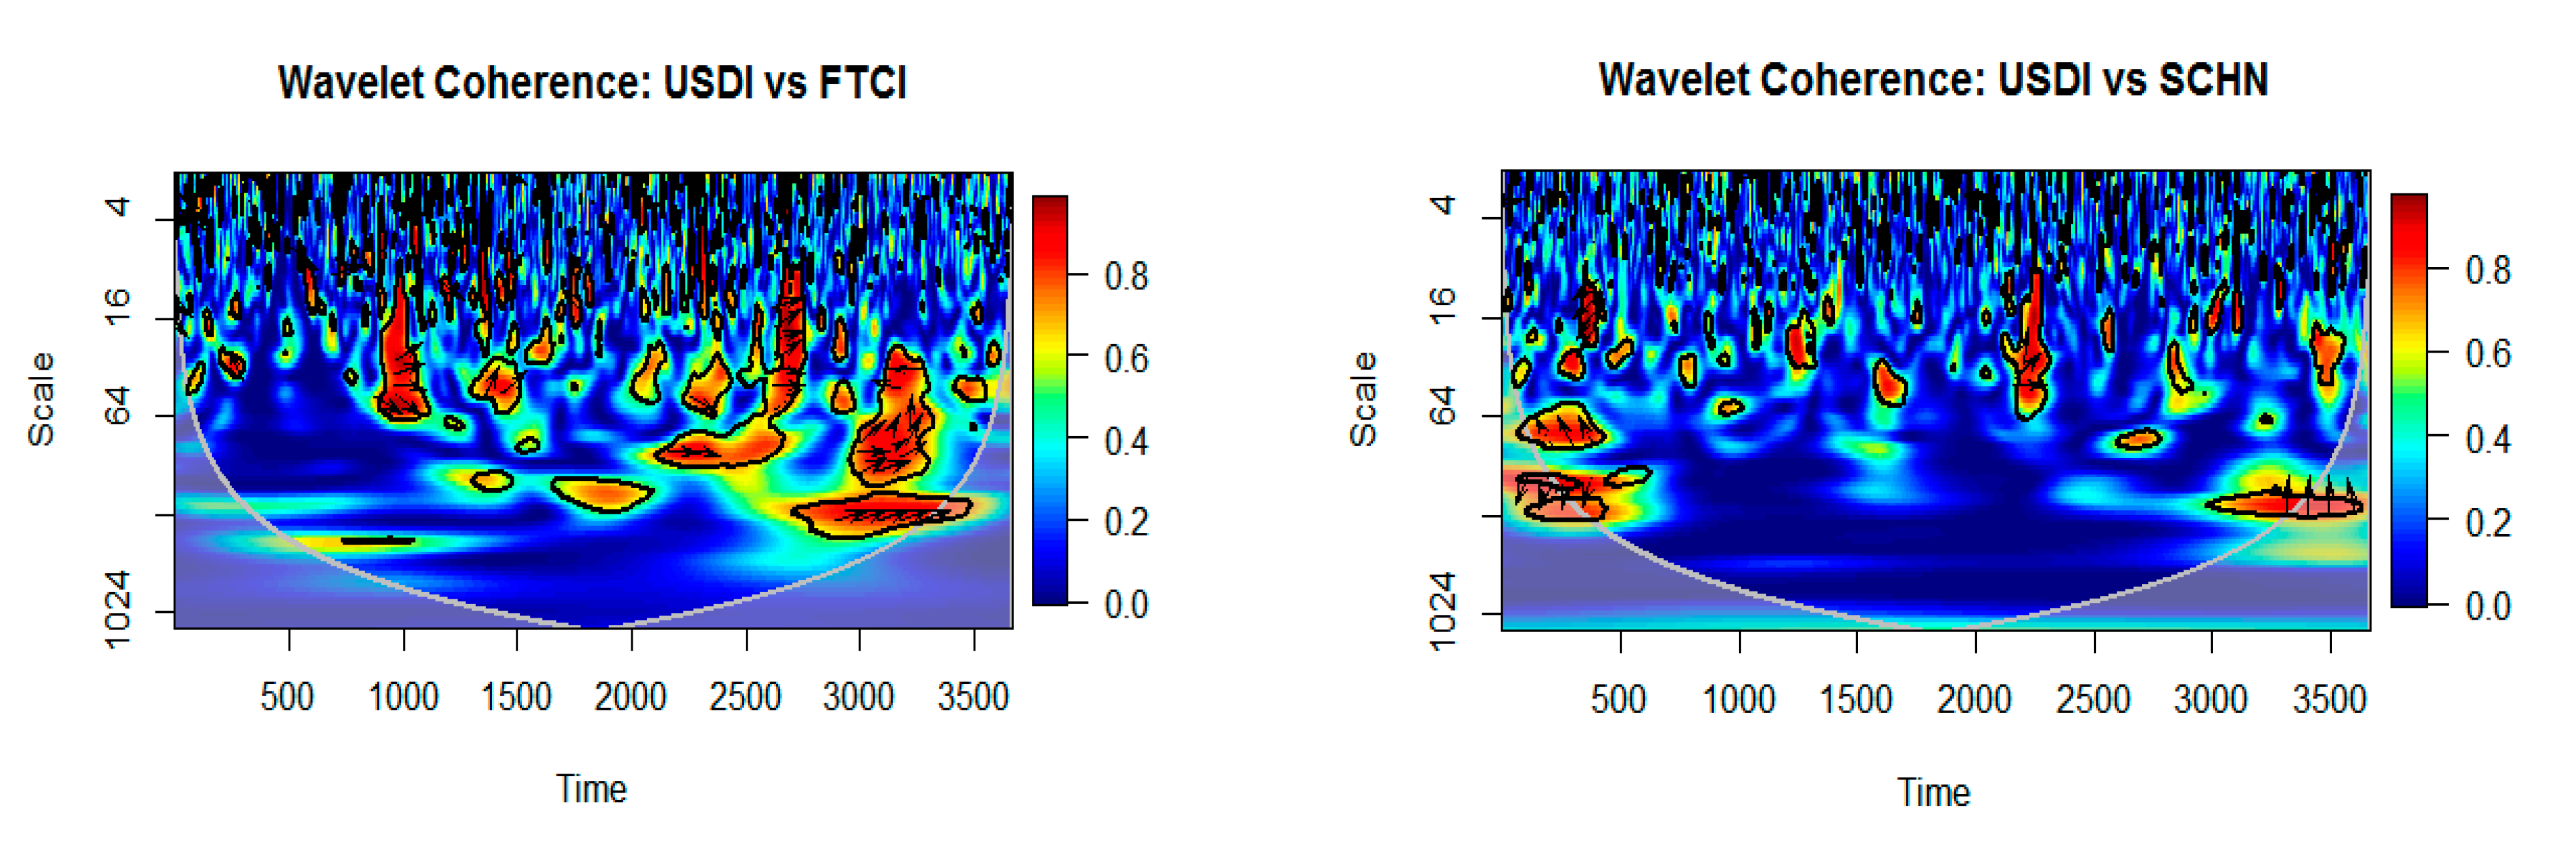
3.2. Wavelet Approach

We use the wavelet power spectrum (WPS) technique to measure the single-assets market variations. The WPS technique is very popular and widely applicable to illustrate the local variations between two series in time-frequency spaces. We can define the WPS as:
W P S x ( τ , s ) = [ W x ( τ ,   s ) ] 2
Here, the WPS is the wavelet power spectrum for the wavelet transform WX(τ,s).
W X ( τ , s ) = + x ( t ) ψ ( t τ   s ) d t ,   τ ,   s   ϵ   R ,   S / = 0
Here, ψ denotes the mother wavelet; τ and s represent the translation parameter and scaling; and the asterisk represents complex conjugation (Karamti and Belhassine 2022).
W S C = R 2 x y ( τ , s ) = | S ( s 1 W 𝓍 / 𝓎 𝓃 ( s ) | 2 S ( s 1 | W 𝓃 𝓍 ( s ) | · S ( s 1 | W 𝓃 ( s ) 𝓎 | 2
Here, R2 presents the wavelets coherence, and S contains the smoothing operator.

3.3. Data

This study employs daily data for stock prices of Shariah equity indices and traditional equity indices from three developed (U.S., UK, and Japan) and three developing countries (Malaysia, Indonesia, and China). This sample spans from 29 October 2007 to 31 December 2021. All data were obtained from DataStream. In order to provide a matched-pair comparison, the research limited the duration of the study to a similar duration for both traditional and Islamic indices. The Dow Jones Shariah index and the traditional index are used to represent the U.S., while in the United Kingdom, the Dow Jones Shariah Index and the FTSE100 Composite Index are used for both Shariah and traditional indices. In Japan, the FTSE Shariah index and the Tokyo price index are used. In developing countries, the FTSE Bursa Malaysia Hijarah Shariah index and the FTSE Bursa Malaysia KLCI Composite Index are used as a proxy for the Malaysian indices, while the Jakarta Islamic Index and the Indonesia Composite Index are used from Indonesia. Finally, the FTSE Shariah Index and Shanghai Composite Index are used as proxies for China (see Table 1).
Stock outcomes were considered by taking the differences of the logarithmic of the daily closing prices of the indices. However, the daily return is measured as follows:
Rt = ln(Pt/(Pt − 1) × 100, where Rt unveils the daily return and Pt and (Pt − 1) denote the present and previous day’s prices, respectively.
The time-series plots of each index are transformed into log form and are presented in Figure 1, which shows that all the returns are non-stationary. Furthermore, the index shows heightened volatility during the 2007–2008 financial crisis, as evidenced by spikes recorded during that period.

4. Statistical Findings and Discussion

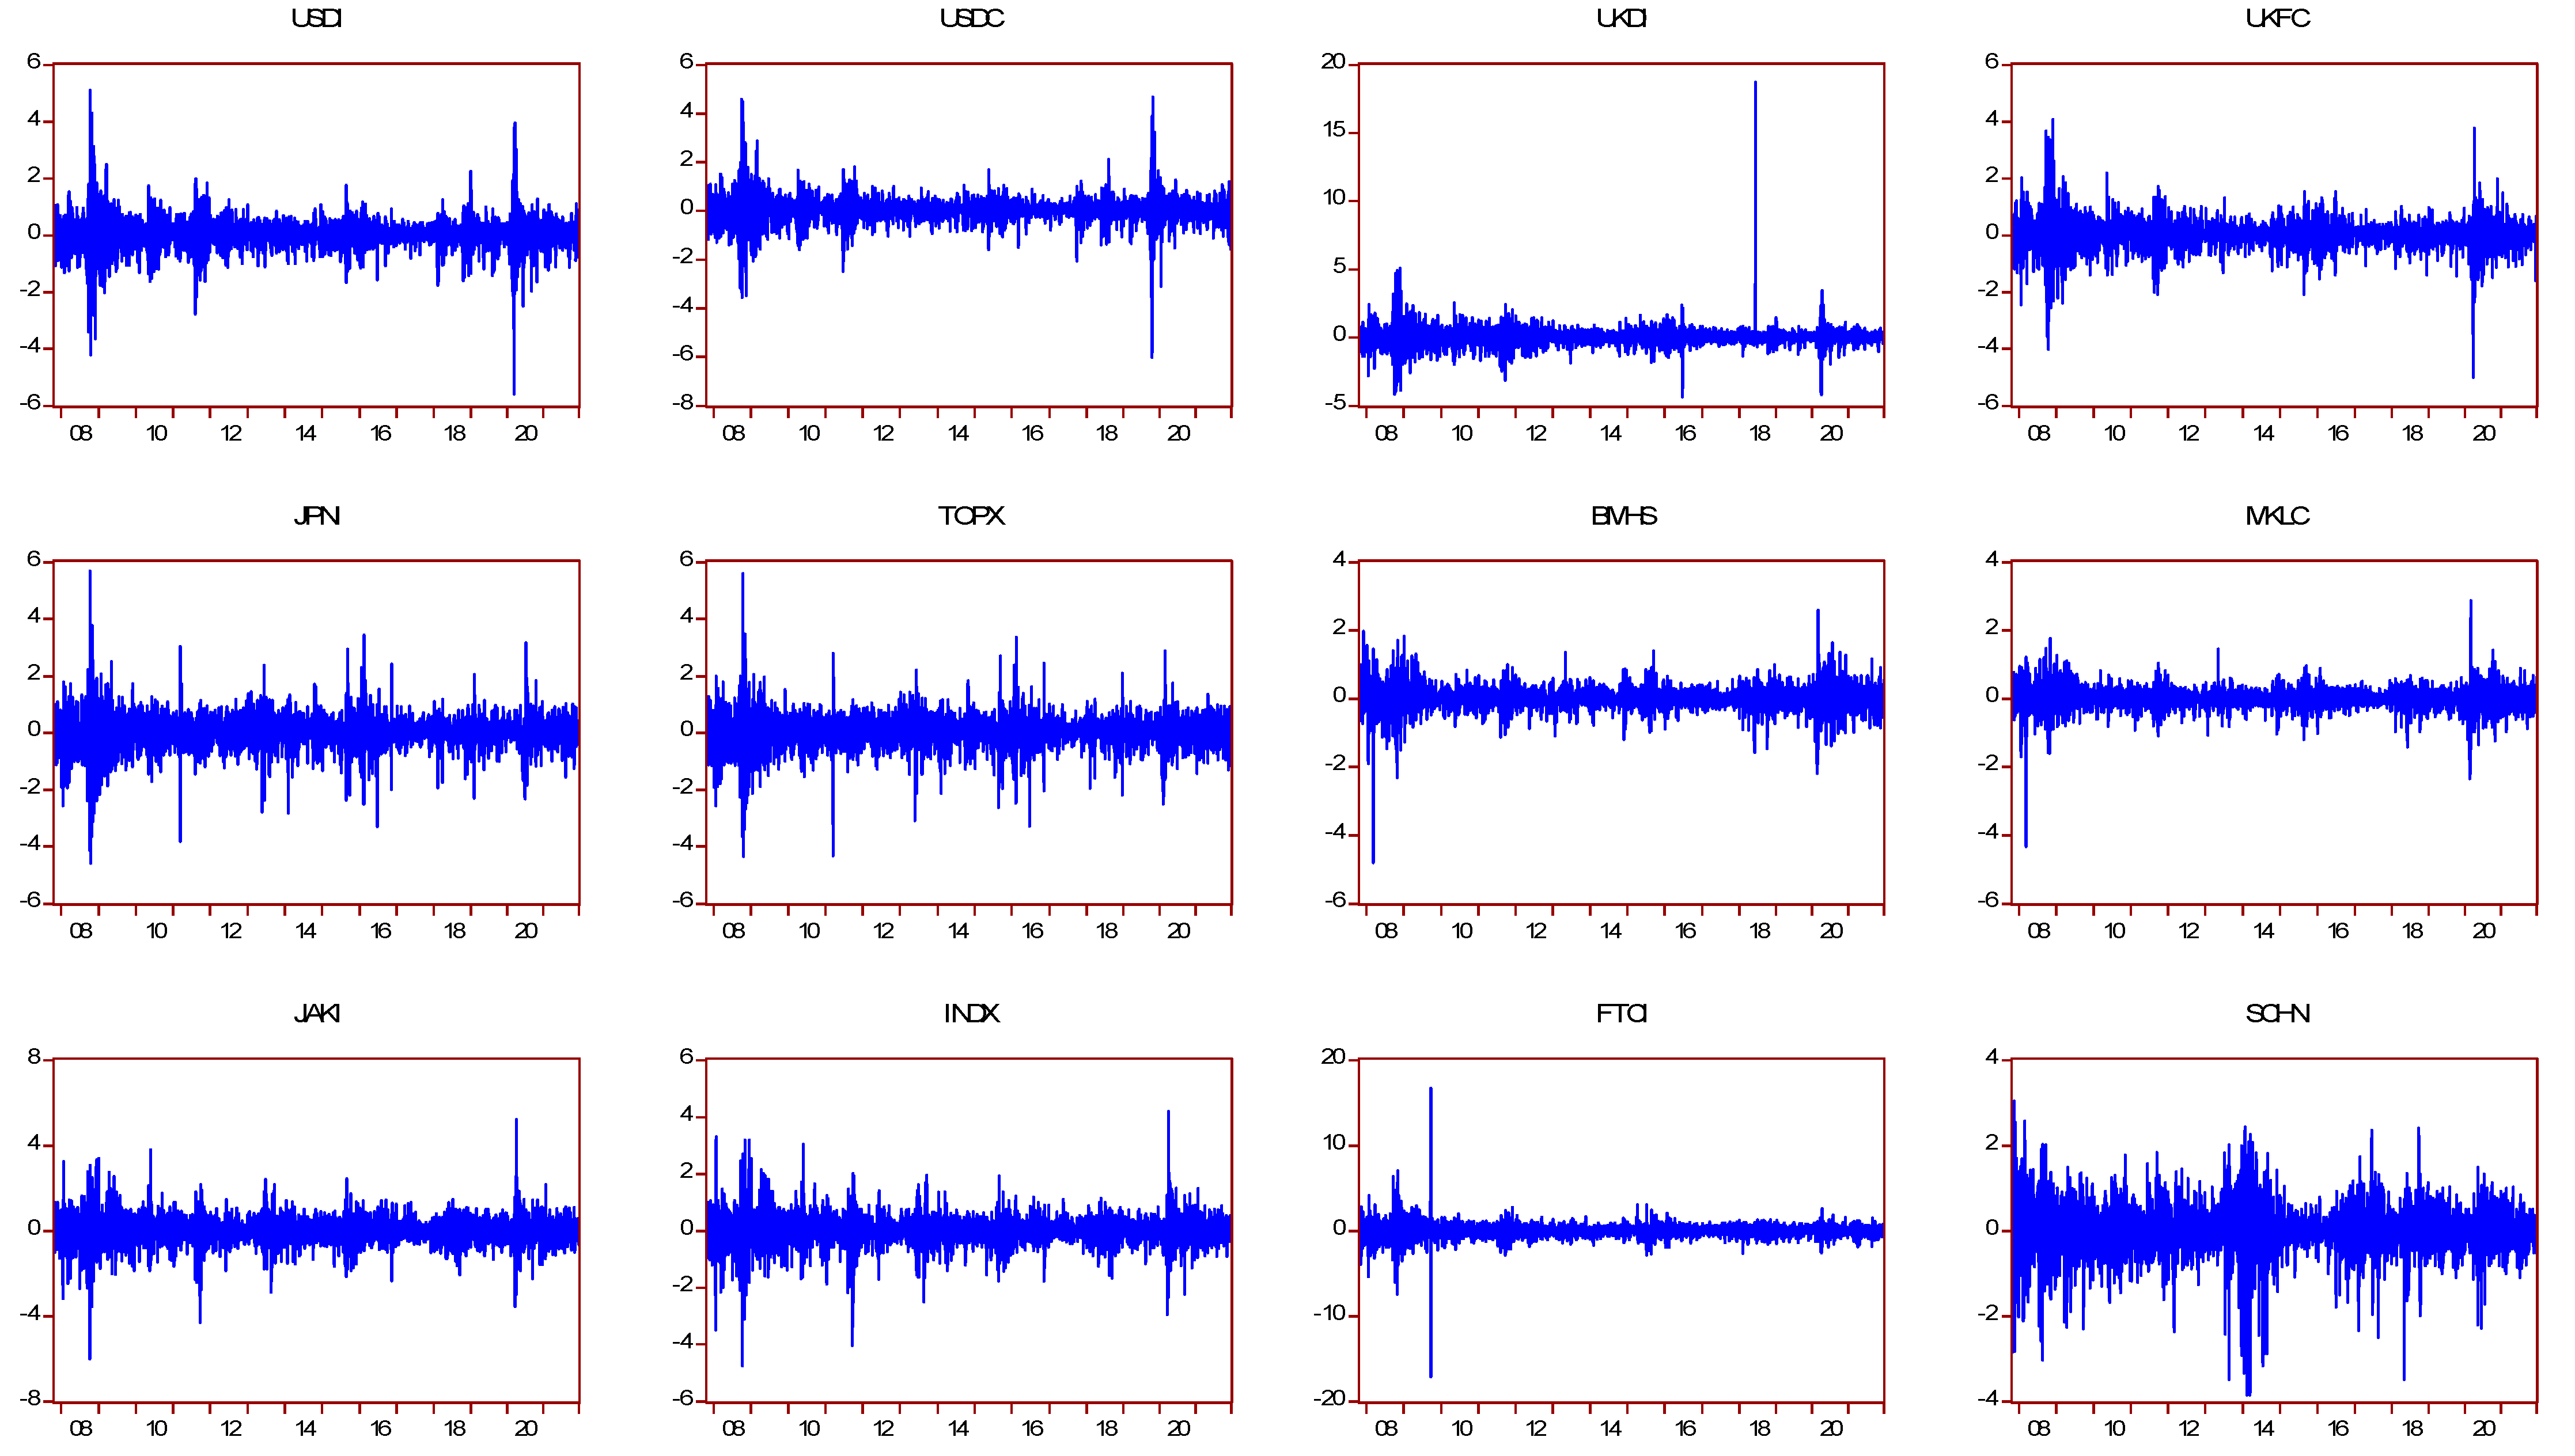
4.1. Descriptive Statistics
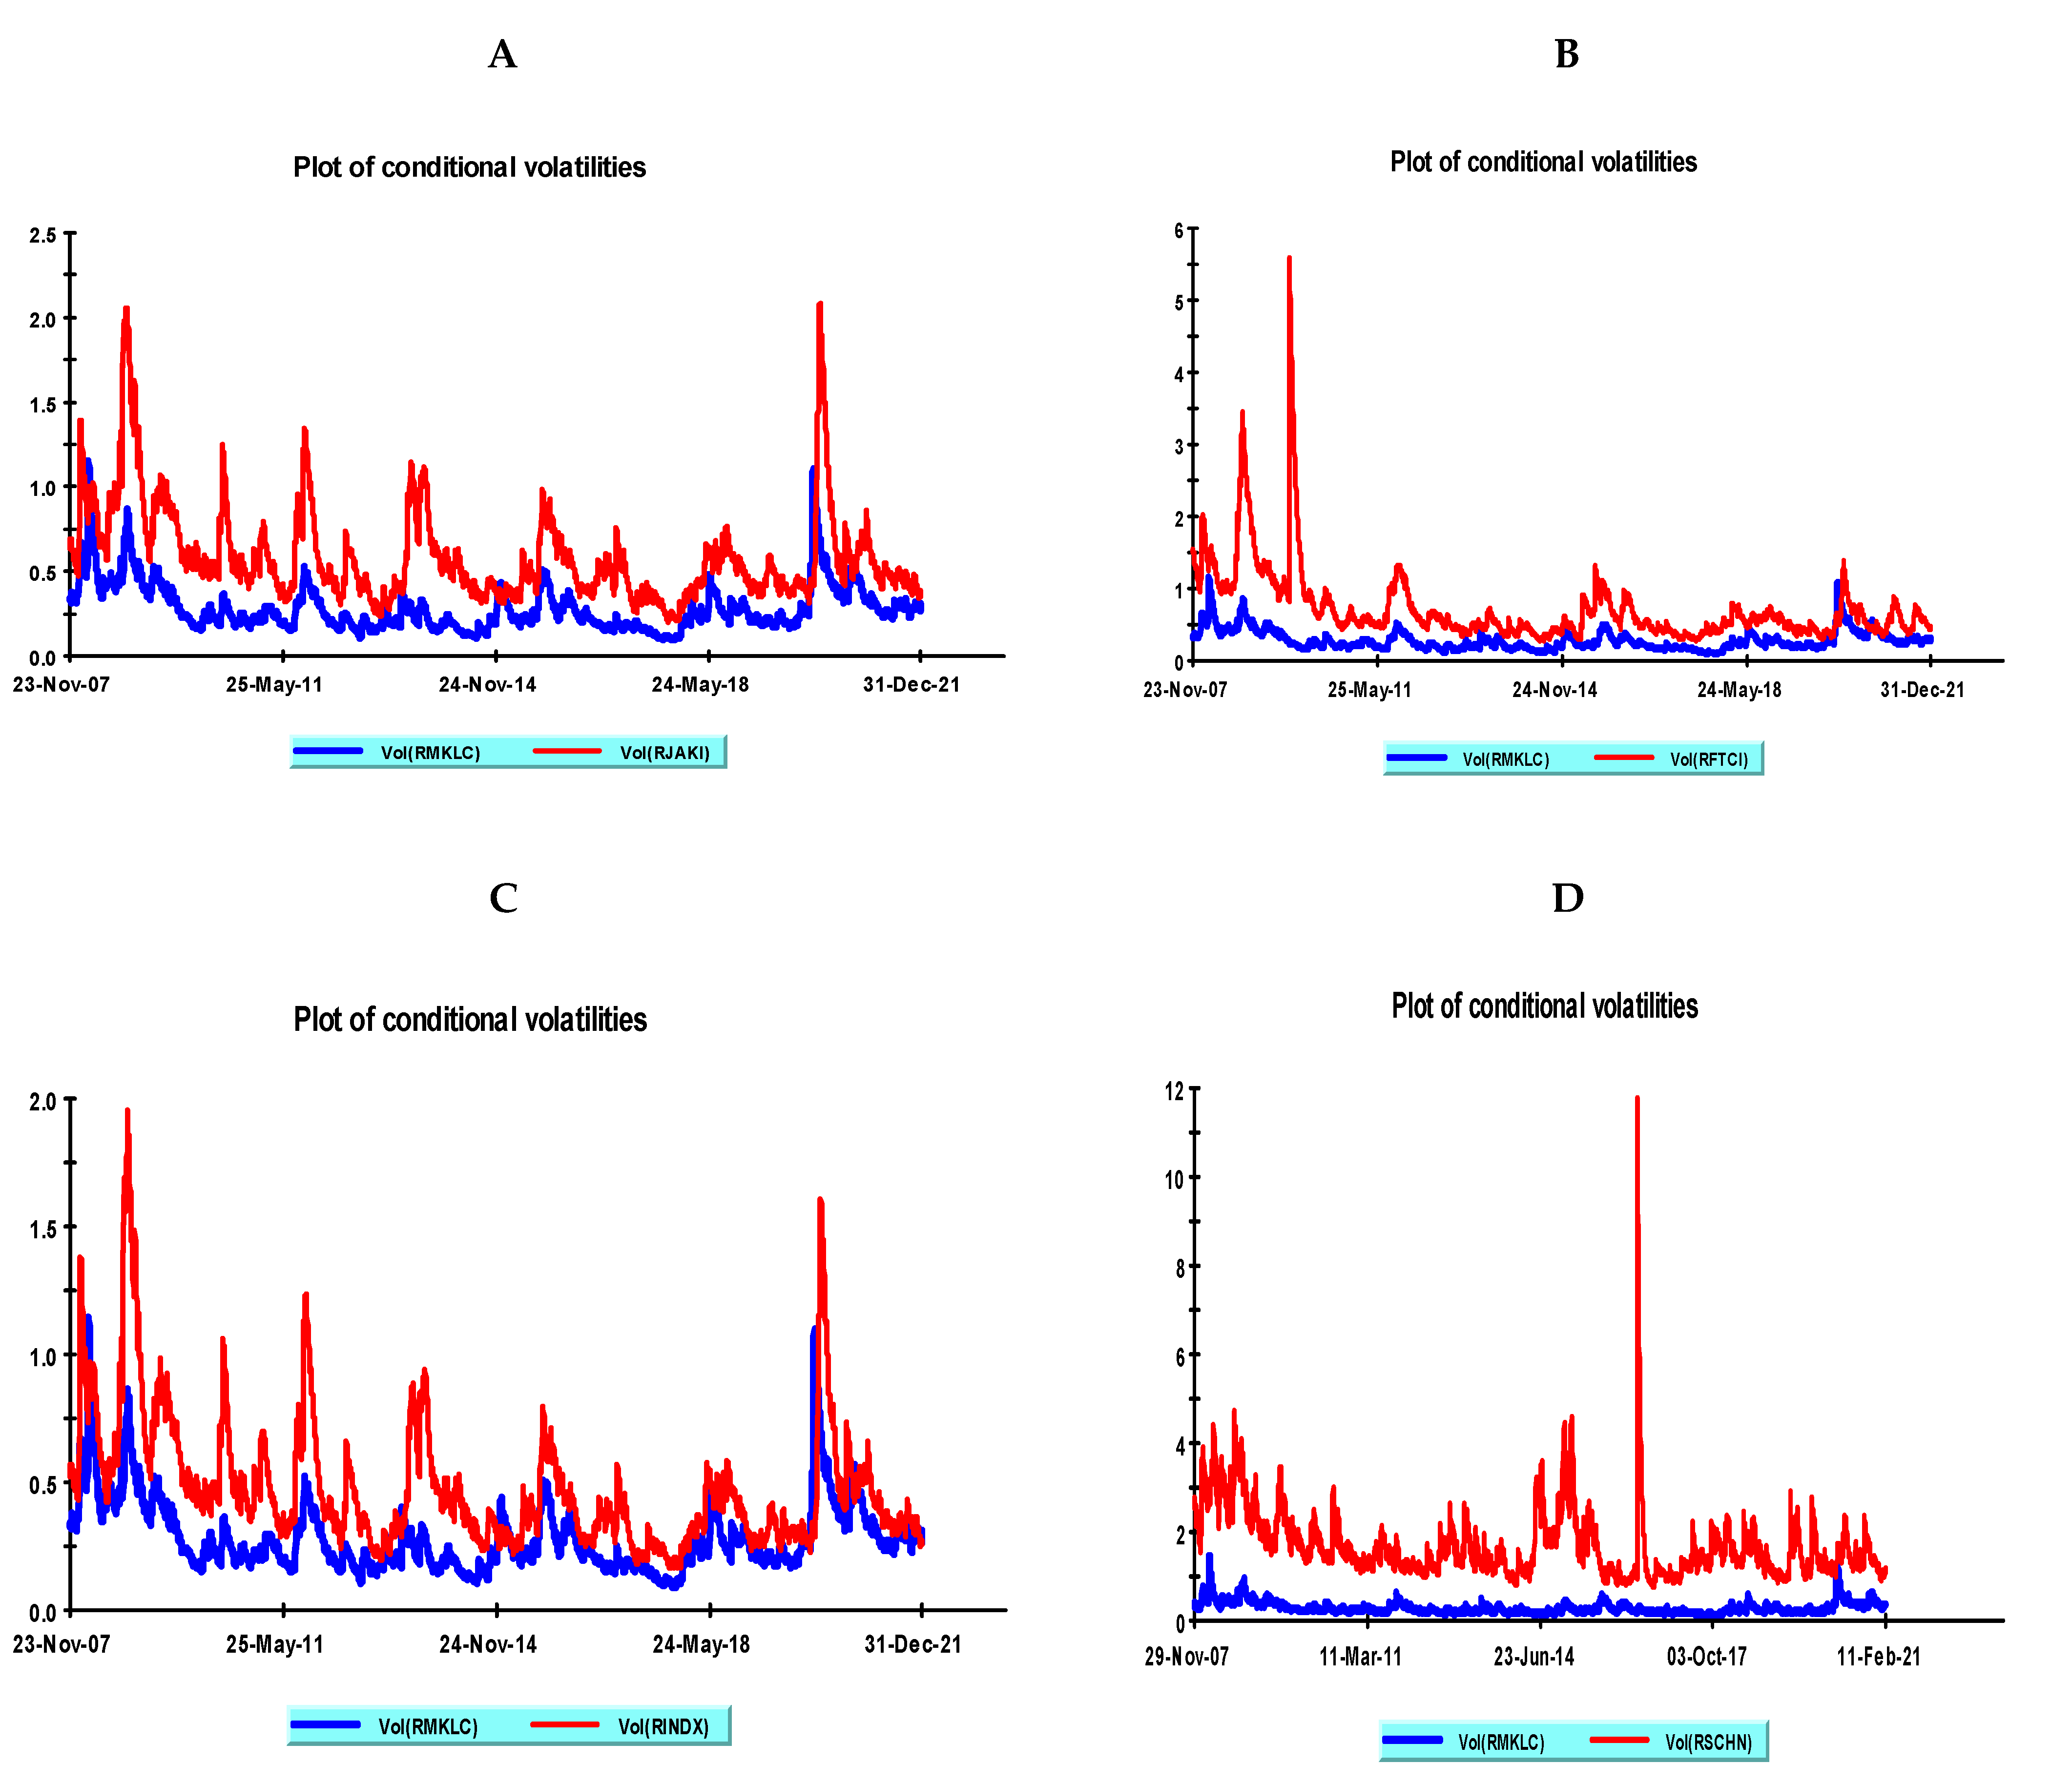
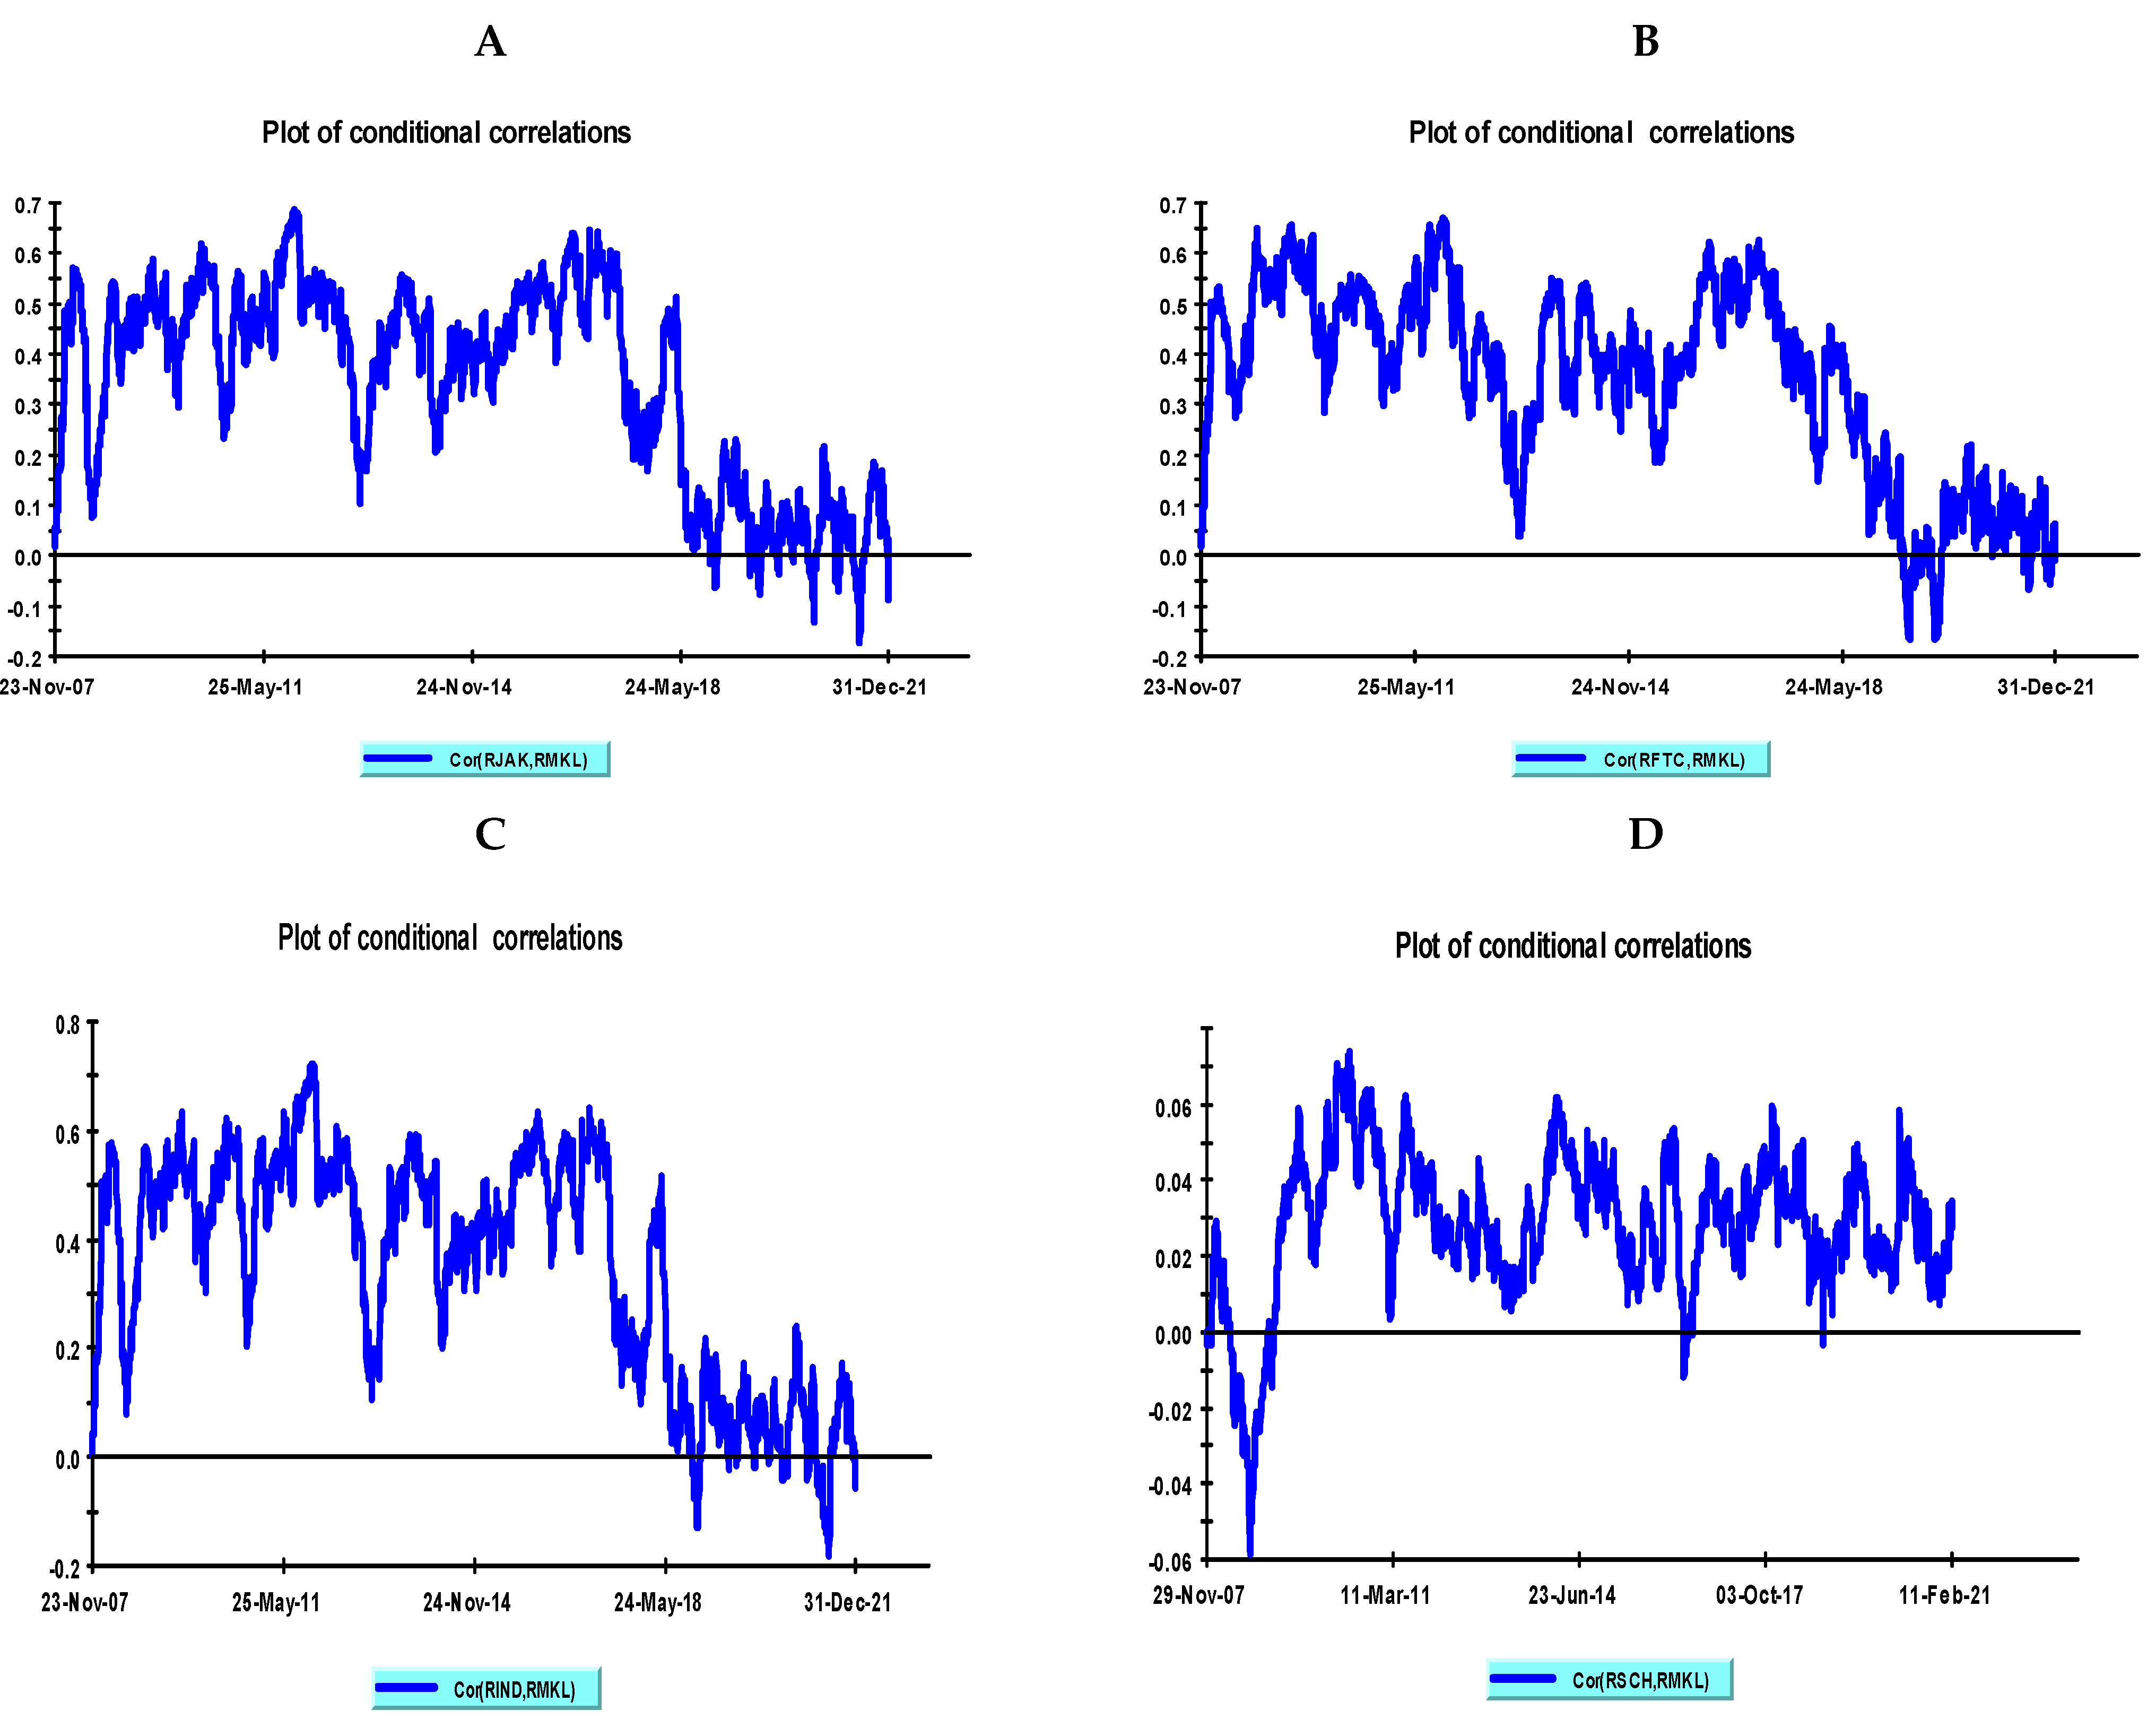
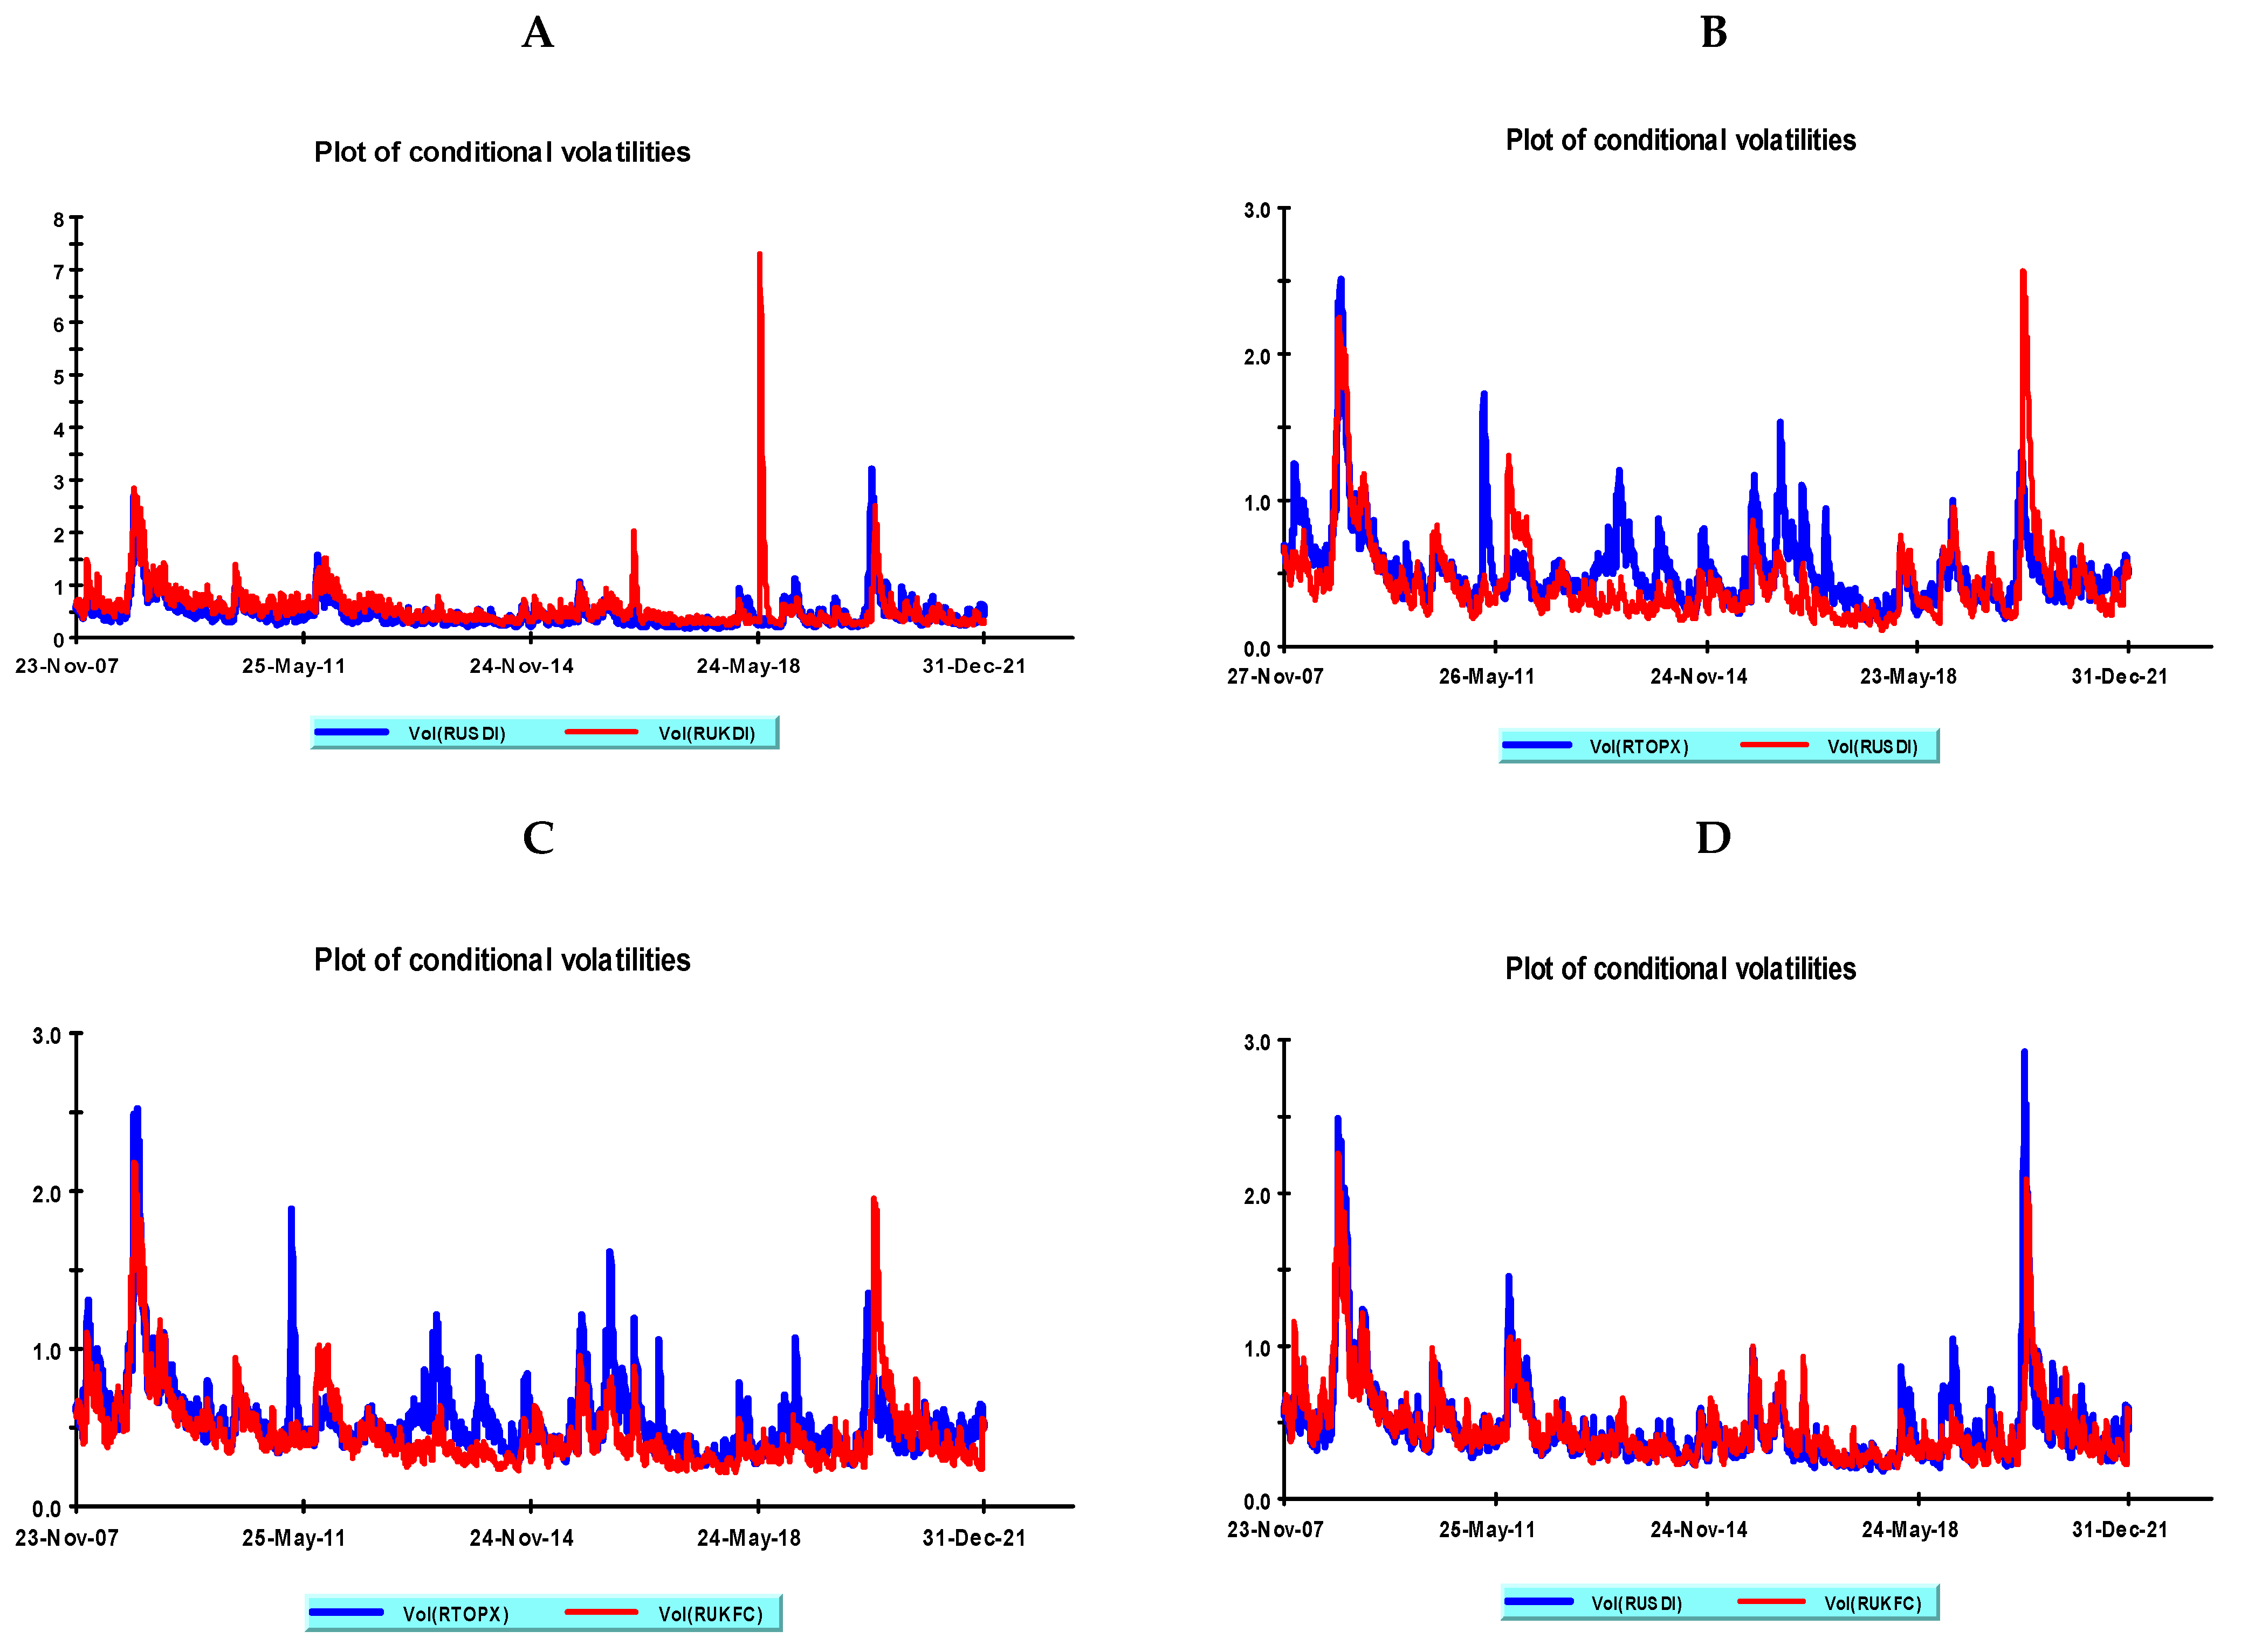
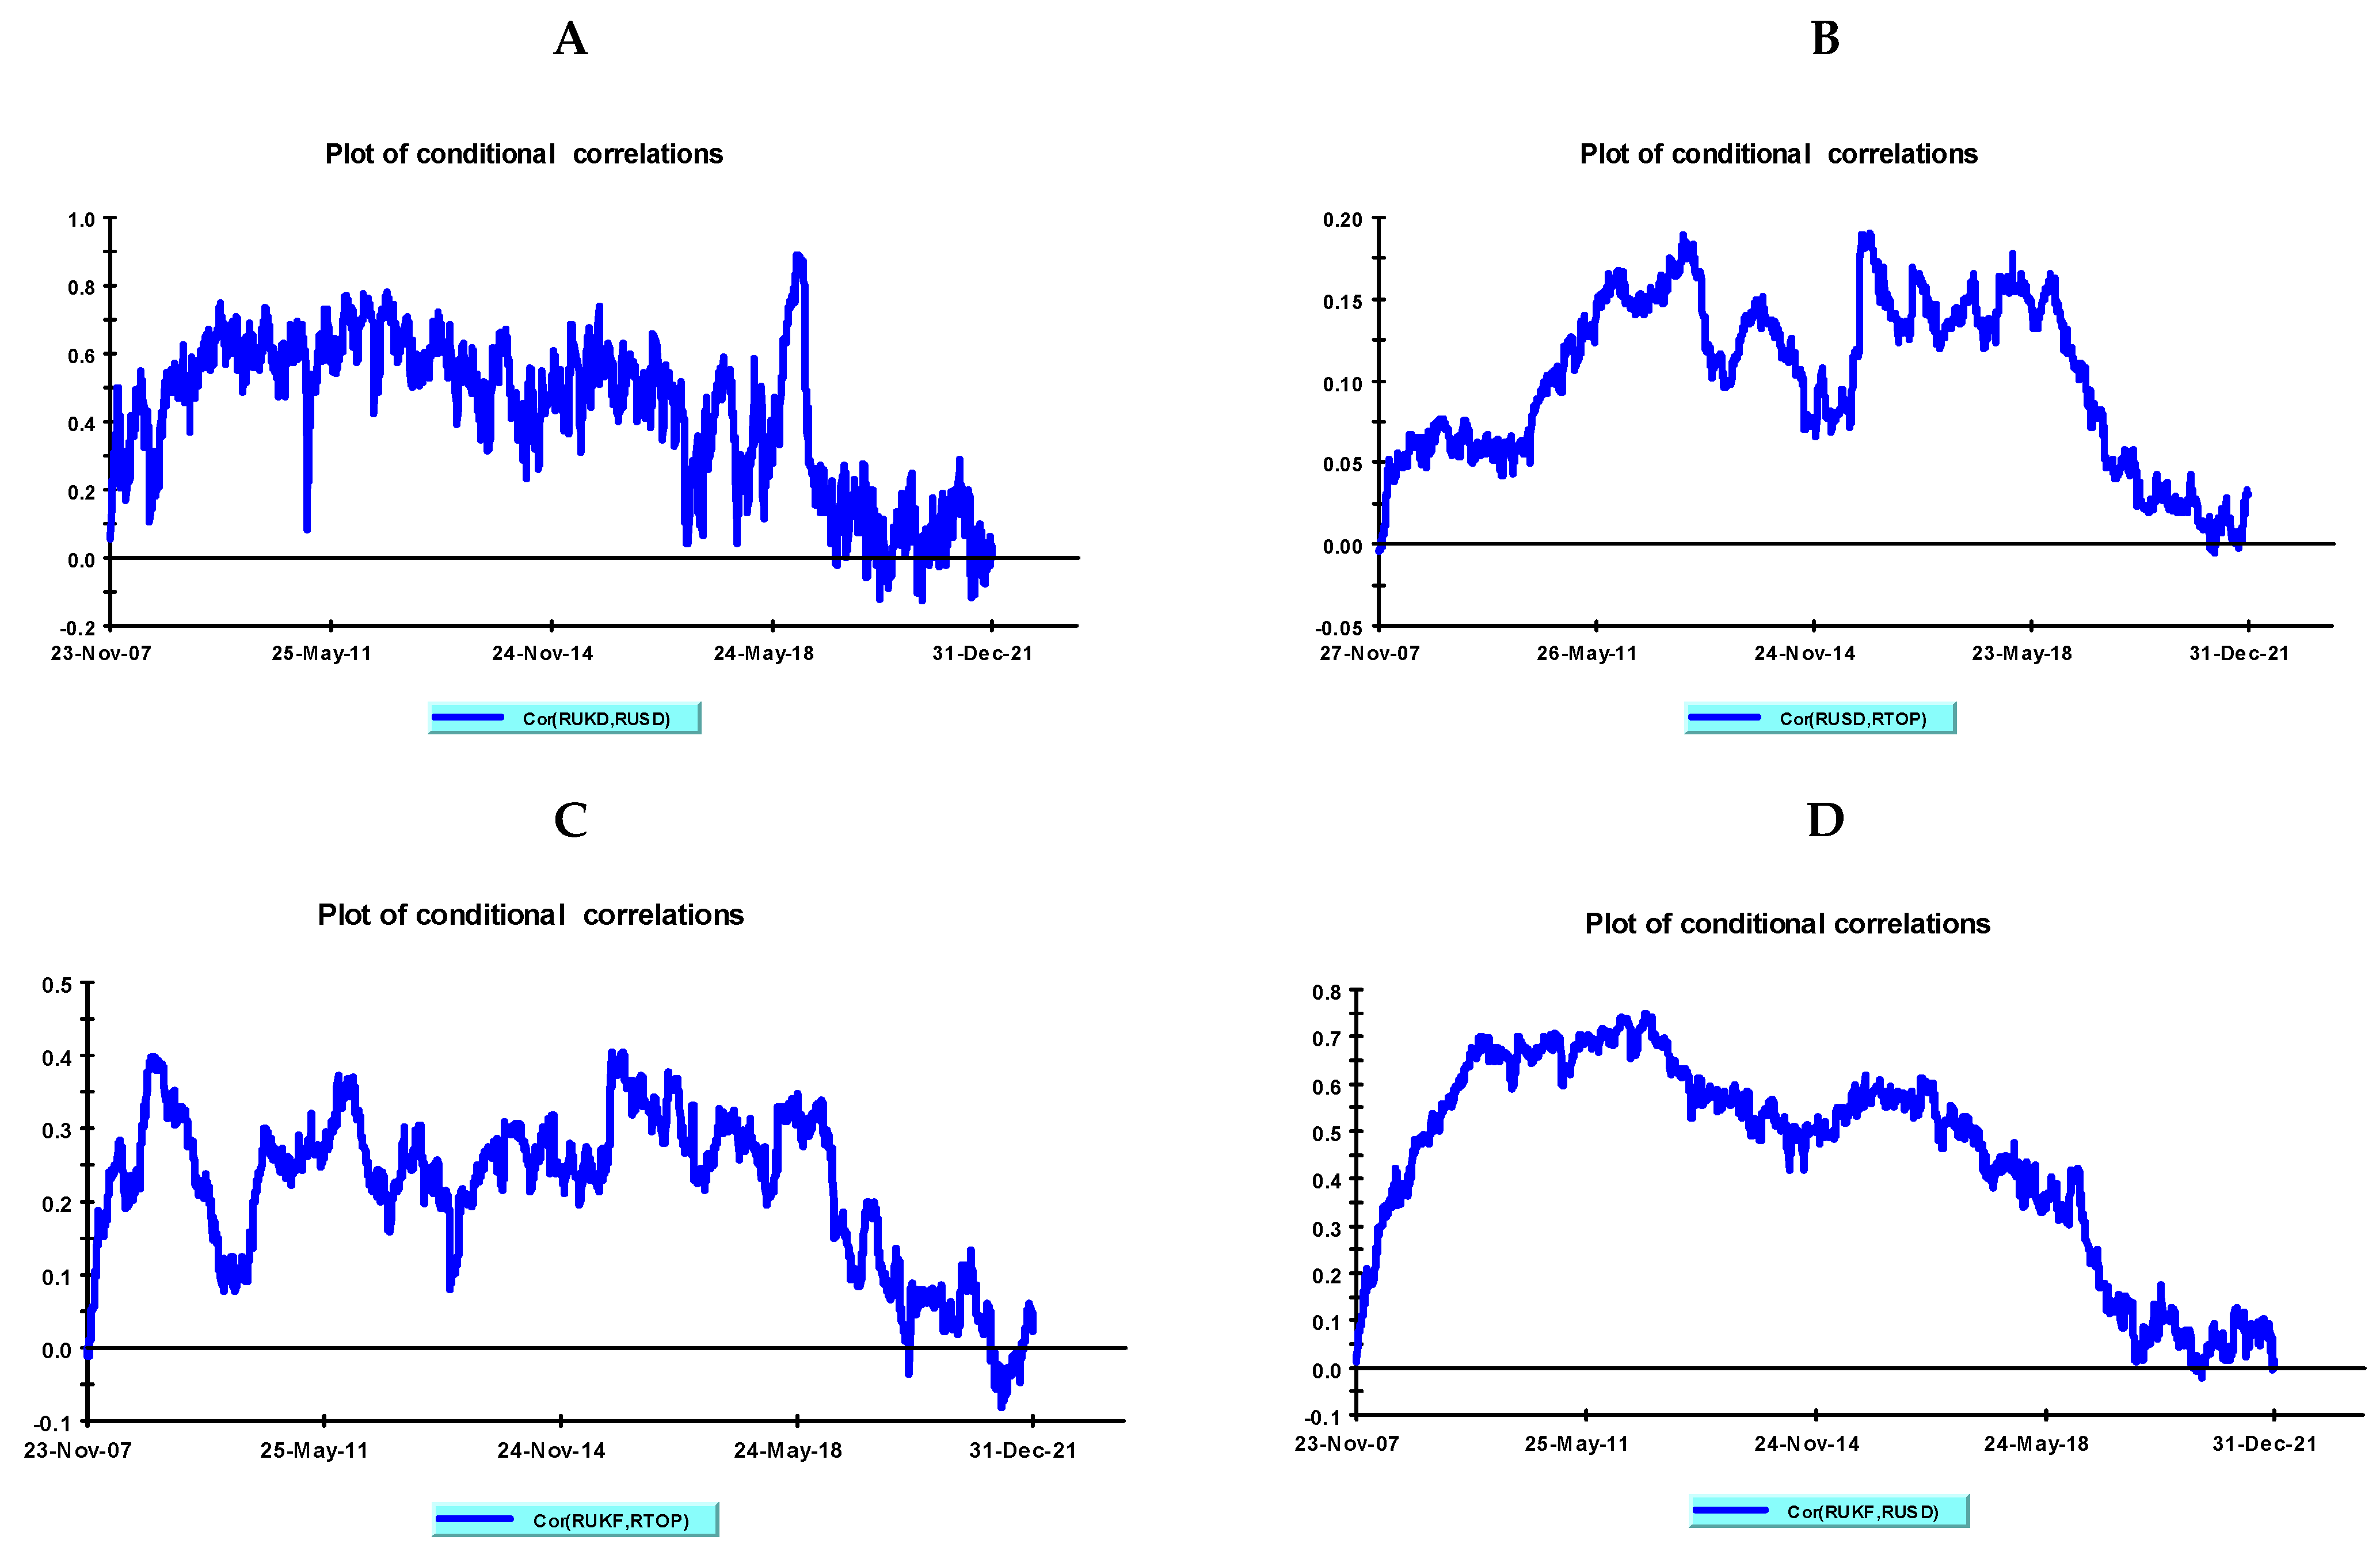
Table 2 presents the results of the descriptive statistics for the return series. Four of the series have direct positive returns, while two have negative average returns. The highest and lowest mean returns for developed markets are found in the U.S. index, with a value of 0.0163, and the Japan index for both the Shariah and traditional stock index; meanwhile, for developing markets, China has the lowest return (0.0027). The highest standard deviation (0.6867) is from the UK Shariah index, while the lowest is from Malaysia at 0.3167. The results of Table 2 indicate that the distribution of all indices is negatively skewed except the UK Shariah index, which expresses that stock price distributions are not symmetric, thus leading to relatively higher volatility and risk. Shariah and traditional stock market indices are leptokurtic (peaked) of the price distribution. In both situations, prices are not normally distributed and consequently, there exists price variability.

4.2. MGARCH-DCC

Table 3 and Table 4 show the results obtained from Student’s t-distribution test. It depicts the maximum-likelihood estimates for both Shariah and traditional stock returns in developed and developing states. The maximum likelihood obtained is 63,057.5, which is within the acceptable region. In addition, the level of freedom for the t-distribution is 6.653, which is less than the 30-point mark. This makes it a suitable model for capturing and indicating the fat-tailed nature of the normal distribution of stock returns (Najeeb et al. 2015).
Figure 2 shows the conditional volatility between Shariah and traditional stock returns for developing markets represented in four regions (A–D). In Figure 2 of region A, which plots RMKLC and RJAKI, the results show that both markets moved in the same direction during both crises (GFC and COVID-19 pandemic). The former experienced sharper spikes during the crisis period compared to the latter. This makes it more volatile and riskier compared to the latter. This is because the RMKCL market has more international exposure compared to RJAKI. Shock emanating from international markets affected it more than it did RJAKI. This result is consistent with the findings in the literature which show that Shariah-compliant stocks fared better compared to their conventional counterpart during the crisis (Mirza et al. 2022; Dewandaru et al. 2014b; Jawadi et al. 2014). In both markets, volatility tends to decrease after a crisis has subsided, an indication that investors have started feeling confident about the markets. Region B plots RMKLC and FTCI, which are also similar to the plots in region A. The only difference is that the latter has less volatility in relation to the former. Although COVID-19 originated in China, the Chinese Shariah index did not exhibit much volatility compared to other Shariah markets in the region. Both markets witnessed spiked volatility during the crisis; however, they exhibited stable volatility after the crisis subsided. Region C shows the results of MKLC and of INDX. Both markets moved in a similar fashion during both crises. The Malaysian conventional index had the highest volatility among all the indices analyzed during the crises, making it have less of a diversification opportunity for investors desiring to invest in the market. Finally, region D shows the volatility between Malaysia and China’s conventional indices, where the former exhibited higher volatility than the former. In fact, the volatility in the former was stable and lesser. This makes it preferable to investors seeking diversification opportunities. Figure 3 compares the conditional correlations between Shariah-compliant and traditional stock returns for developing markets. Region A shows the plots of Malaysia’s and Indonesia’s Shariah indices. Region B shows the plots for the Malaysia and China Shariah index, and region C shows the plots for the Jakarta Shariah and Malaysia conventional indices. The indices of Figure 2 show that both indices move in a similar fashion. The figure also suggests that in both markets, the correlations among them decline and reach −0.18 for all in the first two regions. In region C, the plots show that Malaysia’s and Indonesia’s conventional indices have the most intense correlation, reaching almost −0.2. Interestingly, region D exhibits a negative conditional correlation, especially from the start of the GFC up to year 2008, peaking at −0.068 in mid-2008 and later recording a slight positive correlation from 2009 to 2016.
Figure 4 shows the conditional volatility between Shariah and traditional stock returns for developed markets. Region A shows both conditional correlations for Shariah index for the U.S. and UK. The UK index exhibits the highest volatility compared to that of the U.S., even before the outbreak of the pandemic. Although the GFC period also shows a rise in volatility among both indices, they moved in a similar fashion prior to and during the pandemic period. Region B shows the plots of Japan’s non-Shariah index and the U.S.’s Shariah index. Both indices experienced spikes in returns of a similar magnitude during the GFC, while the U.S. Shariah index experienced higher volatility than the Japan indices. However, as the crisis subsided after the pandemic, the volatility of the U.S. index became less intense compared to that of Japan. Region C plots the results of the UK and Japan conventional indices. During the GFC, both indices witnessed increased volatility of a similar power, with the Japan index moving a bit higher than the UK index. Interestingly, in mid-2011, the role was reversed, and Japanese index exhibited a high spark, an indication of the onset of the tsunami earthquake. This makes the UK index far better than the Japanese index. However, as the pandemic struck, the volatility of the UK index surpassed that of the Japanese index. Region D plots the U.S. Shariah and the UK conventional indices. In both crisis periods, the indices experienced high volatility, with the U.S. Shariah index experiencing the highest volatility compared to the UK conventional index. The volatility of the U.S. Shariah index reached almost 3.0 in comparison to 2.2 for the UK index.
Figure 5 shows a conditional correlation between the Shariah and traditional stock returns for developed markets. Region A through to region D of Figure 5 represents markets for the Japan, U.S., and UK Shariah and non-compliant stock returns, respectively. Both plots show a negative correlation among them, with the B and D region having higher correlations of about −0.02 and −0.01, respectively. On the contrary, region A and region C of the same figure depict a lower conditional correlation of around −0.2, an indication of more diversification opportunities among these markets compared to the earlier mentioned regions. This suggests that better possibilities of diversification are more present in the Japan and UK conventional markets and the U.S. Shariah market. The lower correlation between the U.S. and Japanese stock markets indicates that both markets have shown performances that are from each other. Market heterogeneity offers better diversification benefits. Moreover, capital flow from different regions might offer better opportunities than the same region. This is because of similar paths of risk–return profiles (Donadelli and Paradiso 2014; Hasan et al. 2021).
Figure 6 presents the local variance intensity of a single asset for the developed markets using color-coded images for a particular period. The horizontal axis depicts the time scale, while the vertical axis exhibits the frequency scale. The upper bound (e.g., 2–4 days) of the images indicates the higher scale and the lower bound (e.g., 64–1024 days) expresses the lower frequency. The color code from blue to red indicates low to high intensity. The white thick contour confirms the 5% significant level. The empirical evidence exhibits significant and higher volatility during the COVID-19 pandemic rather than the GFC.
Figure 7 exhibits the local variance intensity of a single asset for developing economies using color-coded images for a particular period. The results show that the Chinses and Malaysian Shariah-based markets experienced less volatility during the COVID-19 pandemic period.
Figure 8 presents the wavelet-coherence results between the Shariah and traditional stock markets for the developed countries. The red regions show a higher correlation, and the blue zones indicate weaker integration between the two markets. The results indicate that the Japanese Shariah-based market offered better portfolio opportunities for U.S. traders during the GFC and the COVID-19 pandemic period, which is in line with the results of the MGARCH-DCC method. The black arrow indicates the lead–lag relationship between the two series. The right-pointing-upwards arrow () and left-pointing-downwards arrow () indicate that the first variable is in the leading positions (e.g., U.S. Shariah index leading on the UK and Japanese Shariah and traditional stock indices), while the left-pointing-upwards arrow () and the right-pointing-downwards arrow () indicate that the second variable or series is in the leading position (Shaik et al. 2023).
Figure 9 exhibits the wavelet-coherence results between the Shariah and traditional stock markets for developing countries. The results indicate that the Chinese Shariah and traditional markets offered better portfolio opportunities for U.S. traders during the GFC and the COVID-19 pandemic period, which is in line with the results of the MGARCH-DCC method. However, developing countries, such as Malaysia and Indonesia, offer more diversification opportunities overall for investments to U.S. investors. This might be due to the fact they have multiple Islamic asset classes that can meet the demand of different investors’ tastes. The availability of these investable assets makes these markets more competitive and attracts investors from around the globe, thereby increasing the depth and breadth of the market. This also increases the liquidity of the market. As such, investors who are intending to invest in the U.S. have a good chance of benefiting from capital gains when investing in these markets. Overall, this study provides significant insights for policymakers, financial portfolio managers, and investors when making investment decision strategies during crisis periods, such as the GFC and the COVID-19 pandemic. Particularly, as crises are hard to predict, policymakers are advised to be more proactive in taking corrective measures against crises. During the recent COVID-19 pandemic, policymakers could take protective measures in order to contain the crisis. Measure such as extending lockdown, increasing access to health care, providing affordable or free medical care to the old and less privileged, and providing cash handouts or free foodstuffs, especially to those in remote areas, can go a long way in limiting the severity of the crisis. On the monetary policy front, policymakers can liberalize monetary policy by making more funds available to the business sector to boost market trends and maintain investors’ confidence to avoid panic selling of assets in the financial market, which will have a negative impact on the economy as a whole.

5. Conclusions

This study examines the relationship between developing countries’ (Malaysia, Indonesia, and China) and developed countries’ (U.S., UK, and Japan) Shariah and traditional stock market returns. It used daily data for both Shariah-compliant and non-Shariah-compliant stocks index returns from 29 October 2007 to 31 December 2021. The study used multivariate GARCH-DCC, the wavelet power spectrum, and coherence transform techniques to study the extent to which these markets move together. From the volatility findings obtained from MGARCH-DCC, it is shown that although the developing markets’ stock returns experienced high volatility of a similar degree, the conventional indices of Malaysia had the highest volatility among them. This shows that Shariah indices have lesser exposure to risk and higher possibilities of diversification compared to their conventional counterpart. Furthermore, the MGARCH-DCC conditional correlation results show that minimal diversification opportunities exist for investors in the conventional Malaysia and Indonesia markets. The conditional volatility findings for developed Shariah markets show that the Japanese conventional index and the Shariah indices are more volatile compared to other indices in the market. Regarding the conditional correlation of the developed markets, Japan’s conventional index, the UK’s conventional index, and the U.S.’s Shariah indices offer better possibilities for investments as evidenced by their low correlations. Moreover, the results of the wavelet power spectrum show that volatility was higher during the COVID-19 pandemic than during the GFC. However, the Chinese and Malaysian Shariah-based markets experienced lesser volatility during the COVID-19 pandemic period. On the other hand, the wavelet-coherence transform results indicate that the Japanese Shariah-based market offered better portfolio opportunities for U.S. traders during the GFC and the COVID-19 pandemic period, which is in line with the results of the MGARCH-DCC method. However, in the context of developing countries, Chinese Shariah and traditional markets offer better portfolio opportunities for U.S.-based investors during crisis periods. The results obtained from the present research have implications for multiple stakeholders who desire to invest in the selected markets and policymakers alike. For the former, investing in any of these markets yields little diversification opportunities for them. Therefore, it is worthwhile for them to scrutinize these markets when making investment decisions. Including them solely in their portfolio will not yield much return except for the U.S. and Japanese markets, which offer minimal diversification opportunities for them. Therefore, policymakers need to formulate strategies that will increase the possibilities for investors to gain from investing outside the shores of their countries. Future research can add more indices from different asset classes, such as oil, gold, Sukuk, and bonds. Furthermore, researchers may investigate connectedness and volatility spillover using more advanced econometric methods.

Author Contributions

Conceptualization, M.I.T. and M.S.; methodology, F.M.A. and B.H.; software, D.K.T.; validation, B.H., M.S. and D.K.T.; formal analysis, F.M.A.; investigation, M.I.T.; resources, M.S.; data curation, B.H.; writing—original draft preparation, M.I.T. and M.S.; writing—review and editing, M.I.T., F.M.A. and M.S.; visualization, D.K.T.; supervision, M.I.T.; project administration, M.I.T. and F.M.A.; funding acquisition, D.K.T. All authors have read and agreed to the published version of the manuscript.

Funding

This research was partly funded by the University of Economics Ho Chi Minh City, Vietnam (UEH), grant no IBR_RF328.

Institutional Review Board Statement

Not applicable.

Informed Consent Statement

Not applicable.

Data Availability Statement

The data that support the findings of this study are available from the corresponding author upon reasonable request.

Acknowledgments

This research was partly funded by the University of Economics Ho Chi Minh City, Vietnam (UEH).

Conflicts of Interest

The authors declare no conflict of interest.

References

  1. Aarif, Md Bokhtiar Hasan, Muhammad Rafiqul Islam Rafiq, and Abu N. M. Wahid. 2021. Do ‘Shariah’indices surpass conventional indices? A study on Dhaka Stock Exchange. International Journal of Islamic and Middle Eastern Finance and Management 14: 94–113. [Google Scholar] [CrossRef]
  2. Abbes, Mouna Boujelbene, and Yousra Trichilli. 2015. Islamic stock markets and potential diversification benefits. Borsa Istanbul Review 15: 93–105. [Google Scholar] [CrossRef]
  3. Ali, Fahad, Yuexiang Jiang, and Ahmet Sensoy. 2021. Downside risk in Dow Jones Islamic equity indices: Precious metals and portfolio diversification before and after the COVID-19 bear market. Research in International Business and Finance 58: 101502. [Google Scholar] [CrossRef]
  4. Al-Yahyaee, Khamis Hamed, Walid Mensi, Mobeen Ur Rehman, Xuan Vinh Vo, and Sang Hoon Kang. 2020. Do Islamic stocks outperform conventional stock sectors during normal and crisis periods? Extreme co-movements and portfolio management analysis. Pacific-Basin Finance Journal 62: 101385. [Google Scholar]
  5. Antar, Monia, and Fatma Alahouel. 2019. Co-movements and diversification opportunities among Dow Jones Islamic indexes. International Journal of Islamic and Middle Eastern Finance and Management 13: 94–115. [Google Scholar] [CrossRef]
  6. Asl, Mahdi Ghaemi, Giorgio Canarella, and Stephen M. Miller. 2021. Dynamic asymmetric optimal portfolio allocation between energy stocks and energy commodities: Evidence from clean energy and oil and gas companies. Resources Policy 71: 101982. [Google Scholar] [CrossRef]
  7. Ben Rejeb, Aymen, and Mongi Arfaoui. 2019. Do Islamic stock indexes outperform conventional stock indexes? A state space modeling approach. European Journal of Management and Business Economics 28: 301–22. [Google Scholar] [CrossRef]
  8. Bollerslev, Tim. 1990. Modelling the coherence in short-run nominal exchange rates: A multivariate generalized ARCH model. The Review of Economics and Statistics 72: 498–505. [Google Scholar] [CrossRef]
  9. Borio, Claudio. 2020. The COVID-19 economic crisis: Dangerously unique. Business Economics 55: 181–90. [Google Scholar] [CrossRef]
  10. Chang, Matthew C., Jui-Cheng Hung, and Chien-Chung Nieh. 2011. Reexamination of capital asset pricing model (CAPM): An application of quantile regression. African Journal of Business Management 5: 12684–90. [Google Scholar]
  11. Dewandaru, Ginanjar, Syed Aun R. Rizvi, Kabir Sarkar, Obiyathulla Bacha, and Mansur Masih. 2014a. How Do Macroeconomic Changes Impact Islamic and Conventional Equity Prices? Evidence from Developed and Emerging Countries. Munich Personal RePEc Archive (MPRA), Paper No 59587. Available online: https://mpra.ub.uni-muenchen.de/59587/ (accessed on 2 December 2022).
  12. Dewandaru, Ginanjar, Syed Aun R. Rizvi, Rumi Masih, Mansur Masih, and Syed Othman Alhabshi. 2014b. Stock market co-movements: Islamic versus conventional equity indices with multi-timescales analysis. Economic Systems 38: 553–71. [Google Scholar] [CrossRef]
  13. Donadelli, Michael, and Antonio Paradiso. 2014. Is there heterogeneity in financial integration dynamics? Evidence from country and industry emerging market equity indexes. Journal of International Financial Markets, Institutions and Money 32: 184–218. [Google Scholar] [CrossRef]
  14. Dritsaki, Chaido. 2017. An empirical evaluation in GARCH volatility modeling: Evidence from the Stockholm stock exchange. Journal of Mathematical Finance 7: 366–90. [Google Scholar] [CrossRef]
  15. El-Alaoui, AbdelKader Ouatik, Obiyathulla Ismath Bacha, Mansur Masih, and Mehmet Asutay. 2018. Does low leverage minimise the impact of financial shocks? New optimisation strategies using Islamic stock screening for European portfolios. Journal of International Financial Markets, Institutions and Money 57: 160–84. [Google Scholar] [CrossRef]
  16. Erdoğan, Seyfettin, Ayfer Gedikli, and Emrah İsmail Çevik. 2020. The effects of the covid-19 pandemic on conventional and Islamic stock markets in Turkey. Bilimname 42: 89–110. [Google Scholar] [CrossRef]
  17. Garcia-Jorcano, Laura, and Sonia Benito. 2020. Studying the properties of the Bitcoin as a diversifying and hedging asset through a copula analysis: Constant and time-varying. Research in International Business and Finance 54: 101300. [Google Scholar] [CrossRef]
  18. Hammoudeh, Shawkat, Walid Mensi, Juan Carlos Reboredo, and Duc Khuong Nguyen. 2014. Dynamic dependence of global Islamic stock index with global conventional indexes and risk factors. Pacific-Basin Finance Journal 30: 189–206. [Google Scholar] [CrossRef]
  19. Hasan, Md Bokhtiar, M. Kabir Hassan, Md Mamunur Rashid, and Yasser Alhenawi. 2021. Are safe haven assets really safe during the 2008 global financial crisis and COVID-19 pandemic? Global Finance Journal 50: 100668. [Google Scholar] [CrossRef]
  20. IFDI. 2022. Embracing Change. Available online: https://icd-ps.org/uploads/files/ICD%20Refinitiv%20ifdi-report-20221669878247_1582.pdf (accessed on 18 December 2022).
  21. IMF. 2020. COVID-19 Crisis Poses Threat to Financial Stability. Available online: https://www.imf.org/en/Blogs/Articles/2020/04/14/blog-gfsr-covid-19-crisis-poses-threat-to-financial-stability (accessed on 11 December 2022).
  22. Ismaila, Abd Ghafar, and Mohd Saharudin Shakranib. 2003. The conditional CAPM and cross-sectional evidence of return and beta for Islamic unit trusts in Malaysia. IIUM Journal of Economics and Management 11: 1–31. [Google Scholar]
  23. Jabeen, Munazza, and Saba Kausar. 2022. Performance comparison between Islamic and conventional stocks: Evidence from Pakistan’s equity market. ISRA International Journal of Islamic Finance 14: 59–72. [Google Scholar] [CrossRef]
  24. Jawadi, Fredj, Nabila Jawadi, and Wael Louhichi. 2014. Conventional and Islamic stock price performance: An empirical investigation. International Economics 137: 73–87. [Google Scholar] [CrossRef]
  25. Johnson, Robert, and Luc Soenen. 2003. Economic integration and stock market comovement in the Americas. Journal of Multinational Financial Management 13: 85–100. [Google Scholar] [CrossRef]
  26. Karamti, Chiraz, and Olfa Belhassine. 2022. COVID-19 pandemic waves and global financial markets: Evidence from wavelet coherence analysis. Finance Research Letters 45: 102136. [Google Scholar] [CrossRef] [PubMed]
  27. Khan, Faisal, and Sharifullah Jan. 2022. Portfolio Diversification Across Islamic Vs. Conventional Banks: The Role of Macroeconomic Fundamentals in Stock Volatility. Journal of Islamic Business and Management 12: 218–39. [Google Scholar] [CrossRef]
  28. Ku, Yuan-Hung Hsu. 2008. Student-t distribution based VAR-MGARCH: An application of the DCC model on international portfolio risk management. Applied Economics 40: 1685–97. [Google Scholar] [CrossRef]
  29. Lintner, John. 1965. Security prices, risk, and maximal gains from diversification. The Journal of Finance 20: 587–615. [Google Scholar]
  30. Longin, Francois, and Bruno Solnik. 2001. Extreme correlation of international equity markets. The Journal of Finance 56: 649–76. [Google Scholar] [CrossRef]
  31. Majdoub, Jihed, and Salim Ben Sassi. 2017. Volatility spillover and hedging effectiveness among China and emerging Asian Islamic equity indexes. Emerging Markets Review 31: 16–31. [Google Scholar] [CrossRef]
  32. Mantegna, Rosario N. 1999. Information and hierarchical structure in financial markets. Computer Physics Communications 121: 153–56. [Google Scholar] [CrossRef]
  33. Mantegna, Rosario N., and H. Eugene Stanley. 1997. Econophysics: Scaling and its breakdown in finance. Journal of Statistical Physics 89: 469–79. [Google Scholar] [CrossRef]
  34. Mensi, Walid, Mobeen Ur Rehman, Debasish Maitra, Khamis Hamed Al-Yahyaee, and Ahmet Sensoy. 2020. Does bitcoin co-move and share risk with Sukuk and world and regional Islamic stock markets? Evidence using a time-frequency approach. Research in International Business and Finance 53: 101230. [Google Scholar] [CrossRef]
  35. Mirza, Nawazish, Syed Kumail Abbas Rizvi, Irum Saba, Bushra Naqvi, and Larisa Yarovaya. 2022. The resilience of Islamic equity funds during COVID-19: Evidence from risk adjusted performance, investment styles and volatility timing. International Review of Economics & Finance 77: 276–95. [Google Scholar]
  36. Münnix, Michael C., Takashi Shimada, Rudi Schäfer, Francois Leyvraz, Thomas H. Seligman, Thomas Guhr, and H. Eugene Stanley. 2012. Identifying states of a financial market. Scientific Reports 2: 1–6. [Google Scholar] [CrossRef]
  37. Najeeb, Syed Faiq, Obiyathulla Bacha, and Mansur Masih. 2015. Does heterogeneity in investment horizons affect portfolio diversification? Some insights using M-GARCH-DCC and wavelet correlation analysis. Emerging Markets Finance and Trade 51: 188–208. [Google Scholar] [CrossRef]
  38. Naz, Syeda Arooj, and Saqib Gulzar. 2022. Impact of Islamic finance on economic growth: An empirical analysis of Muslim countries. The Singapore Economic Review 67: 245–65. [Google Scholar] [CrossRef]
  39. Nguyen, Duc Khuong, Ahmet Sensoy, Ricardo M. Sousa, and Gazi Salah Uddin. 2020. US equity and commodity futures markets: Hedging or financialization? Energy Economics 86: 104660. [Google Scholar] [CrossRef]
  40. Rahim, Adam Mohamed, and Mansur Masih. 2016. Portfolio diversification benefits of Islamic investors with their major trading partners: Evidence from Malaysia based on MGARCH-DCC and wavelet approaches. Economic Modelling 54: 425–38. [Google Scholar] [CrossRef]
  41. Rahman, Mostafizur, Md Azizul Baten, and A. Alam. 2006. An empirical testing of capital asset pricing model in Bangladesh. Journal of Applied Sciences 6: 662–67. [Google Scholar] [CrossRef]
  42. Rana, Md Ejaz, and Waheed Akhter. 2015. Performance of Islamic and conventional stock indices: Empirical evidence from an emerging economy. Financial Innovation 1: 1–17. [Google Scholar] [CrossRef]
  43. Rhaiem, N., S. Ben Ammou, and A. Ben Mabrouk. 2007. Estimation of capital asset pricing model at different time scales application to French stock market. The International Journal of Applied Economics and Finance 1: 79–87. [Google Scholar]
  44. Rossi, Matteo. 2016. The capital asset pricing model: A critical literature review. Global Business and Economics Review 18: 604–17. [Google Scholar] [CrossRef]
  45. Saiti, Buerhan, Obiyathulla I. Bacha, and Mansur Masih. 2014. The diversifica-tion benefits from Islamic investment during the financial turmoil: The case for the US-based equity investors. Borsa Istanbul Review 14: 196–211. [Google Scholar] [CrossRef]
  46. Shahzad, Syed Jawad Hussain, and Nader Naifar. 2022. Dependence dynamics of Islamic and conventional equity sectors: What do we learn from the decoupling hypothesis and COVID-19 pandemic? The North American Journal of Economics and Finance 59: 101635. [Google Scholar] [CrossRef]
  47. Shahzad, Syed Jawad Hussain, Román Ferrer, Laura Ballester, and Zaghum Umar. 2017. Risk transmission between Islamic and conventional stock markets: A return and volatility spillover analysis. International Review of Financial Analysis 52: 9–26. [Google Scholar] [CrossRef]
  48. Shaik, Muneer, Syed Ahsan Jamil, Iqbal Thonse Hawaldar, Mohammad Sahabuddin, Mustafa Raza Rabbani, and Mohd Atif. 2023. Impact of geo-political risk on stocks, oil, and gold returns during GFC, COVID-19, and Russian–Ukraine War. Cogent Economics & Finance 11: 2190213. [Google Scholar]
  49. Sharpe, William F. 1964. Capital asset prices: A theory of market equilibrium under conditions of risk. The Journal of Finance 19: 425–42. [Google Scholar]
  50. Suryadi, Suryadi, Endri Endri, and Mukhamad Yasid. 2021. Risk and return of islamic and conventional indices on the Indonesia Stock Exchange. The Journal of Asian Finance, Economics and Business 8: 23–30. [Google Scholar]
  51. Tuna, Vedat Ender, Gülfen Tuna, and Nurcan Kostak. 2021. The effect of oil market shocks on the stock markets: Time-varying asymmetric causal relationship for conventional and Islamic stock markets. Energy Reports 7: 2759–774. [Google Scholar] [CrossRef]
  52. Weron, Aleksander, and Rafał Weron. 2000. Fractal market hypothesis and two power-laws. Chaos, Solitons & Fractals 11: 289–96. [Google Scholar]
Figure 1. Shariah and traditional stock indices’ return movement.
Economies 11 00149 g001
Figure 2. Plots of volatilities for developing Shariah and traditional stock market returns. (AD) show the conditional volatility between Shariah and traditional stock returns for developing markets.
Economies 11 00149 g002
Figure 3. Plots of conditional correlations for developing Shariah and traditional stock market returns. (AD) show the conditional correlations between Shariah and traditional stock returns for developing markets.
Economies 11 00149 g003
Figure 4. Plots of volatilities for developed traditional stock market returns. (AD) show the conditional volatility between Shariah and traditional stock returns for developed markets.
Economies 11 00149 g004
Figure 5. Plots of conditional correlations for developed Shariah and traditional stock market returns. (AD) show the conditional correlations between Shariah and traditional stock returns for developed markets.
Economies 11 00149 g005
Figure 6. WPS for the developed economies between the Shariah and traditional markets.
Economies 11 00149 g006aEconomies 11 00149 g006b
Figure 7. WPS for the developing economies between the Shariah and traditional markets.
Economies 11 00149 g007aEconomies 11 00149 g007b
Figure 8. WCT for the developed economies between the Shariah and traditional markets.
Economies 11 00149 g008
Figure 9. WCT for the developing economies between the Shariah and traditional markets.
Economies 11 00149 g009aEconomies 11 00149 g009b
Table 1. List of variables.
Country of Origin Shariah-Compliant Stock IndicesTicker Non-Shariah-Compliant Stock IndicesTicker
Developed countries
U.S.Dow Jones Islamic IndexUSDIDow Jones Composite IndexUSDC
UKDow Jones Islamic IndexUKDIFTSE100 Composite IndexUKFC
JapanJapan FTSE Shariah indexJPNITokyo Price Index (TOPIX), JapanTOPX
Developing countries
MalaysiaFTSE Bursa Malaysia Hijarah Shariah indexBMHSFTSE Bursa Malaysia KLCI Composite IndexMKLC
IndonesiaJakarta Islamic IndexJAKIIndonesia Composite IndexINDX
ChinaFTSE Shariah Index, ChinaFTCIShanghai Composite IndexSCHN
Note: Authors’ own calculation.
Table 2. Summary of statistical properties.
Islamic Stock MarketsConventional Stock Markets
MeanSDSkewKurtJBMeanSDSkewKurtJB
Developed countries
U.S.0.01630.5485−0.438316.305927,198.49000.01000.5433−0.477618.139335,197.1500
UK0.01000.68675.2541157.58573,672,098.00000.00110.5197−0.385713.212016,042.2200
Japan0.00320.6006−0.321511.449710,979.36000.00240.5935−0.363810.79329370.7250
Developing countries
Malaysia0.00210.3457−0.841018.286536,175.61000.00140.3167−0.886918.318436,373.2500
Indonesia0.00230.6511−0.406710.75989311.53100.01100.5407−0.554012.627014,363.500
China−0.00270.8745−0.319084.90921,026,277.00000.00780.5943−0.77878.48114966.2480
Table 3. Student’s t-distribution for developed Islamic and conventional markets.
ParameterCountryEstimateT-Ratio
Lambda 1 (λ1)U.S. Islamic0.8792370.5778
UK Islamic0.93639115.1142
Japan Islamic0.9118197.7216
U.S. Conventional0.8818171.3517
UK Conventional0.92103101.7882
Japan Conventional0.9113387.5851
Lambda 2 (λ2)U.S. Islamic0.1086910.1986
UK Islamic0.0538418.2698
Japan Islamic 0.07597310.2299
U.S. Conventional0.1079410.0019
UK Conventional0.0669799.2411
Japan Conventional0.0755789.2759
Delta 1 (δ1) 0.91279120.7646
Delta 2 (δ2) 0.03337314.3188
Degree of Freedom (df) 6.653321.6897
Maximum Log Likelihood 63,057.5
Note: Authors’ own calculation.
Table 4. Student’s t-distribution for developing Islamic and conventional countries.
ParameterCountriesEstimatesT-Ratio
lambda 1 (λ 1)China Islamic0.8950572.8431
Indonesia Islamic0.8908559.8594
Malaysia Islamic0.9104579.0092
China Conventional0.93739112.3559
Indonesia Conventional0.8850154.5649
Malaysia Conventional0.8943857.0745
Lambda 2 (λ 2)China Islamic0.096948.8604
Indonesia Islamic0.083258.0656
Malaysia Islamic0.076558.2102
China Conventional0.057577.856
Indonesia Conventional0.092297.6813
Malaysia Conventional0.086747.2524
Delta 1 (δ1) 0.9221198.38
Delta 2 (δ2) 0.0233411.7945
Degree of Freedom (df) 6.172122.0576
Maximum Log Likelihood 60086.8
Note: Authors’ Own Calculations.
Disclaimer/Publisher’s Note: The statements, opinions and data contained in all publications are solely those of the individual author(s) and contributor(s) and not of MDPI and/or the editor(s). MDPI and/or the editor(s) disclaim responsibility for any injury to people or property resulting from any ideas, methods, instructions or products referred to in the content.

