1. Introduction
One of the most vital responsibilities of policymakers in several countries is to control inflation for promoting two long-run goals: price stability and sustainable economic growth, since inflation connects tightly to the purchasing power of currency within its border and affects its standing on the international markets. Therefore, the foresight of inflation is essential as policy actions to restrain inflation typically take effect only after a long lag.
Several indicators may help predict inflation, which can be roughly classified into three basic groups—commodity prices, and financial and economic variables. The specific prices of commodities such as oil and precious metals might predict inflation because they directly influence the price level of consumer goods. Financial indicators such as exchange rates, interest rates, and money growth might predict inflation since they reflect current or future monetary policy. The economic indicators including unemployment rates and GDP growth might predict inflation since they convey information on excess demand conditions in the economy.
Inflation makes the currency “shelter” in gold and the USD.
Ghosh et al. (
2004) study the relationship between the gold price and the USD exchange rate in the short- and long-term and concluded that gold price increases along with the inflation rate over time, allowing gold to be considered as a hedging tool. When investors are very afraid that the world economy will get worse and the stock market keeps sliding downhill, investors choose to withdraw their investments in stocks and other risky assets and switch to buying gold and holding cash (a lot of which is in USD). Therefore, in a time when people are very risk-averse, gold not only acts as a hedge against currency devaluation but also acts as a hedge in the modern era, since 1971, when the gold standard ended and gold is freely traded. However, to a certain extent, the link between gold and the US dollar still exists: a certain connection for gold has been used as money and a sign of wealth for thousands of years.
Inflation is regarded as one of the biggest effects of currency depreciation. When the domestic currency depreciates, it loses value and purchasing power, and the prices of imported goods and materials increase relative to those that are domestically produced, making import-related goods more expensive. Since import is a part of the consumption basket, measures of inflation based on that basket will also rise in the type of cost–push inflation. However, the evidence on the hedging power of exchange rates for inflation is mixed. Several studies find that exchange rate movements are followed by substantial changes in the price level (
Papell 1994;
Uribe 1997;
Kim 1998;
Umar and Dahalan 2016;
Nasir et al. 2020). Other studies suggest that exchange rate movements have temporary and small effects on price levels (
Saha and Zhang 2013;
Peon and Brindis 2014).
Different from the increase in the US dollar (USD) price, the rise in gold price might cause demand–pull inflation due to its conspicuous property. Gold has also served for centuries as money and has always preserved its purchasing power over long periods of time. Although gold no longer plays an essential role in the world’s monetary system, after the shift from the gold standard to a fiat money system, the price of gold is still considered by many to be a reliable leading indicator of inflation because the price of gold rises when people are afraid that paper money cannot preserve their wealth. According to
Worthington and Pahlavani (
2007), The demand for gold is increasing, not only for jewelry, gold coins, and bars, but also for many industries such as electronics, aerospace, and medical technology. The shreds of evidence regarding the relationship between gold prices and inflation are not consistent in studies. Some find a positive relationship between the gold price and inflation
Garner (
1995);
Ranson and Wainright (
2005);
Levin et al. (
2006);
Worthington and Pahlavani (
2007);
Tkacz (
2007);
Wang et al. (
2011);
Van Hoang et al. (
2016);
Salisu et al. (
2019);
Sui et al. (
2021). Others provide pieces of evidence on the bi-directional relationship between inflation and commodity prices
Jaffe (
1989);
Ghosh et al. (
2004);
Kyrtsou and Labys (
2006);
Worthington and Pahlavani (
2007).
The reasons explained for the mixed empirical evidence might be the differences in economic structure, degrees of openness, and monetary strategy. During the transition from a centrally planned to a market-oriented economy, Vietnam has been facing galloping inflation. The dollarization became severe in the early 1990s when the country was suffering an inflation crisis. At that time, gold and the US dollar were chosen to hold for protecting the value of a property. Since then, any increase in expected inflation might cause people to recall this hard experience and, hence, to collect gold and the US dollar. Indexation is notably seen in real estate values, which are preferred to price in the US dollar or gold. Fluctuations in the values of USD and gold, therefore, have immediate impacts on real estate prices and, thus, might contribute to increased consumer prices.
This article aims at exploring whether gold and the US dollar price movements can, to any degree, lead to movements of future inflation in Vietnam. To the best of my knowledge, this is one of the few studies bringing the asymmetric framework into the examination of the relationship between gold and inflation, as well as the US dollar and inflation. The asymmetric cointegration test and the dynamic MSI-VAR(1) model are employed to examine the asymmetric inflation hedge of gold and the US dollar in both the long-run and short-run. The evidence shows that both gold price and the US dollar not only present their effective hedge in the long-run but also work as leading indicators for future inflation in the short-run. The response of inflation to the shock of gold returns and USD appreciation significantly occurs in the first four months; in other words, the hedging power in the short-run is greater than in the long-run. The asymmetry effect, multiple breaks, and outlier detection in time series allowed in this article are also the main contribution of this empirical study.
The outline of the study is structured as follows.
Section 1 presents a brief studying motivation and purpose.
Section 2 introduces the methodology.
Section 3 provides a description of the data, empirical results, and analysis.
Section 4 offers conclusions.
2. Methodology
The Markov switching (MS) model developed by
Hamilton (
1989) is one of the most important models in econometrics because it allows for both changes in mean and variance, multiple breaks, and time series outlier detection. Following
Krolzig (
2000), the Markov switching vector autoregressive (MSI-VAR(p)) process is developed for exploring the inflation hedge of gold price and the US dollar (USD). The basic switching model can be extended to a dynamic one in the form of lagged endogenous variables and serially correlated errors.
In general, an autoregressive model of order p with M-state Markov-switching intercept (MSI) is as follows:
where
represents the inflation rates at time
t.
is the mean, estimated by the equation
, depending on the regime
at time
t.
are the autoregressive coefficients.
is the error term following
, and
is the variance estimated by the equation
, depending on the regime
at time
t.
Frühwirth-Schnatter (
2006) provides a fine overview of this approach. The most straightforward method to add dynamics to a switching model is to combine lagged endogenous variables. This dynamic MSI-VAR(p) model allows us to not only detect potential regime shifts in the high and low inflation but also investigate the impacts of inflation on the gold price and the US dollar (USD) exchange rate and vice versa. The empirical models are designed as follows:
Model 1: The inflation hedge of the US dollar (USD)
Model 2: The inflation hedge of gold price
where
is the inflation rate at time
t,
is the gold return rate at time
t, and
is USD return rates at time
t.
are the coefficients of the regime means.
is the innovation process accompanied with the parameter shift functions
that represents the variance depending on regime
.
p is the lagged endogenous regressor.
The requirement of first-order Markov assumption is the dependence on the previous state of probability of being in a regime, so that:
These probabilities are presented in a transition matrix of an ergodic M-state Markov process as follows:
where the
-th element stands for the probability of shifting from regime
in period
to regime
in period
. Since the Markov switching (MS) model is also nested with structural breaks, it can be used for detecting sustained breaks.
A major advantage of this dynamic MSI-VAR model is its flexibility in modeling time series subject to regime shifts, and it is generally able to capture the potential of regime shifts in the time-series data of CPI, USD, and gold price without considering structural breaks, to the extent that these variables have experienced several unstable periods and high volatility over the last three decades.
Krolzig (
2000) suggests that considering the regime-switching characteristics of the economic process may provide a better predictive method than the time-varying linear model and traditional robustness methods if there exist permanent breaks.
3. Empirical Results
3.1. Data and Tests
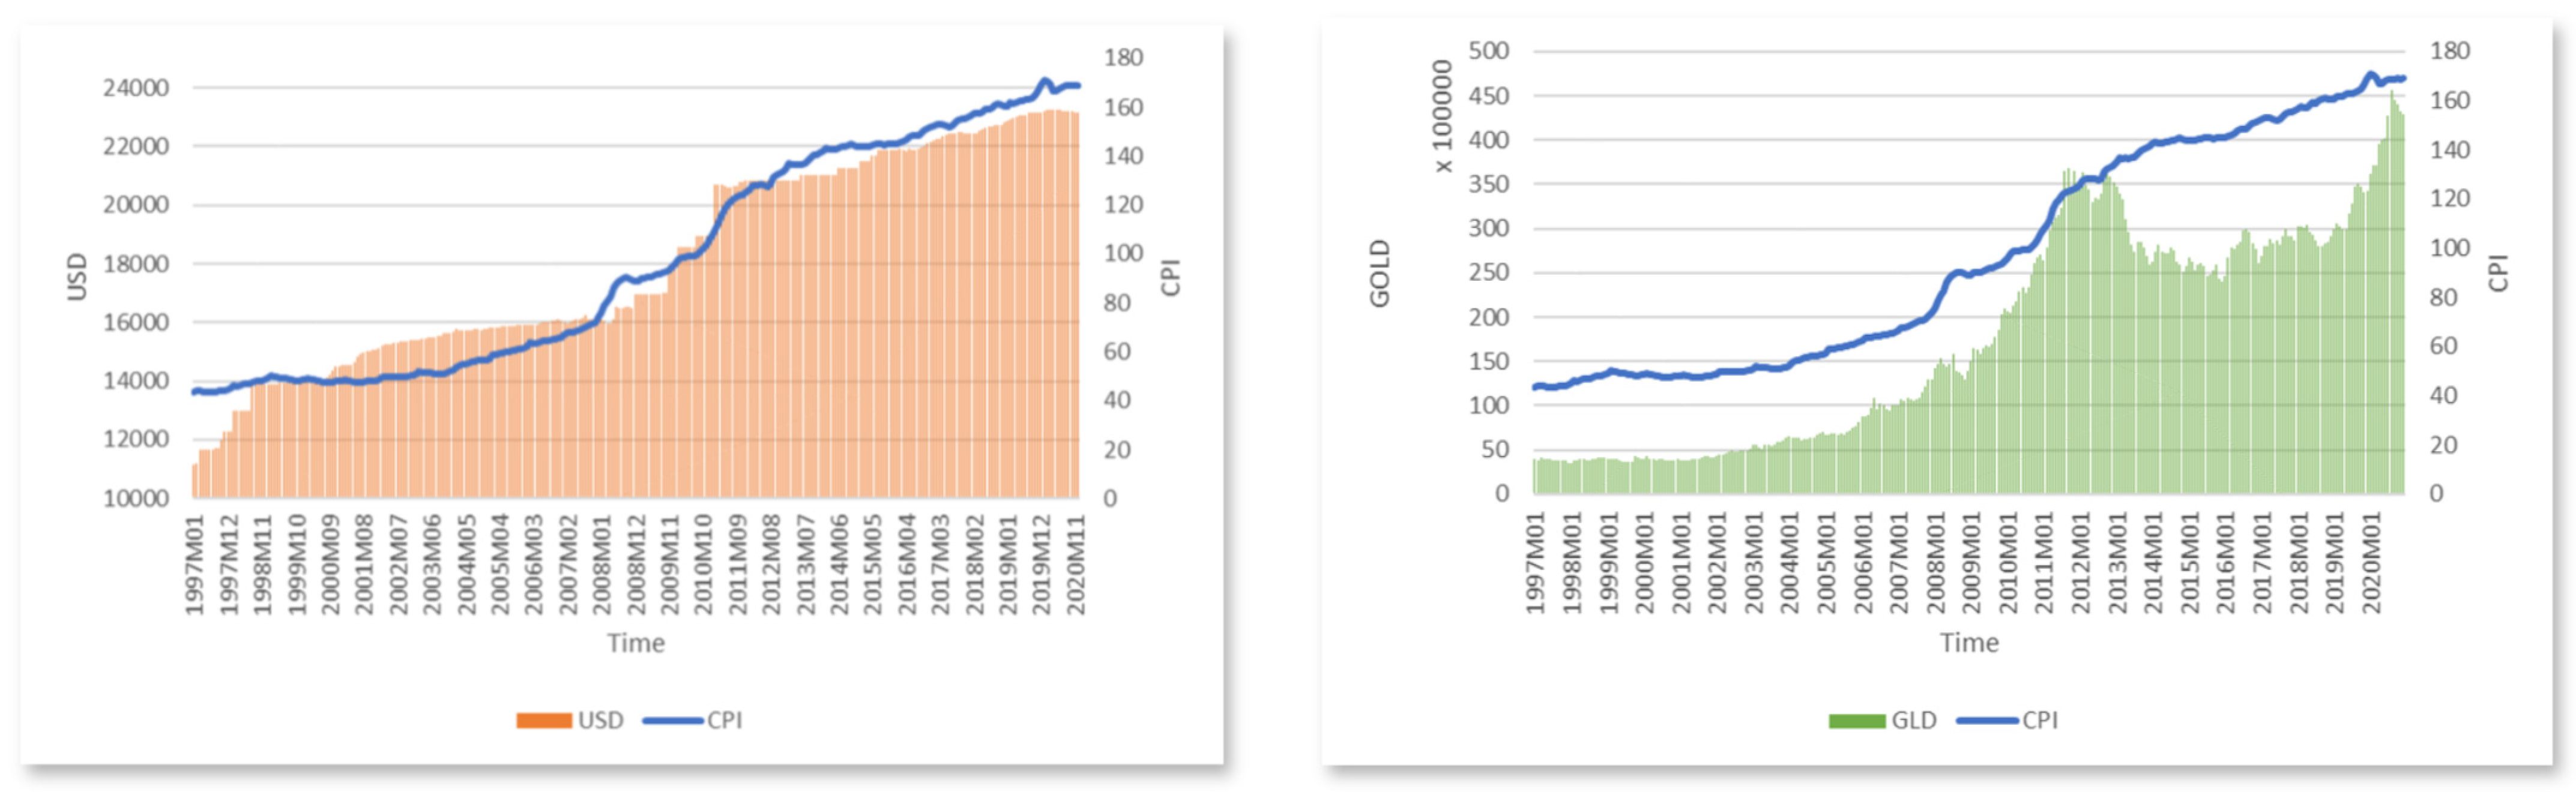
The analysis is based on the monthly data of the consumer price index (CPI), domestic currency per US dollar (USD), and gold price (GLD) for the period from January 1997 to December 2020. The consumer price index (CPI) and the domestic currency per US dollar (USD) are obtained from the international financial statistics (IFS) database of the International Monetary Fund (IMF), and the gold price (GLD) is obtained from the world gold council. Gold is priced in Vietnamese Dong per ounce based on the London pm fix. The sample includes 288 observations which are used for examining the inflation hedging effectiveness of USD and gold investment in Vietnam. When carrying out the test as well as the estimation, all variables are formed in a natural logarithm. The origin time trends and volatility of the three variables are displayed in
Figure 1.
Table 1 reports the descriptive statistics of CPI, USD, and gold prices. The means of these three variables are all positive, indicating their increasing tendency of them during the sample period. After the demise of the Bretton Woods international monetary system in 1971, many countries chose the floating exchange rate policy while others selected to operate under currency pegs. Vietnam followed the second one and has shifted its monetary policy to “managed floats” that allow their local currency to fluctuate within a 3507.33 over time. The skewness and kurtosis show the right-skewed and platykurtic distributions of variables. Furthermore, Jarque–Bera statistics significantly reject the hypothesis of normality for all three variables.
The i.i.d (independent and identically distributed) characteristic of one series does not change after being switched to any linear or nonlinear series. It can be inferred that the reason for rejecting the normality hypothesis could be autocorrelation. As the descriptive statistics of the sample stated in
Table 1, the value shows the high serial correlation and the conditional heteroscedasticity of variables. These characteristics may conceal the nonlinearity of data.
This study mainly utilizes the dynamic MSI-VAR model to examine the inflation–hedging effectiveness of USD and gold investment in Vietnam. The empirical process has proceeded in two steps. First, the unit root test is employed to CPI, USD, and gold prices for identifying their stationarity. It is then followed by the cointegration test for finding the long-run relationship among variables. Second, if the asymmetric cointegrations among variables are clarified, the inflation hedge of USD and gold prices are explored with the dynamic MSI-VAR model.
Nelson and Plosser (
1982) found that the non-stationarity of macroeconomic variables may lead to spurious regression because the hypothesis of stationarity or residual stationarity of regression is not satisfied. Unit root tests are commonly used to verify the integrated order of time series and to decide the level or differential variable for the empirical process. The unit root test results are reported in
Table 2. The stationarity of variables is tested with the Augmented Dickey–Fuller (ADF) and the Phillips–Perron (PP) regressive equation including both intercept and time trend. The optimal lag length is selected according to the Schwartz information criterion (SIC). The test results show that the integration orders of the three variables are I(1) at the level and I(0) at the first difference.
The results of the Engle–Granger test for linear cointegration are reported in
Table 3. According to these results, the relationship between CPI and USD, as well as CPI and gold price, cannot get rid of the long-run time trend.
Table 4 presents the results of asymmetric cointegration with the threshold autoregression (TAR) model proposed by
Enders and Siklos (
2001) for testing the long-run relationship between two couple of variables. The optimal lag lengths are selected by two criteria including SC (Schwarz information criterion), and HQ (Hannan–Quinn information criterion) for which the maximum lag of 15 periods is applied. Both criteria choose the lag as 1 period, which seems reasonable for monthly data to respond to the dynamic hedge of USD and gold price on inflation, conforming to the intuition on economics. Therefore, this study adopts the lag length of 1 to test for cointegration as well as to estimate the model. The results of TAR prove the presence of asymmetric cointegration between CPI and USD, as well as CPI and gold prices. Therefore, the dynamic MSI-VAR(1) model that allows for changes in mean and variance, multiple breaks, and time series outliers detection, is more appropriate for examining the inflation hedge of USD and gold investment.
3.2. Empirical Findings
Table 5 provides the regime-varying results of the MSI-VAR(1) model. The results of Model 1 and Model 2 present the estimated coefficients of the regime mean
δ,
β,
α, and
γ corresponding to endogenous variables. The differences in the regime-specific means correspond to high and low momentum periods where the high momentum period refers to high inflation rates or high return rates and the low momentum period refers to as low inflation rates or low returns.
Model 1 is designed for testing the inflation hedge of the US dollar (USD). Within regime 1, the USD returns in period t − 1 positively influence inflation rates of period t (0.558), while the effects of inflation rates of period t − 1 on both the USD returns and inflation rates of period t are significant and positive. Within regime 2, these interactions between the USD return and inflation rates present almost the same results as those of regime 1. Since the positive returns of the US dollar also mean its appreciation against the Vietnamese Dong (VND) or the depreciation of the Vietnamese Dong (VND) against the US dollar. These results also mean that the higher appreciation of the US dollar against the Vietnamese Dong in the previous month can lead to higher inflation rates in both high and low inflation regimes. It is also found that inflation rates of period t − 1 raise the appreciation of the USD. In other words, the US dollar completely hedges against inflation.
For the inflation hedge of the gold price, the results of Model 2 show that the influences of gold return in period t − 1 on inflation rates and inflation rates in period t − 1 on the gold price are positive and obvious in regime 1, but not significant in regime 2. Meanwhile, the higher inflation rates also lead to higher gold prices in the high return regime of gold. These results reveal that the hedging power of gold price on inflation is effective when inflation rates are high.
In both regimes, the US dollar significantly leads to inflation and vice versa. These bidirectional positive effects show the inflation hedge of the USD is strong and complete. Whereas, the hedging power of the gold price is not complete since it is only obvious in the high inflation regime. Furthermore, the effect of inflation is significant on the USD, disclosing the valid implementation of exchange controls over the US dollar. These findings are somewhat consistent with those of
Ghosh et al. (
2004),
Wang et al. (
2011), and
Sui et al. (
2021).
For testing the model validation, the residuals from the fitted models that provide information on their adequacy are applied and displayed in
Figure 2. It is found that the dynamic MSI-VAR(1) models fitted for the US dollar and gold returns are adequate, as their residuals do not present autocorrelation.
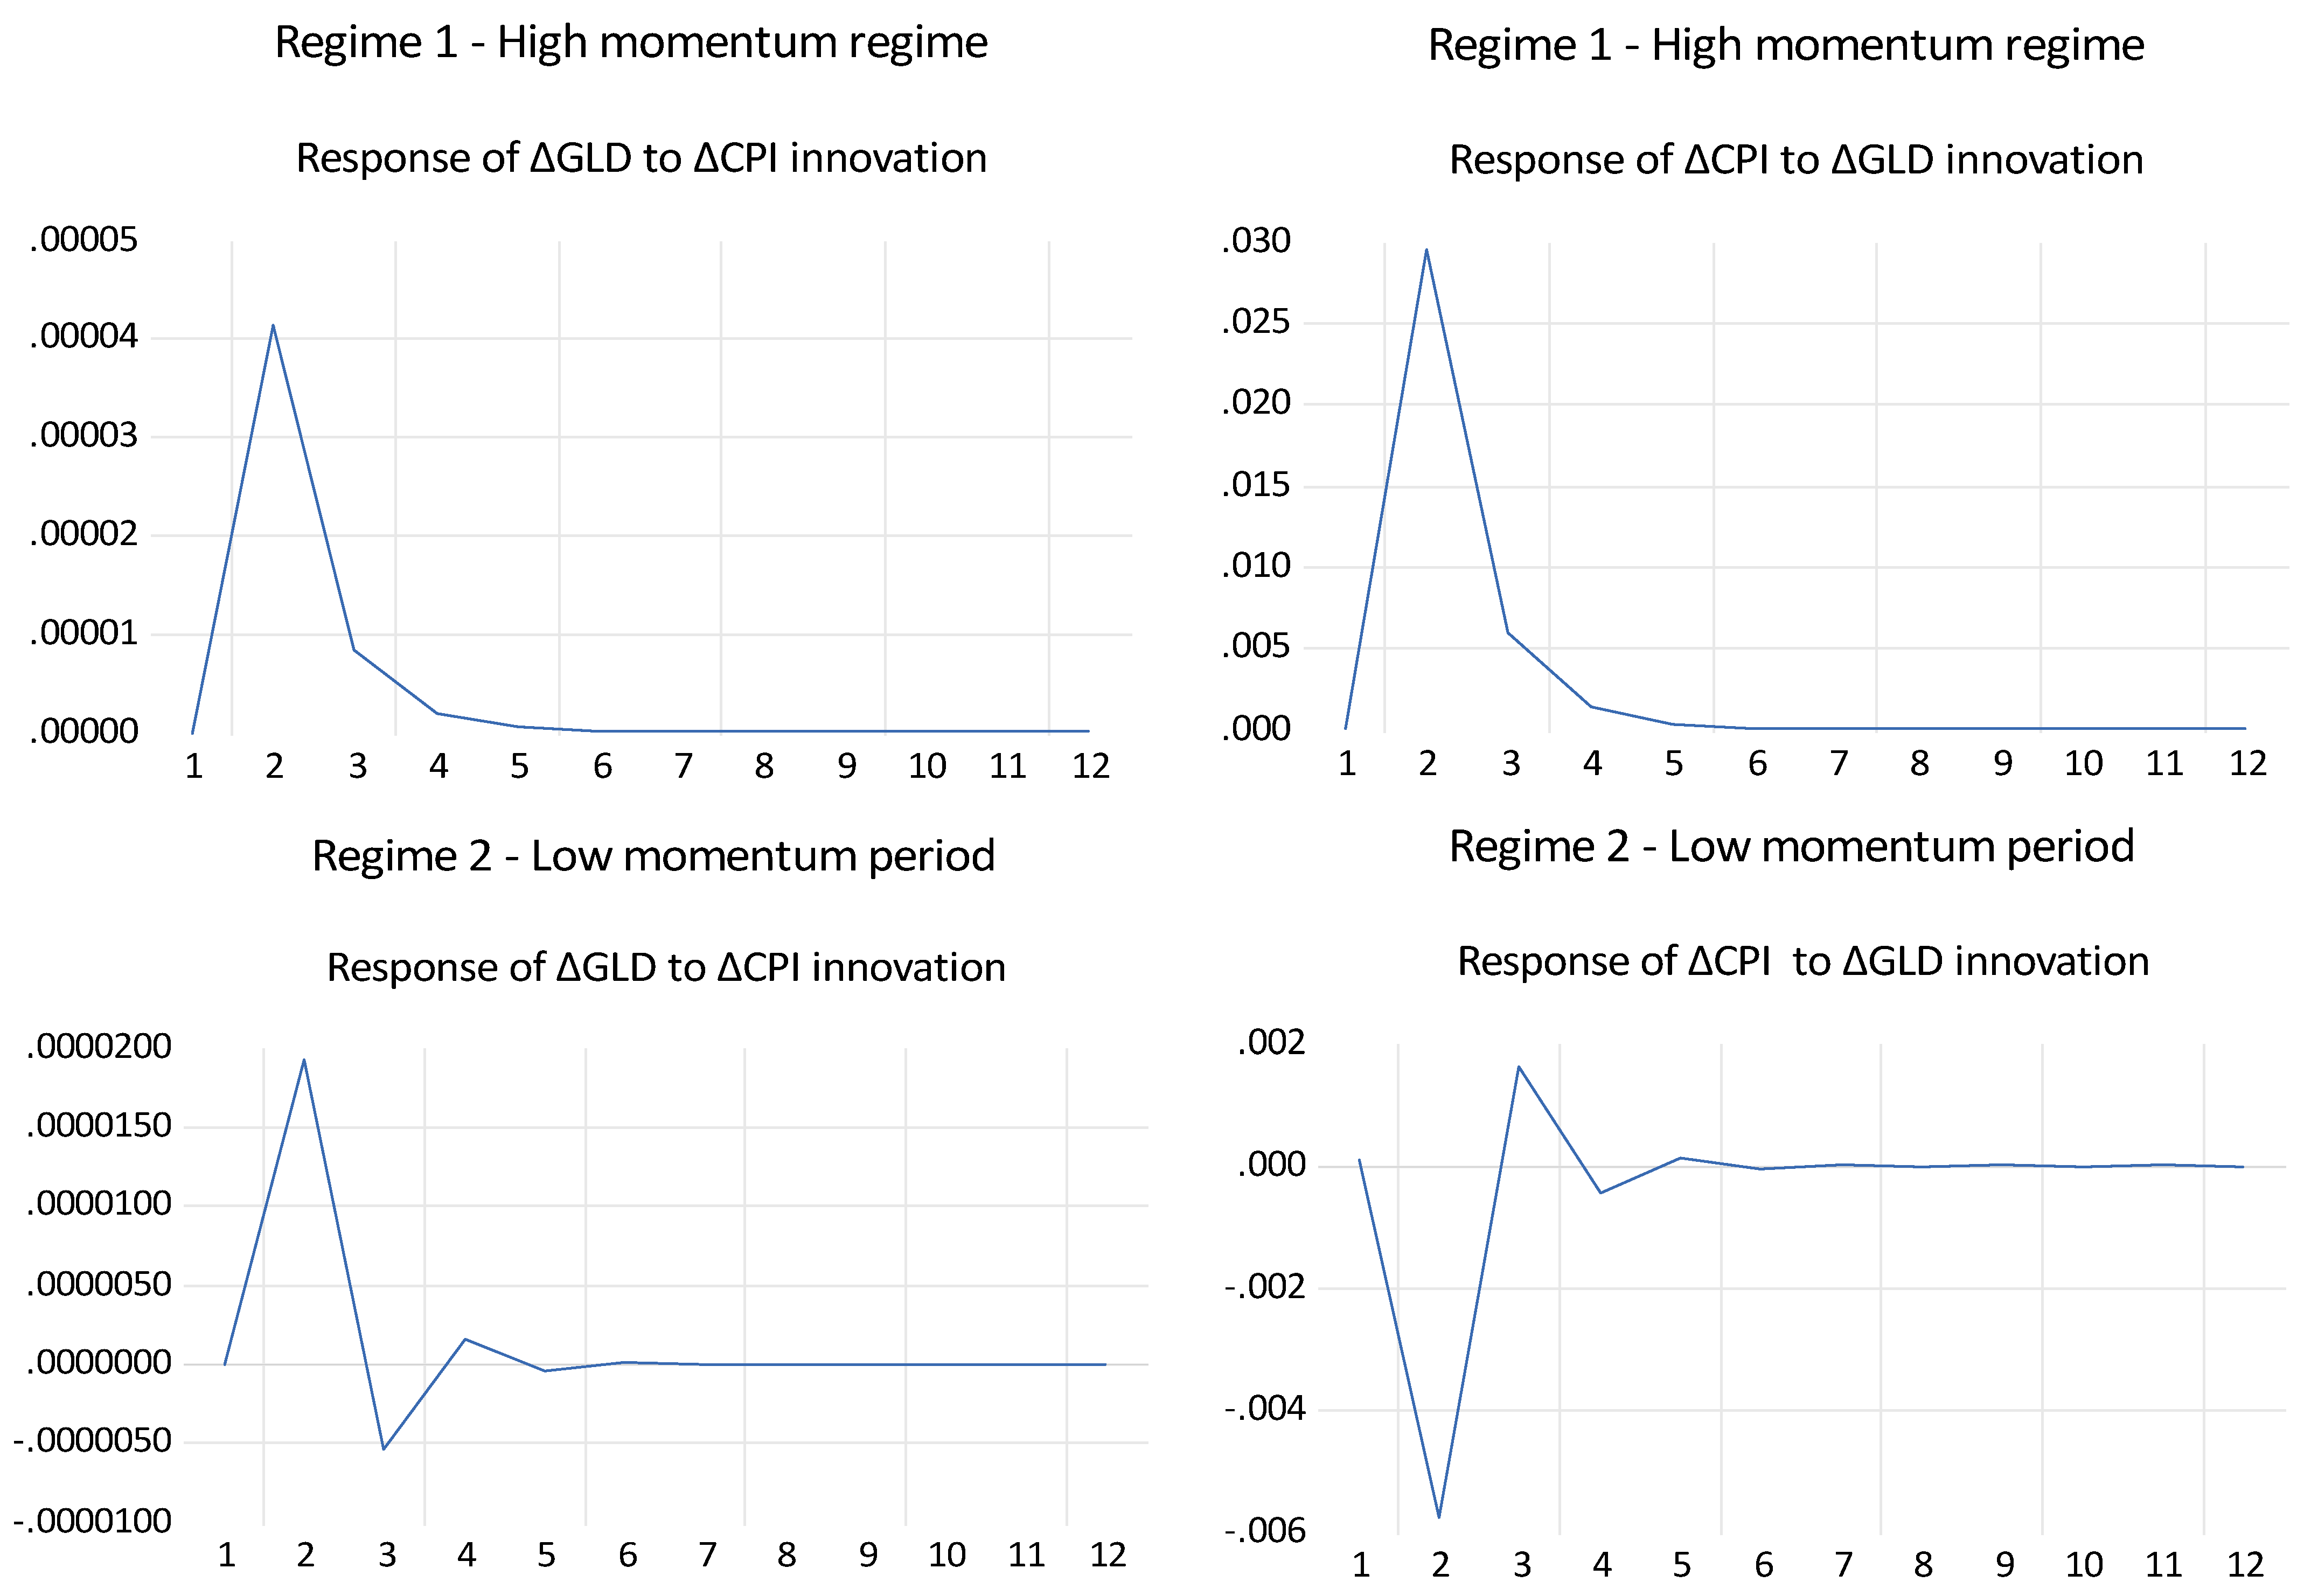
The impulse response analysis is applied to tracing the behaviors of variables to the sudden shocks from others on the current and future values of the endogenous variables. A shock to one variable simultaneously spreads and influences other endogenous variables through the lag of the VAR.
Figure 3 and
Figure 4 offer evidences of the interferences between variables through the dynamic impulse response in the next 12 periods (1 year). This figure focuses on comparing the effects of the impulse response in different regimes. Regarding the impulse response of the USD, the effect directions are almost the same in both regimes, the reactions between the ∆CPI and ∆USD are quick and decisive in regime 1, then turn slower and longer in regime 2. The immediate response of the USD returns to inflation shock, and the response of inflation rates to the USD shock are all positive. The response of gold returns to the CPI shock are positive in regime 1, but it turns negative from period 3 to 4 in regime 2.
The response of inflation rates to gold shock changed from a negative to a positive value and then close to zero in regime 2. All the results show that the impact of the gold returns and the USD appreciation on inflation rates occurring in the first 4 periods, that is, the short-term effect is greater than the long-term, or inflation is sensitive to gold prices and the USD exchange.
The empirical results of this study prove the short-run as well as long-run inflation hedge of gold prices and the US dollar in Vietnam. Gold and the US dollar have been regarded as a “safe haven” of inflation by people for a long time
Ghosh et al. (
2004);
McCown and Zimmerman (
2006);
Baur and Lucey (
2010);
Baur and McDermott (
2010);
Ali et al. (
2021). This behavior is caused by the past galloping inflation, the weak monetary policy, and the traditional habitude of owning gold. Any signal of high inflation may cause a fast and decisive response of gold price and the US dollar price, and vice versa. Conforming to expectation, the rise of gold price and the US dollar is passed to inflation through commodity prices. When the US dollar appreciates, cost–push inflation may occur via the pass-through mechanism from exchange rates to domestic prices. The rise of gold price induces demand–pull inflation; hence, it has no impact on inflation rates in low inflation regimes. Inflation has been contained and growth has been high, particularly in Vietnam since the beginning of the reform. The economy mainly relies on the US dollar coming from foreign investment, trade, remittances from overseas Vietnamese, loans, and official development assistance (ODA). Consequently, Vietnam’s economy and its people are very sensitive to this currency. Along with the high rate of inflation and fragile economy, the US dollar and gold have played a very important role and worked as the inflation-leading indicators in Vietnam.
This study analyzes the inflation hedging power of the US dollar and gold price in Vietnam in both the long-run and short-run within the asymmetric framework. The Engle–Granger and TAR cointegration test are applied for long-run hedges and the dynamic MSI-VAR(1) model is used for short-run hedges. The findings of this study provide policymakers with a look inside the fragile economy of Vietnam, where the dollarization issue is severe, inflation is not stable, and people have less confidence in monetary policy. Investors are also provided a detailed insight into the importance of inflation uncertainty control via investment in gold and the US dollar, which could help investment managers, funds, and foundations to find the appropriate inflation hedge tools when investing in Vietnam or an economy similar to Vietnam.
4. Conclusions
Within the non-linear framework, this study aims to examine the inflation-predictive power of gold price and the US dollar in Vietnam with the asymmetric cointegration test and the dynamic MSI-VAR(1) model. The empirical results show that both the gold prices and the US dollar present an effective hedge against Vietnam’s inflation. The reasons explained for this ability are a fragile economy, unstable inflation rates, and people’s confidence in monetary policy. The policymakers may face a challenge of how to persuade people to believe in the effective monetary policy and to lessen the serious dollarization.
This study makes two contributions to the existing literature. First, this study contributes to knowledge of the inflation hedge of gold price and the US dollar against Vietnam’s inflation within the asymmetric framework. Second, the methodology allows for both regime shifts, providing a better predictive method than the time-varying linear model. Along with increasing prices, inflation heavily pressures Vietnam’s economy. The findings of this study hope to supply a valuable suggestion on valuation and determination on monetary strategy for policymakers and on inflation risk management, as well as the US dollar and gold investment for investors, consumers, and banks. From the academic perspective, the methodology employed has never been used before on the same topic and contributes some new findings to the existing literature.
This study is limited to gold and the USD, an extension in the future could be to examine the role of securities in hedging against inflation in the context of Vietnam.
Ali et al. (
2023) find diversification benefits among Asian equity markets in the COVID-19 era. For investors, capital gains or dividends (in the USD) may also be adjusted accordingly when the Vietnamese currency depreciates during the investment period. Thus, besides hedging inflation, it can also increase nominal returns.


