


The Determinants of Mathematics Achievement: A Gender Perspective Using Multilevel Random Forest
 , , , , , and
Abstract
1. Introduction and Motivation
2. Literature Review
2.1. Evidence of Gender Gap in Student Performance
2.2. Conceptual Framework
3. Data and Methods
3.1. Data and Variables’ Selection
3.2. Methodology
4. Results
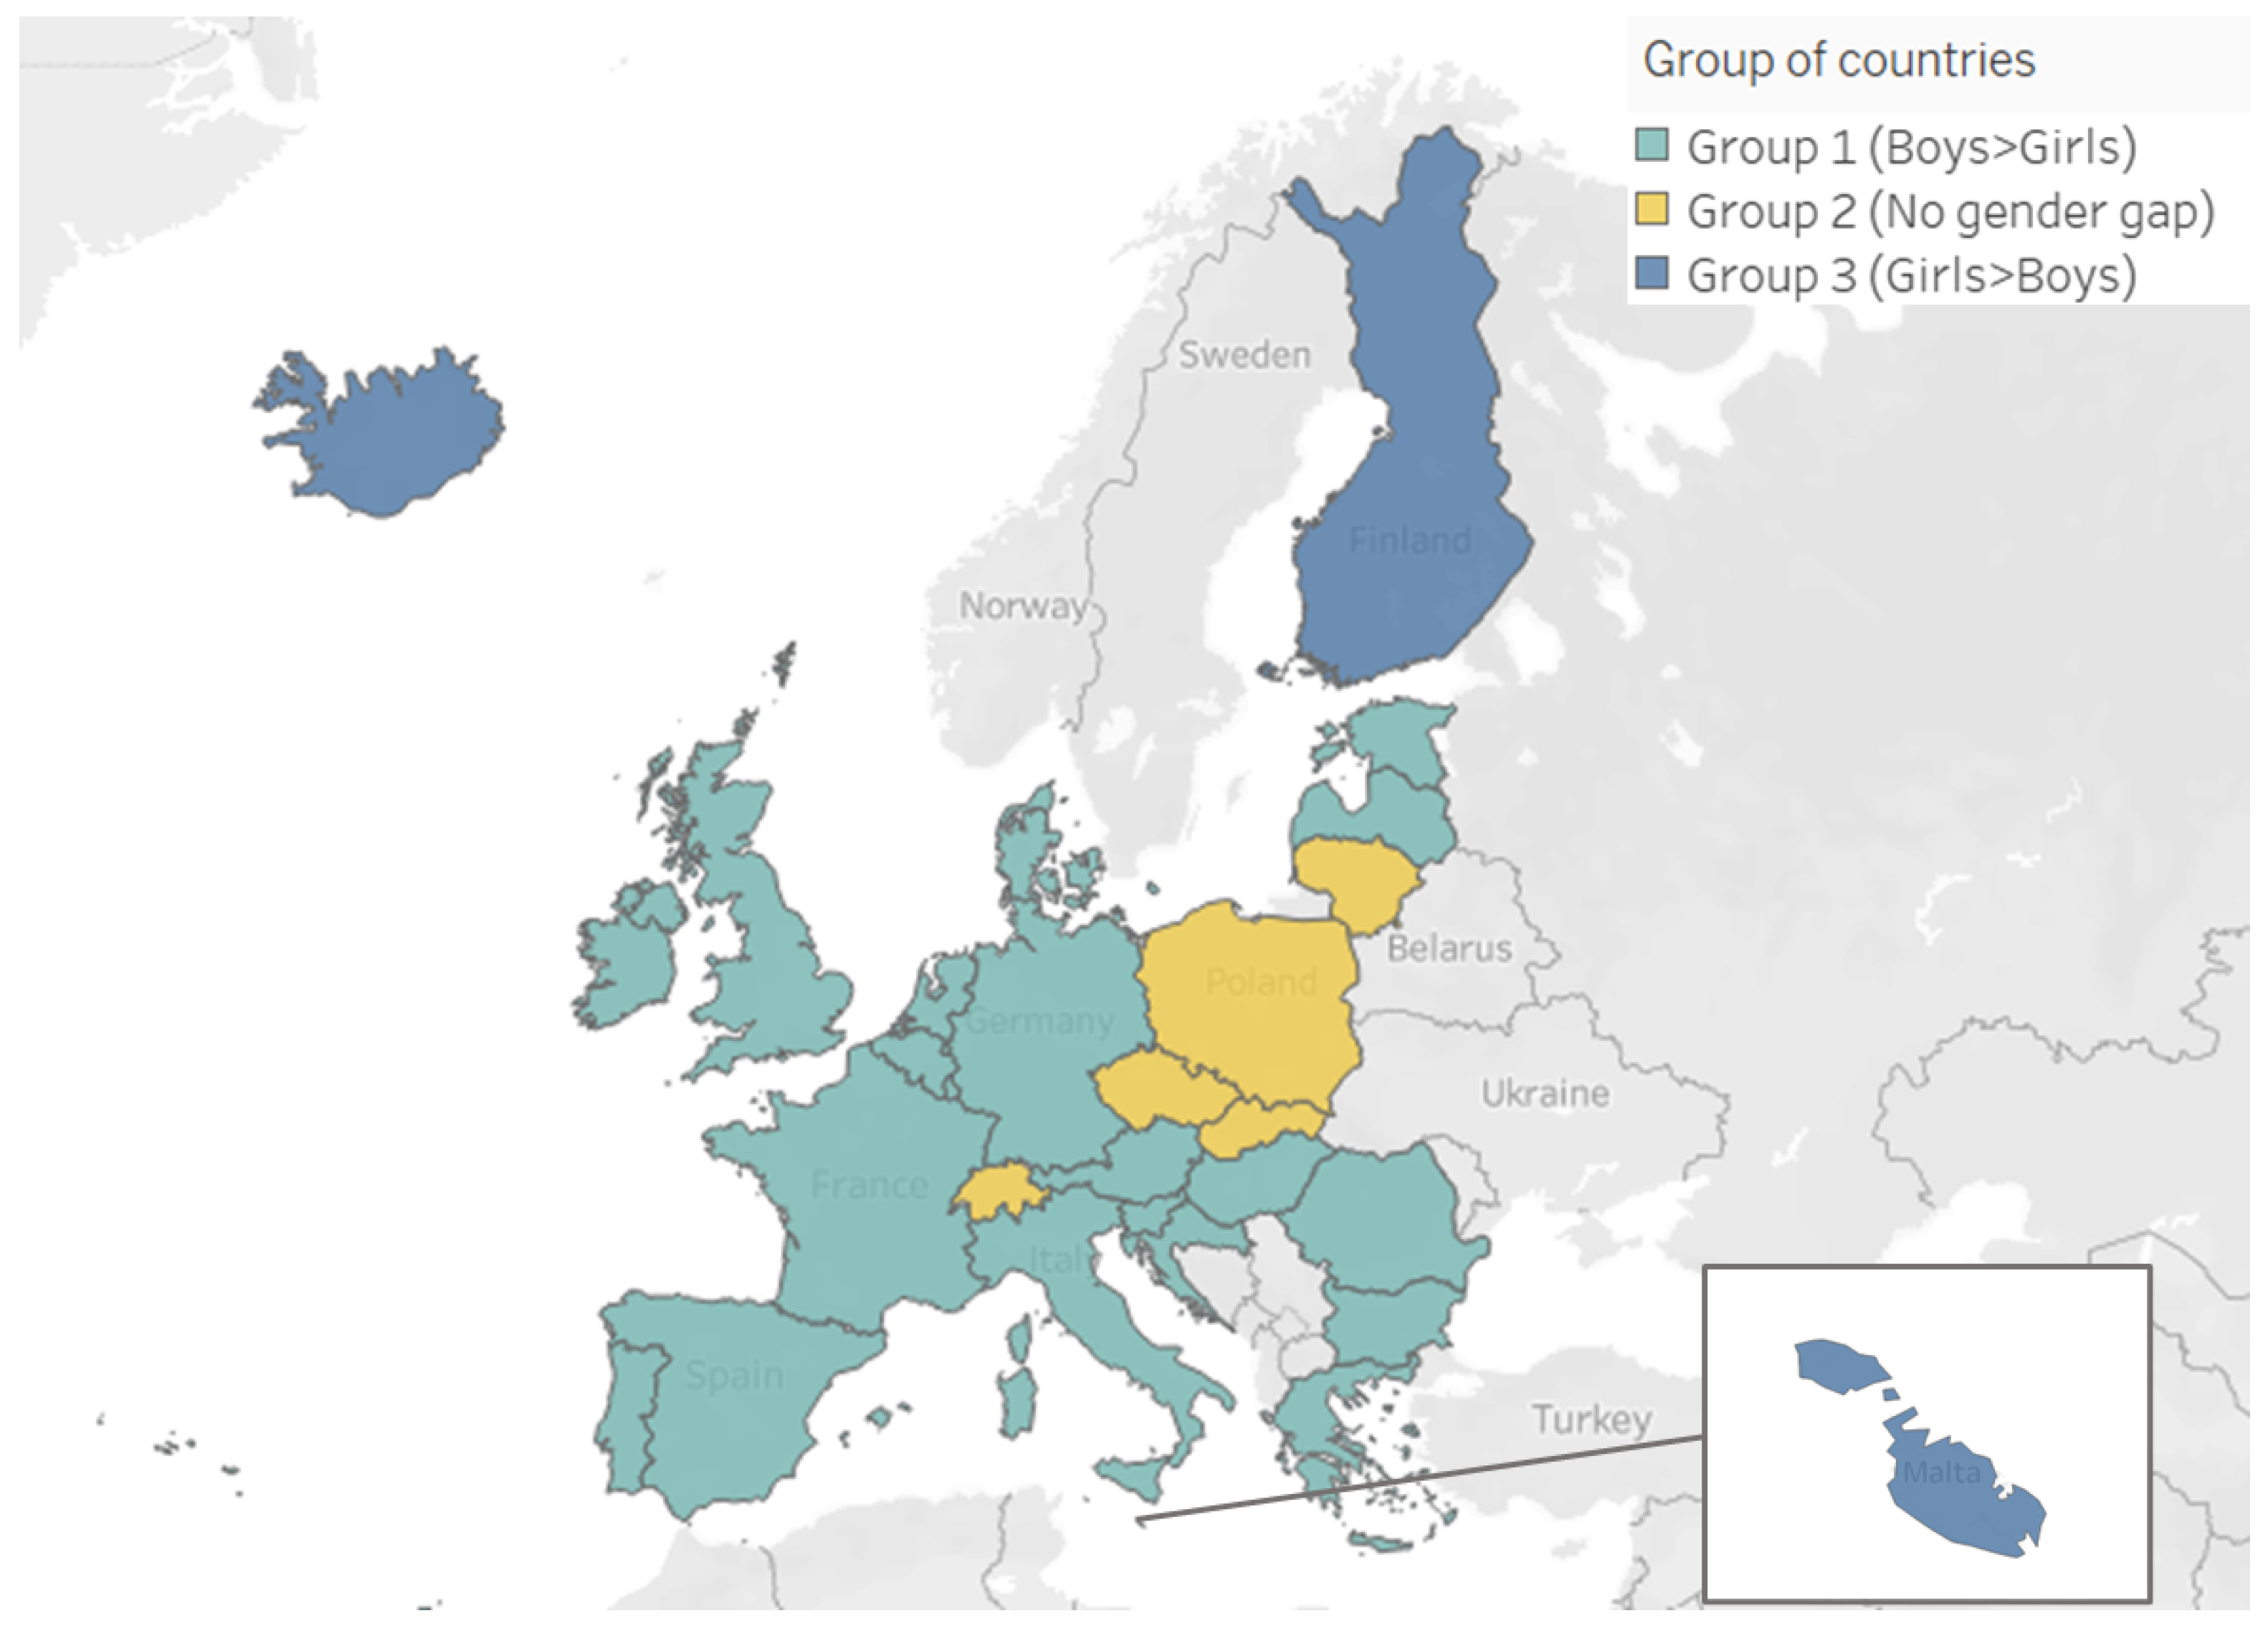
4.1. Preliminary Results: Country Groups Based on Gender Gap’S Direction
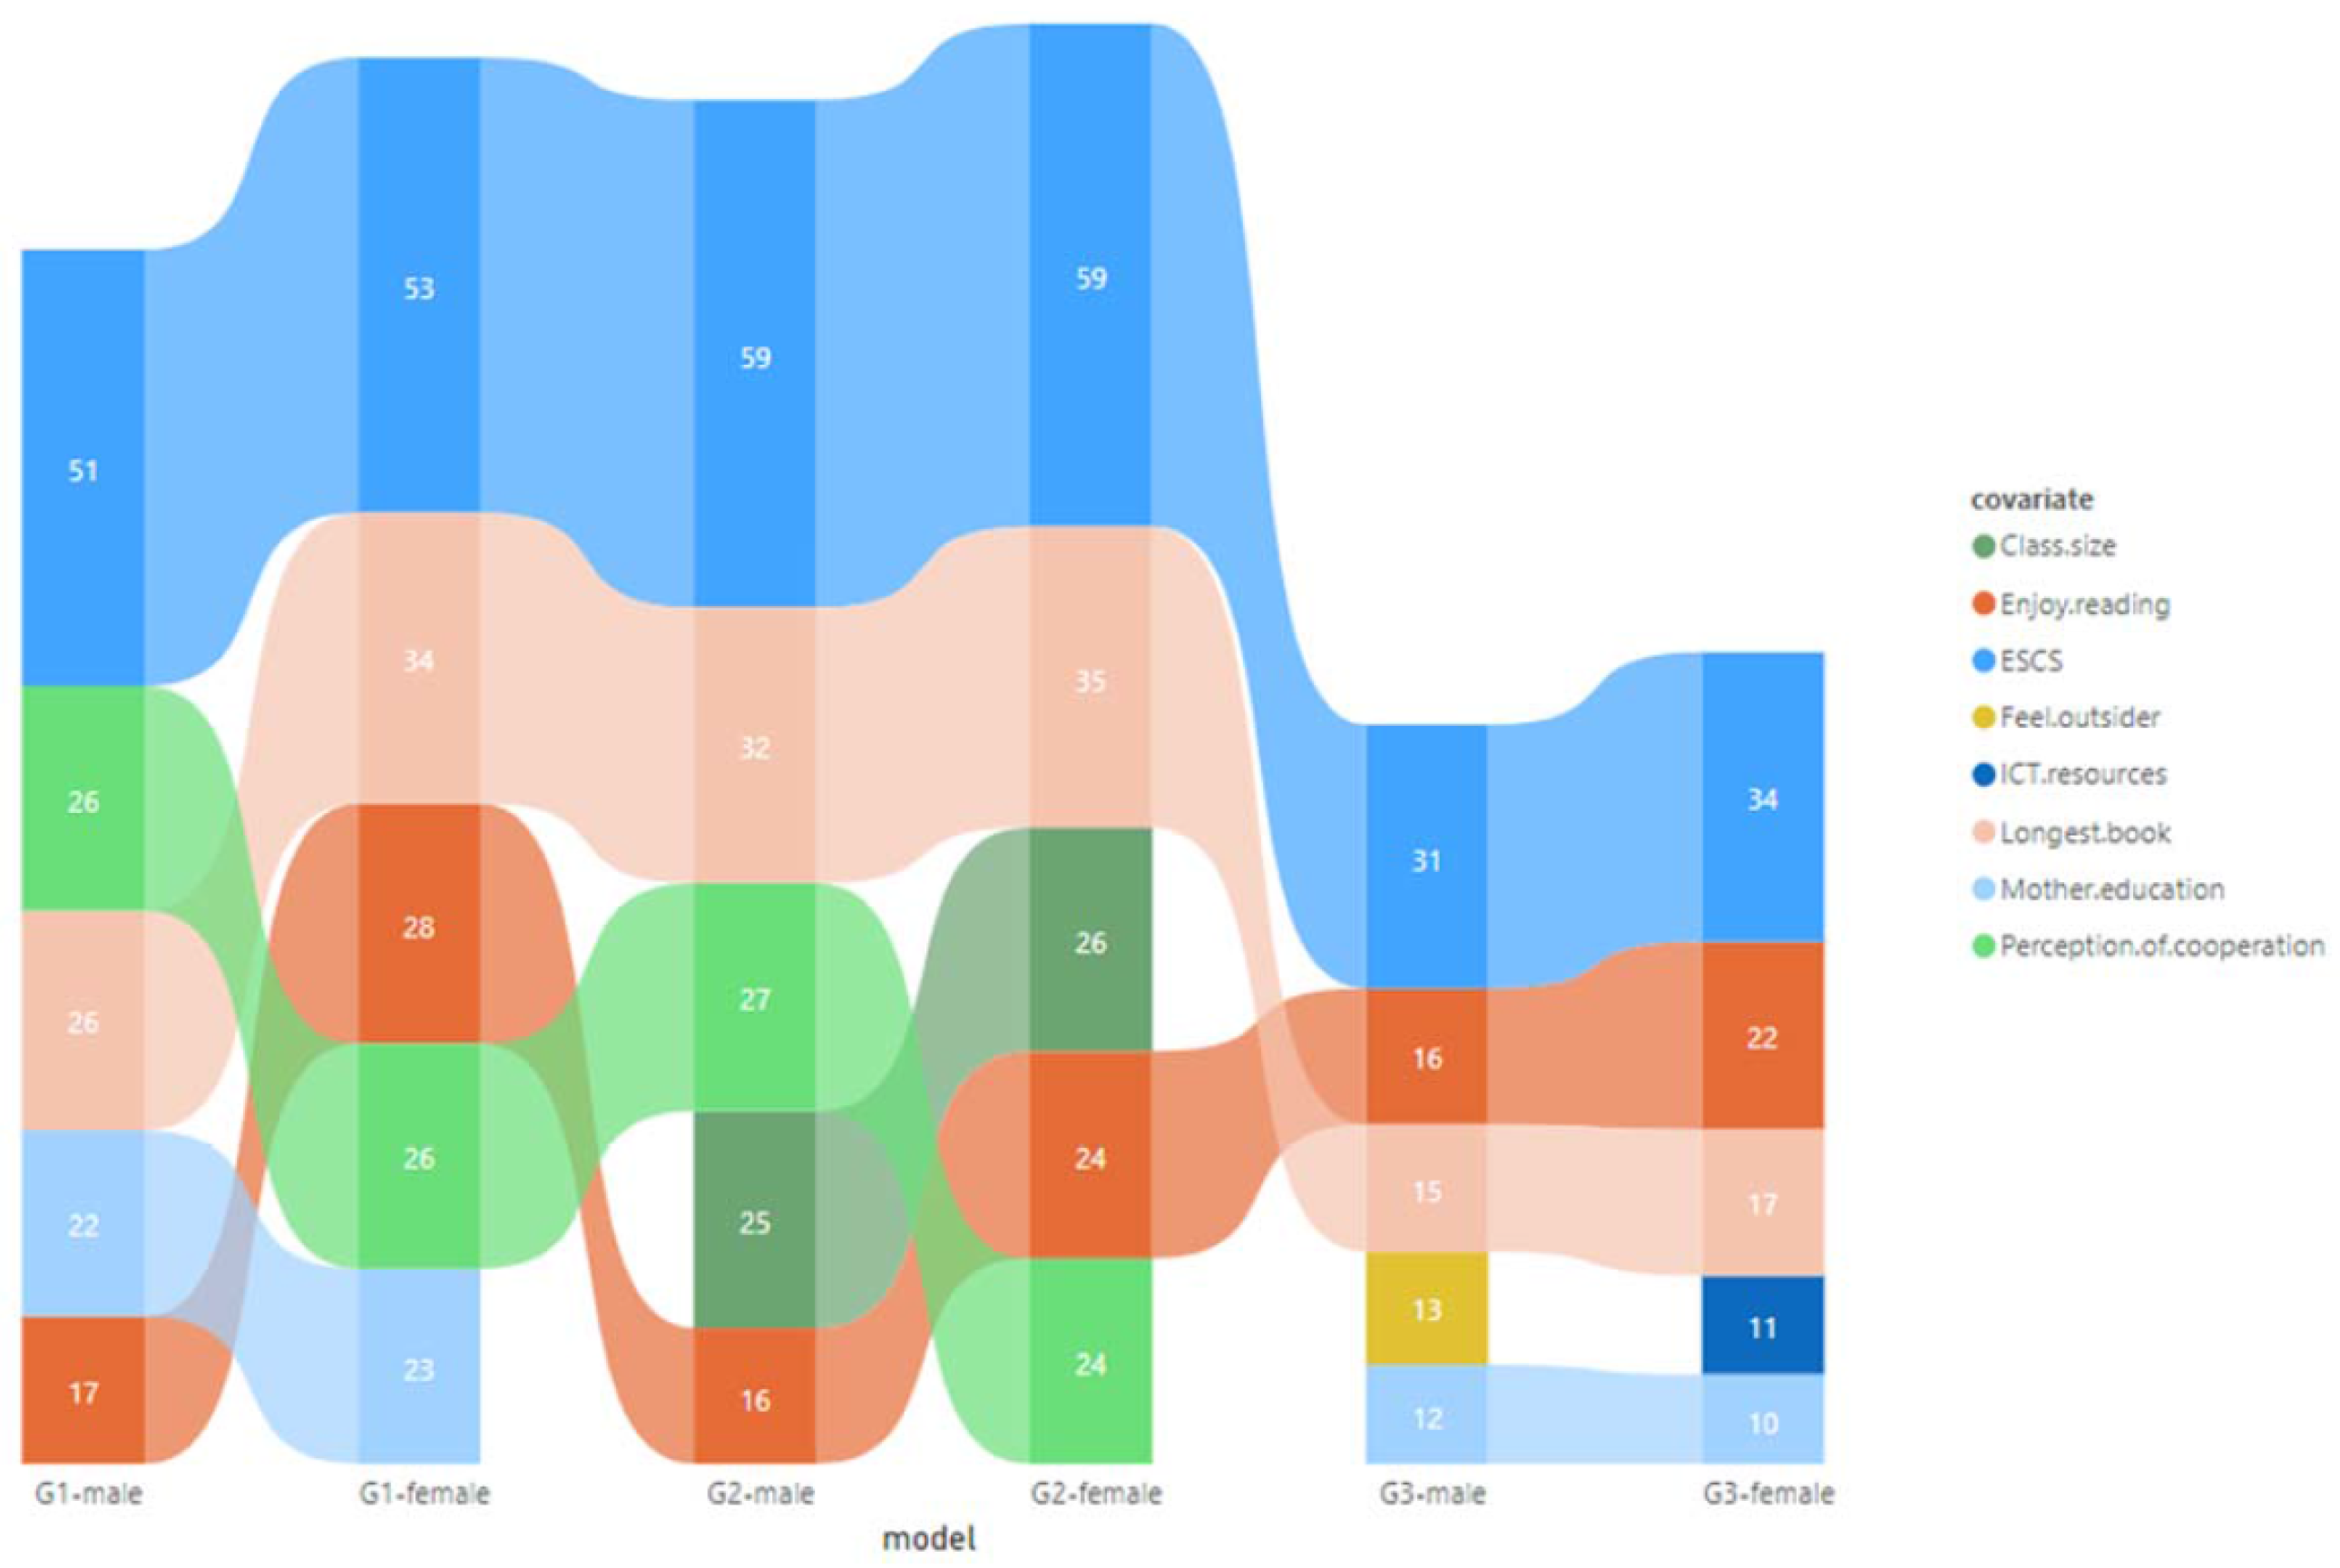
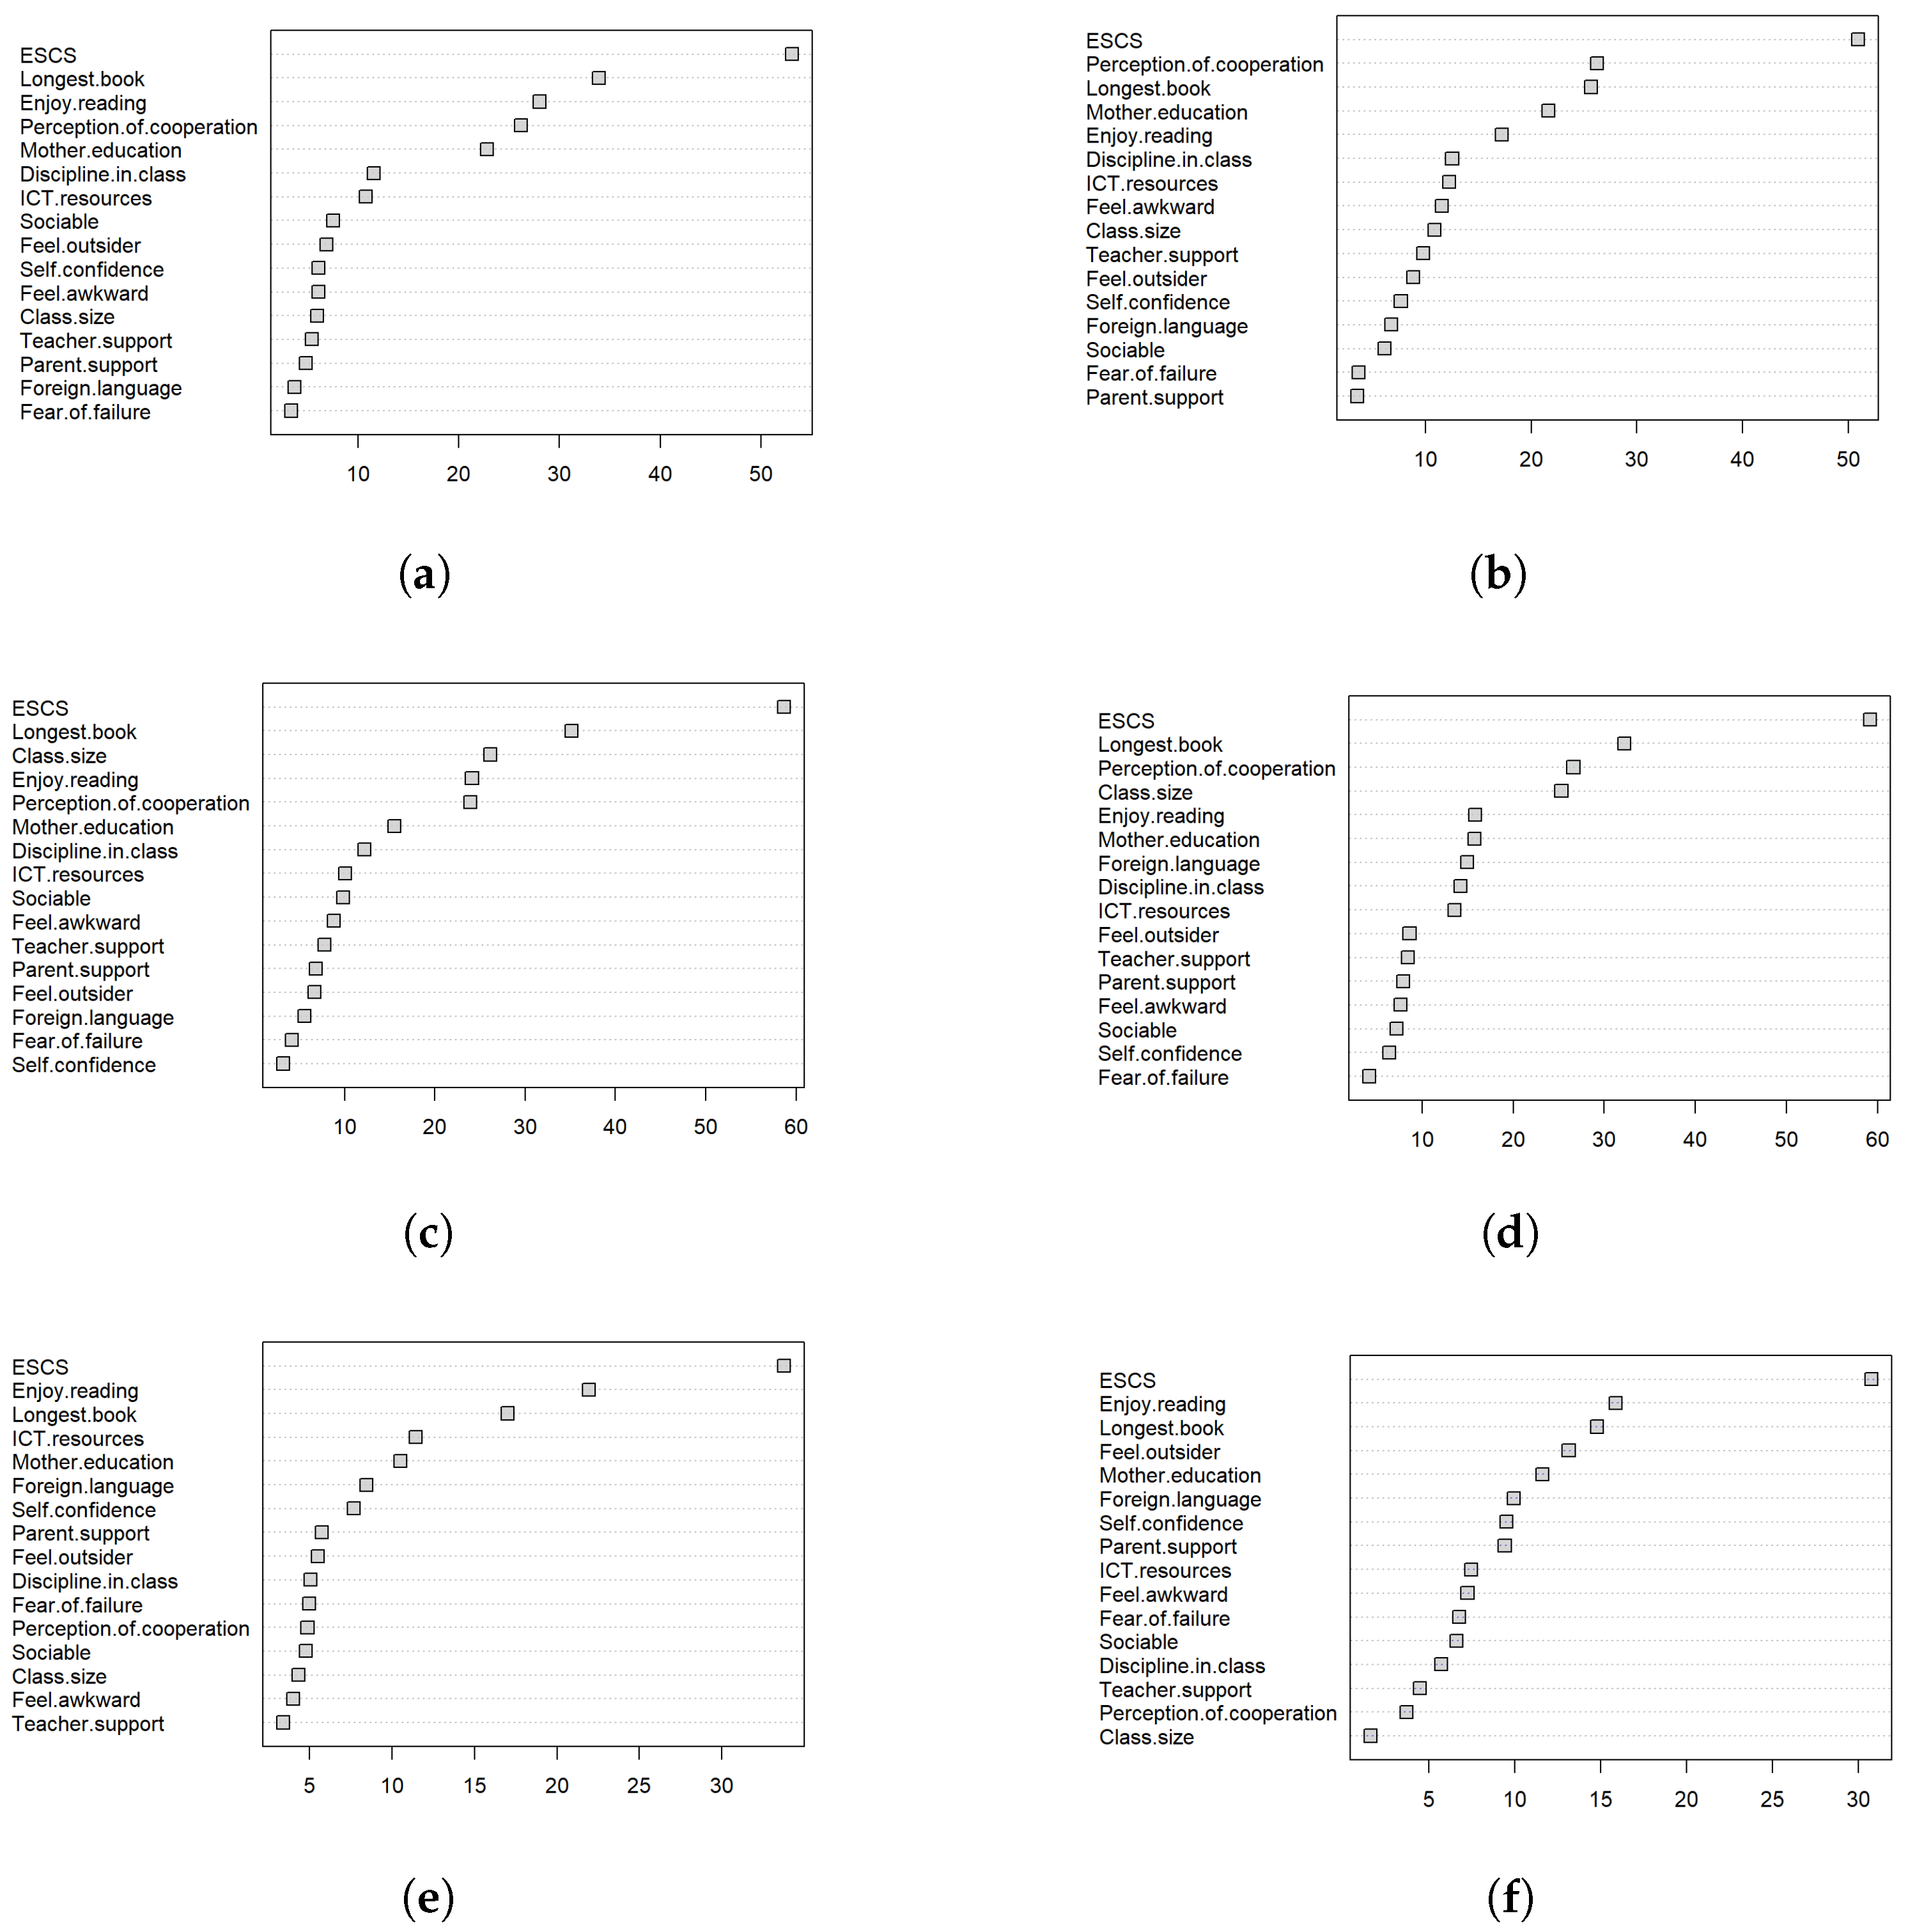
4.2. Main Results: Multilevel Random Forest
4.2.1. Student Level
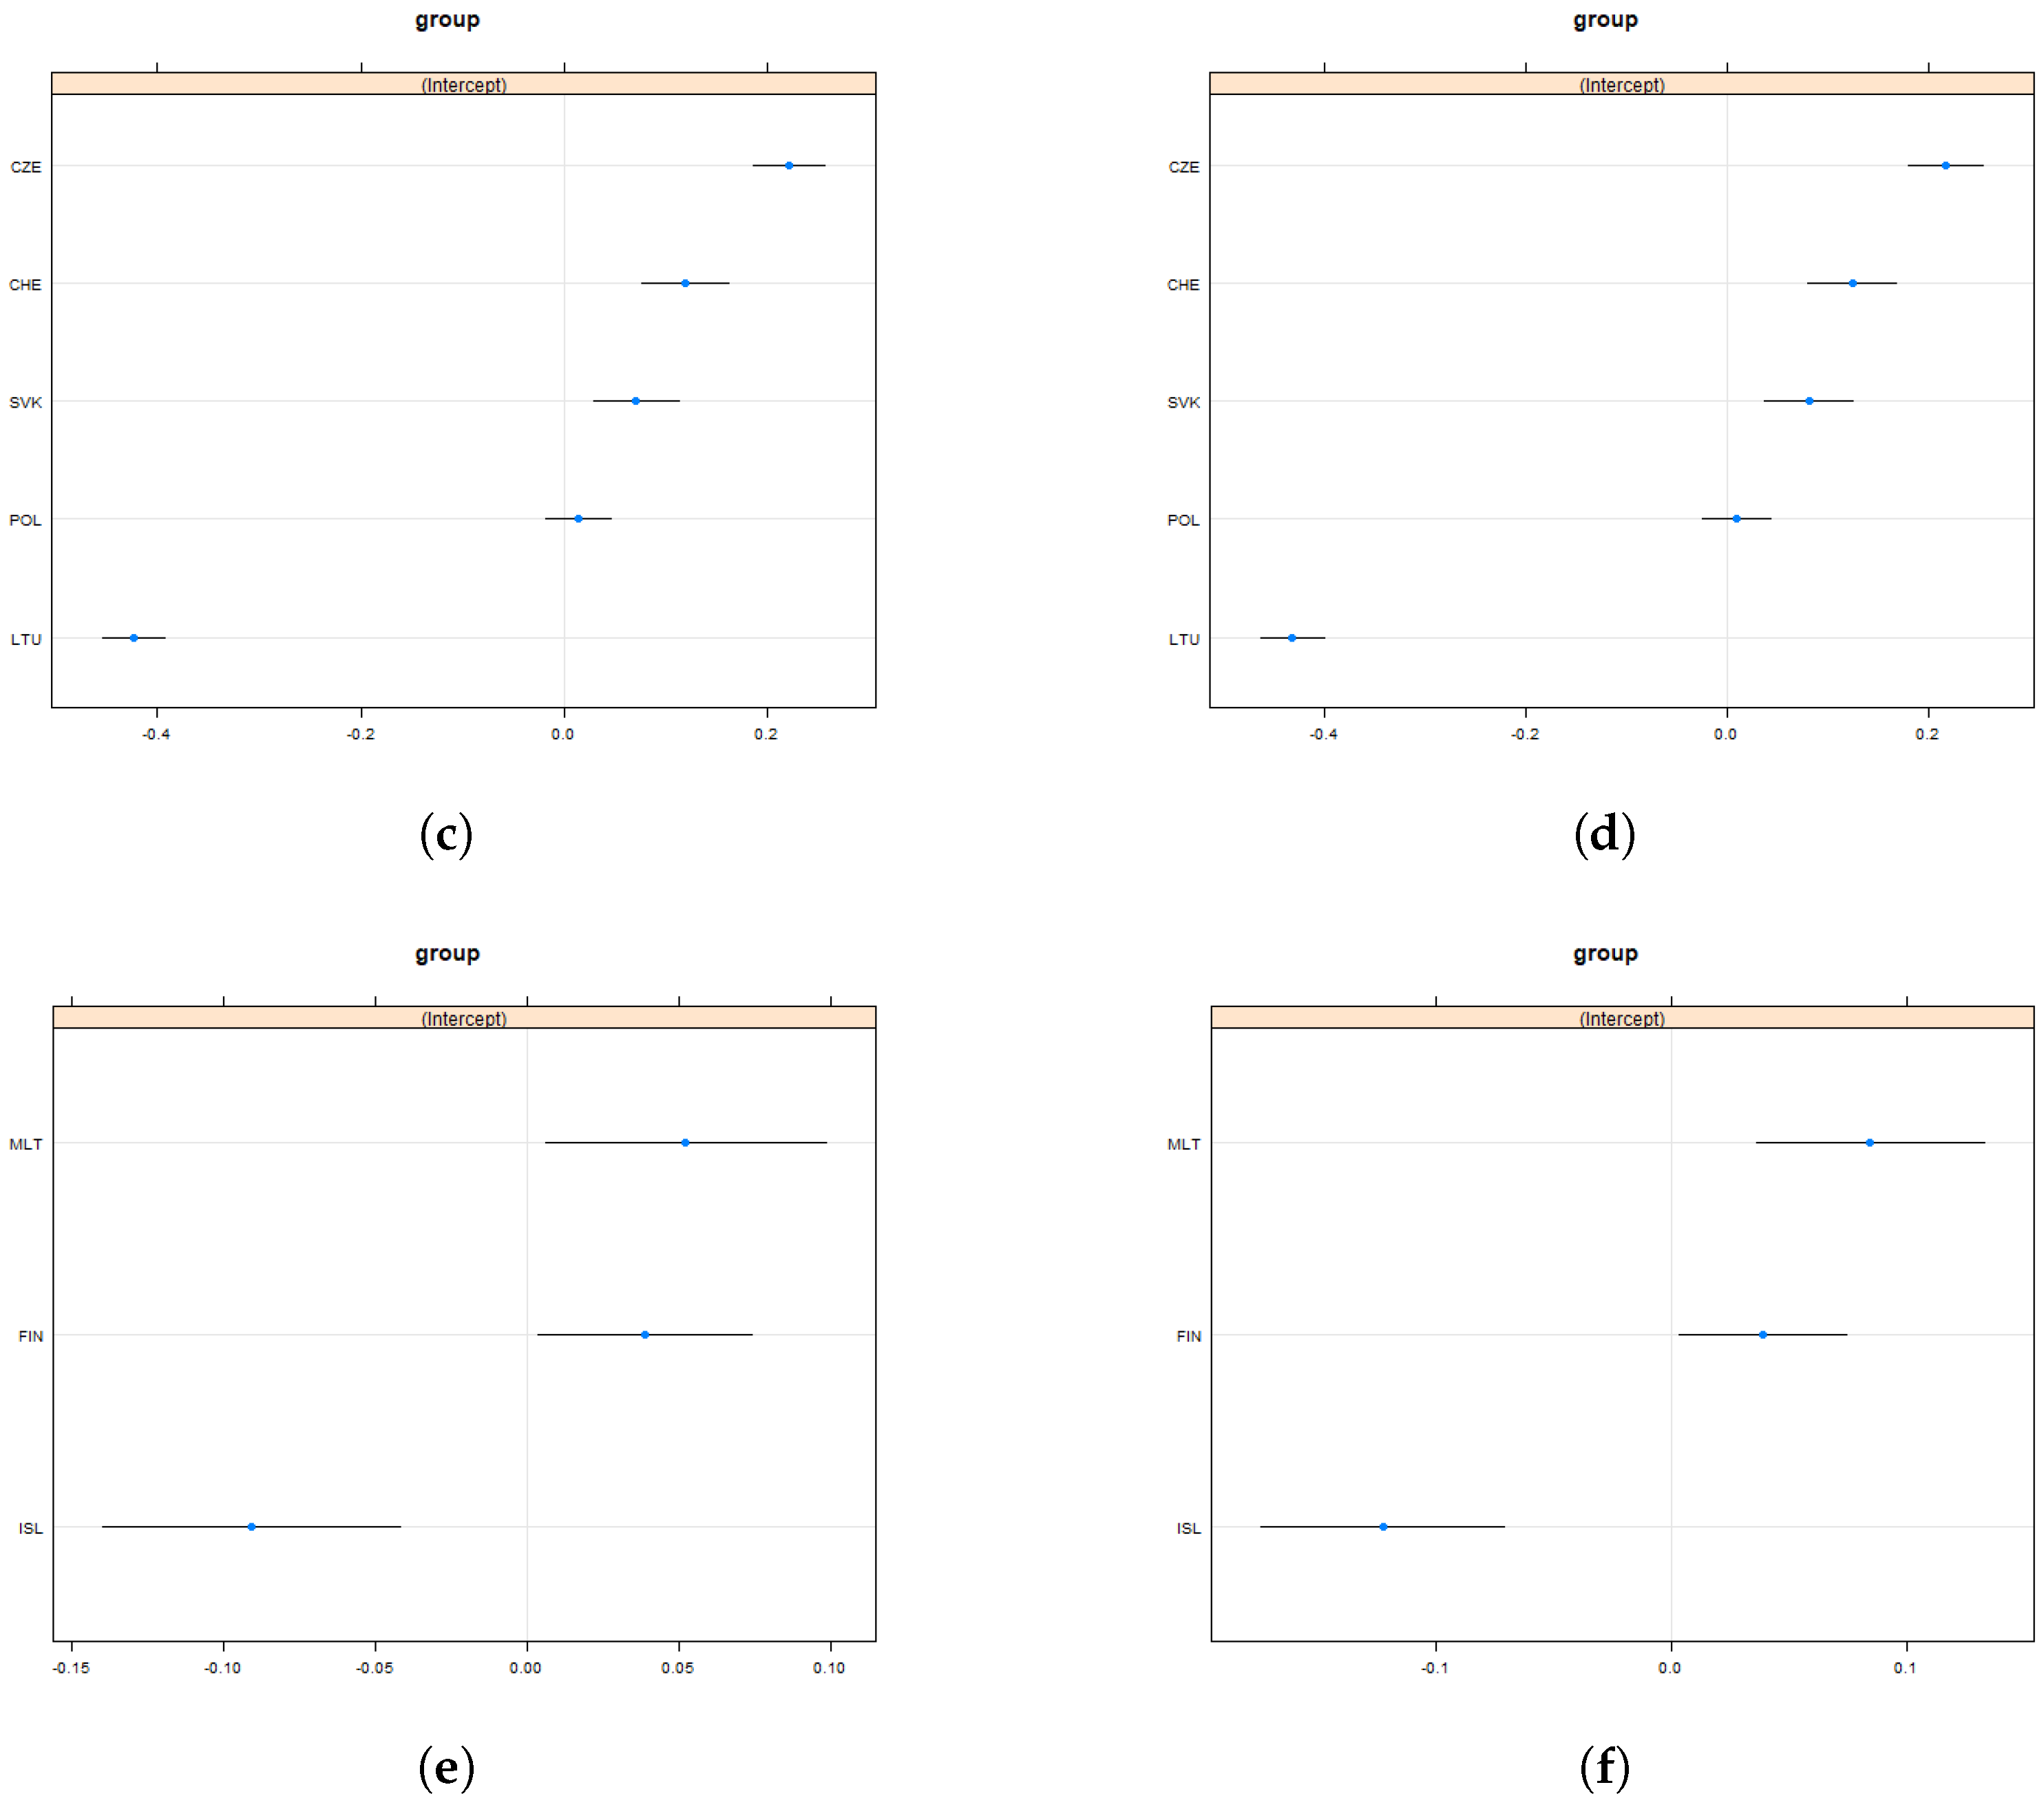
4.2.2. Country Level
5. Discussion
6. Conclusions
Author Contributions
Funding
Institutional Review Board Statement
Data Availability Statement
Conflicts of Interest
Appendix A

| Country | p-Value | Mean Score | Mean Score | # obs. | Group |
|---|---|---|---|---|---|
| for Females | for Males | ||||
| AUT | 0 | 496.979 | 507.410 | 6802 | better male |
| BEL | 0 | 541.043 | 560.719 | 4888 | better male |
| BGR | 0.004 | 464.893 | 475.523 | 2739 | better male |
| HRV | 0 | 508.091 | 541.658 | 2094 | better male |
| CZE | 0.546 | 533.560 | 531.863 | 4764 | no gap |
| DNK | 0.00004 | 493.128 | 501.081 | 7656 | better male |
| EST | 0.005 | 519.645 | 525.908 | 5315 | better male |
| FIN | 0.005 | 510.455 | 504.353 | 5648 | better female |
| FRA | 0.00002 | 499.445 | 510.525 | 4992 | better male |
| DEU | 0.002 | 499.226 | 507.447 | 5305 | better male |
| GRC | 0.0003 | 462.327 | 470.351 | 5599 | better male |
| HUN | 0 | 494.471 | 511.977 | 4294 | better male |
| ISL | 0.008 | 498.026 | 489.664 | 3296 | better female |
| IRL | 0.005 | 498.221 | 504.029 | 5536 | better male |
| ITA | 0 | 508.668 | 545.193 | 5744 | better male |
| LVA | 0.001 | 490.650 | 498.148 | 5259 | better male |
| LTU | 0.480 | 481.024 | 482.566 | 6758 | no gap |
| LUX | 0.0004 | 489.381 | 500.135 | 4123 | better male |
| MLT | 0.0003 | 480.116 | 467.605 | 3363 | better female |
| NLD | 0.0001 | 547.000 | 557.371 | 3379 | better male |
| POL | 0.204 | 515.407 | 518.377 | 5616 | no gap |
| PRT | 0 | 496.962 | 510.137 | 4965 | better male |
| ROU | 0 | 435.553 | 449.897 | 4437 | better male |
| SVK | 0.775 | 495.028 | 494.051 | 3900 | no gap |
| SVN | 0.00005 | 545.966 | 560.069 | 2221 | better male |
| ESP | 0 | 488.831 | 495.895 | 35,599 | better male |
| CHE | 0.389 | 513.383 | 515.740 | 4841 | no gap |
| GBR | 0 | 491.066 | 498.559 | 13,762 | better male |


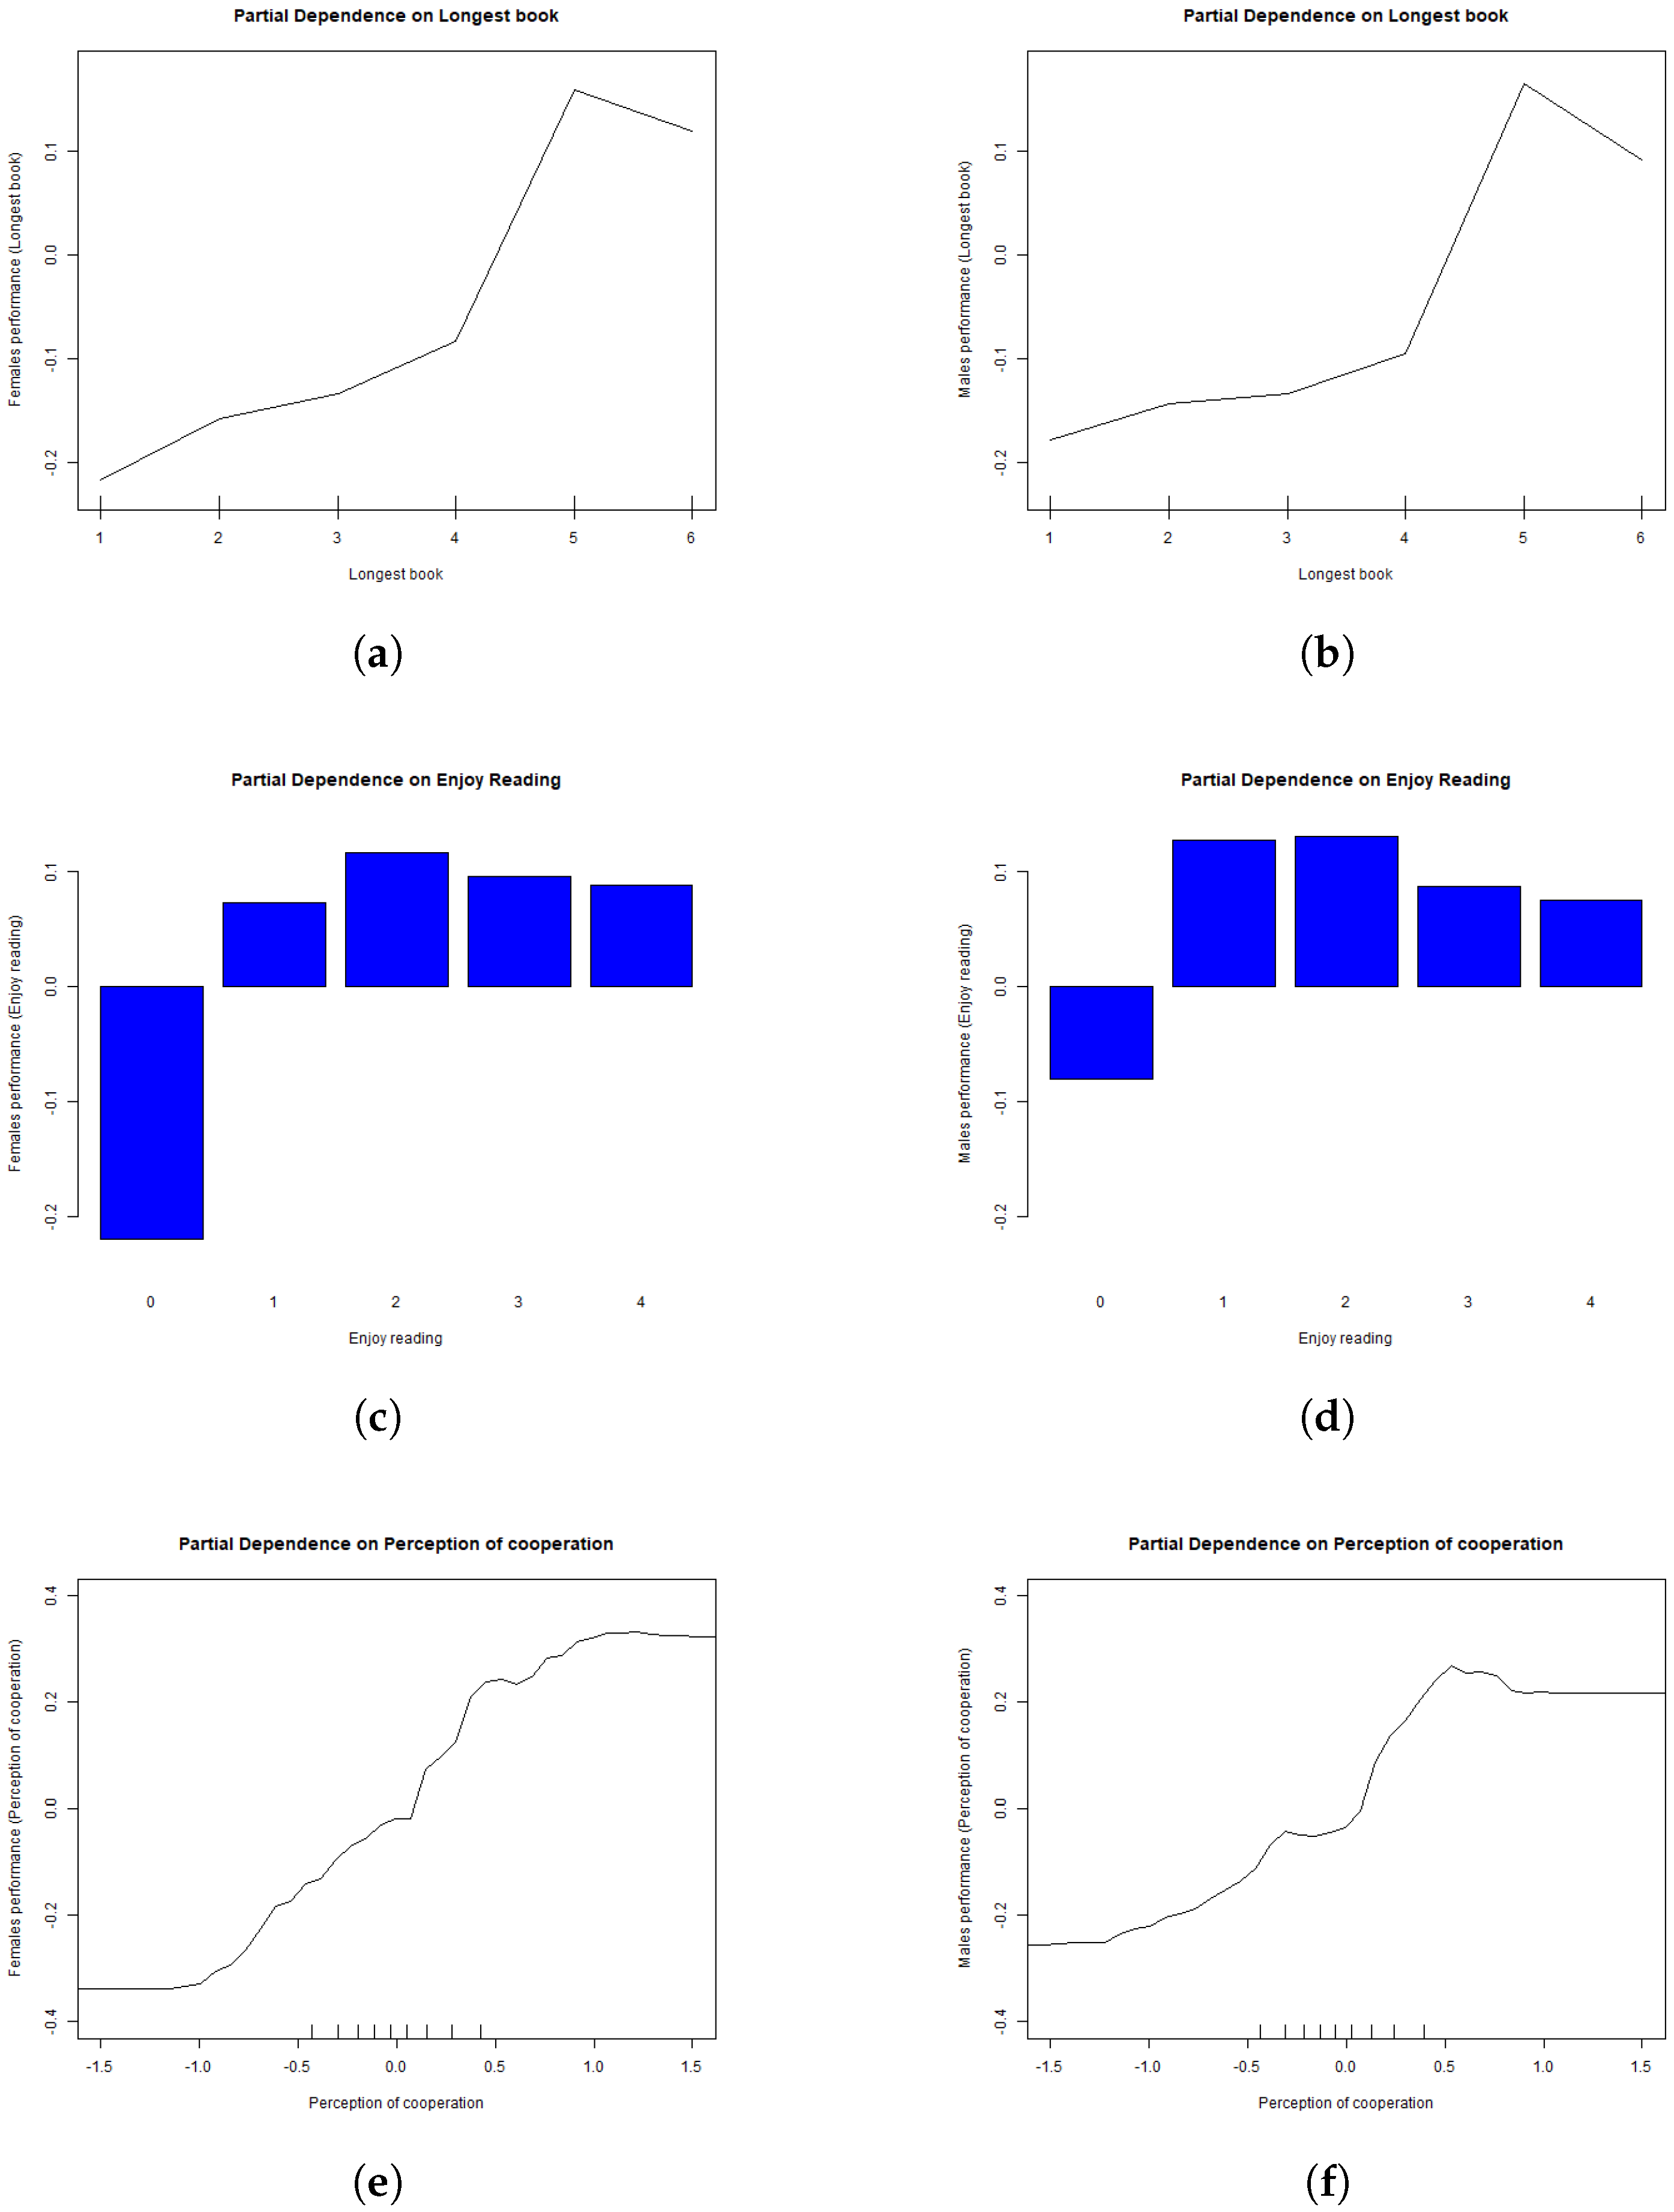
| 1 | We report in the paper the partial plots only for Group 1 since this includes the majority of the countries and represents the group of interest in terms of policy action, i.e., countries with a gender gap in disfavour of girls. Partial plots for Groups 2 and 3 show similar patterns and are available upon request |
References
- Ajello, Anna Maria, Elisa Caponera, and Laura Palmerio. 2018. Italian students’ results in the pisa mathematics test: Does reading competence matter? European Journal of Psychology of Education 33: 505–20. [Google Scholar] [CrossRef]
- Ajello, Anna Maria, Giulia Accardi, Stefano Aprile, Rosalia Caldarella, Ciriaco Carru, Marcello Ciaccio, Immaculata De Vivo, Caterina Maria Gambino, Mattia Emanuela Ligotti, and Sonya Vasto. 2021. Age and gender-related variations of molecular and phenotypic parameters in a cohort of sicilian population: From young to centenarians. Aging and Disease 12: 1773. [Google Scholar]
- Autor, David, David Figlio, Krzysztof Karbownik, Jeffrey Roth, and Melanie Wasserman. 2019. Family disadvantage and the gender gap in behavioral and educational outcomes. American Economic Journal: Applied Economics 11: 338–81. [Google Scholar] [CrossRef]
- Ayalon, Hanna, and Idit Livneh. 2013. Educational standardization and gender differences in mathematics achievement: A comparative study. Social Science Research 42: 432–45. [Google Scholar] [CrossRef]
- Beede, David N., Tiffany A. Julian, David Langdon, George McKittrick, Beethika Khan, and Mark E. Doms. 2011. Women in STEM: A Gender Gap to Innovation. SSRN Electronic Journal. [Google Scholar] [CrossRef]
- Bertocchi, Graziella, and Monica Bozzano. 2020. Gender Gaps in Education. Cham: Springer International Publishing. [Google Scholar]
- Borgonovi, Francesca, Álvaro Choi, and Marco Paccagnella. 2021. The evolution of gender gaps in numeracy and literacy between childhood and adulthood. Economics of Education Review. [Google Scholar] [CrossRef]
- Bouffard, Suzanne M., and Nancy E. Hill. 2005. Maternal perceptions of competence and children’s academic adjustment: Longitudinal relations across early elementary school. Social Psychology of Education 8: 441–63. [Google Scholar] [CrossRef]
- Breda, Thomas, and Clotilde Napp. 2019. Girls’ comparative advantage in reading can largely explain the gender gap in math-related fields. Proceedings of the National Academy of Sciences 116: 15435–40. [Google Scholar] [CrossRef]
- Breda, Thomas, Elyès Jouini, and Clotilde Napp. 2018. Societal inequalities amplify gender gaps in math. Science 359: 1219–20. [Google Scholar] [CrossRef]
- Breiman, Leo. 2001. Random forests. Machine Learning 45: 5–32. [Google Scholar] [CrossRef]
- Brenøe, Anne Ardila, and Shelly Lundberg. 2018. Gender gaps in the effects of childhood family environment: Do they persist into adulthood? European Economic Review 109: 42–62. [Google Scholar] [CrossRef]
- Broer, Markus, Yifan Bai, and Frank Fonseca. 2019. A review of the literature on socioeconomic status and educational achievement. In Socioeconomic Inequality and Educational Outcomes. Cham: Springer International Publishing, vol. 5, pp. 7–17. [Google Scholar] [CrossRef]
- Buchmann, Claudia, Thomas A. DiPrete, and Anne McDaniel. 2008. Gender inequalities in education. Annu. Rev. Sociol 34: 319–37. [Google Scholar] [CrossRef]
- Card, David, and A. Abigail Payne. 2021. High school choices and the gender gap in stem. Economic Inquiry 59: 9–28. [Google Scholar] [CrossRef]
- Cascella, Clelia, Julian Scott Williams, and Maria Pampaka. 2021. Gender differences in mathematics outcomes at different levels of locality to inform policy and practice. European Educational Research Journal 21: 705–31. [Google Scholar] [CrossRef]
- Caviola, Sara, Enrico Toffalini, David Giofrè, Jessica Mercader Ruiz, Dénes Szűcs, and Irene C. Mammarella. 2022. Math performance and academic anxiety forms, from sociodemographic to cognitive aspects: A meta-analysis on 906,311 participants. Educational Psychology Review 34: 363–99. [Google Scholar] [CrossRef]
- Chaman, Mini J., Kim Beswick, and Rosemary Callingham. 2014. Factors influencing mathematics achievement among secondary school students: A review. In The Future of Educational Research. Rotterdam: SensePublishers, pp. 227–38. [Google Scholar]
- Close, Sean, and Gerry Shiel. 2009. Gender and pisa mathematics: Irish results in context. European Educational Research Journal 8: 20–33. [Google Scholar] [CrossRef]
- Contini, Dalit, Maria Laura Di Tommaso, and Silvia Mendolia. 2017. The gender gap in mathematics achievement: Evidence from italian data. Economics of Education Review 58: 32–42. [Google Scholar] [CrossRef]
- Cuevas-Ruiz, Pilar, Cristina Borra, and Almudena Sevilla. 2020. Educación y salud al nacer. Papeles de Economía Española 166: 185–202. Available online: https://www.funcas.es/wp-content/uploads/2021/01/Pilar-Cuevas-Cristina-Borra-Almudena-Sevilla.pdf (accessed on 21 June 2022).
- Cvencek, Dario, Andrew N. Meltzoff, and Manu Kapur. 2014. Cognitive consistency and math–Gender stereotypes in singaporean children. Journal of Experimental Child Psychology 117: 73–91. [Google Scholar] [CrossRef]
- De Witte, Kristof, and Mika Kortelainen. 2013. What explains the performance of students in a heterogeneous environment? conditional efficiency estimation with continuous and discrete environmental variables. Applied Economics 45: 2401–12. [Google Scholar] [CrossRef]
- Dossi, Gaia, David Figlio, Paola Giuliano, and Paola Sapienza. 2021. Born in the family: Preferences for boys and the gender gap in math. Journal of Economic Behavior & Organization 183: 175–88. [Google Scholar]
- Dunnzlaff, Lina, Dirk Neumann, Judith Niehues, and Andreas Peichl. 2011. Equality of Opportunity and Redistribution in Europe. Bingley: Emerald Group Publishing Limited. [Google Scholar]
- Education, European, Culture Executive Agency, and Eurydice. 2012. Gender Differences in Educational Outcomes: Study on the Measures Taken and the Current Situation in Europe. Publications Office. Available online: https://data.europa.eu/doi/10.2797/3598 (accessed on 21 June 2022).
- Else-Quest, Nicole M., Janet Shibley Hyde, and Marcia C. Linn. 2010. Cross-national patterns of gender differences in mathematics: A meta-analysis. Psychological Bulletin 136: 103. [Google Scholar] [CrossRef]
- Evans, David K., Maryam Akmal, and Pamela Jakiela. 2020. Gender Gaps in Education: The Long View. Technical Report. Washington, DC: Center for Global Development. [Google Scholar]
- Flore, Paulette C., and Jelte M Wicherts. 2015. Does stereotype threat influence performance of girls in stereotyped domains? A meta-analysis. Journal of School Psychology 53: 25–44. [Google Scholar] [CrossRef] [PubMed]
- Friedman, Jerome, Trevor Hastie, and Robert Tibshirani. 2001. The Elements of Statistical Learning. Springer Series in Statistics; New York: Springer, vol. 1. [Google Scholar]
- Fryer, Roland G., Jr., and Steven D. Levitt. 2010. An empirical analysis of the gender gap in mathematics. American Economic Journal: Applied Economics 2: 210–40. [Google Scholar] [CrossRef]
- Gevrek, Z. Eylem, Deniz Gevrek, and Christian Neumeier. 2020. Explaining the gender gaps in mathematics achievement and attitudes: The role of societal gender equality. Economics of Education Review 76: 101978. [Google Scholar] [CrossRef]
- Ghaith, Ghazi M. 2002. The relationship between cooperative learning, perception of social support, and academic achievement. System 30: 263–73. [Google Scholar] [CrossRef]
- Gibbs, Benjamin G. 2010. Reversing fortunes or content change? gender gaps in math-related skill throughout childhood. Social Science Research 39: 540–69. [Google Scholar] [CrossRef]
- Giuliano, Paola. 2020. Gender and culture. Oxford Review of Economic Policy 36: 944–61. [Google Scholar] [CrossRef]
- González de San Román, Ainara, and Sara De La Rica. 2012. Gender Gaps in Pisa Test Scores: The Impact of Social Norms and the Mother’s Transmission of Role Attitudes. IZA DP No. 6338. Available online: https://docs.iza.org/dp6338.pdf (accessed on 21 June 2022).
- Halpern, Diane F., and Simay Ikier. 2002. Biology, Society, and Behavior: The Development of Sex Differences in Cognition. Westport: Ablex Publishing, pp. 3–19. [Google Scholar]
- James, Gareth, Daniela Witten, Trevor Hastie, and Robert Tibshirani. 2013. An Introduction to Statistical Learning. Berlin/Heidelberg: Springer, vol. 112. [Google Scholar]
- Jaremus, Felicia, Jennifer Gore, Elena Prieto-Rodriguez, and Leanne Fray. 2020. Girls are still being ‘counted out’: Teacher expectations of high-level mathematics students. Educational Studies in Mathematics 105: 219–36. [Google Scholar] [CrossRef]
- Jerrim, John, Luis Alejandro Lopez-Agudo, and Oscar D. Marcenaro-Gutierrez. 2020. Does it matter what children read? new evidence using longitudinal census data from spain. Oxford Review of Education 46: 515–33. [Google Scholar] [CrossRef]
- Lee, Jaekyung. 2012. Educational equity and adequacy for disadvantaged minority students: School and teacher resource gaps toward national mathematics proficiency standard. The Journal of Educational Research 105: 64–75. [Google Scholar] [CrossRef]
- Lee, Valerie E., Julia B. Smith, and Robert G. Croninger. 1997. How high school organization influences the equitable distribution of learning in mathematics and science. Sociology of Education 70: 128–50. [Google Scholar] [CrossRef]
- Levine, Susan C., Marina Vasilyeva, Stella F. Lourenco, Nora S. Newcombe, and Janellen Huttenlocher. 2005. Socioeconomic status modifies the sex difference in spatial skill. Psychological Science 16: 841–45. [Google Scholar] [CrossRef] [PubMed]
- Lewis, Roger J. 2000. An introduction to classification and regression tree (cart) analysis. Paper presented at Annual Meeting of the Society for Academic Emergency Medicine, San Francisco, CA, USA, May 22–25. [Google Scholar]
- Machin, Stephen, and Patrick A Puhani. 2003. Subject of degree and the gender wage differential: Evidence from the uk and germany. Economics Letters 79: 393–400. [Google Scholar] [CrossRef]
- Marsh, Herbert W., and Andrew J. Martin. 2011. Academic self-concept and academic achievement: Relations and causal ordering. British Journal of Educational Psychology 81: 59–77. [Google Scholar] [CrossRef]
- Martins, Lurdes, and Paula Veiga. 2010. Do inequalities in parents’ education play an important role in pisa students’ mathematics achievement test score disparities? Economics of Education Review 29: 1016–33. [Google Scholar] [CrossRef]
- Masci, Chiara, Geraint Johnes, and Tommaso Agasisti. 2018. Student and school performance across countries: A machine learning approach. European Journal of Operational Research 269: 1072–85. [Google Scholar] [CrossRef]
- Mejias, Paulina Perez, Dora Elias McAllister, Karina G. Diaz, and Javiera Ravest. 2021. A longitudinal study of the gender gap in mathematics achievement: Evidence from chile. Educational Studies in Mathematics 107: 583–605. [Google Scholar] [CrossRef]
- Mizala, Alejandra, Francisco Martínez, and Salomé Martínez. 2015. Pre-service elementary school teachers’ expectations about student performance: How their beliefs are affected by their mathematics anxiety and student’s gender. Teaching and Teacher Education 50: 70–78. [Google Scholar] [CrossRef]
- Moss, Gemma, and John W. McDonald. 2004. The borrowers: Library records as unobtrusive measures of children’s reading preferences. Journal of Research in Reading 27: 401–12. [Google Scholar] [CrossRef]
- Munir, Farzana, and Rudolf Winter-Ebmer. 2018. Decomposing international gender test score differences. Journal for Labour Market Research 52: 1–17. [Google Scholar] [CrossRef]
- OECD. 2016. PISA 2015 Results (Volume I). Paris: OECD. [Google Scholar] [CrossRef]
- OECD. 2019a. PISA 2018 Results (Volume II). Paris: OECD. [Google Scholar] [CrossRef]
- OECD. 2019b. PISA 2018 Results (Volume III): What School Life Means for Students’ Lives. Paris: OECD. [Google Scholar]
- Pajares, Frank. 2005. Gender Differences in Mathematics Self-Efficacy Beliefs. Cambridge: Cambridge University Press. [Google Scholar]
- Pellagatti, Massimo, Chiara Masci, Francesca Ieva, and Anna M. Paganoni. 2021. Generalized mixed-effects random forest: A flexible approach to predict university student dropout. Statistical Analysis and Data Mining: The ASA Data Science Journal 14: 241–57. [Google Scholar] [CrossRef]
- Piazzalunga, Daniela. 2018. The gender wage gap among college graduates in italy. Italian Economic Journal 4: 33–90. [Google Scholar] [CrossRef]
- Rainey, Katherine, Melissa Dancy, Roslyn Mickelson, Elizabeth Stearns, and Stephanie Moller. 2019. A descriptive study of race and gender differences in how instructional style and perceived professor care influence decisions to major in stem. International Journal of STEM Education 6: 1–13. [Google Scholar] [CrossRef]
- Schiltz, Fritz, Chiara Masci, Tommaso Agasisti, and Dániel Horn. 2017. Using Machine Learning to Model Interaction Effects in Education: A Graphical Approach. MOX-Report No. 31/2017. Available online: https://www.mate.polimi.it/biblioteca/add/qmox/31-2017.pdf (accessed on 21 June 2022).
- Schleicher, Andreas. 2019. Pisa 2018: Insights and Interpretations. Paris: OECD Publishing. [Google Scholar]
- Sikora, Joanna, and David GW Pitt. 2019. Does advanced mathematics help students enter university more than basic mathematics? gender and returns to year 12 mathematics in australia. Mathematics Education Research Journal 31: 197–218. [Google Scholar] [CrossRef]
- Starr, Christine R., and Sandra D. Simpkins. 2021. High school students’ math and science gender stereotypes: Relations with their stem outcomes and socializers’ stereotypes. Social Psychology of Education 24: 273–98. [Google Scholar] [CrossRef]
- Steinthorsdottir, Olof Bjorg, and Bharath Sriraman. 2008. Exploring gender factors related to pisa 2003 results in iceland: A youth interview study. ZDM 40: 591–600. [Google Scholar] [CrossRef]
- Tomassini, Cecilia. 2021. Gender gaps in science: Systematic review of the main explanations and research agenda. Education in the Knowledge Society (EKS) 22: 25. [Google Scholar] [CrossRef]
- Torche, Florencia. 2015. Analyses of intergenerational mobility: An interdisciplinary review. The ANNALS of the American Academy of Political and Social Science 657: 37–62. [Google Scholar] [CrossRef]
- UNICEF. 2020. Towards an Equal Future: Reimagining Girls’ Education through Stem. Available online: https://www.unicef.org/media/84046/file/Reimagining-girls-education-through-stem-2020.pdf (accessed on 25 June 2022).
- van Hek, Margriet, Claudia Buchmann, and Gerbert Kraaykamp. 2019. Educational systems and gender differences in reading: A comparative multilevel analysis. European Sociological Review 35: 169–86. [Google Scholar] [CrossRef]
- Wang, Yurou, Mengya Xia, Wenjing Guo, Fangjie Xu, and Yadan Zhao. 2022. Academic performance under covid-19: The role of online learning readiness and emotional competence. Current Psychology. [Google Scholar] [CrossRef]
- Zhou, Yisu, Xitao Fan, Xiaoxin Wei, and Robert H. Tai. 2017. Gender gap among high achievers in math and implications for stem pipeline. The Asia-Pacific Education Researcher 26: 259–69. [Google Scholar] [CrossRef]


| Variable | PISA Code | Type | Description |
|---|---|---|---|
| Student’s family characteristics | |||
| Mother edu | ST005 and ST006 | cat | Indicate the highest level of education achieved by the mother and it is based on the questions ST005 and ST006. 0 = primary education not completed, 1 = complete primary education, 2 = complete lower secondary education, 3 = complete upper secondary education, 4 = complete post-secondary non tertiary education, 5 = complete tertiary education, 6 = complete postgraduate education |
| Parent support | EMOSUPS | num | Standardized indicator of parents’ emotional support. It was constructed by PISA on the base of question ST123 and it ranges between −2.447 and 1.035. |
| ESCS | ESCS | num | Standardized index of economic, social and cultural status, derived by PISA, based on the parents’ highest level of education (PARED), parents’ highest occupational status (HISEI), and home possessions (HOMEPOS), including Books in the home |
| Foreign language | ST022Q01TA | 0/1 | Language that the students speak at home. 0 = same language as at school, 1 = different language |
| ICT resources | ICTRES | num | Standardized indicator of ICT home possessions. It ranges between −3.968 and 3.612 |
| Student’s perceptions and attitudes | |||
| Fear failure | GFOFAIL | num | Standardized indicator of the fear of failure of the student. It is based on question ST183 and it ranges between −1.894 and 1.891 |
| Feel awkward * | ST034Q04TA | 0/1 | Indicator based on the sentence ‘ feel awkward and out of place in my school’. 0 = (strongly) disagree with the sentence, 1 = (strongly) agree with the sentence |
| Feel outsider * | ST034Q01TA | 0/1 | Indicator based on the sentence ‘ feel like an outsider (or left out of things) at school’. 0 = (strongly) disagree with the sentence, 1 = (strongly) agree with the sentence |
| Self confidence * | ST034Q05TA | 0/1 | Indicator based on the sentence ‘Other students seem to like me.’ 0 = (strongly) disagree with the sentence, 1 = (strongly) agree with the sentence |
| Sociable * | ST034Q02TA | 0/1 | Indicator based on the sentence ‘ make friends easily at school.’ 0 = (strongly) disagree with the sentence,1 = (strongly) agree with the sentence |
| Enjoyment reading | ST175Q01IA | cat | Time spent by the students reading for enjoyment. 0 = no time, 1 = less than 30 min per day, 2 = between 30 and 60 min per day, 3 = between 1 and 2 h, 4 = more than 2 h |
| Class and school environment | |||
| Teach support (global) | TEACHSUP | num | Standardized indicator of teacher support, constructed by PISA on the base of question ST100. It ranges between −2.743 and 1.341 |
| Discipline language class | DISCLIMA | num | Standardized indicator of disciplinary climate in the language-of-instruction lessons, provided by PISA. It is based on ST097 and it ranges between −2.712 and 2.034. |
| Longest book | ST154Q01HA | cat | Number of pages of the longest text the student had to read for school. 1 = one page or less, 2 = between 2 and 10 pages, 3 = between 11 and 50 pages, 4 = between 51 and 100 pages, 5 = between 101 and 500 pages, 6 = more than 500 pages |
| Class size | CLSIZE | num | Number of students in the class, it ranges between 13 and 53. |
| Perception cooperation | PERCOOP | num | Cooperation climate perceived by students, it is a standardized indicator computed by PISA based on question ST206. and it ranges between −2.143 and 1.676 |
| Group 1 | Group 2 | Group 3 | ||||
|---|---|---|---|---|---|---|
| Female | Male | Female | Male | Female | Male | |
| PISA score | ||||||
| () | () | () | () | () | () | |
| Student’s family characteristics | ||||||
| Mother edu | ||||||
| () | () | () | () | () | () | |
| Parent support | ||||||
| () | () | () | () | ( | () | |
| ESCS | ||||||
| () | () | () | () | () | () | |
| Foreign language | ||||||
| () | () | () | () | () | () | |
| ICT resources | ||||||
| () | () | () | () | () | () | |
| Student’s perceptions and attitudes | ||||||
| Fear failure | ||||||
| () | () | () | () | () | () | |
| Feel awkward | ||||||
| () | () | () | () | () | () | |
| Feel outsider | ||||||
| () | () | () | () | () | () | |
| Self confidence | ||||||
| () | () | () | () | () | () | |
| Sociable | ||||||
| () | () | () | () | () | () | |
| Enjoyment reading | ||||||
| () | () | () | () | () | () | |
| Class climate and features | ||||||
| Teach support | ||||||
| () | () | () | () | () | () | |
| Discipline language class | ||||||
| () | () | () | () | () | () | |
| Longest book | ||||||
| () | () | () | () | () | () | |
| Class size | ) | |||||
| () | () | () | () | () | () | |
| Perception cooperation | ||||||
| () | () | () | () | () | () | |
| Sample Size | 69,303 | 65,406 | 15,738 | 15,645 | 8919 | 9201 |
| Group 1 | Group 2 | Group 3 | ||||
|---|---|---|---|---|---|---|
| Female | Male | Female | Male | Female | Male | |
| Student’s family charactersitics | ||||||
| Mother edu | 5 | 4 | 6 | 6 | 5 | 5 |
| () | () | () | () | () | () | |
| Parent support | 14 | 16 | 12 | 12 | 8 | 8 |
| () | () | () | () | () | () | |
| ESCS | 1 | 1 | 1 | 1 | 1 | 1 |
| () | () | () | () | () | () | |
| Foreign language | 15 | 13 | 14 | 7 | 6 | 6 |
| () | () | () | () | () | () | |
| ICT resources | 7 | 7 | 8 | 9 | 4 | 9 |
| () | () | () | () | () | () | |
| Student’s perceptions and attitudes | ||||||
| Fear failure | 16 | 15 | 15 | 16 | 11 | 11 |
| () | () | () | () | () | () | |
| Feel awkward | 11 | 8 | 10 | 13 | 15 | 10 |
| () | () | () | () | () | () | |
| Feel outsider | 9 | 11 | 13 | 10 | 9 | 4 |
| () | () | () | () | () | () | |
| Self confidence | 10 | 12 | 16 | 15 | 7 | 7 |
| () | () | () | () | () | () | |
| Sociable | 8 | 14 | 9 | 14 | 13 | 12 |
| () | () | () | () | () | () | |
| Enjoyment reading | 3 | 5 | 4 | 5 | 2 | 2 |
| () | () | () | () | () | () | |
| Class and school environment | ||||||
| Teach support | 13 | 10 | 11 | 11 | 16 | 14 |
| () | () | () | () | () | () | |
| Discipline language class | 6 | 6 | 7 | 8 | 10 | 13 |
| () | () | () | () | () | () | |
| Longest book | 2 | 3 | 2 | 2 | 3 | 3 |
| () | () | () | () | () | () | |
| Class size | 12 | 9 | 3 | 4 | 14 | 16 |
| () | () | () | () | () | () | |
| Perception cooperation | 4 | 2 | 5 | 3 | 12 | 15 |
| () | () | () | () | () | () | |
| % explained variance-RF | 23.74 | 22.78 | 30.14 | 29.28 | 18.36 | 21.61 |
| PVRE | 10.07 | 7.81 | 8.52 | 8.58 | 0.82 | 1.55 |
| MSE | 0.587 | 0.597 | 0.281 | 0.296 | 0.303 | 0.317 |
Disclaimer/Publisher’s Note: The statements, opinions and data contained in all publications are solely those of the individual author(s) and contributor(s) and not of MDPI and/or the editor(s). MDPI and/or the editor(s) disclaim responsibility for any injury to people or property resulting from any ideas, methods, instructions or products referred to in the content. |
© 2023 by the authors. Licensee MDPI, Basel, Switzerland. This article is an open access article distributed under the terms and conditions of the Creative Commons Attribution (CC BY) license (https://creativecommons.org/licenses/by/4.0/).
Share and Cite
Bertoletti, A.; Cannistrà, M.; Diaz Lema, M.; Masci, C.; Mergoni, A.; Rossi, L.; Soncin, M. The Determinants of Mathematics Achievement: A Gender Perspective Using Multilevel Random Forest. Economies 2023, 11, 32. https://doi.org/10.3390/economies11020032
Bertoletti A, Cannistrà M, Diaz Lema M, Masci C, Mergoni A, Rossi L, Soncin M. The Determinants of Mathematics Achievement: A Gender Perspective Using Multilevel Random Forest. Economies. 2023; 11(2):32. https://doi.org/10.3390/economies11020032
Chicago/Turabian StyleBertoletti, Alice, Marta Cannistrà, Melisa Diaz Lema, Chiara Masci, Anna Mergoni, Lidia Rossi, and Mara Soncin. 2023. "The Determinants of Mathematics Achievement: A Gender Perspective Using Multilevel Random Forest" Economies 11, no. 2: 32. https://doi.org/10.3390/economies11020032
APA StyleBertoletti, A., Cannistrà, M., Diaz Lema, M., Masci, C., Mergoni, A., Rossi, L., & Soncin, M. (2023). The Determinants of Mathematics Achievement: A Gender Perspective Using Multilevel Random Forest. Economies, 11(2), 32. https://doi.org/10.3390/economies11020032