Article

Fertility in Russia: A Re-Examination Using Microdata

1
Institute of Economic Research, Hitotsubashi University, 2-1 Naka, Kunitachi, Tokyo 186-8603, Japan
2
Ipsos, Verhnya Krasnoselskaya St. 3, bld. 2, Business Center “Krasnoselsky”, 107140 Moscow, Russia
*
Author to whom correspondence should be addressed.
Economies 2023, 11(10), 245; https://doi.org/10.3390/economies11100245
Submission received: 31 July 2023 / Revised: 22 September 2023 / Accepted: 2 October 2023 / Published: 4 October 2023
(This article belongs to the Section Health Economics)

Abstract

:
This paper employs the microdata of the Russia Longitudinal Monitoring Survey (RLMS-HSE) to discuss the impact of economic factors, such as household income and female wages, and subjective well-being, such as life satisfaction and health condition, on childbirth probability in Russia, which, following a continuous decline in birth rate throughout the 1990s, began to increase in the 2000s, and rose thereafter almost continuously. The following results were obtained: higher household incomes serve to encourage childbirth, while female wages are seen to act by curtailing childbirth, and when indicators such as life satisfaction and health condition are high, the likelihood of childbirth is increased significantly. Most previous research concerning the determinants of the birth rate in Russia has shown that household income has no effect at all, but the findings in this paper suggest that this may have been due to the special circumstances that existed at the beginning of the economic transformation period in the 1990s.

1. Introduction

Fertility in advanced countries is known to be low, and it is also known that so-called eastern European and central European countries experienced rapid drops in their fertility from the beginning of the systemic transformation in 1989–1991, and then a long period of consistently low birth rates (Philipov and Dorbritz 2003). Among these countries, Russia, which faced a population crisis, attracted a lot of attention1 (Vishnevskii 2006). In other words, in 2000, the total fertility rate (TFR) in all the central/eastern European transition countries, except Albania, the former Yugoslavia, and Moldova, was below 1.5, but in Russia, it dropped as far as 1.16 (1999) and 1.19 (2000) (Council of Europe 2005. See Table 1).
However, in Russia, this trend came to a halt in 1999–2000 and the TFR turned upward. It then climbed more or less continuously, and, in 2015, reached its highest level (1.77) since the collapse of the Soviet Union. It then started to fall again, dropping for four straight years from 2016 onwards, such that, in 2019, the TFR was back to the same level (1.50) it had been in 2008, a decade earlier2. The ongoing decline in birth rate observed for just under 10 years from the beginning of the systemic transformation occurred in tandem with a shrinkage of the Russian economy. The continuous increase in the birth rate until 2015 can be said to match the upturn in the Russian economy that became evident from 2000. On the other hand, the economic sanctions that Western nations imposed on Russia in 2014 after the Crimea conflict led to a decline in Russia’s economic growth rate, and a downward trend in the birth rate began to be observed at the same time.
Regarding the investigation of Russia’s fertility, which has exhibited such tumultuous changes, it is still difficult to say that it has been adequate compared to developments in birth rate research in the West. It has to be pointed out that such analyses in the West and Russia itself remain limited in terms of quantity. Iwasaki and Kumo (2020) employed regional data to demonstrate that the growth in the total output of a region has a significant impact on changes in the birth rate. However, a number or previous studies have shown that economic factors such as household income levels have not affected the trend with the birth rate in Russia (Kohler and Kohler 2002; Roschina and Boikov 2006; Kumo 2012; Karabchuk 2017a). The trend of macroeconomic dynamics and that of the birth rate described above are seen to match each other, but it remains unclear whether this is indicative of a cause–effect relationship. On the other hand, almost 30 years has passed since the start of the systemic transformation, and microdata that allow for an analysis to be performed have been accumulated, so it can be said that enough time has passed for us to revisit the research that has been conducted up until now. Research on the impact of household income, women’s wages, and well-being on fertility in Russia is, however, still lacking in this respect. This gap must therefore be filled: thus, these variables will be examined in the article.
International comparisons of income levels and fertility rates already show that countries with higher income levels have lower fertility rates (Becker 1960). However, within a country, the study that fertility is higher in high-income households that can bear the cost of child rearing is also convincing enough (Kolk 2022; Hopcroft 2022). Examining the relevance of the latter in Russia would further broaden the implications for the relationship between household income levels and fertility within a country. With such circumstances in the background, this paper attempts to pick out the factors that determine childbirth probability in Russia, and its main focus is the investigation of economic conditions such as household incomes and the wage levels of women.
This paper is organized as follows. In the next section, the author provides an overview of the trend over time of Russia’s fertility, from the beginning of the systemic transformation to 2018. After that, previous studies conducted during the same period are reviewed, and the author attempts to pick out the factors that determine the birth rate. Here, and as mentioned earlier, the impact exerted by economic factors such as income has, in the case of Russia, been shown to be tricky to assess, so the author presents hypotheses that reflect the results from previous research covering different regions. Then, in Section 4, the data and analysis results are presented, before finally mentioning the possible implications for policy.

2. Fertility Trends in Russia

In the postwar Soviet Union, childbirth was continuously encouraged, on the grounds that the revolution, the civil war, and the fight with Germany during the Second World War led to huge losses of life and that a large workforce was needed for industrial expansion. From the 1960s, as Western advanced countries saw rapid declines in their birth rates, socialist nations, with their plentiful social childcare facilities (nursery schools and kindergartens under the control of companies or government organizations), maintained birth rates of just over 2.0, enough to sustain their populations, until 1989 (Kumo 2012).
After the collapse of the Soviet Union, however, the network of social childcare facilities weakened swiftly. Those that had been operated by companies for their employees, which were almost free of charge, were either closed or charges were introduced. This led directly to an increase in the cost of childcare3. Furthermore, the economic crisis that accompanied the systemic transformation resulted in a sharp decrease in the size of the economy. Because of this, the ability of the new generation to bear the cost of childrearing declined. The Soviet Union was known for its generous social security system (McAley 1979). However, the systemic transformation destroyed the foundation of this system. The Soviet labor market was also characterized by stable employment, an absence of unemployment, and stable, though not especially high, wages. However, such features were lost with the systemic transformation. Factors like these compounded one another, and the end result was a rapid drop in Russia’s total fertility rate, which slumped to below 1.20 in 1999 and 2000 (Figure 1).
The Russian government came out with various measures for addressing this situation. In “Demographic Policy Concept of the Russian Federation until 2015,”4 a document that the Russian federal government produced in 2001, the government promised to take steps to improve the health of its citizens and increase fertility. At that time, however, no new measures to tackle the falling birth rate and rising death rate were taken. In other words, the document did not have any real meaning.
In the policy arena, a turning point arrived during the latter half of the first Mr. Putin administration, after sustained economic growth had begun. It is by no means an overstatement to say that, from the 1990s to the early 2000s, the Russian government’s social policies were nothing more than talk. However, that situation underwent substantial change in the latter half of the 2000s. In 2005/2006, President Putin, in his annual addresses to the Federal Assembly, mentioned the issue of the slumping birth rate, and stated that increasing it was a goal. Following this, in December 2006, the childcare allowance, etc., was raised5, while a new “mothers’ fund”6 was established as a government-funded scheme that would provide large sums of money for having children. The “mothers’ fund” provided parents with two or more children with a total of RUB 250,000 (approx. USD 11 thousand at that time) as a subsidy for one of home, education, or pension, and this applied to children born/adopted between 1 January 2007 and 31 December 2016. Given that the average monthly income of Russians in September 2007 was RUB 12,000, this can be said to be a massive amount7. Furthermore, the law has been repeatedly extended, and is now to be applied until 20268.
However, what needs to be kept in mind here is that the rise in the birth rate can be seen to have begun in 2001, prior to the introduction, in 2006, of the government-funded scheme that can be viewed as a measure aimed at encouraging people to have children. In other words, the inflection from a declining to a rising birth rate can be regarded as matching the start of economic growth, and this can also be seen here (Figure 1). This increase in the birth rate continued even with the 2008 financial crisis that followed the collapse of Lehman Brothers occurring in the interim. However, following the unrest in Ukraine and the annexation of Crimea in 2014, the birth rate peaked in 2015 (TFR: 1.78) and then continued to decline, such that, by 2019, it had returned to the same level it had been in 2008 (TFR: 1.50).
What is interesting here is the following question: What sort of effect do economic factors have on childbirth probability among Russian women? If factors such as economic growth, income increases, and wages exert a positive impact, the policies of the Russian federal government, which encourage childbirth, can be said to be rational. However, if they do not have any effect on childbirth probability, the assessment of these policies themselves will inevitably have to be negative. This emphasizes the need to add an investigation of the impact of economic factors. At the same time, though, if such factors do have any impact, differences in the attitudes or assessments of each woman toward such conditions will result in differences in the childbirth behavior of the individuals concerned.
These factors can only be investigated when microdata are available, but research on Russia is still extremely limited, and exploring the impact of economic factors such as income levels, as well as subjective attitudes toward childbirth behavior among Russian women, could yield new insights. To provide a background to such recognition, in Section 3, the next section, the author will examine previous research and present hypotheses that can be derived from it.

3. Previous Research

In Russia, which saw a rapid decline in its fertility following the collapse of the Soviet Union, this phenomenon was picked up at an early stage (Vishnevskii 2006). However, it has to be said that it took time to analyze the factors behind it. First, it can be pointed out that a certain amount of data covering a certain period of time needed to be accumulated. At the beginning of the systemic transformation, analyses were limited by the fact that there was no alternative other than to rely on macrodata. Not only in Russia itself, but also in the West, descriptive research was conducted continuously. At the very beginning, most research declared, based on the correlation between economic growth rate and per capita gross domestic product (GDP), that the drop in the birth rate was due to economic shrinkage in connection with the systemic transformation (DaVanzo and Grammich 2001). Later, from the 2000s onwards, a few studies employing microdata have been conducted. However, generally, the results obtained assert that the effect of economic circumstances such as income levels is not significant in determining childbirth (Kohler and Kohler 2002; Grogan 2006; Roschina and Boikov 2006; Kumo 2012; Karabchuk 2017a). On the other hand, though, it would be difficult to claim, with respect to Russia, that adequate progress is being made in the investigation of the impact of differences in the assessments of individuals concerning subjective well-being. The purpose of this study is to plug that gap, but before that, let the author review the insights that have been obtained so far.

3.1. Economic Factors and Fertility

Observed at the macro level, the birth rates in high-income countries are generally seen to be lower, but regarding the relationship between the economic circumstances and the childbirth probability of an individual in a single country, Easterlin (1966) contended that individuals can be seen to have children when they expect to have a higher standard of living than they have experienced in the past. Interpretations based on this relative income hypothesis are widely known, and investigations of the hypothesis began to be conducted at an early stage (Easterlin 1973; Wachter 1975). Similarly, well-known is the analysis of fertility by Becker (1960) and also Ghez and Becker (1975). According to this, children are viewed as superior goods, and numerous previous studies have employed microdata to verify that the household income or income of the female partner itself exerts a positive income effect on fertility (Weeden et al. 2006; Bollen et al. 2007; Stanford and Smith 2013; Lovenheim and Mumford 2013; Mansour 2017). Furthermore, the hypothesis put forward by (Macunovich 1995), namely that the wages of women themselves become an opportunity cost and serve to reduce the birth rate, is supported in various findings (Macunovich 1995; Rondinelli et al. 2010; Kornstad and Ronsen 2018).
Looking at Russia, not many studies have analyzed the birth rate using forms from the survey conducted in the country (Russia Longitudinal Monitoring Survey, RLMS). Furthermore, the results obtained for household income and female wages are all extremely vague. In other words, Roschina and Boikov (2006), who used the RLMS to examine the impact of income on birth rate, took into account the effect of economic conditions such as income and employment status, but they were unable to obtain a significant coefficient for household income. Perelli-Harris (2006), meanwhile, employed only data for 1994, but also found that household income was not significant. However, Grogan (2006) used RLMS data from 1994 to 2001, and claimed that household income exerts a positive and significant effect on childbirth probability. In contrast, Grogan (2006) limited their sample to persons with spouses (total number of samples: 288) for the entire period; therefore, it cannot be determined whether their conclusions are widely applicable. Kumo (2012) employed data for 1995–2004, yet here too, household income was not significant. Karabchuk (2017b), which covered the period of 2000–2013, obtained significant and positive results for household income, but Karabchuk (2017a), which used data for 2000–2009, did not find household income to be significant. However, what has to be pointed out with regard to household income, as used in the previous research mentioned here, is that, with the exception of Kumo (2012), none of the studies employed an equivalence scale, using either household income itself or per capita income.
Apart from Kumo (2012), the only studies to include female wages were Karabchuk (2017b) and Zhuravleva and Gavrilova (2017). Karabchuk (2017b) obtained a significant and negative coefficient for female wages in the period of 2000–2013. Zhuravleva and Gavrilova (2017), meanwhile, in their analysis of the period up until 2004, found that female wages were not significant. For the period of 2005–2014, however, they contended that female wages had a significant, negative impact on childbirth probability. The amount of research accumulated so far is extremely limited, but investigations of female wages can be said to be consistent with predictions. As for household income, on the other hand, relatively few studies have concluded that it produces significant results, so more research is needed.

3.2. Subjective Welfare and the Birth Rate

As mentioned above, if the attitudes and assessments of each person toward the same condition differ, the effects of that condition could also be different. Because of this, since the start of the 2010s, in particular, more and more research on the impact of subjective well-being and its related indicators is being performed. In fact, most studies have shown that subjective well-being exerts a positive, significant impact on a childbirth probability. Cserepes et al. (2013) discovered, using a micro survey conducted in Hungary, that women whose subjective well-being level and health condition were poor did not seem to fall pregnant. Le Moglie et al. (2015), meanwhile, showed, based on a sociological panel study performed in Germany, that indicators of subjective well-being had a significant and positive effect on fertility. Luppi (2016) used Australian panel data for household income and expenditures covering the period from 2001 to 2012 to obtain the finding that a high subjective well-being and favorable health condition increase childbirth frequency. At the macro level, it can be pointed out that a lot of research has already been accumulated, such as that from Cetre et al. (2016) and MaRgolis and MyRskyla (2011).
In Russia, investigations were performed at a relatively early stage. Perelli-Harris (2006) examined the 1994 RLMS, and discovered that subjective well-being resulted in a significant rise in childbirth probability. On the other hand, Kohler and Kohler (2002) employed data from the long phase of economic contraction between 1995 and 1997 that followed the collapse of the Soviet Union, and produced results that were opposite to what would be intuitively assumed, namely that the childbirth probability was higher for people with a high degree of anxiety about their future lives. Karabchuk (2017b) and Zhuravleva and Gavrilova (2017), who analyzed the situation after 2000, both showed that childbirth probability was higher in the case of women for whom indicators of happiness and hope for the future were high. Investigations concerning the health condition of women have been similarly performed, but neither Roschina and Boikov (2006), nor Karabchuk (2017b) and Zhuravleva and Gavrilova (2017), obtained significant results for this.
As the above shows, in high-income countries, household income is generally seen to have a positive effect on childbirth probability, while the wages of women themselves are seen to have a negative effect, but in Russia, and as shown in Table 2, it is often the case that neither effect is significant. However, there are also differences depending on the period subject to analysis, and with regard to household income, Karabchuk (2017b) showed that it had a positive effect from 2000 onwards, while, with regard to female wages, both Karabchuk (2017b) and Zhuravleva and Gavrilova (2017) showed that it had a negative effect from the 2000s onwards. Furthermore, the results generally show that the level of subjective well-being promotes childbirth, but hardly any significant results have been seen for health condition. One possible reason for household income not being significant could be problems with the periods subject to analysis. On the other hand, and as mentioned earlier, it is also possible that there is a problem with not using an equivalence scale for household income. It is also likely that different results could be obtained for the 1990s, when economic conditions were continuously deteriorating, and the 2000s, when economic growth was more or less continuous.
The accumulated empirical research targeting various regions suggests that, even in the Russia of today, which is economically stable, household income exerts a significant, positive effect on childbirth probability. It can probably also be predicted that female wages serve as an opportunity cost and thus reduce this childbirth probability. As for health condition and subjective well-being, too, it is likely that, over the long term, they will increase the probability of childbirth in a stable fashion. In the next section, the author will focus on the above and attempt to analyze the factors that explain the fertility in Russia.

4. Analysis

4.1. Data and Method

4.1.1. Data

The data used in this paper comprise individual responses to the Russia Longitudinal Monitoring Survey-Higher School of Economics (RLMS-HSE) (Kozyreva et al. 2016)9. The RLMS is a micro survey of households and individuals in Russia that began being conducted on a trial basis in 1992, with the Carolina Population Center at North Carolina University in the United States as the primary administrator. It provides representativeness at the national level (Kozyreva et al. 2016), and aims to gather data from samples of at least 4000 households and 10,000 individuals, selected through stratified multi-stage random sampling. The purpose of the survey is to explore the changes in household consumption levels and health conditions occurring in conjunction with the economic system transformation, but detailed information about employment status and income, etc., is also collected. Starting in 2010, the Higher School of Economics, Moscow, Russia, began providing funding and organizing data. Furthermore, the data, which had hitherto only been available on request in paper format and for a fee, could now be used freely simply by registering online.
With each survey round, the questions are altered to some extent, and occasionally, the questionnaire is changed substantially. Basically, the “questions for women” asked in the survey can be used to find out about fertility. One of the questions is “Have you given birth to a child during the past 12 months?” and the author will use this as data for fertility.10
The response rates for household surveys, etc., conducted in Russia are generally extremely high. In the round for 1994, the first year of the RLMS panel survey, here too, 87.6% of households asked to respond to the survey did so. However, this was not the case for the two biggest cities of Moscow and St. Petersburg. In the first round (1994), the response rate for these two cities was 62.9%, a massive discrepancy with the 91.8% figure seen for all other regions (Kozyreva et al. 2016). This could affect the results. Of note is that, when Grogan (2006), who investigated the attrition in the RLMS sample, compared the sample for 1994 with that for 2001, she found that households with a spouse or children were significantly less likely to have dropped out of the survey. With these findings, it is probably necessary to acknowledge the fact that these are factors that could have an extremely powerful impact on birth rate.

4.1.2. Method

Here, the author will perform an analysis with a focus on how household income, the wages of women themselves, and subjective welfare affect childbirth behavior. As observed in Section 2, there is a correlation between macroeconomic trends and fluctuations in fertility. Here, however, the author wants to investigate whether the insights obtained from the studies of other countries match the childbirth behavior in modern Russia, even when viewed using microdata.
The RLMS data to be used are from 1994 to 2018. The data are for households/individuals, but they are an unbalanced panel. The author will explore how individual attributes, most notably female wages and subjective well-being, and household attributes such as household income in year t influence the childbirth behavior of the women concerned in year t + 1. The author will make women aged 18–45 years the sample11, and limit the subjects to ones with wage income. The analysis will also take into account the control variables that have been employed in previous research.
The following probit model will be estimated:
Pr(Yi,t = 1) = F(a + b1 × Xi,t−1+ b2 × Wi,t−1 + b3 × Hi,t−1 + b4 × Ii,t−1 + e)
Here:
  • Pr: Whether childbirth takes place;
  • Xi: Educational level/whether partner is present/number of persons in household/location of domicile;
  • Wi: Degree of happiness/health condition;
  • Hi: Household income;
  • Ii: Wages;
  • a, b1, b2, b3, and b4: Parameters to be estimated, e is the error term.
The focus of this paper is the impact on the likelihood of childbirth of these factors: (1) female wages, (2) household income, (3) subjective well-being, and (4) health condition. As the author saw in the previous section, female wages are expected to reduce the probability of childbirth. On the other hand, household income, subjective well-being, and health condition would be predicted to serve as encouraging childbirth. Furthermore, for wages and income, the analysis will consider the presence of nonlinearity by employing their square terms. As for control variables, the author will use (5) the presence of a partner, (6) the number of persons in the household, (7) educational level (high school education/middle school education), (8) the location of domicile (city or village), and (9) year dummy. Regarding the number of persons in the household, the results of previous research are complex, and clear predictions cannot be made. Little mention needs to be made of the fact that having a partner increases childbirth probability. As for educational level, multiple studies have found that, in Russia, women with a higher level of education give birth more frequently, so the author will confirm this. With regard to the location of domicile, it is likely that factors such as the cost of childrearing and the availability of help with childrearing within the home will reduce the childbirth probability among urban residents12.
As mentioned earlier, the explained variable is the binary variable of whether the woman had given birth, and the analysis will be a panel probit analysis to enable comparability with Roschina and Boikov (2006), Karabchuk (2017a, 2017b), and Zhuravleva and Gavrilova (2017), who investigated this matter most comprehensively.
Here, attention needs to be paid to the unfortunate fact that, with a panel probit analysis, the method of instrumental variables (IV) cannot be applied. Although it would be possible to employ IVs to perform a panel logistic analysis instead, given that this paper emphasizes the re-examination of and comparison with previous research, a panel probit analysis will be the main approach. The analysis will consider the avoidance of the endogeneity problem, and assign a one-period lag to all the explanatory variables. In addition, here, the author will take into account a serious problem in labor economics, which is determining female employment and wages rates simultaneously, and include only working women in the sample.
Regarding the variables introduced, the descriptive statistics are as listed in Table 3.

4.2. Results

The results of the panel probit analysis are shown in Table 4. In addition, the results of the panel logistic analysis, pooled logistic analysis, and pooled OLs are shown in Table 5, so that their stability can be confirmed. Note that, with the panel logistic analysis, there was a decisive problem with the analysis of childbirth probability, namely that, in the case of women who did not give birth to a child throughout the entire period, the explained variable was constant (=0), irrespective of time, and such samples were excluded from the analysis when the fixed effects model was applied. Therefore, the authors only present analysis results from the variable effects model. This is the same as the approach as that in Grogan (2006).
Overall, the results are qualitatively similar. What is consistent here is that the presence of a partner and the number of persons in the household, which are highly demographic variables, had a significant, positive impact on childbirth probability. This finding for the former is only to be expected, but as for the latter, it is possible that the reason for this is that it makes it easier to receive help with child rearing within the household after childbirth. As for higher education exerting a significant and positive effect, this has been shown to also apply to Russia (Grogan 2006; Kumo 2012; Karabchuk 2017b), which could indicate that there is a need to verify the permanent income hypothesis with respect to the childbirth behavior in Russia. Regarding middle school education, significant results could not be obtained. As for city domicile, which was introduced as a control variable, the results observed, namely that childbirth probability would be higher in cities, are opposite to what would be intuitively assumed. This is difficult to make sense of, but, as the author mentioned earlier, in large cities such as Moscow and St. Petersburg, refusal-to-respond and attrition rates are higher than those elsewhere (Kozyreva et al. 2016), so this could reflect the trend in cities where a social childrearing environment is more established but is relatively small13.
Looking at the economic factors that this paper is focused on, it was shown that the wages of women themselves exert a significant and negative effect on childbirth. Karabchuk (2017b) and Zhuravleva and Gavrilova (2017) pointed out that the same was true for a limited period, but here, the analysis was able to show that it was true for the entire period from 1995 to 2018. It is intuitively easy to understand that female wages function as an opportunity cost and act to suppress childbirth. Note that this square term always obtains a significant and positive coefficient, which means that the higher the wage level is, the weaker its tendency to suppress childbirth is.
Next, with regard to household income, the results are also clear. Income per person, calculated by simply dividing the household income by the number of persons in the household, was not significant. However, by applying three types of equivalence scales and performing estimates for each, it was shown that, in every case, it exerted a significant and positive effect on childbirth. The significance of this finding was emphasized when a comparison was made with previous research. Roschina and Boikov (2006) and Perelli-Harris (2006), whose analyses were centered on fertility in the 1990s, Kumo (2012), who investigated the same in 1995–2004, and Karabchuk (2017a) and Zhuravleva and Gavrilova (2017), whose research covered an even longer period, did not produce significant results for household income. The problem with these previous studies is that using household income as is or the per capita household income as calculated by dividing the household income by the number of persons in the household, namely, not using an equivalent scale, may have led to errors in the perception of household income. In fact, the results in Table 4 also show that only simple per capita household income was not significant.
On the other hand, because the period of analysis was from 1994 to 2018 in this paper, which is a long period of 25 years, there is a possibility that variation occurred over time in the impact of each factor. The author therefore attempted to classify the data for each time period and perform the same analysis for each of them. Thus, the author conducted an analysis after establishing the following time period classifications: (a) 1994–2000, when the Russian economy began to shrink, before bottoming out, with the birth rate also hitting bottom, (b) from then until 2014, a period during which the economy grew more or less continuously and the birth rate generally continued to rise, and (c) 2015–2018, when economic growth dipped conspicuously and the birth rate reversed course and started to fall. This time division is unbalanced in terms of the lengths of the periods: six years, fourteen years, and four years. However, what is most important for this analysis is to ensure that the impact of macroeconomic dynamics on household behavior is consistent. This means that the split of the period must be highly dependent on the economic growth rate, otherwise it would be difficult to understand the impact of income on fertility. This division of the time period will then reveal the peculiarities of the 1990s. The results of this analysis are shown in Table 614. Here, as the results of the analysis of childbirth between 1995 and 2000 show, income, be it simple per capita income or household income based on an equivalence scale, and whatever kind of specification is performed, is not significant (Table 6, (′1)–(′4)). It is therefore fair to say that they show a clear contrast with the results of the analyses of childbirth in 2001–2014 and later in 2015–2018 (Table 6, (′5)–(′12)). In other words, in the 1990s, on the whole, the level of household income can be considered to not have acted to promote childbirth. This is because the anticipated income effect only appeared after moving into the 2000s, and the fact that an analysis of the fertility determinants in Russia at an early stage during the turbulence of the systemic transformation did not produce significant results for household income could have been predicted, regardless of the definition of household income used15. With respect to this, the following interpretation is possible: in Becker’s fertility model (Becker 1960; Ghez and Becker 1975), the determinant of fertility is not variable income, but permanent income. In the 1990s, in Russia, the economic shrinkage and decline in personal incomes that accompanied the systemic transformation were so severe that they heightened uncertainty, with the result that most households probably viewed the fluctuating household incomes they were faced with as temporary. In contrast, with respect to the increase in incomes that occurred with the sustained economic recovery and growth from the 2000s, it would be possible to conclude that households interpreted such income changes as permanent, and therefore, a positive and significant coefficient for income was obtained16.
The author will also confirm another aspect that is a key issue, namely, the results obtained in connection with subjective well-being. As Table 4 shows, for all variables, coefficients were obtained as anticipated. The probability of childbirth was significantly higher among women who responded that they were “satisfied with life” than among those who did not respond as such. Furthermore, childbirth frequency was lower among those with health problems (who visited a hospital at least once a month), while among those who perceived their own physical condition as good, childbirth probability was shown to be higher. As seen earlier, even if the analysis was performed with time period classifications, being “satisfied with life” is consistently seen to increase the likelihood of childbirth (Table 6). According to the same analysis, regarding health condition, the results are complex with respect to whether actual visits to hospitals are frequent and the assessment of subjective recognition in terms of health condition. That being said, when a significant coefficient was obtained, it can be pointed out that the results always matched those presented Table 4 above. Putting together the results here, one can see that subjective well-being acted to increase the likelihood of childbirth, and in an extremely stable fashion. Overall, this matches the results of previous research for regions other than Russia, and it can also be confirmed that this was consistent over time. As for the subjective assessment of health condition and health, it can be said that, compared to previous research concerning the case of Russia, it is possible to grasp the significant impact more stably. Furthermore, because the effect exerted is likely to be different from that of the effect of income level, it is possible that improvements in economic conditions will not, in and of themselves, translate into a greater childbirth likelihood directly. Here, if one’s objective is to encourage childbirth, it might also be necessary to consider, for example, whether factors such as a narrowing in economic disparities produce positive outcomes.

5. Conclusions

In this paper, the author discussed the impact of economic factors, such as household income and female wages, and subjective welfare factors, such as life satisfaction and health condition, on childbirth probability in Russia, which, following a continuous decline in the birth rate throughout the 1990s, began to increase in the 2000s, and rose thereafter almost continuously. The following results were obtained: higher household incomes serve to encourage childbirth, while female wages are seen to act by curtailing childbirth, and when indicators such as life satisfaction and health condition are high, the likelihood of childbirth is increased significantly. Most previous research concerning the determinants of fertility in Russia has shown that household income has no effect at all, but the findings in this paper suggest that this may have been due to the special circumstances that existed at the beginning of the systemic transformation period in the 1990s.
The author mentioned earlier that generous financial assistance, such as the “mothers’ fund,” was introduced in Russia as a means of tackling the declining birth rate. If, at the individual level, household income exerts a positive impact on childbirth, such measures could produce positive results. To confirm this, however, it would be necessary to directly assess the effect of the introduction of these measures, and this can be said to be a study task for the future17.
When examining whether the rise in birth rate from 2000 onwards indicates that Russia’s declining fertility was halted, there is a risk that, in parallel with the economic growth rate, which dropped from 2010, the TFR from 2015 onwards was in a downward trend. Because a fall in the number of children being born depends on the age structure of the population, in Russia, where the absolute number of women of reproductive age is declining, this is, in some respects, unavoidable, but the drop in the TFR is something different entirely18. With the declining birth rate as a backdrop, on 7 May 2018, the Russian President Putin marked the first day of his fourth term in office by signing a decree of the president entitled “National Goals and Strategic Objectives of the Russian Federation through to 202419”. The decree articulated the policies the government would be pursuing during his new term. One of the priority areas stated in the decree was “National Projects: Demography”. Specifically, between 2019 and 2024, healthy lifespans would be extended and the birth rate would be increased (to a TFR of 1.7 in 2024)20. Thus, with the aims of providing economic assistance to households that produced children and expanding pre-school education facilities, the government came out with further policies based on fiscal spending. In addition, in his annual address to the Federal Assembly in 2019, President Putin stated that incentives such as tax breaks and low-interest loans would be offered to households with multiple children, and that the “mothers’ fund”, which had hitherto only been applied to second and subsequent children, would now be applied from the first child. Moreover, the relevant legislation was completed in March 202021.
In parallel with the introduction of the “mothers’ fund”, it is a fact that the TFR climbed on a sustained basis until 2015. Needless to say, however, caution is required in drawing interpretations as to whether this was a direct result of policy. If policy can resolve the problem of a low birth rate, it is difficult to explain why advanced countries, which have been implementing all sorts of measures, are still struggling with low birth rates. With the TFR appearing to be in a continuous downward trend since 2016, despite the presence of a generous benefit scheme in the form of the “mothers’ fund”, the following question needs to be asked: Are new policies like this actually effective? One can attempt to answer this only after keeping an eye on developments going forward22.

Author Contributions

Conceptualization, methodology, formal analysis, investigation, writing—original draft preparation, writing—review and editing, visualization, supervision, project administration, funding acquisition: K.K.; Resources, data curation: A.K. All authors have read and agreed to the published version of the manuscript.

Funding

This work was financially supported by a Grant-in-Aid for Scientific Research (B) (19H01478), Institute of Economic Research Hitotsubashi University (grant IERPK2020; IERPK2021; IERPK2023), and Mitsui Sumitomo International Cooperation Foundation 2022.

Informed Consent Statement

Informed consent was obtained from all subjects involved in the study.

Data Availability Statement

Data are open and available at http://hse.ru/rlms/ (accessed on 8 June 2020).

Acknowledgments

The authors are grateful to have received funding from the USAID, NIH (R01-HD38700), Higher School of Economics (Russia), and the Pension Fund of the Russian Federation, and permission to use the Russia Longitudinal Monitoring Survey—Higher School of Economics, provided by the Carolina Population Center and the Russian Academy of Sciences.

Conflicts of Interest
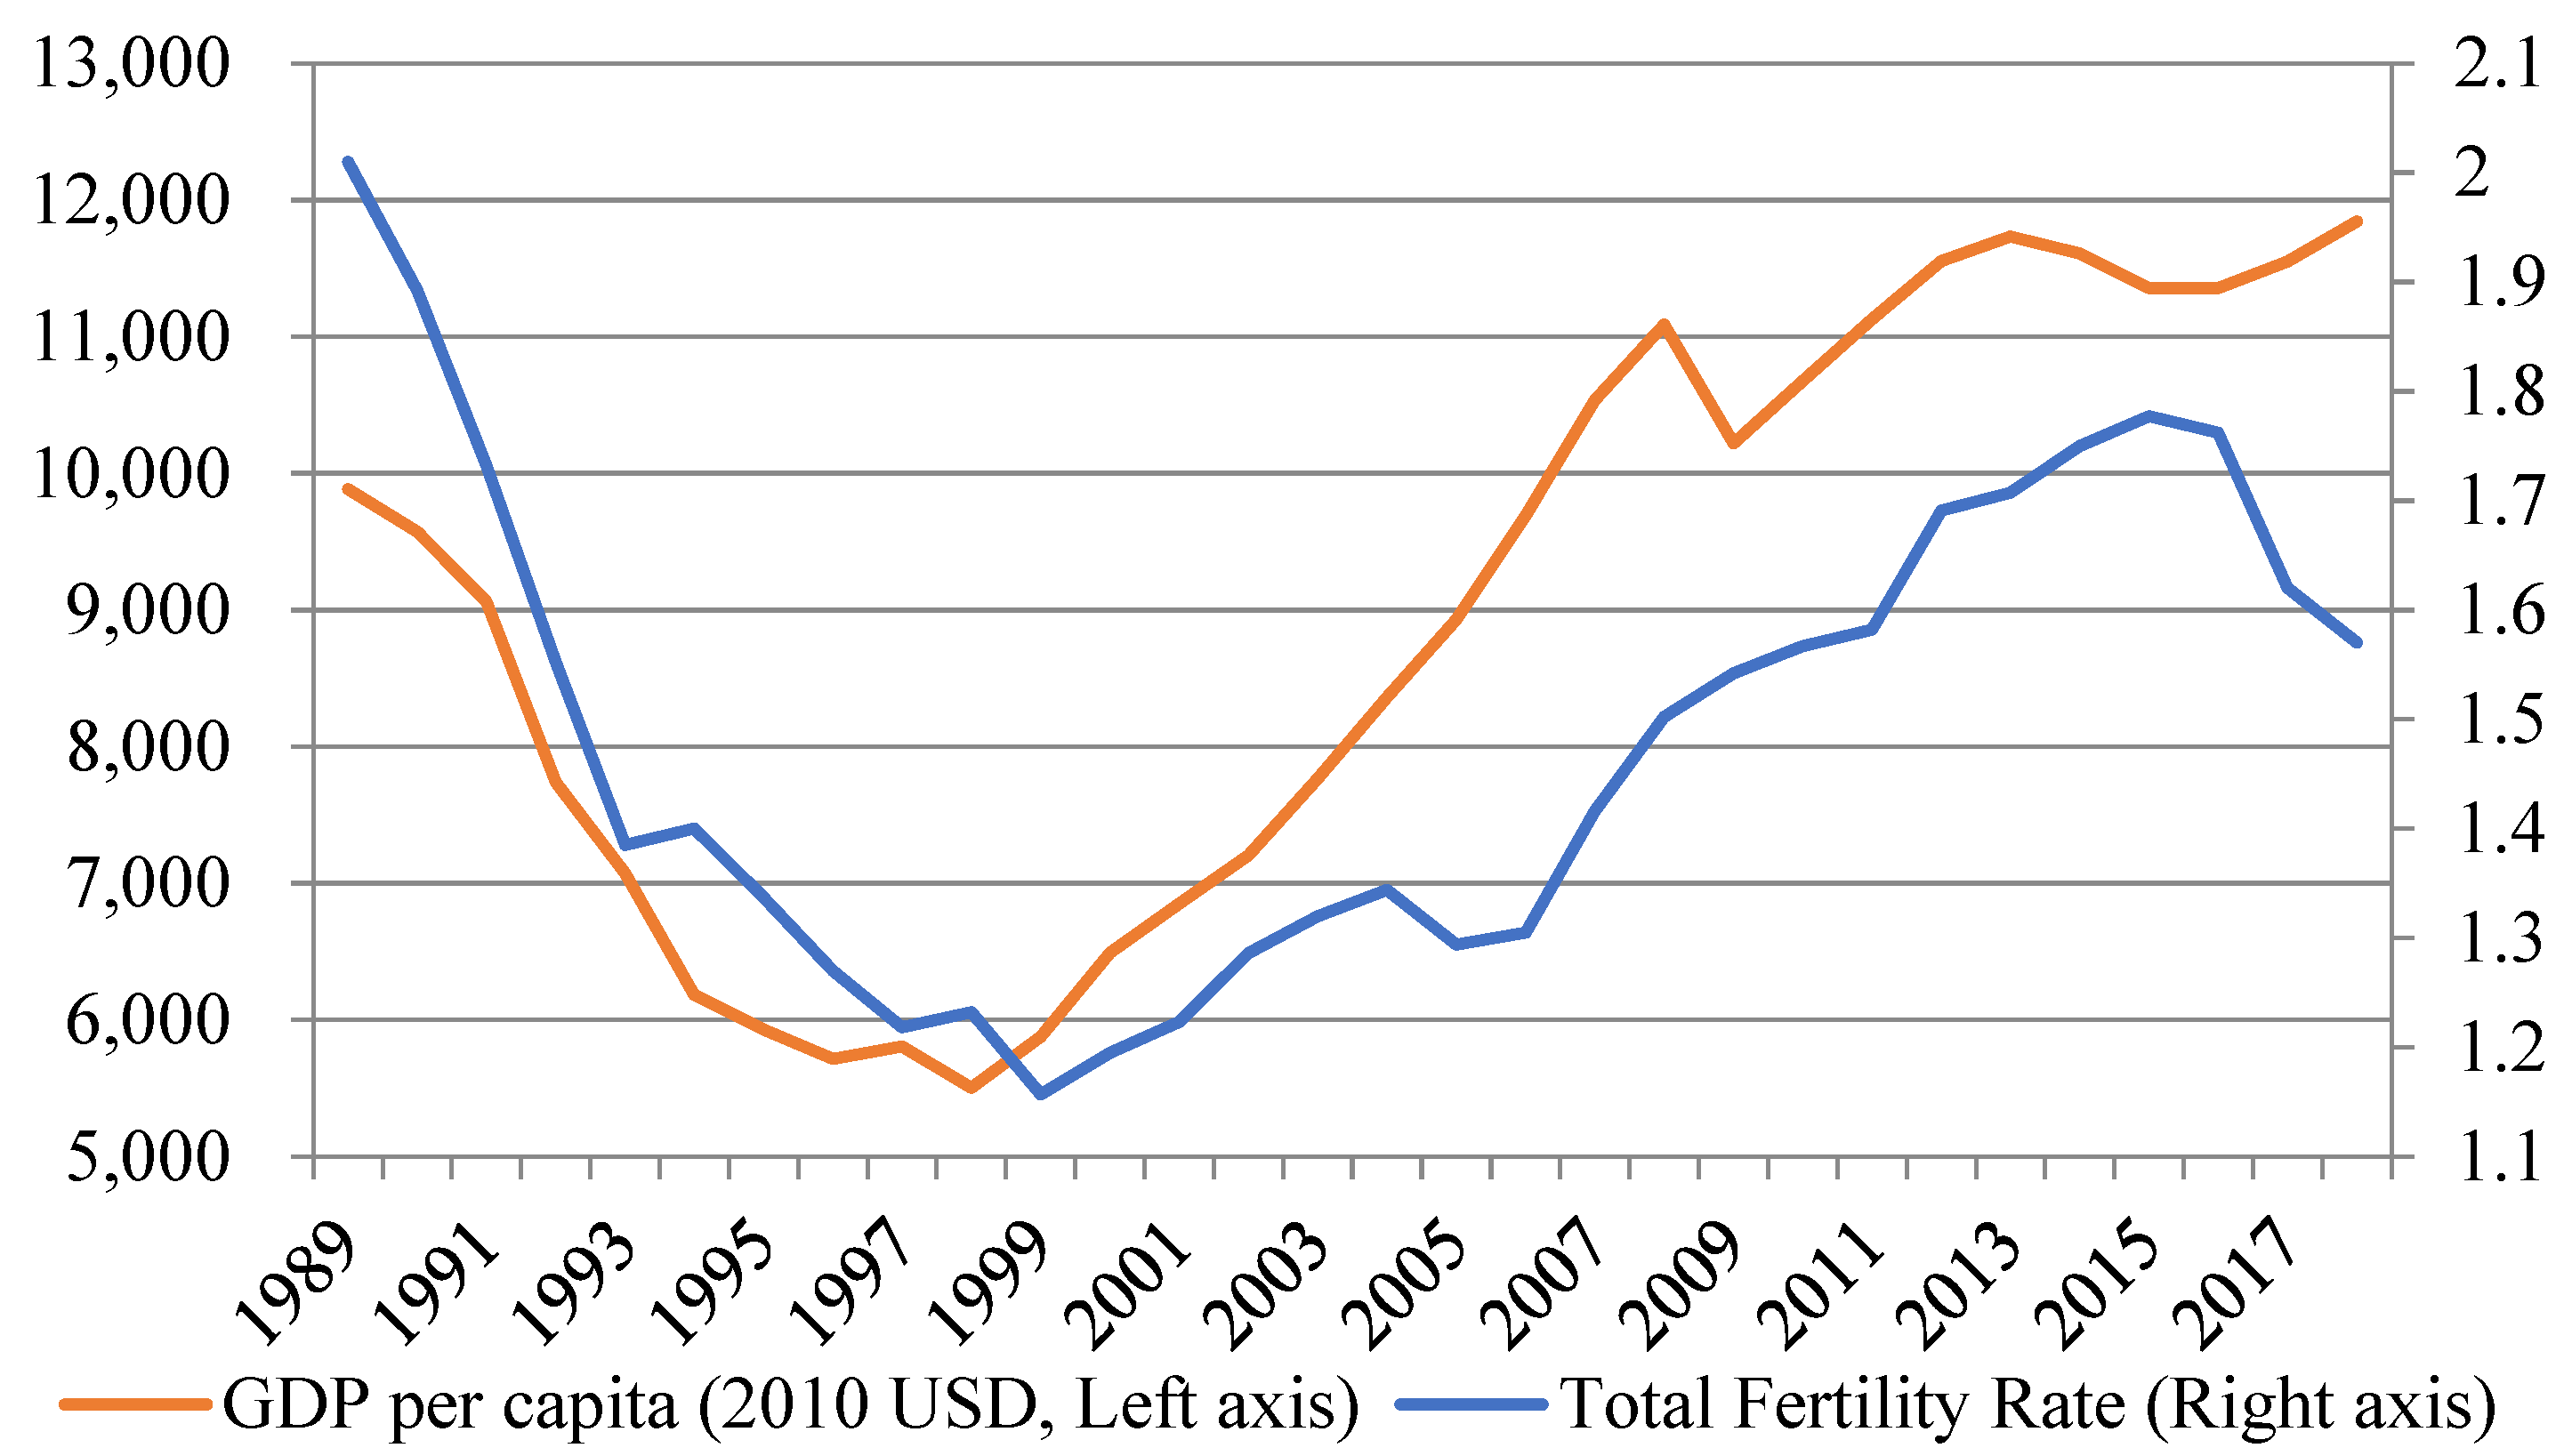
The authors declare no conflict of interest.

Notes

1
In Russia, it took just four years for the TFR to fall from over 2.0 (1989—the final year it exceeded 2.0) to below 1.50 (1993) (Rosstat 2008). In Japan, for example, it took 20 years for the TFR to complete a similar drop (from 2.05 in 1974 to 1.46 in 1993) (see Statistics Bureau of Japan, Ministry of Internal Affairs and Communications, Japanese Statistics 2020).
2
Russian Federal State Statistics Service (Rosstat) website, https://www.gks.ru/, accessed on 2 June 2021, preliminary figure.
3
Vechernaya Moskva, No.37, 3 February 2007; Vechernii Peterburg, 25 August 2009.
4
Rasporyazhenie pravitel’stva RF ot 24.09.2001 No.1270-r.
5
Federal’nyi zakon ot 5 dekabrya 2006, No.207-FZ o vnesenii izmenenii v otdel’nye akty Rossiiskoi Federatsii v chasti gosudarstvennoi podderzhki grazhdan, imeyushchikh detei (Federal act of 5 December 2006 “concerning amendments to multiple Russian federal laws and regulations relating to state assistance for citizens with children”). At that time, the childcare allowance, etc. was a flat 700 rubles (approx. 30 U.S. dollars at that time), but this was increased to 1500 rubles (approx. 60 USD at that time) for the first child and 3000 rubles (just under 130 USD at that time) for the second child and subsequent children. As stated in Federal’nyi zakon ot 1 marta 2008, No.18-FZ o vnesenii izmenenii v otdel’nye zakonodatel’nye akty Rossiiskoi Federatsii v tselyakh povysheniya razmerov otdel’nykh vidov sotsial’nykh vyplat i stoimosti nabora sotsial’nykh uslug (Federal act of 1 March 2008 “concerning amendments to multiple Russian federal laws and regulations needed to increase amounts of specific social benefits and social services”), these amounts are continuously revised based on the inflation rate.
6
Federal’nyi zakon ot 29 dekabrya 2006, No.256-FZ o dopolnitel’nykh merakh gosudarstvennoi podderzhki semei, imeyushchikh detei (Federal act of 29 December 2006 “concerning additional measures for state assistance for citizens with children”).
7
As with the childcare allowance, the amount is revised through annual indexation. Rossiiskaya gazeta, 14 February 2008, etc.
8
Following amendment of act mentioned in footnote 6 on 1 March 2020, ot 01.03.2020 No.35-FZ.
9
The website is https://www.hse.ru/en/rlms/ (accessed on 8 June 2020).
10
However, in the 9th, 19th, and 21st rounds (2000, 2010, and 2012), the participants were asked, “Have you experienced childbirth during the past two years?” Among the individuals who answered “yes” to this question, those for which it was possible to identify them as the mother of an infant younger than 12 months using a roster variable for determining household members will be used as the “have experienced childbirth within the past 12 months” group.
11
The total number of births by females aged 15–17 years and 46–49, who could be included in the reproductive age group, in all the data (for every year) was just three for the former and four for the latter, so the author deemed that it was not necessary to include them in the analysis.
12
Here, the reason that the author has hardly included any variables concerning women’s partners is to achieve alignment with previous research, as the study has emphasized comparability with previous research. Note that the analysis in this paper does not consider the viewpoints of demand for children as a satisfier of labor demand or demand for children as substitutes for social security. Regarding the former, in Russia, the proportion of children going on to higher education has been as high as it is in advanced countries (in 2010, the figure was over 60%. See World Development Indicators), so it is not necessary to take into account demand for children stemming from labor demand, which is seen in developing countries. As for the latter, meanwhile, in Russia social security schemes such as pensions do not differ greatly from region to region, and as Kumo (2021) points out, pension recipients are actually relatively unlikely to face poverty.
13
Note that the author also attempted to control fixed effects for the region of domicile by adopting a region dummy for eight federal districts, but the city domicile dummy remains positive and significant, but in almost every federal district, such as the Central Federal District, which includes Moscow, the dummy was not significant. It may be possible that the city domicile dummy indicates how favorable economic conditions are or how high the level of economic development is.
14
As with Table 5 with respect to Table 4, the author conducted panel logistic analysis, pooled logistic analysis, and pooled OLS. ASll the results are in line with the ones wshown in this article and therefore are not shown here.
15
However, according to Table 6, even after the 2000s, the results for simple per-capita income do not show a significant impact. In other words, it might be concluded that there was a problem with the specification of household income itself in previous research.
16
Note that when data is added for each year starting in the 1990s (1994 household/individual data), and analysis including all panel data is performed, equivalence-scale household income obtains a significant positive coefficient only when childbirth in 2013 is included. In previous research where the data was mainly for the early stage of the transformation period, significant results for household income could not be obtained, and results the same as this could therefore be seen. If a cross-sectional probit analysis is performed, equivalence-scale household income does not show a significant result until 2005, but from 2006 onwards, a stable and significant positive coefficient is obtained.
17
As mentioned in Section 2, the “mothers’ fund” only paid out for the second and subsequent children. Nothing in particular was offered with respect to the first child. Because the introduction of the law became public knowledge at the end of 2005 (29 December), and the law took effect on 1 January 2006, the announcement of the law probably had little impact on the probability of a first child being born in 2006. If that is the case, then until 2005, for example, if the birth rate for the first child is seen to move in a parallel with the birth rate for second child, but from 2006 onwards, a difference is observed in the birth rate for the first child and the second child, it might be possible to consider the possibility of applying differences-in-differences analysis.
18
This could also have been affected by the impact of the tendency, at the macro level, of women to have children later in life (Kumo 2012). In other words, if a cohort unit moves to later-age childbirth, the TFR will fall initially. Then, later, at the actual time of childbirth, the TFR will rise. After that, however, provided that the completed fertility rate does not rise, the TFR would be expected to decline once again.
19
Ukaz prezidenta Rossiiskoy federatsii ot 7 maya 2018 goda № 204 «O natsionalnykh tselyakh i strategicheskikh zadachakh razvitiya Rossiyskoy federatsii na period 2024 goda», Decree of the President of Russian Federation No. 204, 7 May 2018. (see http://en.kremlin.ru/events/president/news/57425 (accessed on 8 June 2020).
20
https://strategy24.ru/rf/demography/projects/natsional-nyy-proyekt-demografiya (website for “National Projects: Demography), accessed on 4 June 2021.
21
1 March 2020 revision of federal act mentioned in Footnote 6, ot 01.03.2020 No.35-FZ.
22
The authors trried to evaluate the effects the introduction of “mother’s fund” by using a dummy variable, unity for 2006 and later, zero for otherwise. However, the fertility rate eventually declines overall from 2015 until it matches the original trend (the upward trend seen from 1999 to 2006) in 2018. The positive and negative effects are simultaneously present and therefore not significant.

References

  1. Becker, Gary. 1960. An Economic Analysis of Fertility. In Demographic and Economic Change in Developed Countries. Edited by Ansley Coale. New York: Columbia University Press, pp. 209–31. [Google Scholar]
  2. Bollen, Kenneth, Jennifer Glanville, and Guy Stecklov. 2007. Socio-Economic Status, Permanent Income, and Fertility: A Latent-Variable Approach. Population Studies 61: 15–34. [Google Scholar] [CrossRef] [PubMed]
  3. Cetre, Sophie, Andrew Clark, and Claudia Senik. 2016. Happy People Have Children: Choice and Self-Selection into Parenthood. European Journal of Population 32: 445–73. [Google Scholar] [CrossRef] [PubMed]
  4. Council of Europe. 2005. Recent Demographic Developments in Europe 2004. Strasbourg: Council of Europe. [Google Scholar]
  5. Cserepes, Reka, Janos Kollar, Tamas Sapy, Tewes Wischmann, and Antal Bugan. 2013. Effects of Gender Roles, Child Wish Motives, Subjective Well-Being, and Marital Adjustment on Infertility-Related Stress: A Preliminary Study with a Hungarian Sample of Involuntary Childless Men and Women. Archives of Gynecology and Obstetrics 288: 925–32. [Google Scholar] [CrossRef] [PubMed]
  6. DaVanzo, Julie, and Clifford Grammich. 2001. Population Trends in the Russian Federation. Santa Monica: RAND. [Google Scholar]
  7. Easterlin, Richard. 1966. On the Relation of Economic Factors to Recent and Projected Fertility Changes. Demography 3: 131–53. [Google Scholar] [CrossRef]
  8. Easterlin, Richard. 1973. Relative Economic Status and the American Ferility Swing. In Family Economic Behavior: Problems and Prospects, Institute of Life Insurance. Edited by E. B. Sheldon. New York: J.P. Lippincott, pp. 170–223. [Google Scholar]
  9. Ghez, Gilbert, and Gary Becker. 1975. The Allocation of Time and Goods over the Life Cycle. Cambridge, MA: NBER. [Google Scholar]
  10. Grogan, Louise. 2006. An Economic Examination of the Post-Transition Fertility Decline in Russia. Post-Communist Economies 18: 363–97. [Google Scholar] [CrossRef]
  11. Hopcroft, Rosemary. 2022. Husband’s income, wife’s income, and number of biological children in the US. Biodemography and Social Biology 67: 71–83. [Google Scholar] [CrossRef]
  12. Iwasaki, Iwasaki, and Kazuhiro Kumo. 2020. Determinants of Regional Fertility in Russia: A Dynamic Panel Data Analysis. Post-Communist Economies 32: 176–214. [Google Scholar] [CrossRef]
  13. Karabchuk, Tatiana. 2017a. Factors Affecting the Birth of Second and Third Children. In Demography of Russia: From the Past to the Present. Edited by Tatiana Karabchuk, Kazuhiro Kumo and Ekaterina Selezneva. London: Palgrave Macmillan, pp. 187–218. [Google Scholar]
  14. Karabchuk, Tatiana. 2017b. Fertility and Uncertainty in Modern Russia. In Demography of Russia: From the Past to the Present. Edited by Tatiana Karabchuk, Kazuhiro Kumo and Ekaterina Selezneva. London: Palgrave Macmillan, pp. 155–86. [Google Scholar]
  15. Kohler, Hans-Peter, and Iliana Kohler. 2002. Fertility Decline in Russia in the Early and Mid 1990s: The Role of Economic Uncertainty and Labour Market Crises. European Journal of Population 18: 233–62. [Google Scholar] [CrossRef]
  16. Kolk, Martin. 2022. The relationship between life-course accumulated income and childbearing of Swedish men and women born 1940–1970. Population Studies 77: 197–215. [Google Scholar] [CrossRef]
  17. Kornstad, Tom, and Marit Ronsen. 2018. Women’s Wages and Fertility Revisited Evidence from Norway. European Journal of Population 34: 491–518. [Google Scholar] [CrossRef]
  18. Kozyreva, Polina, Mikhail Kosolapov, and Barry Popkin. 2016. Data Resource Profile: The Russia Longitudinal Monitoring Survey—Higher School of Economics (RLMS-HSE) Phase II: Monitoring the Economic and Health Situation in Russia, 1994–2013. International Journal of Epidemiology 45: 395–401. [Google Scholar] [CrossRef] [PubMed]
  19. Kumo, Kazuhiro. 2012. Determinants of Childbirth in Russia: A Micro-Data Approach. Hitotsubashi Journal of Economics 53: 49–70. [Google Scholar]
  20. Kumo, Kazuhiro. 2021. Population Aging, Low Fertility and Social Security in Russia. In Employment, Retirement and Lifestyle in Aging East Asia. Edited by Xinxin Ma. London: Palgrave Macmillan, pp. 283–99. [Google Scholar]
  21. Le Moglie, Marco, Letizia Mencarini, and Chiara Rapallini. 2015. Is It Just a Matter of Personality? On the Role of Subjective Well-Being in Childbearing Behavior. Journal of Economic Behavior & Organization 117: 453–75. [Google Scholar]
  22. Lovenheim, Michael, and Kevin Mumford. 2013. Do Family Wealth Shocks Affect Fertility Choices? Evidence from the Housing Market. Review of Economics and Statistics 95: 464–75. [Google Scholar] [CrossRef]
  23. Luppi, Francesca. 2016. When is the Second One Coming? The Effect of Couple’s Subjective Well-Being Following the Onset of Parenthood. European Journal of Population 32: 421–44. [Google Scholar] [CrossRef] [PubMed]
  24. Macunovich, Diane. 1995. The Butz-Ward Fertility Model in the Light of More Recent Data. Journal of Human Resources 30: 229–55. [Google Scholar] [CrossRef]
  25. Mansour, Fady. 2017. Economic Insecurity and Fertility: Does Income Volatility Impact the Decision to Remain a One-Child Family? Journal of Family and Economic Issues 39: 243–57. [Google Scholar] [CrossRef]
  26. MaRgolis, Rachel, and Mikko MyRskyla. 2011. A Global Perspective on Happiness and Fertility. Population and Development Review 31: 29–56. [Google Scholar] [CrossRef]
  27. McAley, Alistair. 1979. Economic Welfare in the Soviet Union: Poverty, Living Standards and Inequality. Melbourne: Allen & Unwin. [Google Scholar]
  28. Perelli-Harris, Brienna. 2006. The Influence of Informal Work and Subjective Well-Being on Childbearing in Post-Soviet Russia. Population and Development Review 32: 729–53. [Google Scholar] [CrossRef]
  29. Philipov, Dimiter, and Jurgen Dorbritz. 2003. Demographic Consequences of Economic Transition in Countries of Central and Eastern Europe. Strasbourg: Council of Europe. [Google Scholar]
  30. Rondinelli, Concetta, Arnstein Aassve, and Francesco Billari. 2010. Women’s Wages and Childbearing Decisions: Evidence from Italy. Demographic Research 22: 549–77. [Google Scholar] [CrossRef]
  31. Roschina, Yana, and Aleksey Boikov. 2006. Faktory Fertil’nosti v Sovremennoi Rossii. Moscow: EERC. (In Russian) [Google Scholar]
  32. Rosstat. 2008. Demograficheskii Ezhegodnik Rossii. Moskva: Rosstat. (In Russian) [Google Scholar]
  33. Stanford, Joseph, and Ken Smith. 2013. Marital Fertility and Income: Moderating Effects of the Church of Jesus Christ of Latter-day Saints Religion in Utah. Journal of Biosocial Science 45: 239–48. [Google Scholar] [CrossRef] [PubMed]
  34. Vishnevskii, Anatory, ed. 2006. Demograficheskaya Modernizatsiya Rossii 1900–2000. Moscow: Novoe Izdatel’stvo. (In Russian) [Google Scholar]
  35. Wachter, Michael. 1975. Time-Series Fertility Equation: The Potential for a Baby Boom in the 1980’s. International Economic Review 16: 609–24. [Google Scholar] [CrossRef]
  36. Weeden, Jason, Michael Abrams, Melanie Green, and John Sabini. 2006. Do High-Status People Really Have Fewer Children?: Education, Income, and Fertility in the Contemporary U.S. Human Nature: An Interdisciplinary Biosocial Perspective 17: 377–92. [Google Scholar] [CrossRef] [PubMed]
  37. Zhuravleva, Tatiana, and Yana Gavrilova. 2017. Analiz faktorov rozhdayemosti v Rossii: Shto govoryat dannyye RMEZ NIU VSHE? Ekonomicheskiy zhurnal VSHE 21: 145–87. (In Russian). [Google Scholar]
Figure 1. Total Fertility Rate and GDP per capita in Russia, 1989–2018. Source: Prepared by the author by Rosstat, Demograficheskii ezhegodnik Rossii, various years; Rosstat, Regiony Rossii, various years.
Economies 11 00245 g001
Table 1. Total Fertility Rate of Transition Economies, 1980–2015.
Economies 11 00245 i001
Table 2. Previous Research on Fertility using RLMS.
Target
Period
MethodExplained
Variable
Women’s WageHousehold
Income; Partner’s Income
Subjective Well-BeingEvaluation on Health
Kohler and Kohler (2002)1995–1997Logitbirth -
Roschina and Boikov (2006) R1994–2001Probitbirth NS NS
Roschina and Boikov (2006) R1994–2001ProbitHope to give birth NS NS
Perelli-Harris (2006)1994LogitHope to give birth NS+
Grogan (2006)1994–2001Logitbirth +
Kumo (2012)1995–2004LogitbirthNSNS+
Karabchuk (2017a)2000–2013ProbitFirst childbirth-+++
Karabchuk (2017a)2000–2009ProbitSecond childbirthNSNS NS
Karabchuk (2017a)2000–2009ProbitHope to give birth+NS NS
Zhuravleva and Gavrilova (2017) R1994–2004ProbitbirthNS NSNS
Zhuravleva and Gavrilova (2017) R2005–2014Probitbirth- +NS
Zhuravleva and Gavrilova (2017) R1994–2014ProbitHope to give birth NS-NS
Source: Prepared by the author. Note: NS indicates “not significant”; the blanks mean that the respective variable was not introduced; and R means the study written in Russian.
Table 3. Descriptive Statistics.
ObservationAverageStandard DeviationMinimumMaximum
Given Birth39,1350.030.1701
Have a Partner47,7580.840.3701
Family Size47,8443.561.41114
Satisfied with Life47,6500.440.501
(Much satisfied & Satisfied = 1)
Have problem in health47,7680.30.4601
(Go to the hospital at least once a month = 1)
Self-assessment of health47,6700.420.4901
(Very good/good = 1)
Higher education47,8140.350.4801
Secondary education47,8140.580.4901
(Reference: Less than secondary education completed)
Urban/rural47,8440.80.401
(City residents = 1)
wage47,8440.360.3307.91
(adjusted by inflation rate, 1000 rubles)
Squared wages47,8440.240.87062.57
Household income per capita46,5540.0340.04703.64
(adjusted by inflation rate, 10,000 rubles)
Household income per capita squared46,5540.00340.085013.24
Equivalent scale Household income (1)46,5540.0440.0604.96
(OECD Equivalence Scale)
Equivalent scale Household income (1) Squared46,5540.00550.14024.62
Equivalent scale Household income (2)46,5540.0540.07106.06
(OECD modified scale)
Equivalent scale Household income (2) Squared46,5540.0080.21036.78
Equivalent scale Household income (3)46,5540.060.07806.3
(Square root scale)
Equivalent scale Household income (3) Squared46,5540.00990.24039.72
Source: Prepared by the author from RLMS forms.
Table 4. Results (1).
Panel Probit Analysis of Childbirth
Childbirth from 1995 to 2018, by Women of 18–45 Years Old
Variables(1)(2)(3)(4)
Given Birth0.585 ***0.582 ***0.580 ***0.584 ***
(0.0606)(0.0605)(0.0605)(0.0605)
Have a Partner0.167 ***0.167 ***0.165 ***0.162 ***
(0.0101)(0.0100)(0.0100)(0.0101)
Family Size0.386 ***0.380 ***0.377 ***0.383 ***
(0.0331)(0.0330)(0.0330)(0.0330)
Have problem in health−0.133 ***−0.134 ***−0.135 ***−0.134 ***
(0.0356)(0.0356)(0.0356)(0.0356)
Self-assessment of health0.0849 ***0.0848 ***0.0849 ***0.0848 ***
(0.0316)(0.0316)(0.0316)(0.0316)
Higher education0.245 ***0.236 ***0.232 ***0.240 ***
(0.0630)(0.0629)(0.0629)(0.0629)
Secondary education−0.0245−0.0280−0.0296−0.0268
(0.0605)(0.0604)(0.0603)(0.0604)
Urban/rural0.131 ***0.124 ***0.121 ***0.126 ***
(0.0385)(0.0384)(0.0384)(0.0385)
wage−1.866 ***−1.906 ***−1.924 ***−1.890 ***
(0.0965)(0.0964)(0.0964)(0.0963)
Squared wages0.306 ***0.306 ***0.307 ***0.307 ***
(0.0193)(0.0192)(0.0192)(0.0192)
Household income per capita0.981
(0.715)
Household income per capita squared−0.565
(0.736)
Equivalent scale Household income (1) 1.650 ***
(0.532)
Equivalent scale Household income (1) Squared −0.793 *
(0.463)
Equivalent scale Household income (2) 1.637 ***
(0.429)
Equivalent scale Household income (2) Squared −0.651 **
(0.314)
Equivalent scale Household income (3) 0.845 **
(0.359)
Equivalent scale Household income (3) Squared −0.231
(0.185)
Year DummyYesYesYesYes
Constant−3.170 ***−3.167 ***−3.158 ***−3.149 ***
(0.135)(0.134)(0.134)(0.134)
Observations37,22037,22037,22037,220
Samples10,13110,13110,13110,131
Wald Chi2824.59834.43839.74829.54
Prob > chi20.00 0.00 0.00 0.00
Log likelihood−4507.2−4502.9−4499.9−4504.9
Standard error in parentheses.
*** p < 0.01, ** p < 0.05, * p < 0.1
Source: Estimated by the author.
Table 5. Childbirth from 1995 to 2018 by women of 18–45 years old.
Panel Logit Analysis Pooled Logit Analysis OLS
Variables (5)(6)(7)(8) (9)(10)(11)(12) (13)(14)(15)(16)
Given Birth 1.360 ***1.353 ***1.348 ***1.356 *** 1.318 ***1.312 ***1.307 ***1.315 *** 0.0225 ***0.0222 ***0.0221 ***0.0224 ***
(0.146)(0.146)(0.146)(0.146) (0.143)(0.143)(0.143)(0.143) (0.00242)(0.00241)(0.00241)(0.00241)
Have a Partner 0.331 ***0.330 ***0.327 ***0.320 *** 0.309 ***0.309 ***0.306 ***0.298 *** 0.0119 ***0.0118 ***0.0116 ***0.0112 ***
(0.0202)(0.0201)(0.0201)(0.0203) (0.0176)(0.0176)(0.0176)(0.0178) (0.000640)(0.000634)(0.000632)(0.000636)
Family Size 0.838 ***0.826 ***0.821 ***0.831 *** 0.819***0.808 ***0.803 ***0.812 *** 0.0237 ***0.0236 ***0.0235 ***0.0237 ***
(0.0719)(0.0718)(0.0718)(0.0718) (0.0694)(0.0694)(0.0694)(0.0694) (0.00191)(0.00191)(0.00191)(0.00191)
Have problem in health −0.330 ***−0.333 ***−0.334 ***−0.331 *** −0.312 ***−0.316 ***−0.318 ***−0.315 *** −0.00729 ***−0.00736 ***−0.00738 ***−0.00729 ***
(0.0786)(0.0786)(0.0786)(0.0786) (0.0763)(0.0764)(0.0764)(0.0764) (0.00198)(0.00198)(0.00198)(0.00198)
Self-assessment of health 0.144 **0.144 **0.145 **0.144 ** 0.1270.1280.129 **0.128 0.00412 **0.00411 **0.00411 **0.00413 **
(0.0683)(0.0682)(0.0682)(0.0683) (0.0657)(0.0657)(0.0658)(0.0657) (0.00189)(0.00189)(0.00189)(0.00189)
Higher education 0.583 ***0.566 ***0.558 ***0.573 *** 0.567 ***0.550 ***0.543 ***0.558 *** 0.0181 ***0.0178 ***0.0177 ***0.0180 ***
(0.135)(0.135)(0.135)(0.135) (0.128)(0.128)(0.128)(0.128) (0.00376)(0.00376)(0.00376)(0.00376)
Secondary education −0.0479−0.0541−0.0570−0.0519 −0.0501−0.0559−0.0586−0.0537 −0.000316−0.000432−0.000495−0.000411
(0.131)(0.131)(0.131)(0.131) (0.125)(0.125)(0.125)(0.125) (0.00358)(0.00358)(0.00358)(0.00358)
Urban/rural 0.321 ***0.308 ***0.302 ***0.312 *** 0.306 ***0.294 ***0.288 ***0.298 *** 0.00846 ***0.00823 ***0.00812 ***0.00830 ***
(0.0831)(0.0829)(0.0829)(0.0830) (0.0774)(0.0774)(0.0774)(0.0774) (0.00226)(0.00226)(0.00226)(0.00226)
wage −4.832 ***−4.908 ***−4.938 ***−4.875 *** −4.717 ***−4.792 ***−4.821 ***−4.758 *** −0.110 ***−0.112 ***−0.112 ***−0.110 ***
(0.239)(0.238)(0.238)(0.238) (0.231)(0.230)(0.229)(0.230) (0.00494)(0.00494)(0.00494)(0.00496)
Squared wages 0.716 ***0.716 ***0.716 ***0.717 *** 0.697 ***0.696 ***0.697 ***0.697 *** 0.0236 ***0.0236 ***0.0237 ***0.0237 ***
(0.0482)(0.0479)(0.0473)(0.0469) (0.0474)(0.0471)(0.0465)(0.0460) (0.00163)(0.00163)(0.00163)(0.00163)
Household income per capita 2.649 2.696 0.129 ***
(1.465) (1.404) (0.0334)
Household income per capita squared −1.333 −1.336 −0.0433 ***
(1.461) (1.436) (0.0166)
Equivalent scale Household income (1) 3.684 *** 3.658 *** 0.130 ***
(1.071) (1.032) (0.0257)
Equivalent scale Household income (1) Squared −1.673 * −1.664 * −0.0320 ***
(0.939) (0.936) (0.00929)
Equivalent scale Household income (2) 3.514 *** 3.473 *** 0.117 ***
(0.862) (0.830) (0.0213)
Equivalent scale Household income (2) Squared −1.346 ** −1.338 ** −0.0234 ***
(0.643) (0.639) (0.00627)
Equivalent scale Household income (3) 1.966 *** 1.957 *** 0.0776 ***
(0.726) (0.695) (0.0194)
Equivalent scale Household income (3) Squared −0.516 −0.509 −0.0143 **
(0.379) (0.373) (0.00560)
Year Dummy YesYesYesYes YesYesYesYes YesYesYesYes
Constant −6.183 ***−6.173 ***−6.153 ***−6.132 *** −5.886 ***−5.881 ***−5.865 ***−5.838 *** −0.0329 ***−0.0322 ***−0.0313 ***−0.0304 ***
(0.300)(0.299)(0.299)(0.299) (0.278)(0.278)(0.278)(0.278) (0.00697)(0.00696)(0.00696)(0.00696)
Observations 37,22037,22037,22037,220 37,22037,22037,22037,220 37,64337,64337,64337,643
Samples 10,13110,13110,13110,131 ----
Prob > chi2 0.00 0.00 0.00 0.00 0.00 0.00 0.00 0.00
Log likelihood −4480.1−4475.4−4472.5−4477.6 −4487.2−4482.2−4479.3−4484.6
Pseudo R2/R2 0.130.130.130.13 0.0340.0340.0340.034
Standard error in parentheses. *** p < 0.01, ** p < 0.05, * p < 0.1.
Table 6. Panel Probit Analysis of Childbirth.
1995–2000 2001–2014 2015–2018
Variables (′1)(′2)(′3)(′4) (′5)(′6)(′7)(′8) (′9)(′10)(′11)(′12)
Given Birth 0.430 **0.430 **0.429 **0.429 ** 0.572 ***0.569 ***0.566 ***0.571 *** 0.800 ***0.794 ***0.790 ***0.799 ***
(0.172)(0.172)(0.172)(0.172) (0.0802)(0.0801)(0.0800)(0.0801) (0.136)(0.135)(0.135)(0.135)
Have a Partner 0.170 ***0.170 ***0.168 ***0.165 *** 0.184 ***0.184***0.182 ***0.179*** 0.163 ***0.163 ***0.160 ***0.156 ***
(0.0374)(0.0372)(0.0371)(0.0371) (0.0142)(0.0142)(0.0142)(0.0143) (0.0191)(0.0190)(0.0189)(0.0192)
Family Size 0.593 ***0.591 ***0.589 ***0.587 *** 0.393 ***0.388 ***0.386 ***0.390 *** 0.332 ***0.322 ***0.317 ***0.329 ***
(0.114)(0.114)(0.114)(0.114) (0.0445)(0.0444)(0.0444)(0.0444) (0.0621)(0.0621)(0.0620)(0.0621)
Have problem in health −0.0668−0.0672−0.0675−0.0678 −0.106 **−0.107 **−0.108 **−0.106 ** −0.233 ***−0.235 ***−0.235 ***−0.234 ***
(0.0983)(0.0982)(0.0982)(0.0982) (0.0484)(0.0484)(0.0484)(0.0484) (0.0725)(0.0724)(0.0723)(0.0725)
Self-assessment of health 0.230 **0.230 **0.230 **0.231 ** 0.0908 **0.0903 **0.0903 **0.0903 ** 0.008520.009040.009550.00897
(0.0980)(0.0980)(0.0979)(0.0979) (0.0430)(0.0430)(0.0430)(0.0430) (0.0596)(0.0595)(0.0595)(0.0596)
Higher education 0.09880.09750.09650.0956 0.255 ***0.245 ***0.241 ***0.250 *** 0.330 ***0.317 ***0.310 **0.324 ***
(0.207)(0.207)(0.207)(0.207) (0.0845)(0.0844)(0.0843)(0.0844) (0.122)(0.122)(0.122)(0.122)
Secondary education −0.0718−0.0726−0.0732−0.0736 −0.0262−0.0296−0.0311−0.0281 0.02180.01650.01330.0185
(0.192)(0.192)(0.191)(0.192) (0.0802)(0.0801)(0.0800)(0.0801) (0.120)(0.120)(0.119)(0.120)
Urban/rural 0.05080.04900.04760.0462 0.105**0.0980 *0.0949 *0.101 ** 0.215 ***0.205 ***0.199 ***0.210 ***
(0.120)(0.120)(0.120)(0.120) (0.0513)(0.0513)(0.0512)(0.0513) (0.0755)(0.0754)(0.0754)(0.0756)
wage −2.004 ***−2.019 ***−2.029 ***−2.027 *** −1.821 ***−1.859 ***−1.87 5***−1.844 *** −2.366 ***−2.426 ***−2.456 ***−2.385 ***
(0.464)(0.464)(0.465)(0.463) (0.129)(0.129)(0.129)(0.130) (0.194)(0.196)(0.197)(0.195)
Squared wages 0.735 ***0.737 ***0.735 ***0.720 *** 0.278 ***0.278 ***0.279 ***0.280 *** 0.454 ***0.455 ***0.456 ***0.453 ***
(0.225)(0.226)(0.226)(0.221) (0.0250)(0.0248)(0.0248)(0.0248) (0.0427)(0.0426)(0.0426)(0.0427)
Household income per capita 7.588 1.013 1.450
(7.150) (0.929) (1.277)
Household income per capita squared −87.01 −0.427 −0.951
(76.24) (0.814) (1.388)
Equivalent scale Household income (1) 6.337 1.644 ** 2.447 **
(5.652) (0.697) (1.211)
Equivalent scale Household income (1) Squared −54.71 −0.704 −1.531
(47.57) (0.515) (1.627)
Equivalent scale Household income (2) 5.386 1.617 *** 2.573 **
(4.637) (0.558) (1.065)
Equivalent scale Household income (2) Squared −36.74 −0.586 * −1.516
(32.03) (0.344) (1.270)
Equivalent scale Household income (3) 4.426 0.837 * 1.120
(3.791) (0.488) (0.770)
Equivalent scale Household income (3) Squared −23.53 −0.198 −0.442
(21.27) (0.235) (0.639)
Year Dummy YesYesYesYes YesYesYesYes YesYesYesYes
Constant −3.290 ***−3.287 ***−3.283 ***−3.269 *** −3.063 ***−3.073 ***−3.069 ***−3.046 *** −3.300 ***−3.305 ***−3.297 ***−3.274 ***
(0.402)(0.401)(0.401)(0.400) (0.164)(0.164)(0.164)(0.163) (0.253)(0.252)(0.251)(0.251)
Observations 5430543054305430 22,00722,00722,00722,007 9783978397839783
Samples 2605260526052605 7689768976897689 3903390339033903
Wald Chi2 65.865.966.165.9 423.8428.7431.2426.4 237.6241.9244.1238.7
Prob > chi2 0.00 0.00 0.00 0.00 0.00 0.00 0.00 0.00 0.00 0.00 0.00 0.00
Log likelihood −627.6−627.6−627.6−627.6 −2497.1−2494.7−2493.2−2495.8 −1355.2−1352.8−1351.3−1354.6
Standard error in parentheses. *** p < 0.01, ** p < 0.05, * p < 0.1.
Disclaimer/Publisher’s Note: The statements, opinions and data contained in all publications are solely those of the individual author(s) and contributor(s) and not of MDPI and/or the editor(s). MDPI and/or the editor(s) disclaim responsibility for any injury to people or property resulting from any ideas, methods, instructions or products referred to in the content.

