Article

Decarbonizing the Global Economy—Investigating the Role of Carbon Emission Inertia Using the Integrated Assessment Model MIND

by
Mohammad M. Khabbazan
1,2,3,* and
Sascha Hokamp
2,3,4,5
1
Workgroup for Economic and Infrastructure Policy (WIP), Technical University of Berlin (TU Berlin), Strasse des 17. Juni 135, 10623 Berlin, Germany
2
Research Unit Sustainability and Global Change (FNU), University of Hamburg, Grindelberg 5, 20144 Hamburg, Germany
3
Center for Earth System Research and Sustainablity (CEN), University of Hamburg, Bundesstr. 53, 20146 Hamburg, Germany
4
Research Group Climate Change and Security (CliSec), University of Hamburg, Grindelberg 7, 20144 Hamburg, Germany
5
Institute of Geography, University of Hamburg, Grindelberg 7, 20144 Hamburg, Germany
*
Author to whom correspondence should be addressed.
Economies 2022, 10(8), 186; https://doi.org/10.3390/economies10080186
Submission received: 22 April 2022 / Revised: 25 July 2022 / Accepted: 26 July 2022 / Published: 29 July 2022

Abstract

:
In 2015, the 21st Conference of the Parties reaffirmed the target of keeping the global mean temperature rise below 2 °C or 1.5 °C by 2100 while finding no consensus on how to decarbonize the global economy. In this regard, the speed of decarbonization reflects the (in)flexibility of transforming the energy sector due to engineering, political, or societal constraints. Using economy–energy–climate-integrated assessment models (IAMs), the maximum absolute rate of change in carbon emission allowed from each time step to the next, so-called carbon emission inertia (CEI), governs the magnitude of emission change, affecting investment decisions and economic welfare. Employing the model of investment and endogenous technological development (MIND), we conduct a cost-effectiveness analysis and examine anthropogenic global carbon emission scenarios in line with decarbonizing the global economy while measuring the global mean temperature. We examine the role of CEI as a crucial assumption, where the CEI can vary in four scenarios from 3.7% to 12.6% p.a. We provide what-if studies on global carbon emissions, global mean temperature change, and investments in renewable energy production and show that decarbonizing the global economy might still be possible before 2100 only if the CEI is high enough. In addition, we show that climate policy scenarios with early decarbonization and without negative emissions may still comply with the 2 °C target. However, our results indicate that the 1.5 °C target is not likely to be reached without negative emission technologies. Hence, the window of opportunity is beginning to close. This work can also assist to better interpret existing publications on various climate targets when altering CEI could have played a significant role.

1. Introduction

Urgent action is required to reduce anthropogenic greenhouse gas emissions in line with neutralizing global and regional risks of climate change. In this regard, emission reduction seems the most reliable choice, requiring international endeavors and partnership. Nevertheless, uncertainties prevail as every part of climate change policy is shaped by complicated characteristics of society and the environment. Therefore, learning the suitable set of uncertainties and decrypting them in illuminating and understandable formats for policymakers are essential in climate-change economics. Along these lines, economy–energy–climate-integrated assessment models (IAMs), which comprise an explicit model of the Earth’s climate system with an economic model, are valuable instruments researchers use to anticipate the consequences of climate policies (UNFCCC 2022). Decisions about climate policy scenarios can be made by employing IAMs and normative decision frameworks (Bosetti et al. 2006; Clarke et al. 2014; Khabbazan 2022a; Khabbazan et al. 2021; Neubersch et al. 2014).1
Even though a series of climate policies to decarbonize the global economy have been an integral part of international debates for several years, no consensus has been achieved to reach such a goal. Renewable energy production plays a crucial role in the efforts to reduce anthropogenic global carbon emissions (Afonso et al. 2017; Lind et al. 2013). In June 2015, at the 41st G7 Summit held in Elmau, Germany, the political leaders of Canada, France, Germany, Italy, Japan, the United Kingdom, and the United States agreed to decarbonize the global economy before 2100 (Leaders’ Declaration G7 Summit 2015). Perhaps the Paris Agreement is one of the most remarkable international efforts toward this goal by reaffirming the target of the global mean temperature rise below 2 °C by 2100 outlined at COP 16 (UNFCC 2010). At the 21st Conference of the Parties in Paris in 2015, member states of the United Nations Framework Convention on Climate Change (UNFCCC) consented to reduce global carbon emissions by improving renewables investments (UNFCC 2015a, 2015b). The Paris Agreement seeks to maintain the global average temperature rise to sufficiently below 2 °C above the pre-industrial level and attempts to restrain it to 1.5 °C, while achieving no consensus on decarbonizing the global economy (UNFCC 2015a, 2015b). Instead, the final agreement called for enhanced scientific investigation of low carbon emission scenarios (UNFCC 2015a, 2015b). Since the Paris Agreement, the pathway to decarbonizing the global economy is still under debate.
OECD/IEA and IRENA (2017) claimed: “G20 countries are collectively responsible for more than 80% of global energy-related carbon emissions” (p. 17). Further, OECD/IEA and IRENA (2017) estimated the CO2 budget to be 790 Gt CO2 between 2015 and 2100, while The Copenhagen Diagnosis (2009) showed the global carbon budget to be 750 GtC between 2010 and 2050. In their approach, The Copenhagen Diagnosis (2009) calculated the required rates of emission reduction in line with the global carbon budget in three scenarios, namely 9.0%, 5.3%, and 3.7% per year (p.a.) depending on the emission peak year 2020, 2015, and 2011, respectively. Nevertheless, The Copenhagen Diagnosis (2009) did not include an assessment of global mean temperature or welfare changes arising from the three emission reduction rates.
In particular, the maximum emission change (reduction or increase) rate from each time step to the next is typically called emission inertia in integrated assessment models (IAMs). Hereafter, we call the maximum allowed carbon emission change rate simply carbon emission inertia (CEI). Considering a specific decarbonization scenario by a particular year without targeting a temperature target, higher CEI would allow for greater flexibility of investment decisions, reducing the welfare loss that would arise from implementing that scenario. However, such flexibility also comes with a higher peak in global mean temperature as the higher CEI would equally accommodate increasing emissions.
CEI reflects the (in)flexibility of transforming the energy sector as a result of engineering, political, or societal constraints regionally and globally. That is, a similar policy may bring about different CEI levels in different regions. For instance, Mohammadi and Khabbazan (2022) compare the abatement effectiveness of feed-in tariffs in the renewable energy transition in Iran and Germany. On a more international involvement, while carbon-pricing schemes can increase the overall efficiency of implementing carbon reduction, individual participants might be affected negatively. For example, Khabbazan (2022b) studies some scenarios concerning emission trading in the EU 27 (the EU after the Brexit) and shows possible welfare-decreasing effects in specific countries. Hence, redistribution schemes are needed to compensate those participants that would otherwise be negatively impacted. On the social and behavioral characteristics in reaching climate agreements, some studies have investigated the role of trust (Hasson et al. 2010), free-riding behavior (Heitzig et al. 2011), and coordination mechanisms (Tavoni et al. 2009) using public goods games.
In this work, we use the absolute value of the CEI by The Copenhagen Diagnosis (2009) (9.0%, 5.3%, and 3.7%) and 12.6% adopted from Lorenz et al. (2012) (in total, four CEI scenarios). We investigate whether the global carbon emissions, following climate policy proposals, e.g., Climate Action Tracker (2017) and Paris Pledges represented by Intended National Determined Contributions (INDCs), may allow for reaching these climate targets.2 As one of the main contributions, we calculate the welfare implication of the scenarios in this work. In particular, we employ the socio-economic integrated assessment model of investment and endogenous technological development (MIND, see Edenhofer et al. (2005) and Neubersch et al. (2014)) to estimate the resulting pathways for investments, for instance, in renewable energy production, and the costs in terms of Certainty and Balanced Growth Equivalents (CBGE, see Stern (2007) and Anthoff and Tol (2009)) as well as the impact induced by altering the CEI levels.
Indeed, our primary research question is: Will global carbon emissions, in accordance with the climate policy proposals, hold the global temperature anomaly, compared to the pre-industrial level, well below 2 °C in 2100? We find some climate policy scenarios that may keep the global mean temperature rise below the climate target. Still, these scenarios are characterized by early decarbonization and associated with comparatively high costs in terms of CBGE.
The work is organized as follows. The following section reviews the climate policy debate, which inspired the climate policy scenarios. Section 3 describes the socio-economic-integrated assessment model MIND and details the climate policy and scenarios in this work. Next, the simulation results are presented and discussed. Finally, we conclude and present a future research agenda.

2. Climate Policy

In this section, we outline the climate policy debate, detailing the occasions in 2015 and abstracting the events after that until 2022. To begin with, in June 2015, the political leaders of G7 raised the ambitious idea of decarbonizing their economies before 2100, formalized by the following goal
“This [the agreement in Paris, Conference of the Parties, COP 21, note of the authors] should enable all countries to follow a low carbon and resilient development pathway in line with the global goal to hold the increase in global average temperature below 2 °C. Mindful of this goal and considering the latest IPCC [Intergovernmental Panel on Climate Change, note of the authors] results, we emphasize that deep cuts in global greenhouse gas emissions are required with a decarbonisation of the global economy over the course of this century”
Six months later, at the Conference of the Parties (COP 21), negotiations and discussions were still aspiring; we show below excerpts of Article 3 (on the collective long-term goal) of UNFCCC’s (UNFCC 2015b) Draft Paris Agreement in the version of 5 December 2015, where square brackets indicate pieces of the text still subject to negotiation
“[Parties [collectively][cooperatively] aim to reach the global temperature goal referred to in Article 2 through:
(a) [A peaking of global greenhouse gas emissions as soon as possible[, recognizing that peaking requires deeper cuts of emissions of developed countries and will be longer for developing countries]]
(b) [Rapid reductions thereafter [in accordance with best available science] to at least a X [-Y] per cent reduction in global [greenhouse gas emissions][CO[e]] compared to 20XX levels by 2050]];
(c) [Achieving zero global GHG emissions by 2060–2080]
(d) [A long-term low emissions transformation] [toward [climate neutrality] [decarbonization] [over the course of this century] [as soon as possible after mid-century];
(e) [Equitable distribution of a global carbon budget based on historical responsibilities and [climate] justice] [on the basis of equity and common but differentiated responsibilities and respective capabilities] [in the context of sustainable development and eradication of poverty][while ensuring that food security, production and distribution is not threatened][informed by the best available science]…”.
At that juncture, the global temperature goal was still subject to negotiation and varied between targeting “well below 2 °C” and “below 1.5 °C (see UNFCC 2015b, Article 2, pp. 3–4). One week later, on 12 December 2015, the Parties finally agreed on
“… holding the increase in the global average temperature to well below 2 °C above pre-industrial levels and to pursue efforts to limit the temperature increase to 1.5 °C above pre-industrial levels, recognizing that this would significantly reduce the risks and impacts of climate change.”
In addition, within the Adoption of the Paris Agreement (UNFCC 2015a), the Parties agreed on a shortened version of Article 3,
“As nationally determined contributions to the global response to climate change, all Parties are to undertake and communicate ambitious efforts as defined in Articles 4, 7, 9, 10, 11 and 13 with the view to achieving the purpose of this Agreement as set out in Article 2. The efforts of all Parties will represent a progression over time while recognizing the need to support developing country Parties for the effective implementation of this Agreement”.
Nonetheless, challenging tasks were moved to other Articles and became less ambitious. For instance, within Article 4 of the Adoption of the Paris Agreement (UNFCC 2015a), one can find relicts from Article 3 of the Draft Paris Agreement (UNFCC 2015b),
“In order to achieve the long-term temperature goal set out in Article 2, Parties aim to reach global peaking of greenhouse gas emissions as soon as possible, recognizing that peaking will take longer for developing country Parties, and to undertake rapid reductions thereafter in accordance with best available science, so as to achieve a balance between anthropogenic emissions by sources and removals by sinks of greenhouse gases in the second half of this century, on the basis of equity, and in the context of sustainable development and efforts to eradicate poverty …”.
Eventually, the decarbonization of the global economy before the end of the 21st century is no longer included in the final agreement (UNFCC 2015a). Instead, it calls for enhanced scientific investigation of low carbon emission scenarios. Paris Pledges and Intended Nationally Determined Contributions (INDCs) account for a global mean temperature rise between 2.4 °C and 2.7 °C (Climate Action Tracker 2017).
In addition, in 2016, the Climate Action Network (CAN) International (Climate Action Network (CAN) International 2016) proposed Special Reports to address decarbonization and low carbon development, including 1.5 °C scenarios (IPCC 2016).3,4 In May 2016, at the 42nd G7 Summit held in Ise-Shima, Japan, the political leaders reaffirmed their decision to lead the efforts within the Paris Agreement (Leaders’ Declaration G7 Summit 2016). In November 2016, in Marrakech, Morocco, the Conference of the Parties (COP 22) and the Meeting of the Parties to the Paris Agreement (CMA1) recognized “while investment in clean energy is rising, volumes of finance for high carbon energy in all countries remain considerably higher” (UNFCC 2016, p. 29). In May 2017, at the 43rd G7 Summit held in Taormina, Italy, the political leaders emphasized the significant opportunities for economic growth and job creation, triggered by a transformation of the energy production sector towards low carbon technologies while reaching no consensus on common climate policy and the Paris Agreement (Leaders’ Declaration G7 Summit 2017). In July 2017, at the 12th G20 Summit held in Hamburg, Germany, the United States declared its withdrawal from the Paris Agreement (Leaders’ Declaration G20 Summit 2017, p. 10).
In June 2018, at the 44th G7 Summit held in La Malbaie, Canada, the political leaders agreed to aim for a healthy planet; however, their positions concerning climate change differed (Leaders’ Declaration G7 Summit 2018). In August 2019, at the 45th G7 Summit held in Biarritz, France, the political leaders could not mention the topic of climate change in their final declaration (Leaders’ Declaration G7 Summit 2019). The 46th G7 Summit was scheduled for June 2020 at Camp David, United States but was canceled due to the COVID-19 Pandemic. In June 2021, at the 47th G7 Summit held in Cornwall, United Kingdom, the political leaders took the lead in global action on climate change, with all G7 nations setting net-zero targets for the first time and agreeing to halve collective emissions by 2030 (Leaders’ Declaration G7 Summit 2021). In June 2022, at the 48th G7 Summit held in Elmau, Germany, for the first time the political leaders established a climate club of those countries willing to decarbonize and accelerate towards clean energy, which can be interpreted as a transition without carbon capture and storage technologies (Leaders’ Declaration G7 Summit 2022).

3. Methodology

3.1. Model

In this section, we describe the model of investment and endogenous technological development (MIND) by Edenhofer et al. (2005) and its consequential amendments. MIND is a coupled economy–energy–climate model that allows for various decision-analytic frameworks. The literature using MIND is rising. MIND has been used to conduct common cost–benefit and cost-effectiveness, with or without chance constraint programming (Bauer 2005; Bauer et al. 2004; Held et al. 2009; Khabbazan et al. 2021; Lorenz et al. 2012; Stein et al. 2020). MIND has also been widely employed to run cost–risk analyses of climate policy (Neubersch et al. 2014; Neubersch 2014; Roth et al. 2015; Roshan et al. 2019, Roshan et al. 2021; Mintening et al. 2017). The climate module in MIND is one of the most straightforward modules (one-box climate module) (Kriegler and Bruckner 2004; Petschl-Held et al. 1999). Khabbazan and Held (2019) showed that even the one-box climate module of MIND could emulate atmosphere–ocean general circulation models (AOGCMs) accurate to within 0.1 K if it is adequately trained against AOGCMs outputs. Nevertheless, the authors stated that the current version of the climate module might deviate by up to 0.5 °C (Khabbazan and Held 2019).
MIND consists of a stylized energy sector module within a Ramsey-type economic growth module that provides estimates on the global economy via the intertemporal welfare in Equation (1),
W = t e n d t s t a r t e ρ ( t t s t a r t ) L ( t ) 1 η C ( I A , I f o s , I r e s , I r e n , R D E , R D L , t ) L ( t ) 1 η 1 d t .
where L is labor force, C / L per capita consumption, η = 2 constant relative risk aversion, ρ = 0.01 pure rate of social time preference.
Investments are being made in capital stock ( I A ), fossil energy production ( I f o s ), renewable energy production ( I r e n ), fossil fuel extraction ( I r e s ), researchand development of labor efficiency ( R D L ), and energy efficiency ( R D E ). Investments are determined to maximize the intertemporal welfare W of the global economy as if by a benevolent social planner,
W I A , I f o s , I r e s , I r e n , R D E , R D L M A X
The budget constraint is presented in Equation (3)
Y = C ( I A , I f o s , I r e s , I r e n , R D E , R D L ) + I A + I f o s + I r e s + I r e n + R D E + R D L + Ω
where Y is global production and Ω captures all remaining expenditures (Edenhofer et al. 2005; Lorenz et al. 2012). Following Edenhofer et al. (2005), the total energy supply (E) is
E = E f o s + E r e n + E T N F
given by fossil energy from coal, oil, and gas ( E f o s ), renewable energy from wind, biomass, solar, and geothermal sources ( E r e n ), and traditional non-fossil energy, e.g., nuclear energy ( E T N F ). Fossil energy production governs via carbon intensity the level of global carbon emissions ( G C E s ), where the acceleration of change is due to carbon emission inertia ( C E I ), e.g., with respect to decarbonization, the lower bound 1 C E I becomes binding
1 C E I | 1 + Δ G C E G C E | 1 + C E I
Global carbon emissions can be changed by shifting the investments between fossil and renewable energy as well as research and development in energy efficiency. Finally, changes in global carbon emissions Δ G C E drive the change in global mean temperature Δ G M T via global carbon concentration G C C in a one-box climate module
Δ G M T = μ l n G C C G C C P I α G M T G M T P I
where the constants are α = 17 1000 p.a. and μ = 87 C 1000 p.a. , and the pre-industrial (PI) levels are set to G C C P I = 290 ppm and G M T P I = 14.6 C, whereas the starting values in 1995 are set to G C C 1995 = 360 ppm (Petschl-Held et al. 1999) and Δ G M T 1995 = 0.42 C (Neubersch et al. 2014).
We employ the version of MIND by Neubersch et al. (2014) in its deterministic mode. We do not allow for negative carbon emissions, which could be, for instance, due to Bio-Energy Carbon Capturing and Storage (BECCS) within all simulation scenarios. Finally, we assume climate sensitivity to be 2.9 °C (see Khabbazan and Held (2019); Nordhaus (2013), for a discussion of climate sensitivity).5 We use MIND to perform a cost-effectiveness analysis with constraints on the global mean temperature and the annual anthropogenic global carbon emissions.

3.2. Climate Policy Scenarios

This section outlines the climate policy (CP) scenarios. Table 1 connects the source of inspiration provided in international negotiations for the climate scenarios investigated and the shorthand formulations. We investigate six general CP scenarios: (i) Business-as-usual (BAU), where no change of climate policy is implemented, (ii) GMT ≤ 1.5 °C, where the global mean temperature is below the 1.5 °C target in all periods, (iii) GMT ≤ 2.0 °C, where the global mean temperature is below the 2.0 °C target in all periods, (iv) the decarbonization of the global economy from 2100 onwards (2100 CP), (v) the decarbonization of the global economy from 2080 onwards (2080 CP), and (vi) the decarbonization of the global economy from 2060 onwards (2060 CP). In addition, for comparison purposes, four Radiative Concentration Pathways (RCPs) are investigated, where the radiative forcing values in the year 2100 are equivalent to 2.6, 4.5, 6, and 8.5 W/m2, respectively (Meinshausen et al. 2011).
To account for progressively approaching a decarbonized global economy, we assume that the global economy has to emit less than 2 GtC (which is approximately twenty percent of the anthropogenic global carbon emissions in 2015, see Boden et al. (2017)), less than 1 GtC, and less than 0.05 GtC annually from 2100 onwards. Further, we consider scenarios with Intended National Determined Contributions (INDC) and without INDC (w/o INDC) (Fawcett et al. 2015; Rogelj et al. 2016).6 In particular, we assume global carbon emissions to be 9.1 GtC in 2010 and 9.9 GtC in 2015 (Boden et al. 2017). In the INDC scenarios, the Climate Policy due to the Paris Agreement (COP 21) is implemented by global carbon emissions assumed to be 10.7 GtC in 2030, including the INDCs until 15 October 2015 (see Fawcett et al. (2015), Supplementary Material, Table S6, Scenario Paris Continued Ambition).7 In addition, we conduct an analysis of the impacts by CEI (12.6%, 9.0%, 5.3%, and 3.7% p.a., see Lorenz et al. (2012); The Copenhagen Diagnosis (2009)) on the low emission scenarios.8 In total, 75 policy scenarios are simulated: 3 (BAU, GMT ≤ 1.5, and GMT ≤ 2.0) + 3 (2100 CP, 2080 CP, 2060 CP) × 4 (12.6%, 9.0%, 5.3%, and 3.7% p.a.) × 3 (0.05 GtC, 1 GtC, and 2 GtC) × 2 (INDC and w/o INDC) = 75 (see Table 2 or Table 3 for a tabular presentation of the climate policy scenarios).9 In addition to the climate policy scenarios, four scenarios have been simulated for RCP scenarios for comparison purposes, which are presented in Appendix A.

4. Simulation Results and Discussion

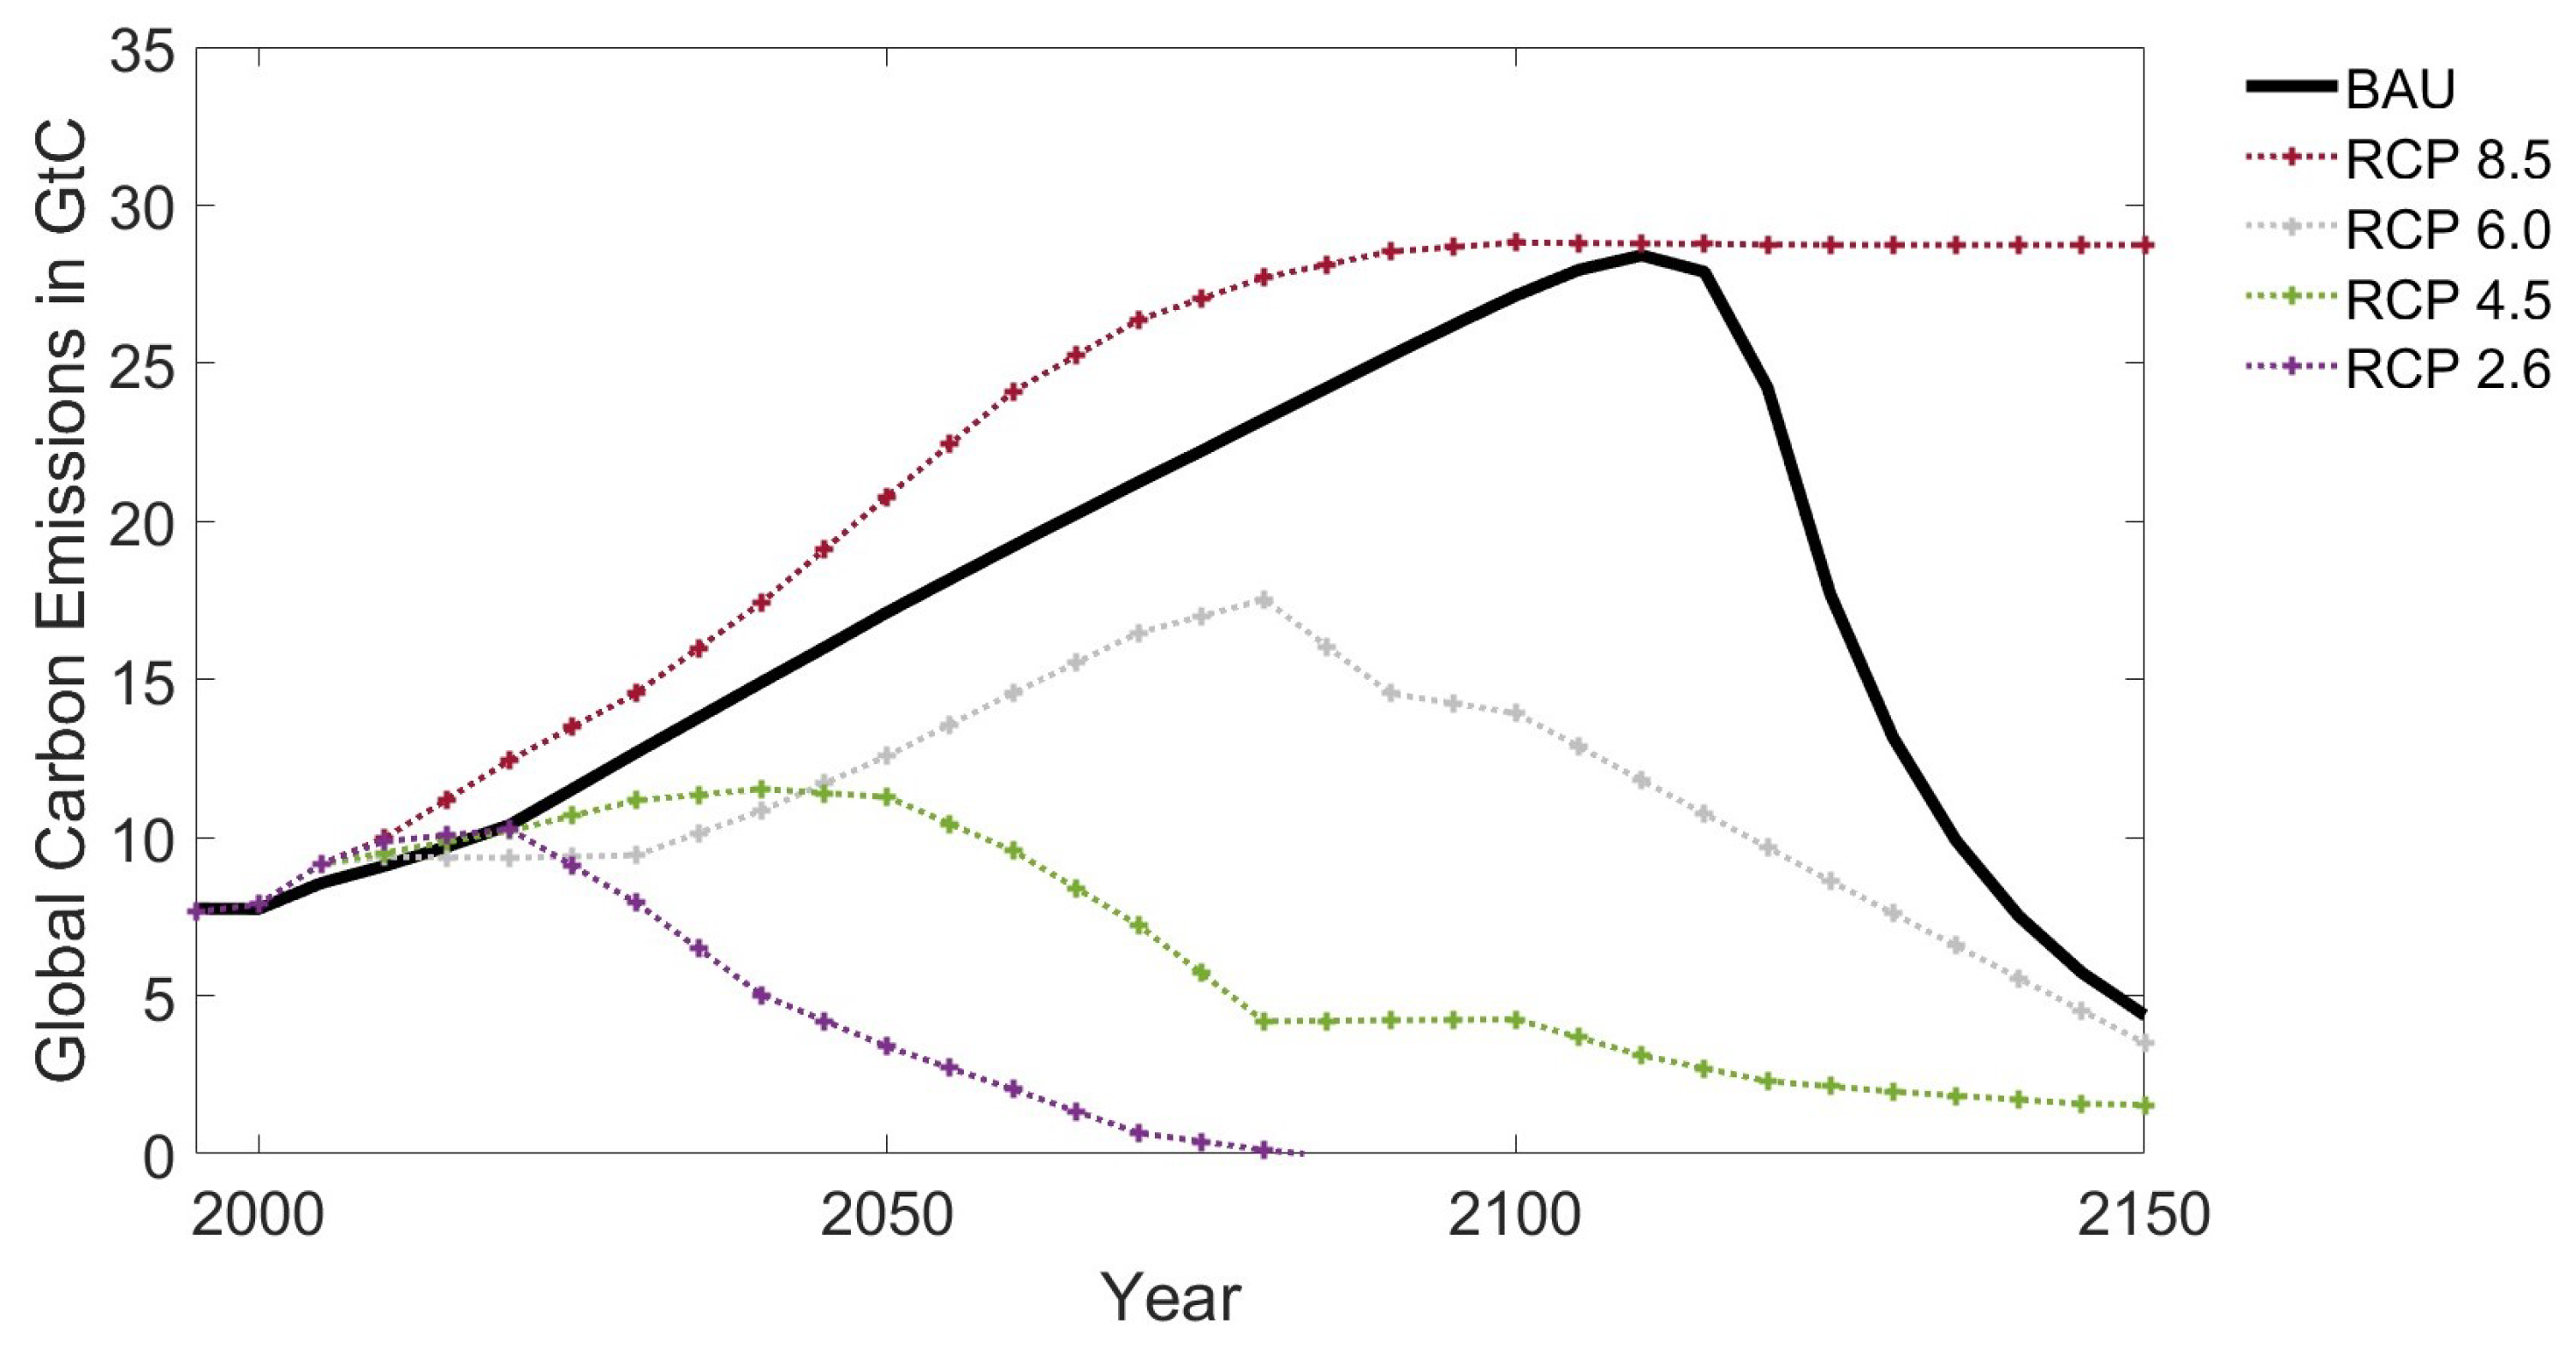
This section presents and discusses the simulation results of the climate policy scenarios concerning global carbon emissions, global mean temperature change, investments in renewable energy production, and Δ CBGE. For brevity, only the figures under INDC and w/o INDC for the CEI 12.6% and 3.7% p.a. are presented. All figures include two scenarios for comparison: BAU and GMT ≤ 2.0 °C. For comparison purposes, Figure A1 in Appendix A shows global carbon emissions for BAU and RCP scenarios.
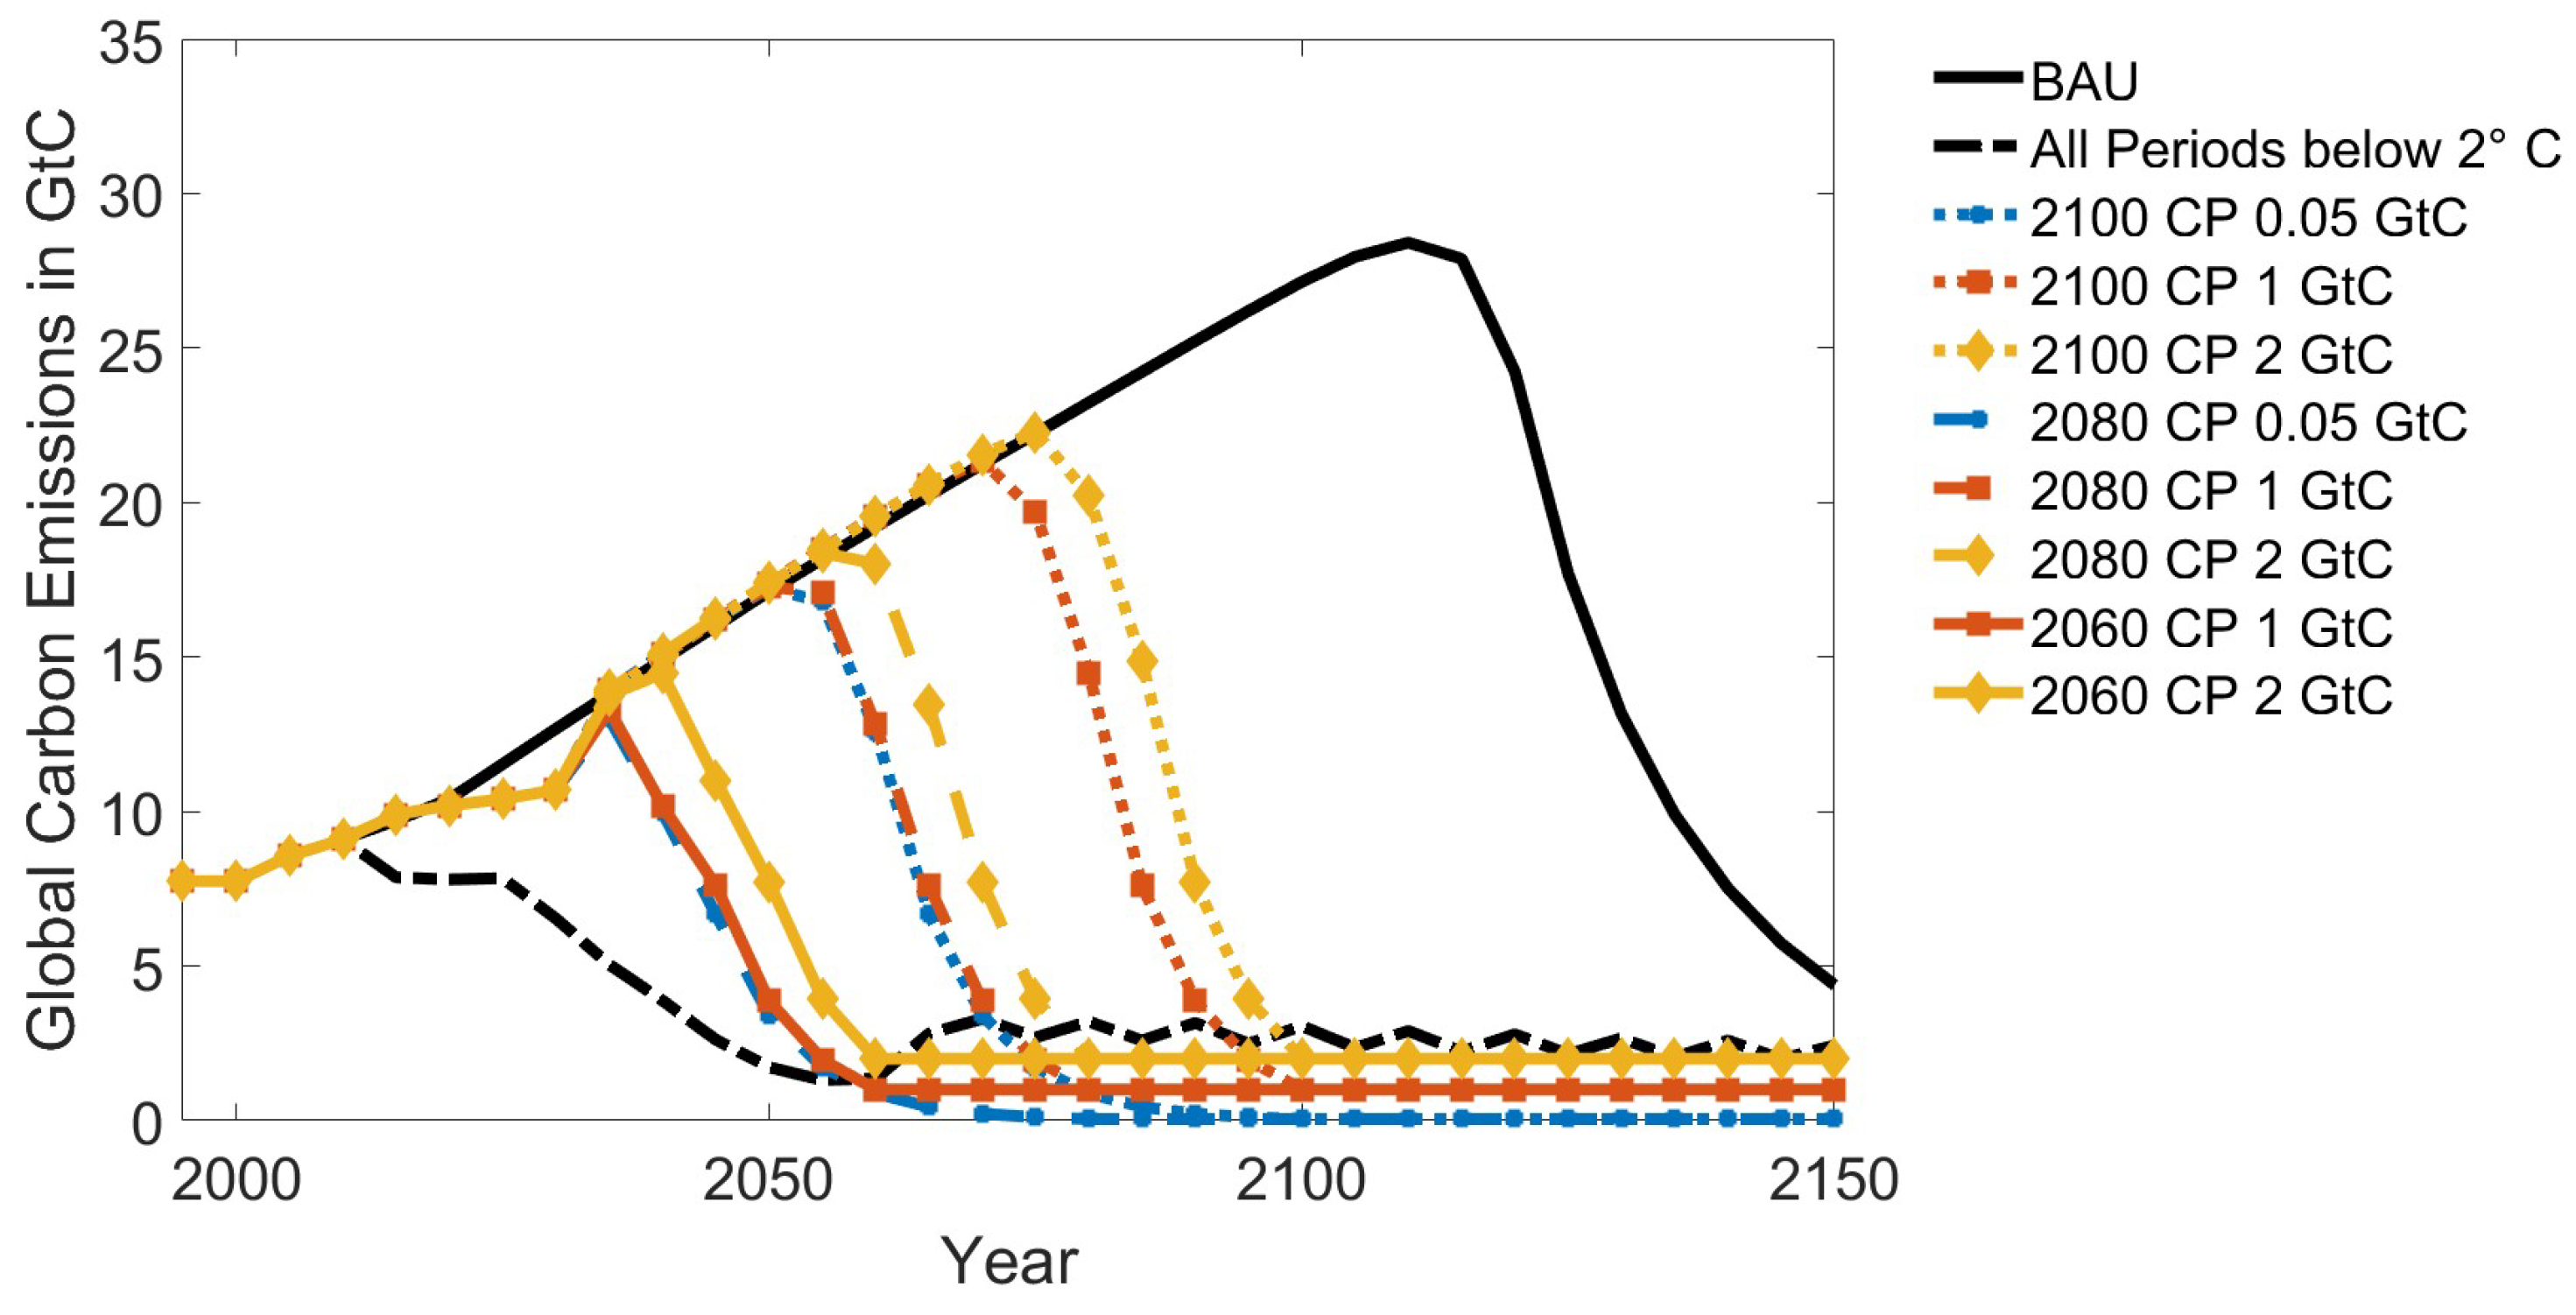
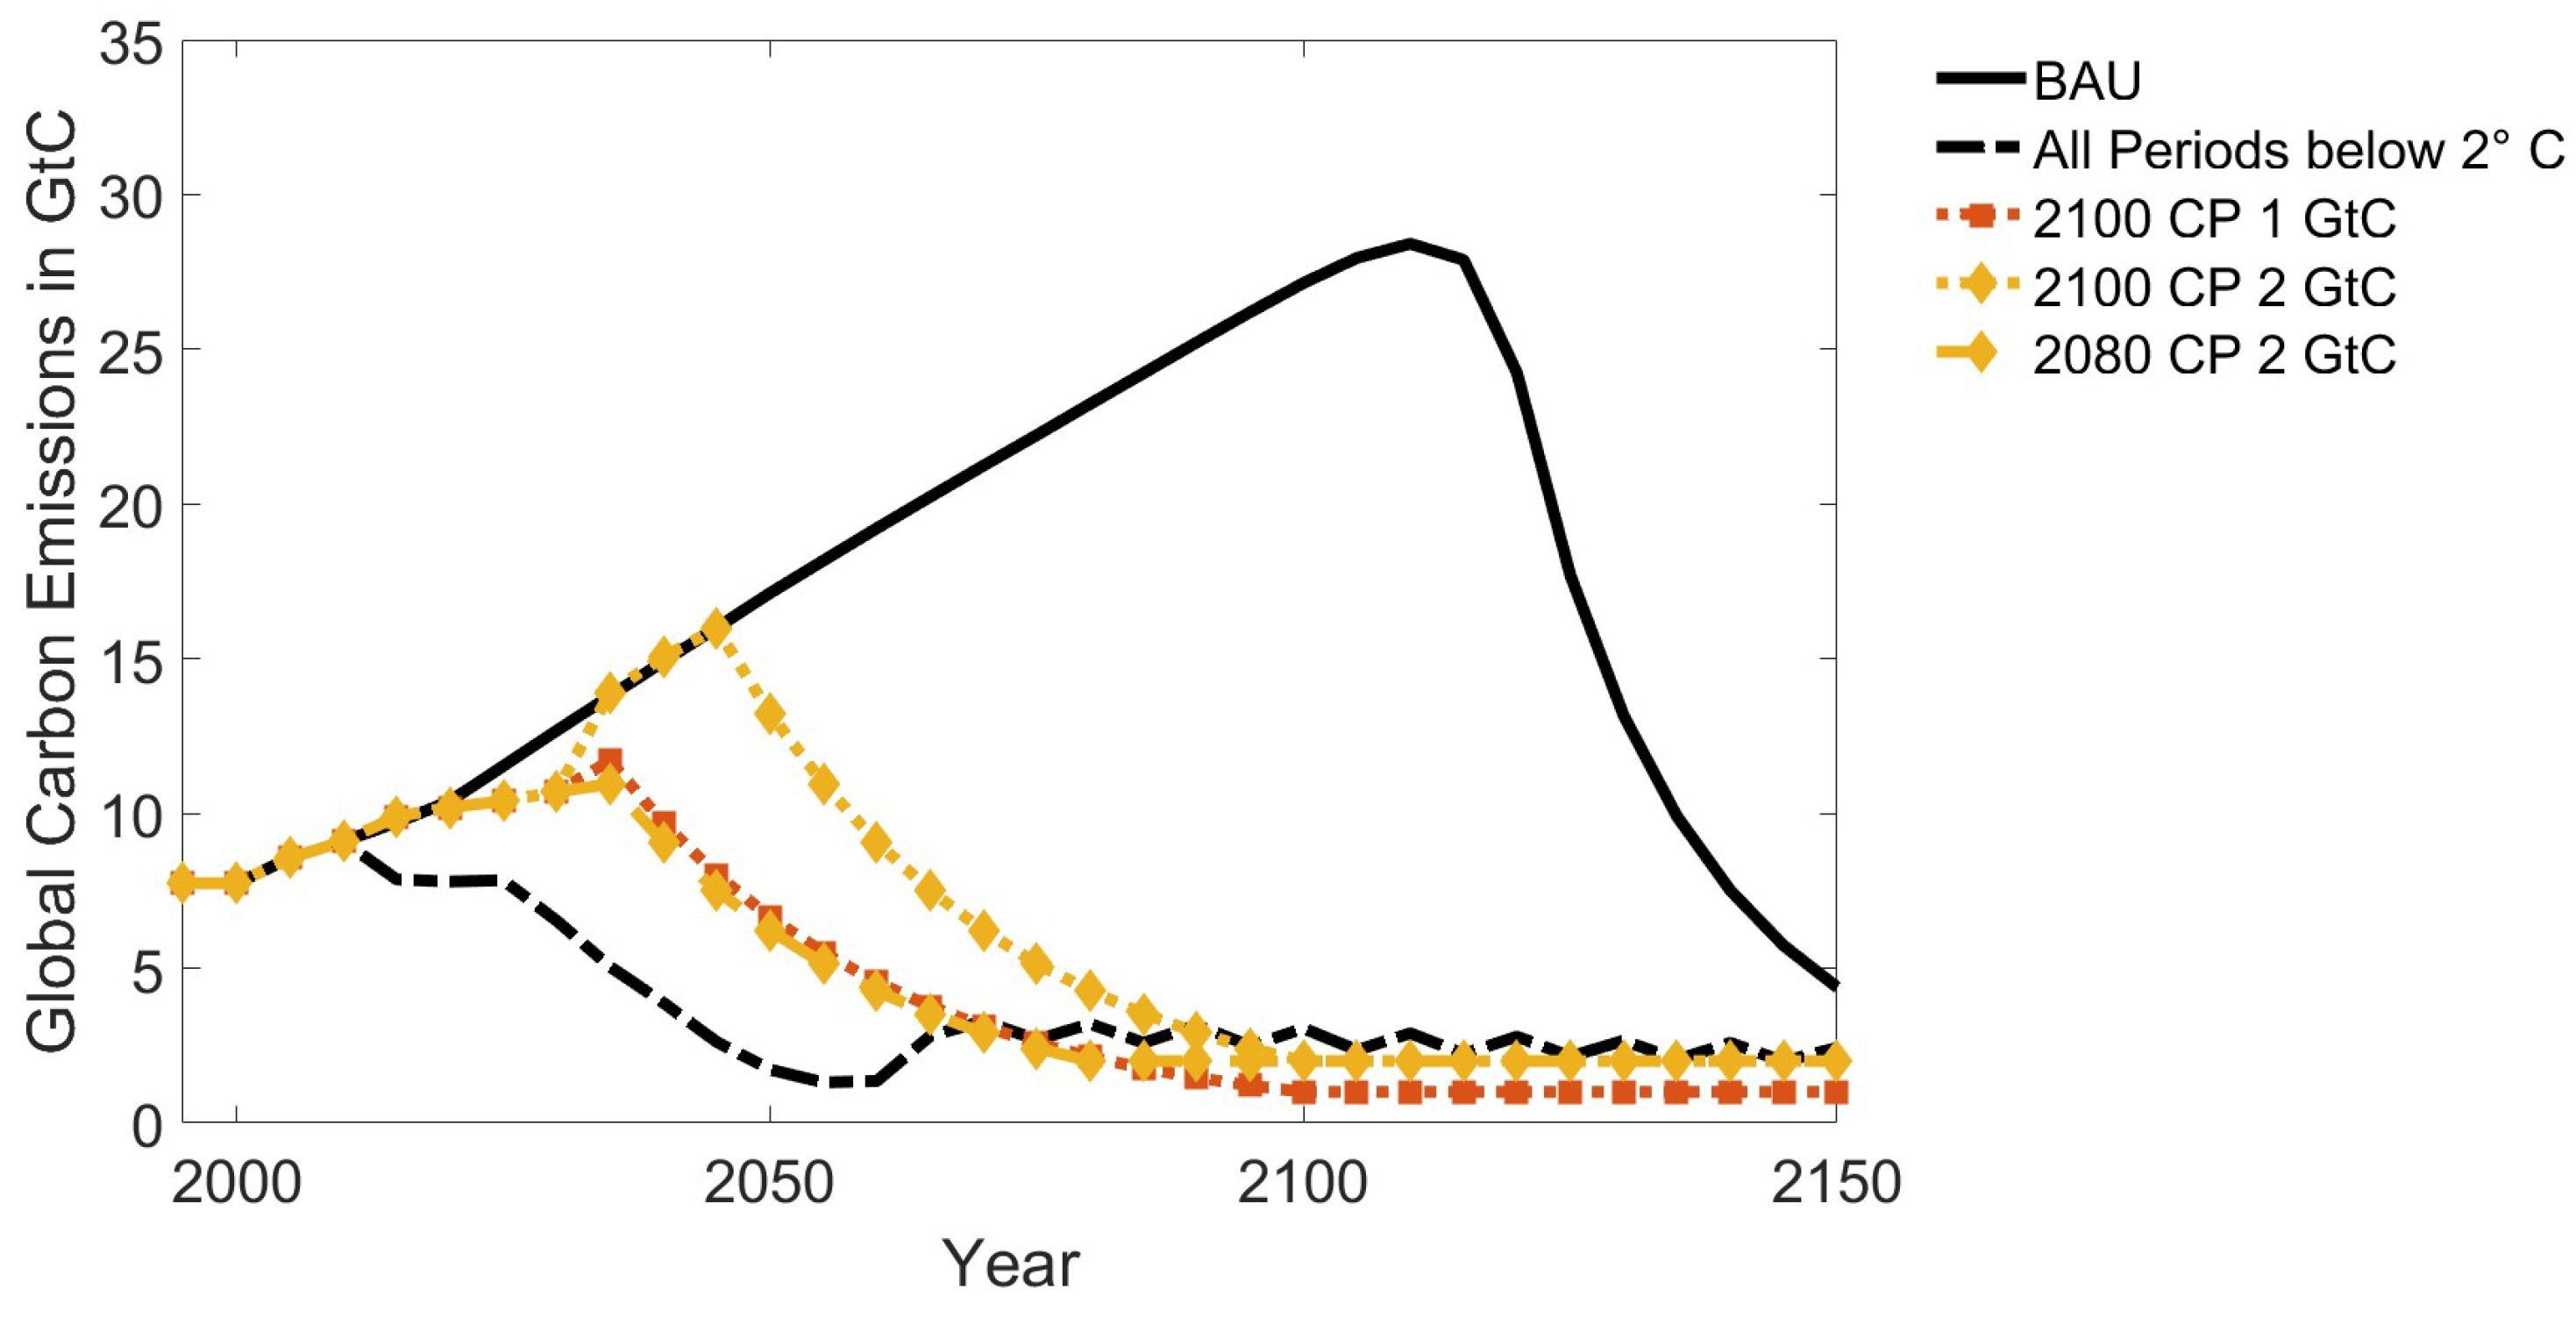
Figure 1, Figure 2, Figure 3 and Figure 4 display the anthropogenic global carbon emissions for the climate policy scenarios. The GMT ≤ 2.0 °C scenario is characterized in the long term by fluctuations of global carbon emissions around 2 GtC, which is the reason to investigate additional scenarios with less than 2 GtC. Note that the GMT ≤ 1.5 °C scenario becomes infeasible since we do not allow for negative emissions.
The results show that the global carbon emissions of the climate policy scenarios are in the range of the RCPs. Moreover, the global carbon emission pathways deviate from the BAU scenario at different times depending on when a climate policy prescribes the global economy to achieve the low emission target. The figures visualize the lead time for climate protection, i.e., the time between deviating from the BAU scenario and reaching the low emission goal. For example, in Figure 1 with the CEI 12.6% p.a., the lead times for climate protection under the climate policy scenarios 2100 CP 0.05 GtC p.a., 2080 CP 0.05 GtC p.a., and 2060 CP 0.05 GtC p.a. range from 35 to 50 years. The most moderate climate policy scenario (2100 CP 2 GtC p.a.) deviates from BAU in 2075 and, thus, has a lead time of 25 years. Compared to the most restrictive climate policy (2060 CP 0.05 GtC p.a.), BAU shows a range of the peak of global carbon emissions between 28.5 GtC (2110) and 9.5 GtC (2020). Figure 2 and Figure 4 show that many climate policy scenarios become infeasible under CEI 3.7% p.a. In Figure 2, the most moderate climate policy scenario (2100 CP 2 GtC p.a.) deviates from BAU in 2045 and, thus, has a lead time of 55 years, which is 30 years earlier than Figure 1. In Figure 2, the most restrictive climate policy (2060 CP 2 GtC p.a.) shows the immediate need to decarbonize.
Figure 3 and Figure 4 take INDCs until 2030 into account. Ceteris paribus, Figure 3 with CEI 12.6% p.a. shows a slight kink between 2015 and 2035; after that, the emission pathway falls back to BAU. The most moderate climate policy (2100 CP 2 GtC p.a.) deviates from BAU in 2075 and, thus, still has a lead time of 25 years. However, the scenario 2060 CP 0.05 GtC p.a. becomes infeasible because of the need for more and earlier decarbonization than the INDCs. For the same reason, Figure 4 includes fewer feasible scenarios than Figure 2. Ceteris paribus, Figure 4 presents 2100 CP 2 GtC p.a., showing the fall back to BAU, while 2100 CP 1 GtC p.a. and 2080 CP 2 GtC p.a. are characterized by continuing the path to decarbonization. BAU, compared to the latter climate policies, shows peaking range of global carbon emissions between 11 GtC (2080 CP 2 GtC p.a., 2035), 11.7 GtC (2100 CP 1 GtC, 2035), and 28.5 GtC (BAU, 2110).
In summary, Figure 1, Figure 2, Figure 3 and Figure 4 reveal that the optimal global carbon emission path is significantly affected by the lower bound of CEI. In addition, if INDCs are taken into account, high CEI indicates a high probability of a fall back to BAU. In contrast, low CEI favors continuing the path to decarbonization. Hence, early carbon emission cuts are necessary when the decarbonization of the global economy is expected to be slow.
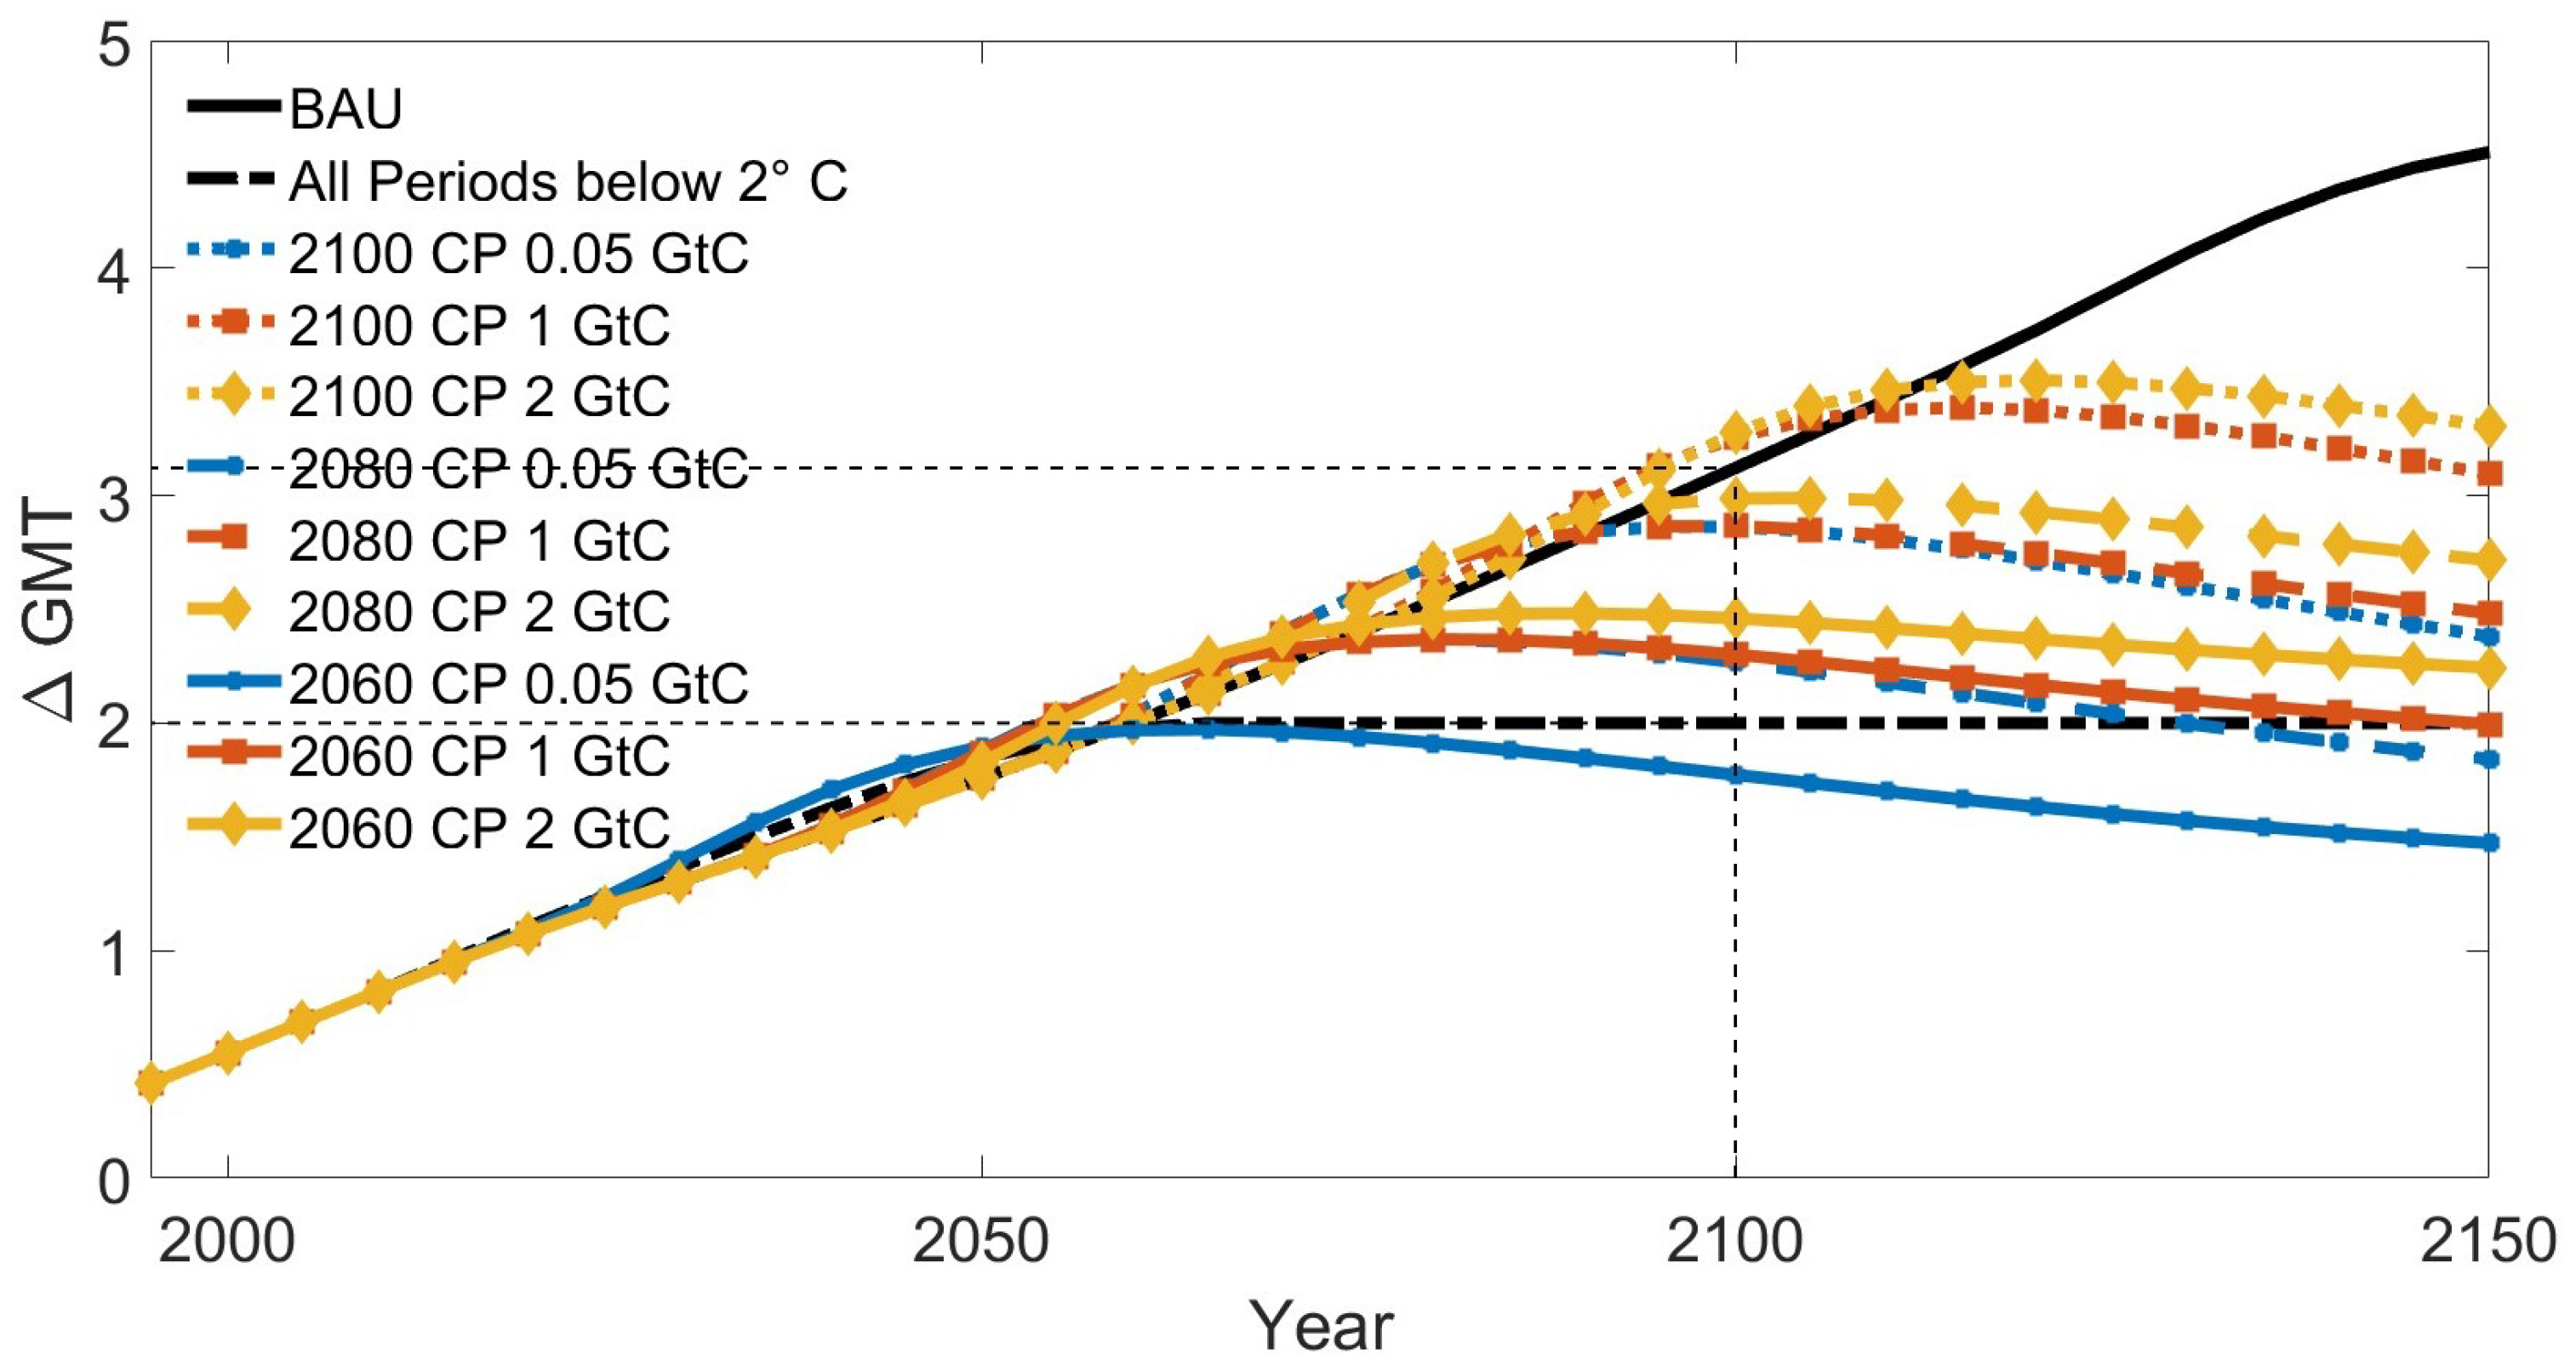
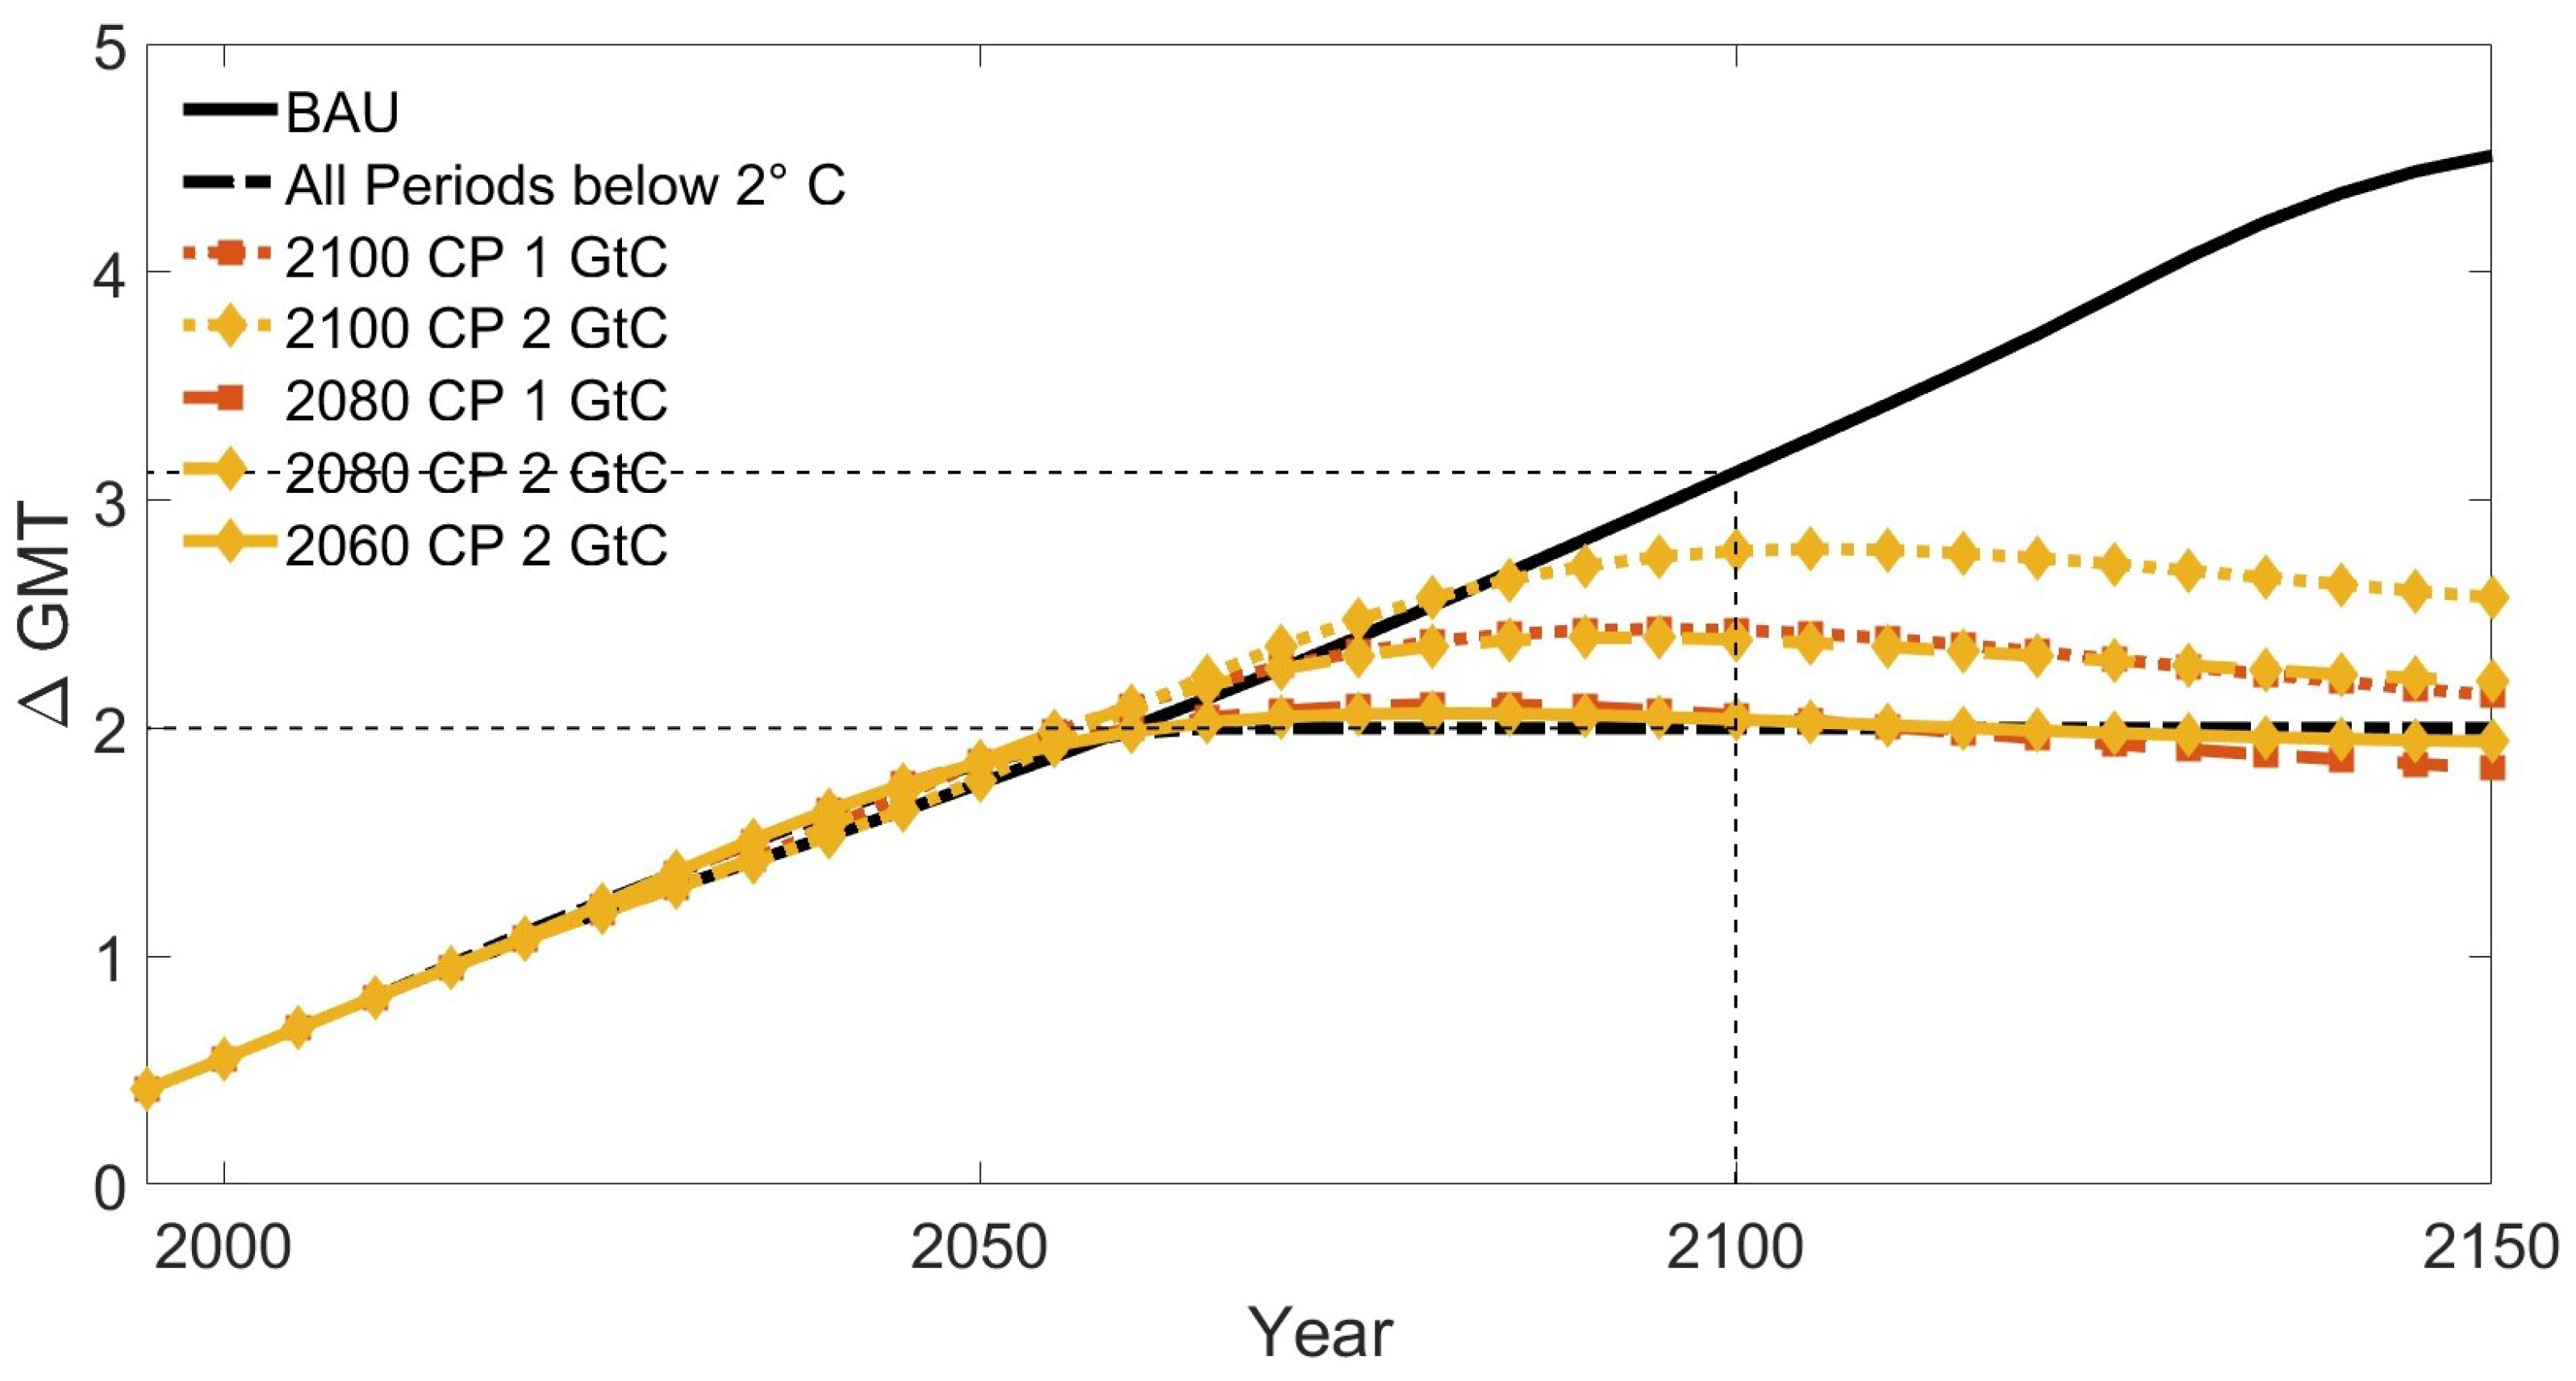
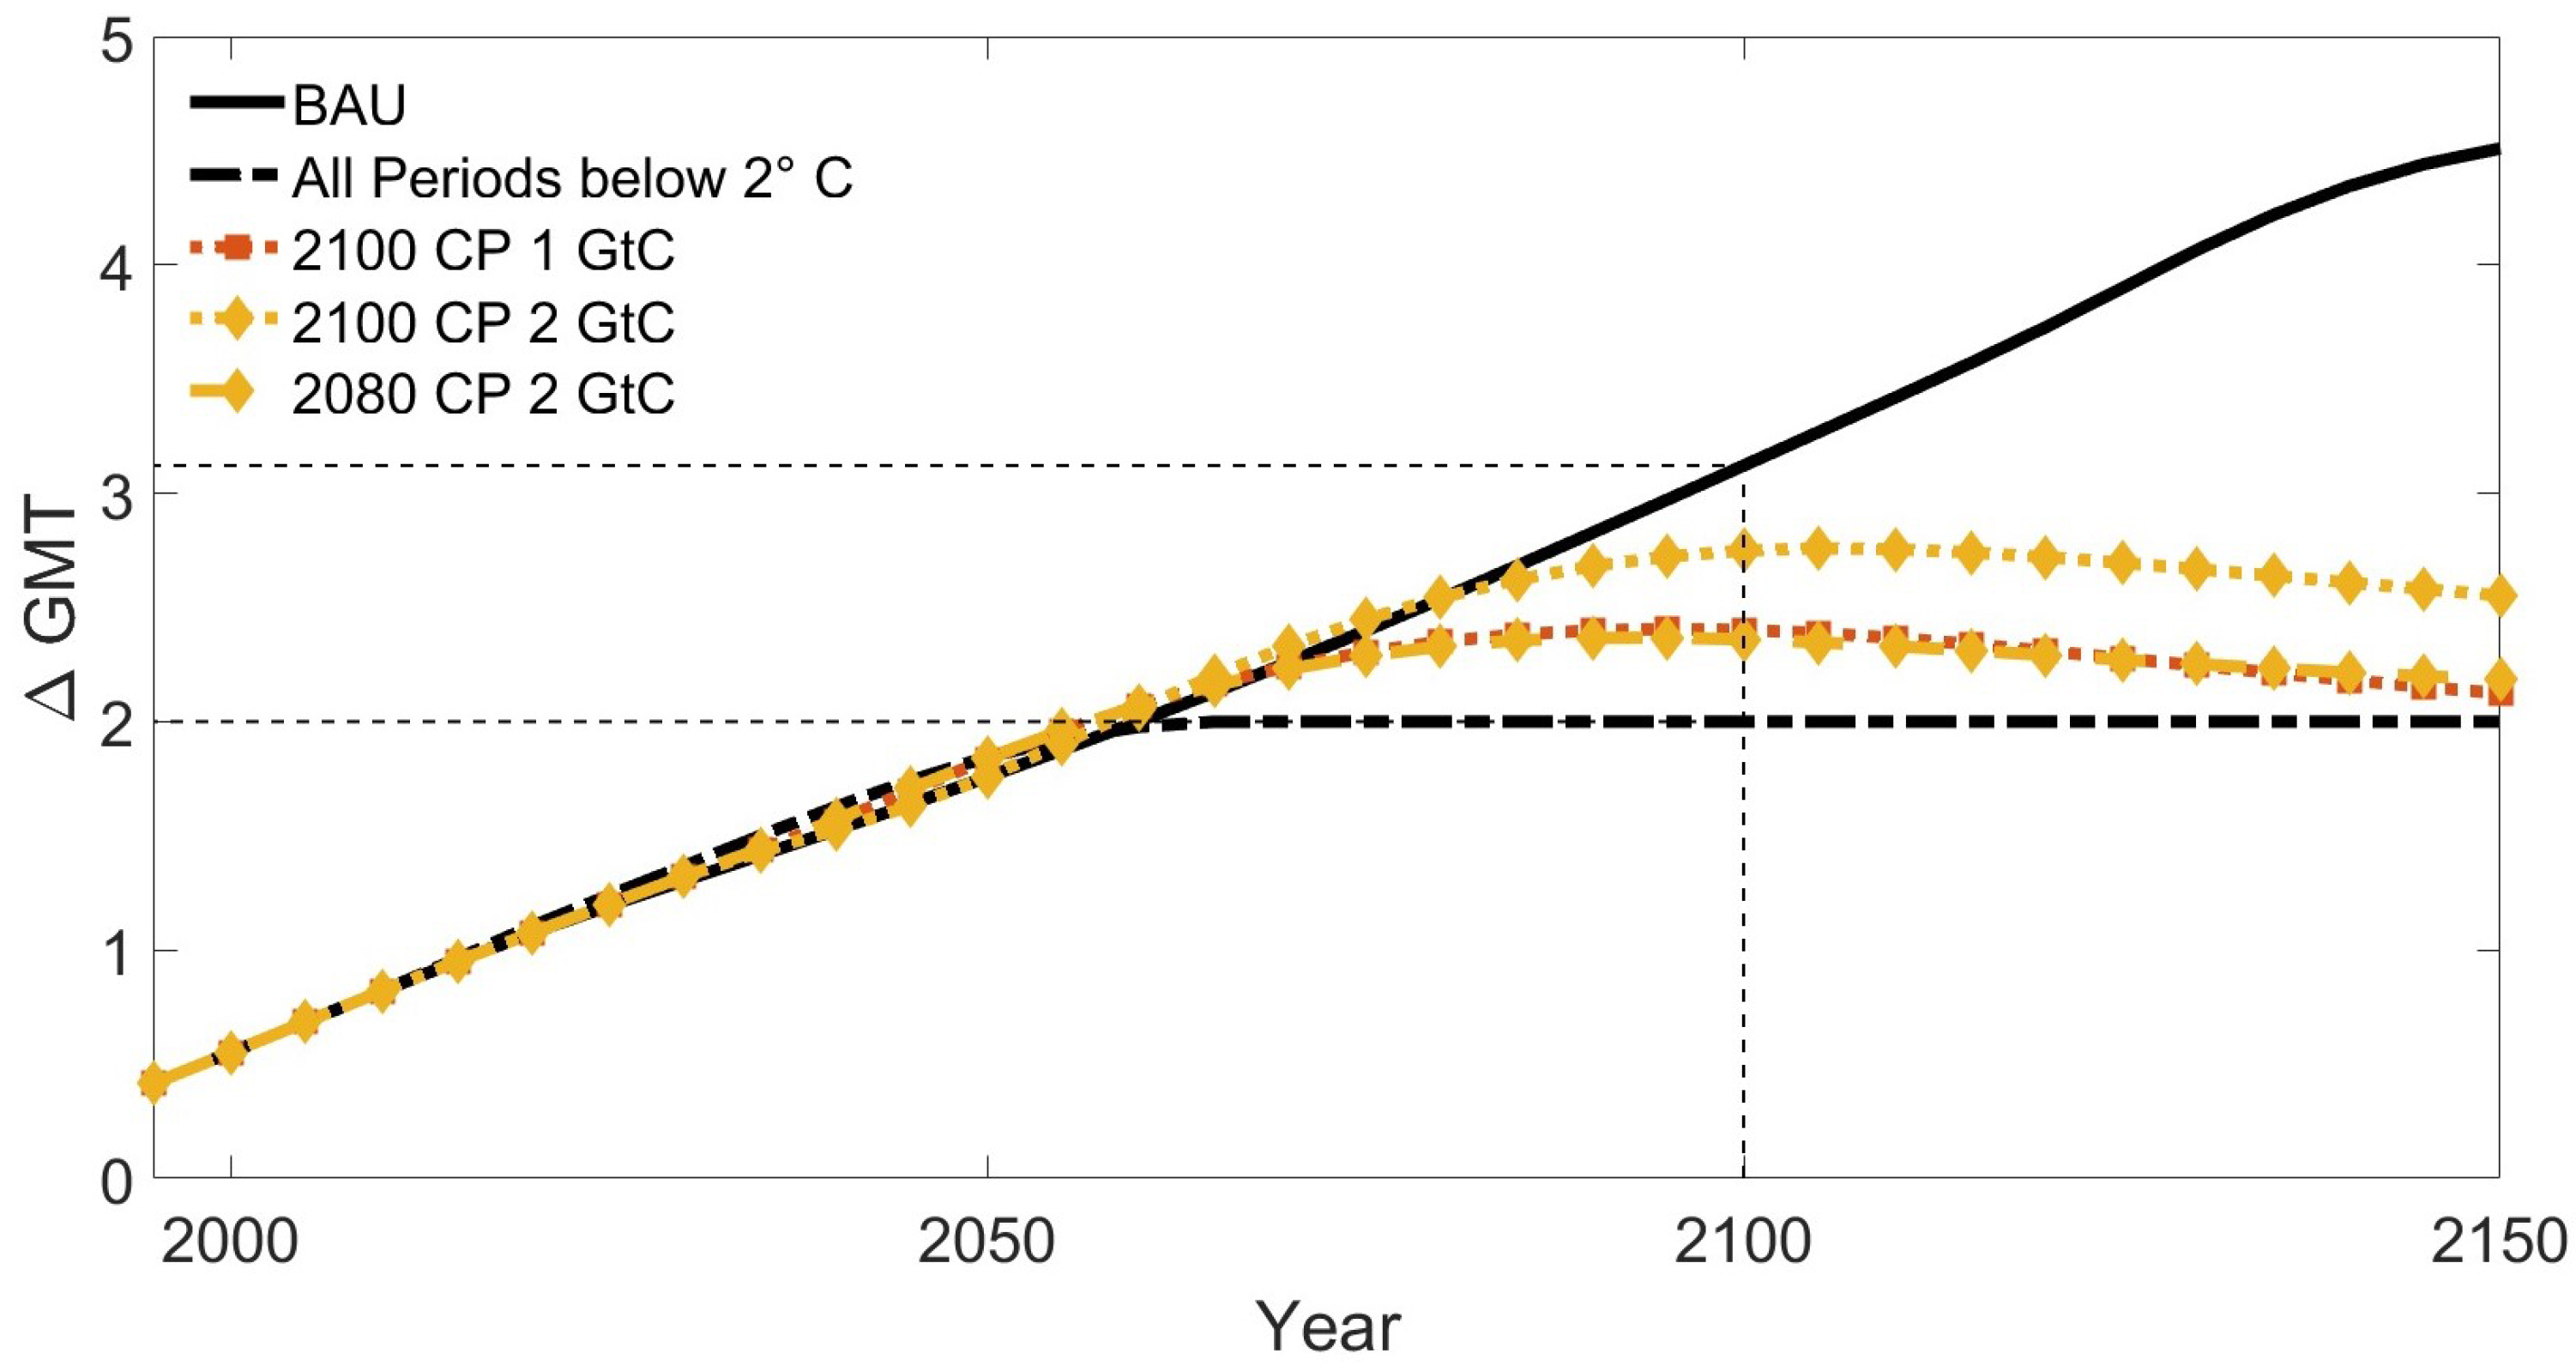
Figure 5, Figure 6, Figure 7 and Figure 8 present the global mean temperature (GMT) change in the atmosphere for the respective scenarios. GMT in these figures is in line with data in the Fifth Assessment Report (AR5) of the Intergovernmental Panel on Climate Change (IPCC) (see Stocker et al. (2013)).10 However, in the short term, the GMT change of the atmosphere is greater than in the BAU scenario and then leads to a lower GMT change in the long term. This short-term temperature-raising effect seems to be caused by the vanishing of the short-term cooling effect due to SO2. Bartlett et al. (2017) and references therein (Chalmers et al. 2012; Kirtman et al. 2013; Lamarque et al. 2011) discuss the short-term cooling effect of SO2, as one of the factors for the high short-term global warming in RCP 2.6 compared to other RCPs.11
Further, the GMT change in 2100 is visualized in Figure 5, Figure 6, Figure 7 and Figure 8. In Figure 5 with CEI 12.6% p.a., the most moderate scenarios 2100 CP 2 GtC p.a. and 2100 CP 1 GtC p.a. overshoot BAU with respect to the temperature target in 2100 (3.28 °C and 3.26 °C vs. 3.12 °C). However, the most restrictive scenario 2060 CP 0.05 GtC p.a. does not transgress the 2 °C threshold (the maximum GMT change, 1.97 °C, is reached in 2065) and allows to keep the GMT below 1.5 °C from 2140 onwards. In Figure 6 and Figure 8 with the CEI 3.7% p.a., some scenarios become infeasible for the same reason explained for Figure 2 and Figure 4. Figure 6 shows that all scenarios transgress the 2 °C threshold; 2060 CP 2 GtC p.a. reaches the maximum GMT change, 2.07 °C, in 2090 (it reaches 2.04 °C in 2100), while being below 2.07 °C from 2120 onwards (1.98 °C in 2120). Figure 7 and Figure 8 consider INDCs, which may lead in the carbon emission path to a kink or sustainable decarbonization (2100 CP 1 GtC p.a. and 2080 CP 2 GtC p.a.). The kink is responsible for an additional GMT decrease by approx. 0.02 °C in 2100 vs. approx. 0.03 °C when deacarbonization is sustainable in Figure 8 (2.43 °C vs. 2.40 °C and 2.39 °C vs. 2.36 °C). Figure 7 with the CEI 12.6% p.a. shows that all scenarios transgress the 2 °C threshold; 2080 CP 0.05 GtC p.a. reaches the maximum GMT change, 2.33 °C, in 2080 (it reaches 2.24 °C in 2100), while being below 2.0 °C from 2130 onwards (1.97 °C in 2100). In addition, 0.05 GtC scenario is in the range of the 1 GtC scenario when the latter starts decarbonizing efforts 20 years later.
Table 2 summarizes numerical estimates for the GMT change in 2100 compared to 1900 with the CEI 12.6%, 9.0%, 5.3%, and 3.7% p.a. and demonstrates that the estimates for 2100 lie between 1.77 °C and 3.28 °C. The largest difference between the scenarios INDC and w/o INDC is for 2100 CP 0.05 GtC and the CEI 9.0% p.a. (2.41 °C vs. 2.45 °C).
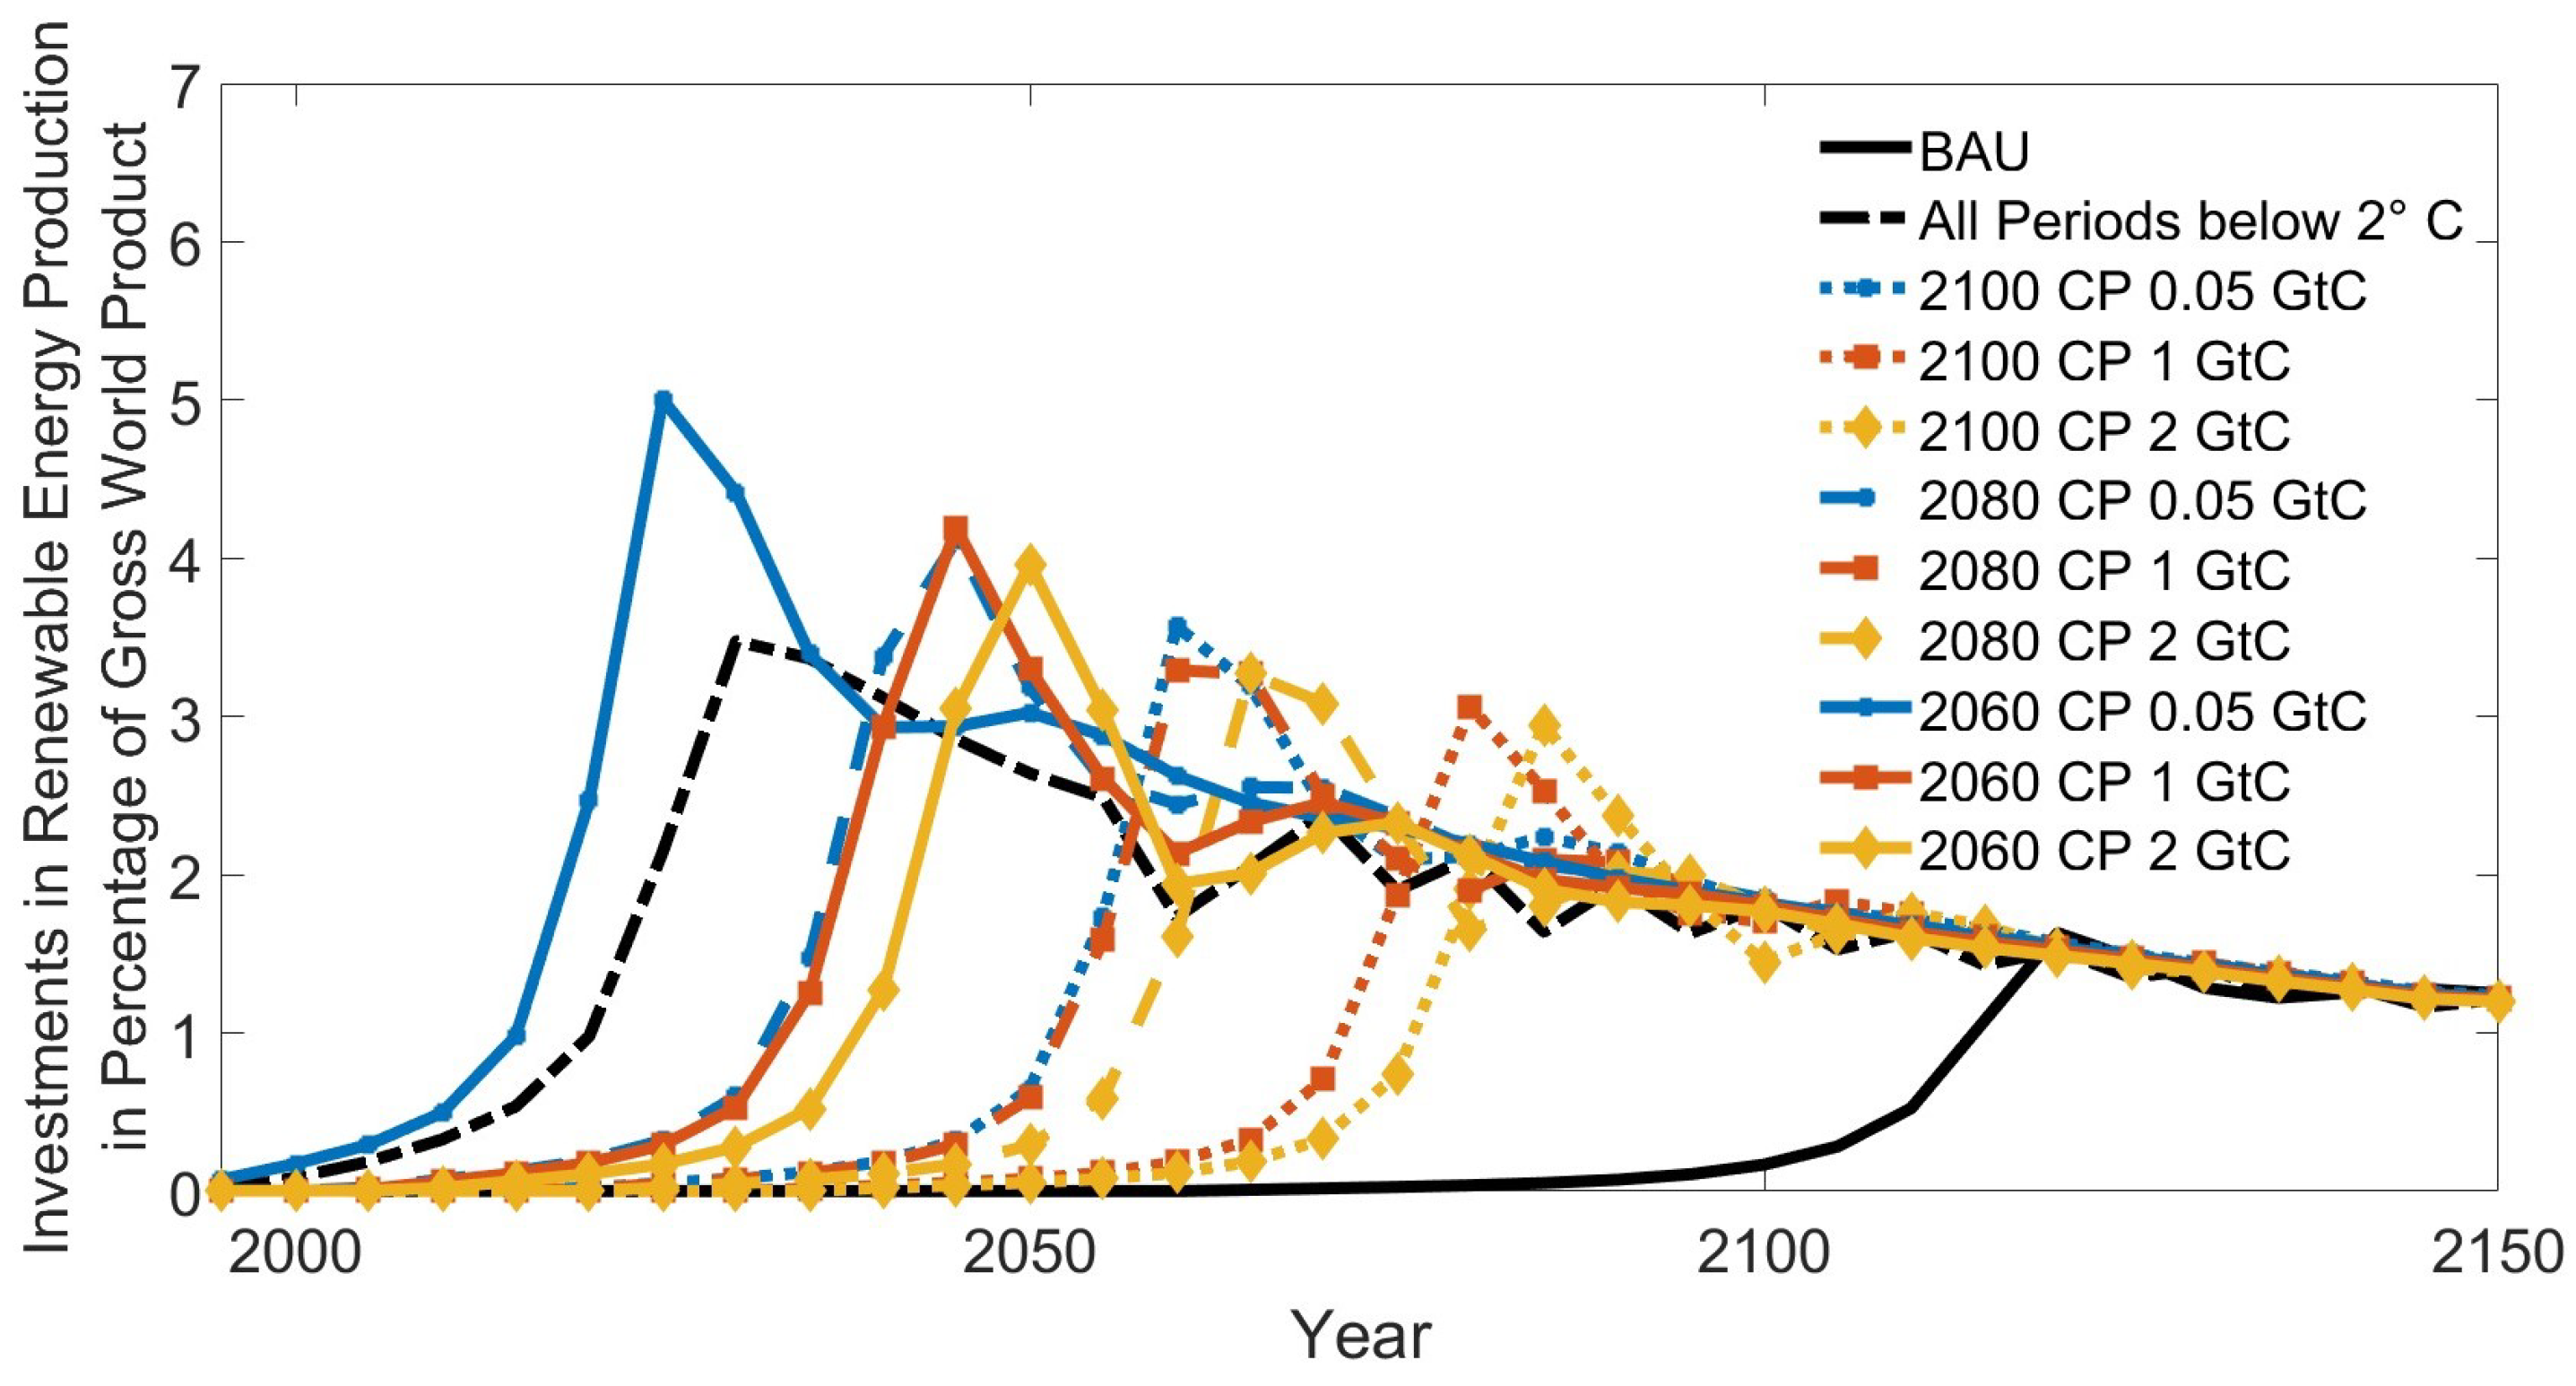
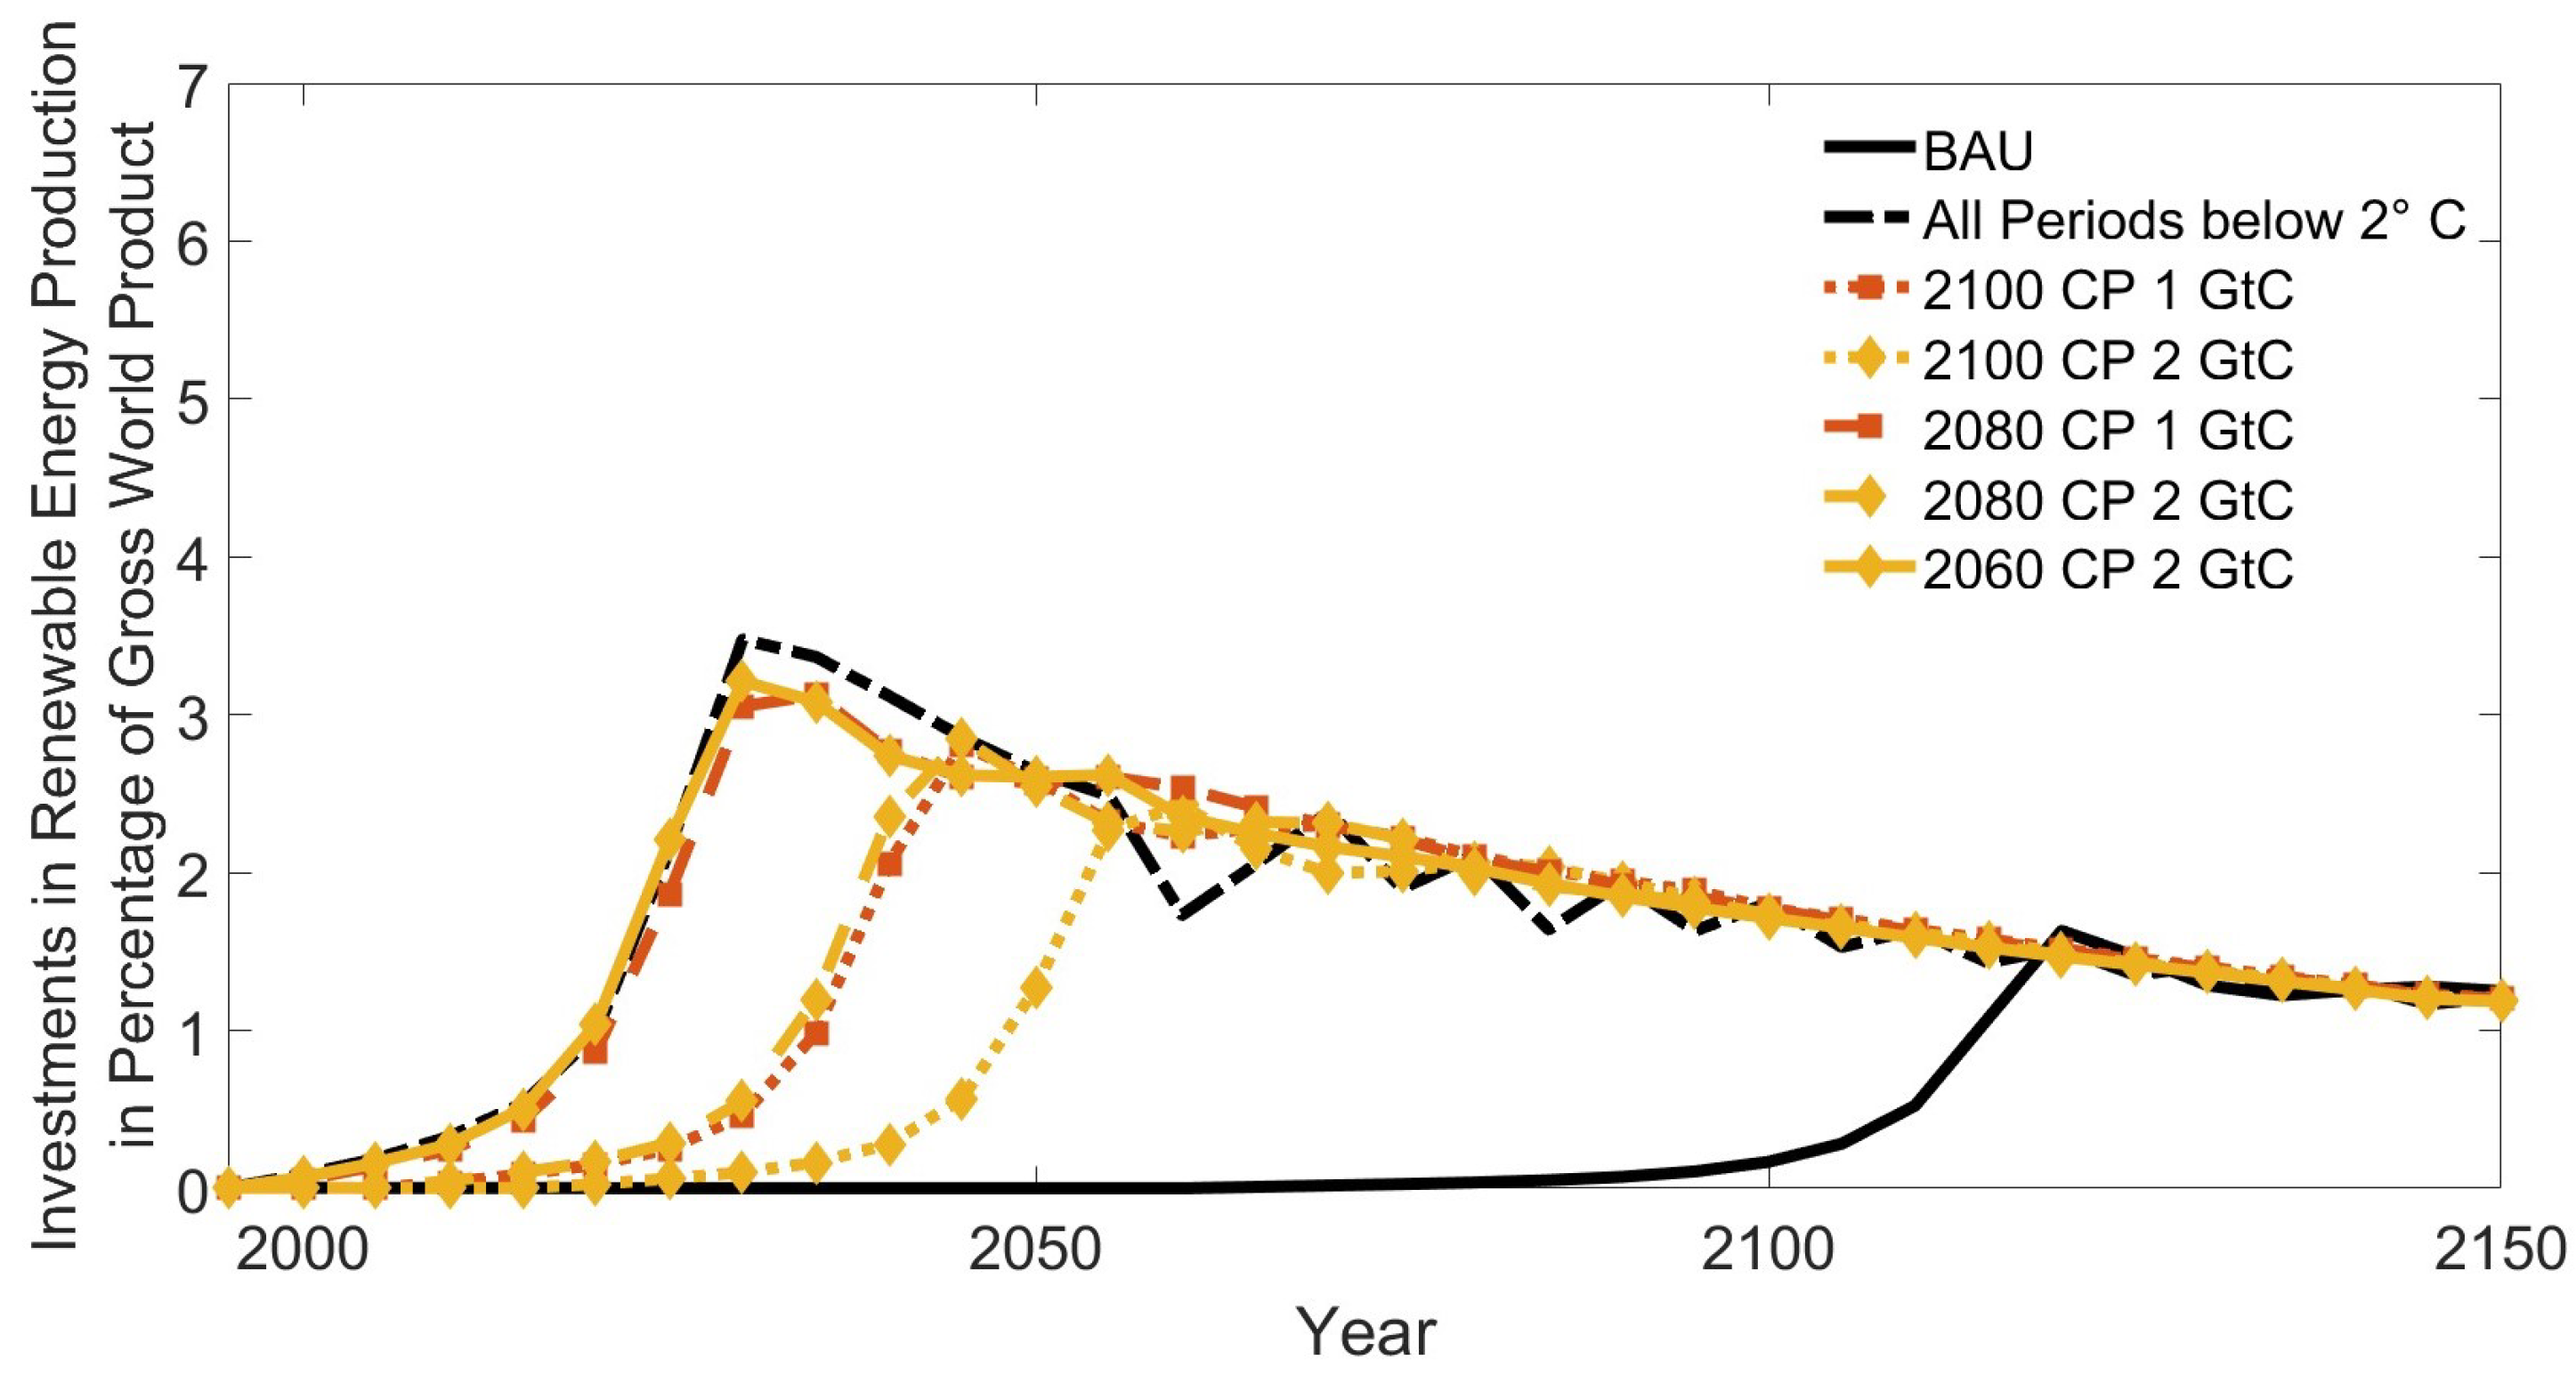
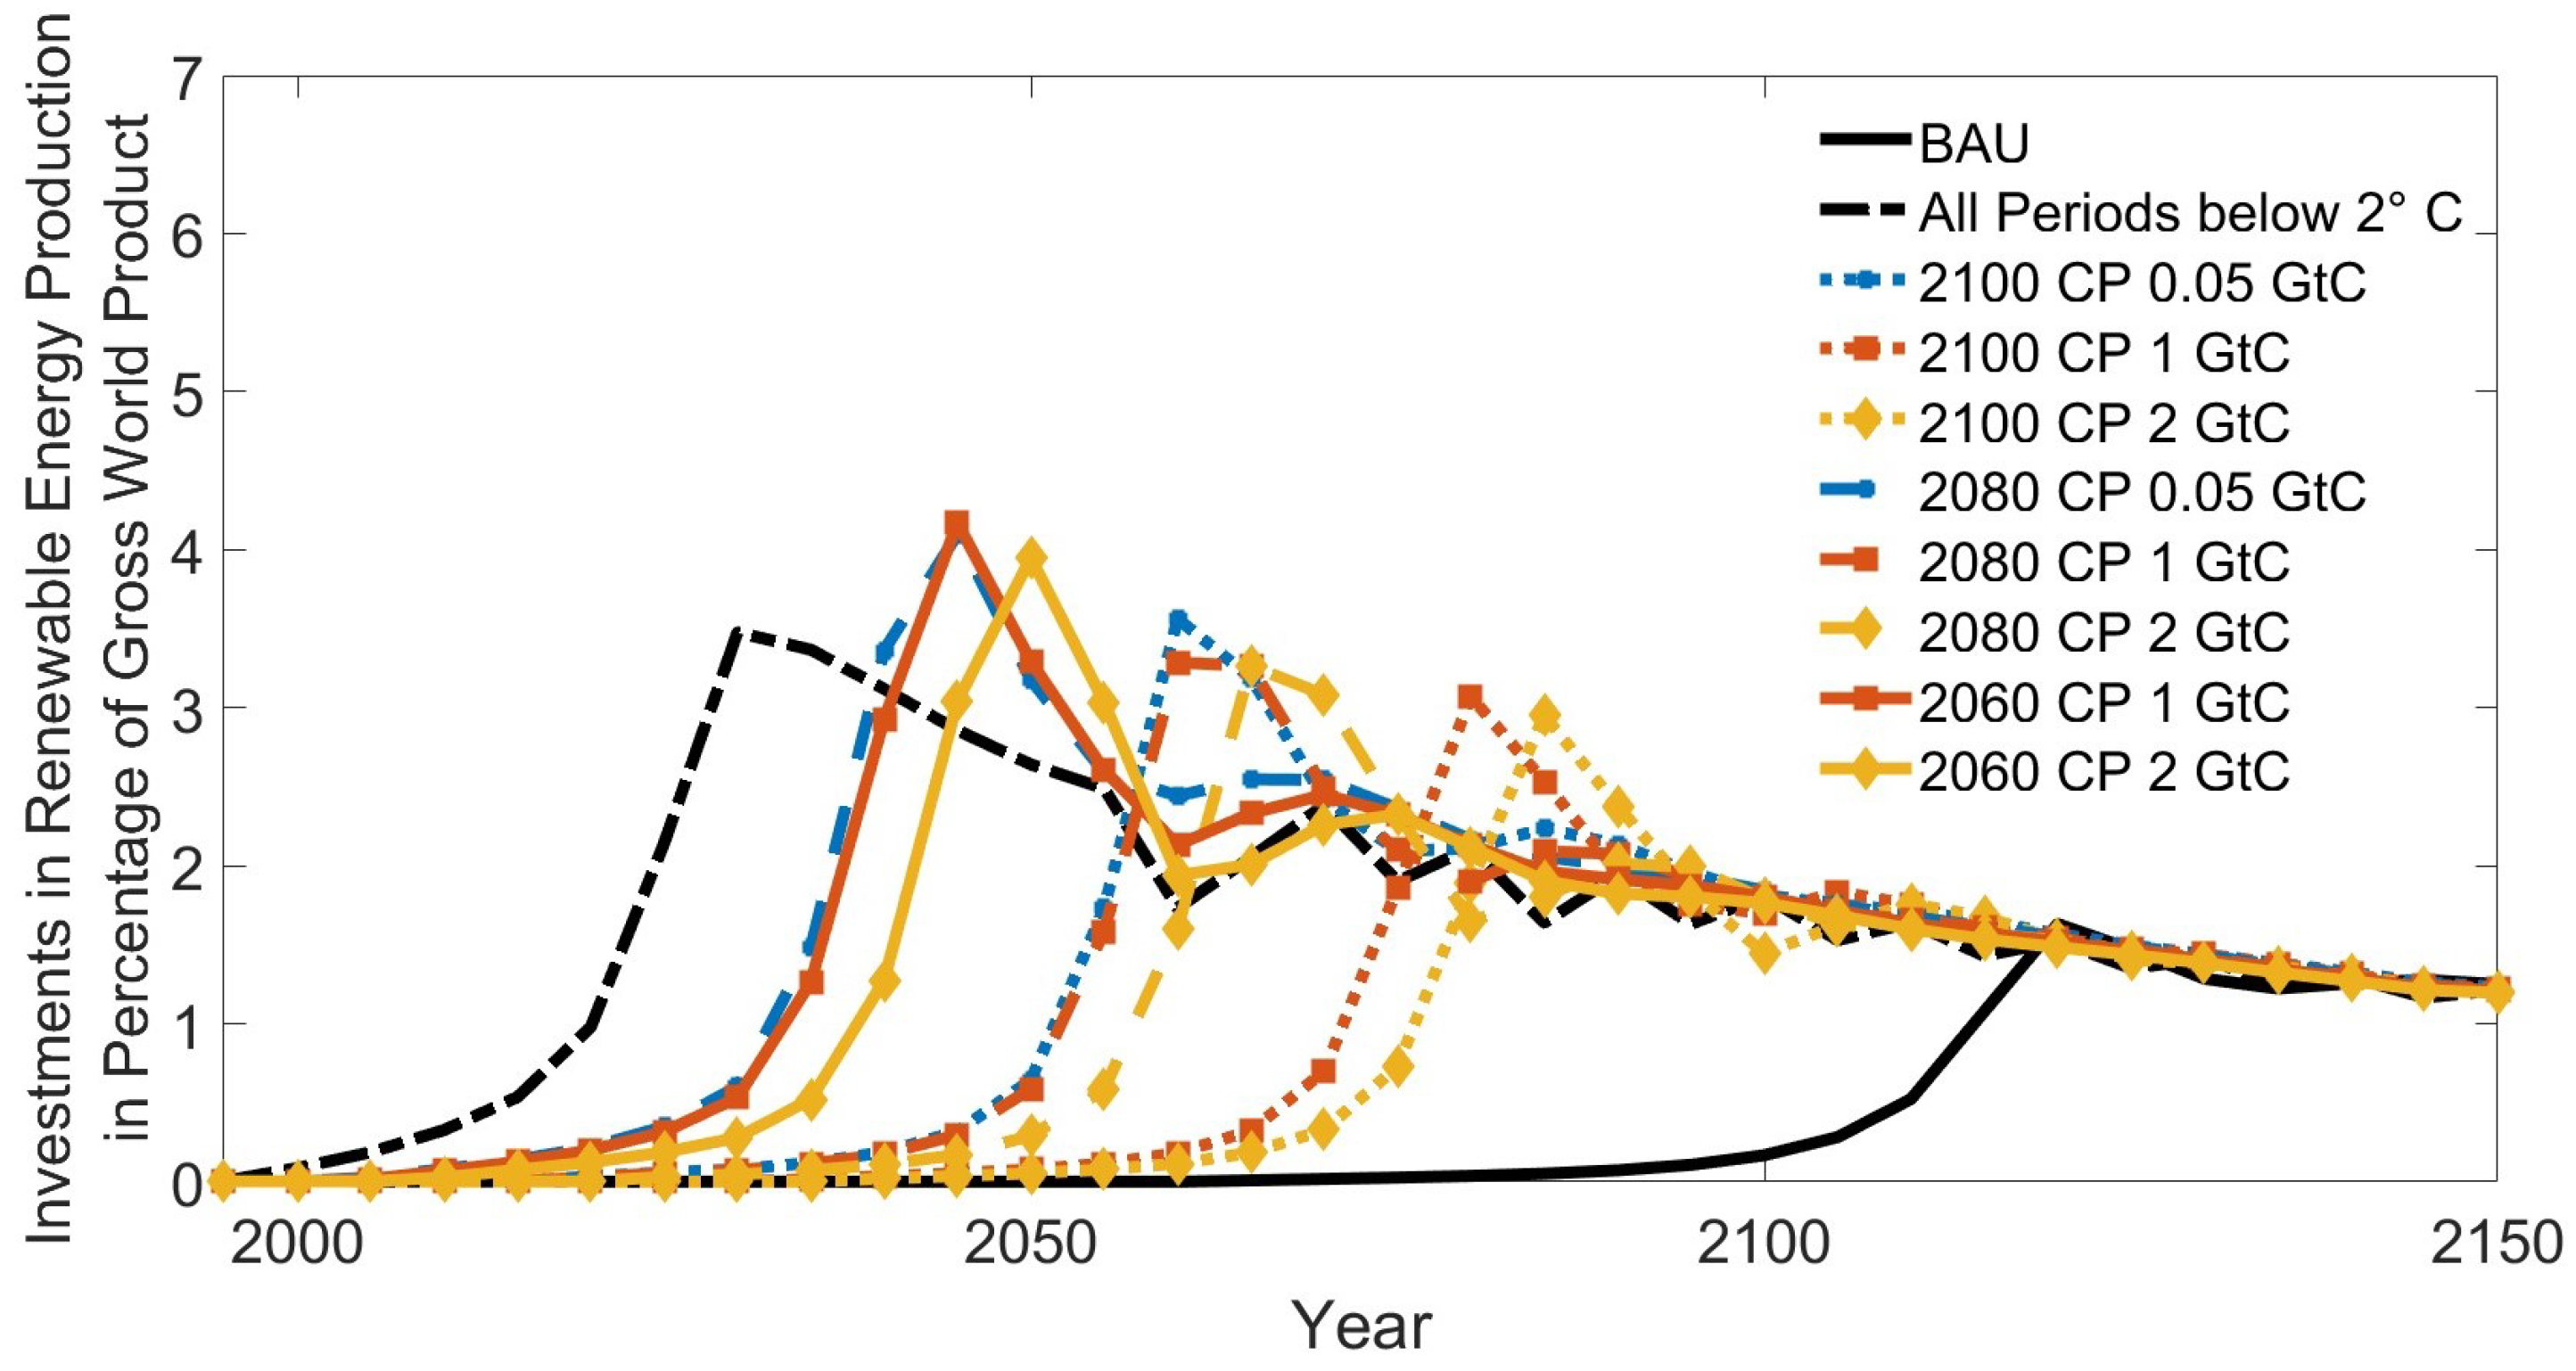
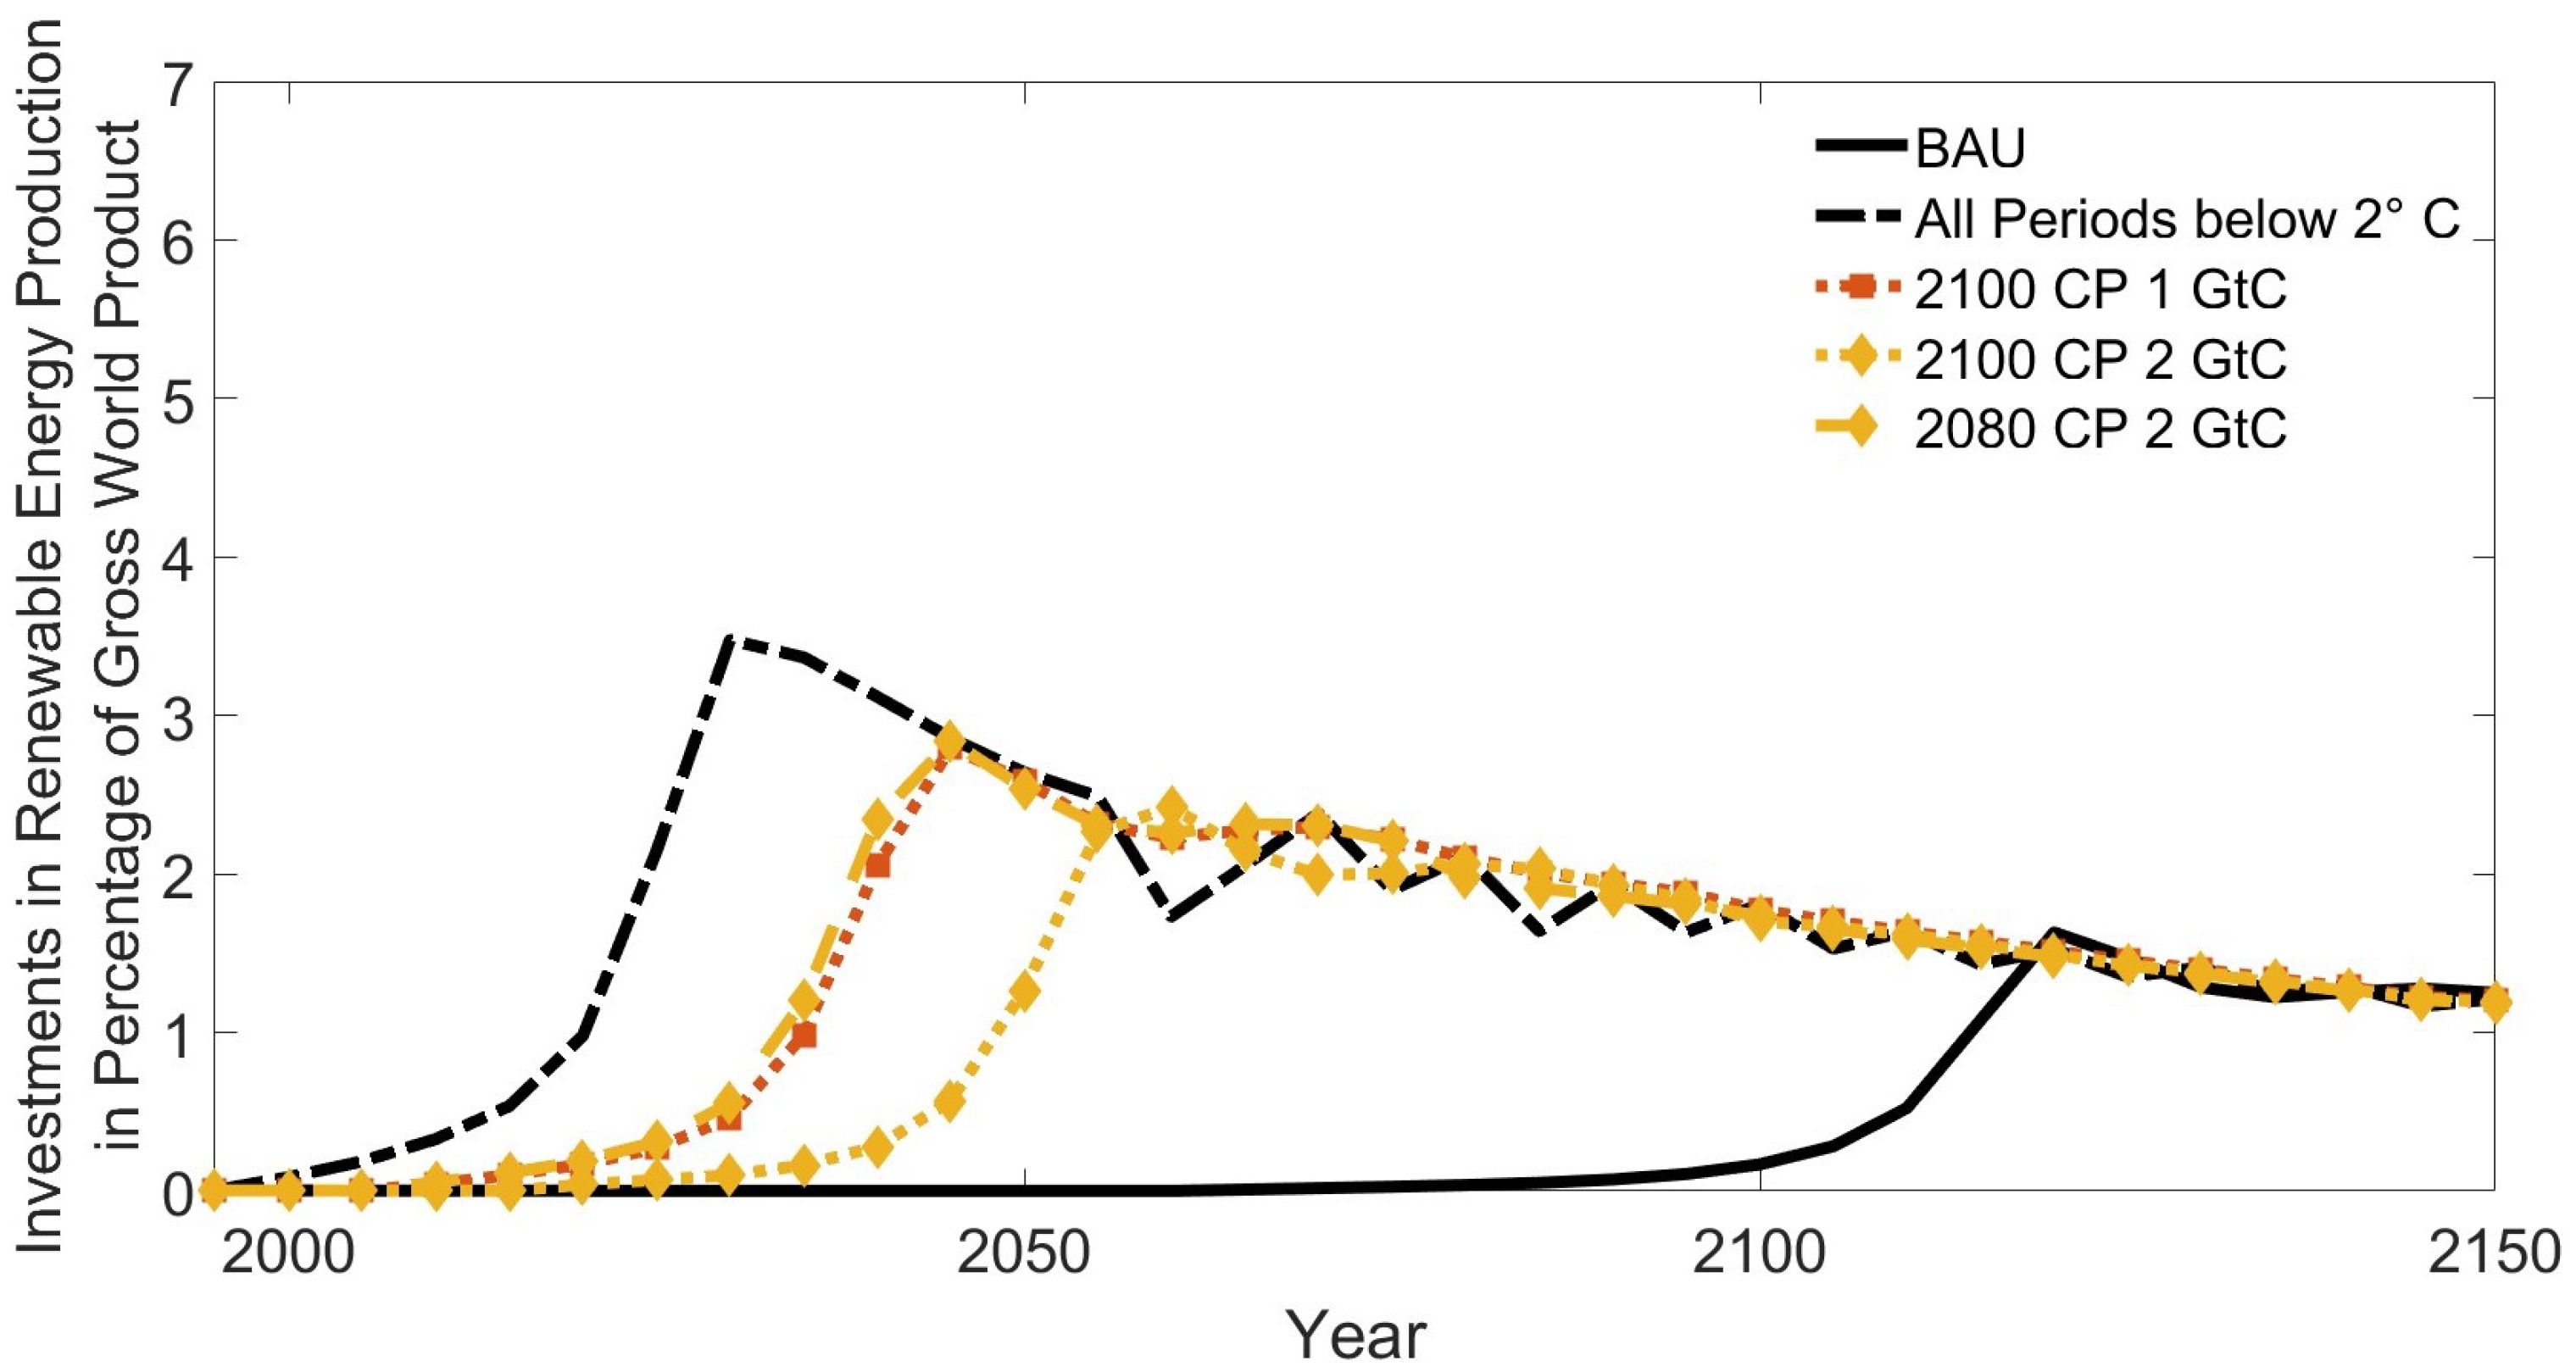
Figure 9, Figure 10, Figure 11 and Figure 12 present the investments in renewable energy production as a share of global economic output Y for the corresponding scenarios. Moreover, Table 3 summarizes the results on CBGE. REN 21 (2016) provides the following information on the investments in renewable energy:
“Global new investment in renewable power and fuels climbed to a record USD 285.9 billion in 2015 (not including hydropower projects > 50 MW). This represents a rise of 5% compared to 2014 (USD 270.2 billion) and exceeds the previous record (USD 278.5 billion) achieved in 2011. Including investments in hydropower projects larger than 50 MW, total new investment during 2015 in renewable power and fuels (not including renewable heating and cooling) was at least USD 328.9 billion. […] Solar power was again the leading sector by far in terms of money committed during 2015, accounting for USD 161 billion (up 12% over 2014), or more than 56% of total new investment in renewable power and fuels. Wind power followed with USD 109.6 billion, or 38.3% of the total (up 4%). All technologies except solar and wind power saw investment decline relative to 2014: investment in biomass and waste-to-energy fell by 42% to USD 6 billion, small-scale hydropower fell by 29% to USD 3.9 billion, biofuels fell by 35% to USD 3.1 billion, geothermal energy fell by 23% to USD 2 billion, and ocean energy fell by 42% to USD 215 million.”
Analogously, REN 21 (2015) estimates of the total new investment during 2014 in renewable power and fuels (not including renewable heating and cooling) amount to at least USD 301 billion. The World Bank (The World Bank 2015, 2016) provides gross domestic product (GDP) at a global scale so that we can calculate the share of investment in renewable energy production, that is, 0.448% in 2015 and 0.388% in 2014. OECD/IEA and IRENA (2017) estimate that “G20 countries accounted for around 85% of the USD 288 billion of global renewables investment in 2015” (p. 24).
Nevertheless, Figure 9, Figure 10, Figure 11 and Figure 12 show that the shares of investments in renewable energy are considerably higher than the estimates by the World Bank (The World Bank 2015, 2016) and OECD/IEA and IRENA (2017). For instance, the ≤2.0 °C scenario is characterized by early and huge investments up to 4% in 2030. The corresponding costs in terms of CBGE are 0.88%. In Figure 9 with the CEI 12.6% p.a. w/o INDC, 2060 CP 0.05 GtC is in line with the climate target but at the cost of 1.23% in terms of CBGE, and the share of investments peaks at 5% in 2020. In Figure 10, 2060 CP 2 GtC p.a. w/o INDC transgresses the climate target slightly (2.04 °C as shown in Figure 6) but at the lower cost of 0.83% in terms of CBGE, and the share of investments peaks at 3% in 2030. In Figure 11 with the CEI 12.6% p.a., we observe some fluctuations in 2060 that are not present in Figure 10 and Figure 12. However, 2060 CP 2 GtC p.a. INDC corresponds to global warming of 2.43 °C as shown in Figure 7 at the cost of 0.43%, and the investment peaks in 2045 at 4%. In Figure 12, 2100 CP 2 GtC p.a. INDC seems challenging: even with CEI in the most promising scenario, there will be an overshoot. This scenario corresponds to a rise in global warming by 2.75 °C as shown in Figure 8 at the cost of 0.23% in terms of CBGE (see Table 3).

5. Conclusions and Future Research

In this work, we perform a cost-effectiveness analysis with constraints on anthropogenic global carbon emissions, simulating six climate policy scenarios based on ideas proposed during the climate negotiations and discussions. For this purpose, we use the socio-economic integrated assessment model of investment and endogenous technological development (MIND), the application of which is significantly rising. Indeed, following the UNFCCC’s call for enhanced scientific investigation of the “related greenhouse gas emissions pathways” to stay well below 2 °C (UNFCC 2015a, p. 3), we investigate our low carbon emissions scenarios for reaching the targets in 2100, 2080, or 2060 without further including negative emission or geoengineering technologies. In other words, we provide a what-if study when negative emissions or geoengineering technologies are not available at a large scale. In this regard, we study the role of CEI as a crucial assumption in the model MIND, where the CEI can vary between 3.7 and 12.6% p.a. In addition, we consider two possible scenarios where compliance with the recent Intended National Contributions in 2030 (INDCs) either constrains the climate policies or not (w/o INDCs).
We conclude that the climate policy proposals do not comply with the 1.5 °C target, hence highlighting the necessity of negative emission technologies when aiming at such a tight target. However, we find climate policy scenarios may comply with the 2 °C target only if vast and immediate actions are implemented (see Table 2: 2080 CP 0.05 GtC CEI 9.0% p.a. w/o INDC, 2060 CP 0.05 GtC CEI 12.6% p.a. w/o INDC, 2060 CP 1 GtC CEI 5.3% p.a. w/o INDC). The results show that the assumption about CEI is crucial—the lower the CEI, the harder it is to decarbonize the global economy. The decarbonization of the global economy in 2060 is only possible if the target is 2 GtC and w/o INDC. In addition, satisfying the current proposed INDCs for 2030 incurs more costs since decarbonizing the global economy requires efforts earlier and beyond that—in some cases, INDCs can even result in missing the target.
Our results indicate that decarbonizing the global economy by 2100, 2080, or 2060 w/o INDCs and to the emission level of 0.5 GtC under the CEI 12.6% p.a. seems to still be feasible, respectively, at the costs of 0.24%, 0.59%, and 1.23%, in terms of CBGE. These numbers are in line with the estimated 1.4% loss of global consumption by Luderer et al. (2012). In this case, the investments in renewable energy production peak at approximately 4% of global economic output. We showed that imposing a low emission climate policy for 2100 requires early (2040 vs. 2120) and significant investments in renewable energy due to the inherent inertia of the climate–energy–economic system. This estimate is also in line with OECD/IEA and IRENA (2017).
The policy implication of our work essentially includes a suggestion for early and significant decarbonization of the global economy to maintain the global average temperature below the 2 °C target. Notably, the emission reduction rate is essential, requiring international cooperation. Our analysis of CEI gave insights into how CEI affects the simulation results. The lower bound of the CEI (see l.h.s in (5)) seems to be a crucial factor if the global economy transforms the energy sector to renewable energy in a limited time window. In general, lower values for CEI force the peak of the investment in renewable energy production to happen earlier.
Future work may include a test for other climate modules, e.g., the recently calibrated version of the climate module according to Khabbazan and Held (2019), the two-box version used in the Dynamic Integrated model of Climate and the Economy (DICE) (Nordhaus 2014; Nordhaus and Sztorc 2013), or the three-box version used by Li et al. (2020). Moreover, there are many other assumptions that can affect the feasibility of reaching a target (e.g., the operating life span of installed renewable capacity) or the incurred costs (e.g., the depreciation rate)—these are promising candidates for future analysis. While our results are reliable, conditioned on the assumptions outlined, and specifically informative to interpret the results in the literature using the model MIND, employing a more sophisticated integrated assessment model is always encouraged. These tasks exceed the scope of the work and are left for future research.

Author Contributions

Acquiring funds: M.M.K. and S.H.; conceptualization, S.H. and M.M.K.; methodology, S.H. and M.M.K.; computational simulations: S.H. and M.M.K.; visualization, S.H.; writing—original draft preparation, S.H. and M.M.K.; writing—review and editing, M.M.K. and S.H.; All authors have read and agreed to the published version of the manuscript.

Funding

The Work was supported through the Cluster of Excellence ‘CliSAP’ (EXC177), Universität Hamburg, funded through the German Research Foundation (DFG) and through the research project MuSSeL (BMBF 03F0862E), funded by the German Federal Ministry of Education and Research. We acknowledge support by the German Research Foundation and the Open Access Publication Fund of TU Berlin.

Data Availability Statement

Not applicable.

Acknowledgments

Previous versions of this work have been presented at various conferences, including Data Analysis and Modeling in Earth Sciences (DAMES) 2016, 7th Doctoral Meeting of Montpellier (DMM 2016), World Conference on Climate Change (WCCC) 2016, and European Geosciences Union (EGU) General Assembly 2017. We would like to thank the attendees for fruitful discussions and helpful comments. Further, we want to thank all the helping hands on these occasions. S.H. received the best presentation and best paper award at DMM 2016, held on 25–27 October 2016, in Montpellier, France. M.M.K. received the Young Researcher Award at the WCCC 2016 held on 24–26 October 2016, in Valencia, Spain. The authors would like to thank Verena van Zyl-Bulitta for English editing. The usual disclaimer applies.

Conflicts of Interest

The authors declare no conflict of interest.

Appendix A

Figure A1. Global carbon emissions for BAU and RCP scenarios.
Economies 10 00186 g0a1

Notes

1
See Khabbazan (2022a); Neubersch et al. (2014) for a review of the differences between various decision-making frameworks, such as Cost–Benefit Analysis (CBA), Cost-Effectiveness Analysis (CEA), Chance-Constrained Programming (CCP) (as the probabilistic version of CEA), and Cost–Risk Analysis (CRA).
2
After countries ratified their Paris Pledges, INDC changed to NDC (National Determined Contributions). However, some (relatively major emitting) countries have still not ratified their Paris Pledges (Khabbazan and von Hirschhausen 2021), probably due to the significant costs of achieving their INDCs. Therefore, here we use the expression INDC to account for the INDCs by the non-ratifying countries too.
3
The special report on 1.5 °C (IPCC 2018) can be found here: https://www.ipcc.ch/sr15/ (last Accessed 18 April 2022). The special report estimates that human activities have induced around 1.0 °C of global warming above pre-industrial levels, and if it persists in rising at the present rate, it is likely to reach 1.5 °C between 2030 and 2052.
4
In 2019, CAN reported that the world is currently on a 3 °C pathway: https://climatenetwork.org/resource/can-position-energy-ambition-in-ndcs-june-2019/ (last accessed 18 April 2022).
5
Since we intend to study the decarbonization of the global economy only through the mitigation scenarios, we do not employ Carbon Capturing and Storage (CCS), Bio-Energy Carbon Capturing and Storage (BECCS), or Solar Geo-Engineering (SGE) technologies. An interested reader is encouraged to see Khabbazan et al. (2021); Mintening et al. (2017); Roshan et al. (2021) for recent technologies in the model MIND.
6
Rogelj et al. (2016, p. 637) consider INDCs and find decision-makers become increasingly aware “that measures to reduce GHG emissions have multiple socio-economic benefits”. However, they investigate CO 2 equivalents, e.g., methane and nitrous oxide, while MIND works with anthropogenic global carbon emissions due to fossil fuels and the change of land use.
7
While many countries are constantly updating their long-term promises, the overall promises for 2030 do not seem to be on the path to meeting the temperature targets (IPCC 2018; Khabbazan and von Hirschhausen 2021). While we admit that the analysis in this work can be updated accordingly, the generality of our arguments and results hold valid and can be used as it is.
8
MIND has implemented a constraint on CEI, i.e., how much the global carbon emissions are allowed to change per time step in Equation (5). Since the setup only allows specific percentage changes from each time step to the other, it is mathematically impossible to reach precisely 0 GtC. Therefore, we allow for 0.05 GtC.
9
Note that some simulations are not feasible, so the results for such simulations are not determined.
10
Note that estimates are based on different reference points, i.e., relative to 1986–2005 (Stocker et al. (2013), Fig. TS.14, p. 87) and 1900 (MIND).
11
Schaeffer et al. (2015) find that RCP 2.6 corresponds to 1.6 °C global warming and, hence, transgresses the 1.5 °C climate target.

References

  1. Afonso, Tiago L., António C. Marques, and José A. Fuinhas. 2017. Strategies to make renewable energy sources compatible with economic growth. Energy Strategy Reviews 18: 121–26. [Google Scholar] [CrossRef]
  2. Anthoff, David, and Richard S. J. Tol. 2009. The Impact of Climate Change on the Balanced Growth Equivalent: An Application to FUND. Environmental and Resource Economics 43: 351–67. [Google Scholar] [CrossRef]
  3. Bartlett, Rachel E., Massimo A. Bollasina, Ben B. B. Booth, Nick J. Dunstone, Franco Marenco, Gabriele Messori, and Dan J. Bernie. 2017. Do differences in future sulfate emission pathways matter for near-term climate? A case study for the Asian monsoon. Climate Dynamics, in press. [Google Scholar]
  4. Bauer, Niclas Alexandre. 2005. Carbon Capturing and Sequestration—An Option to Buy Time? Doctoral dissertation, Universität Potsdam, Potsdam, Germany. [Google Scholar]
  5. Bauer, Nico, Ottmar Edenhofer, Hermann Held, and Elmar Kriegler. 2004. Uncertainty of the Role of Carbon Capturing and Sequestration within Climate Change Mitigation Strategies. Paper presented at 7th International Conference on Greenhouse Gas Control Technologies, Vancouver, BC, Canada, September 5; Edited by E. S. Rubin, D. W. Keith and C. F. Gilboy. Volume 1: Peer-Reviewed Paper and Plenary Presentations. Cheltenham: IEA Greenhouse Gas Programme. [Google Scholar]
  6. Boden, Tom, Gregg Marland, and Robert Andres. 2017. Global, Regional, and National Fossil-Fuel CO2 Emissions. Oak Ridge: Carbon Dioxide Information Analysis Center, Oak Ridge National Laboratory, U.S. Department of Energy. [Google Scholar]
  7. Bosetti, Valentina, Carlo Carraro, Marzio Galeotti, Emanuele Massetti, and Massimo Tavoni. 2006. WITCH—A World Induced Technical Change Hybrid Model. In University Ca’ Foscari of Venice Economic Research Paper No. 46/06. Rochester: SSRN. [Google Scholar]
  8. Chalmers N., Eleanor J. Highwood, E. Hawkins, R. Sutton, and L.J. Wilcox. 2012. Aerosol contribution to the rapid warming of near-term climate under RCP 2.6. Geophysical Research Letters 39: L18709. [Google Scholar] [CrossRef] [Green Version]
  9. Clarke, Leon, Kejun Jiang, Keigo Akimoto, Mustafa Babiker, Geoffrey Blanford, Karen Fisher-Vanden, Jean-Charles Hourcade, Volker Krey, Elmar Kriegler, Andreas Loeschel, and et al. 2014. Working Group III Contribution to the IPCC 5th Assessment Report “Climate Change 2014: Mitigation of Climate Change”. Chapter 6: Assessing Transformation Pathways. Technical Report. Richland: Pacific Northwest National Lab. (PNNL). [Google Scholar]
  10. Climate Action Network (CAN) International. 2016. CAN Letter: IPCC Special Report on the Impacts of Global Warming of 1.5 °C. February. Available online: https://climatenetwork.org/resource/can-letter-ipcc-special-report-on-the-impacts-of-global-warming-of-1-5oc-february-2016/ (accessed on 18 April 2022).
  11. Climate Action Tracker. 2017. Global Temperatures. Available online: https://climateactiontracker.org/global/temperatures/ (accessed on 19 April 2022).
  12. Edenhofer, Ottmar, Nico Bauer, and Elmar Kriegler. 2005. The impact of technological change on climate protection and welfare: Insights from the model mind. Ecological Economics 54: 277–92. [Google Scholar] [CrossRef]
  13. Fawcett, Allen A., Gokul Iyer, Leon Clarke, James A. Edmonds, Nathan E. Hultman, Haewon C. McJeon, Joeri Rogelj, Reed Schuler, Jameel Alsalam, Ghassem R. Asrar, and et al. 2015. Can Paris pledges avert severe climate change? Science 350: 1168–69. [Google Scholar] [CrossRef]
  14. Hasson, Reviva, Åsa Löfgren, and Martine Visser. 2010. Climate change in a public goods game: Investment decisions in mitigation versus adaptation. Ecological Economics 70: 331–38. [Google Scholar] [CrossRef] [Green Version]
  15. Heitzig, Jobst, Kai Lessmann, and Yong Zou. 2011. Self-enforcing strategies to deter free-riding in the climate change mitigation game and other repeated public goods games. Proceedings of the National Academy of Sciences the United States of America 108: 15739–744. [Google Scholar] [CrossRef] [Green Version]
  16. Held, Hermann, Elmar Kriegler, Kai Lessmann, and Ottmar Edenhofer. 2009. Efficient climate policies under technology and climate uncertainty. Energy Economics 31: 50–61. [Google Scholar]
  17. IPCC (Intergovernmental Panel on Climate Change). 2016. IPCC Sixth Assessment Report (AR6). Available online: https://www.ipcc.ch/assessment-report/ar6/ (accessed on 24 July 2022).
  18. IPCC (Intergovernmental Panel on Climate Change). 2018. Global Warming of 1.5 °C. Available online: https://www.ipcc.ch/sr15/ (accessed on 18 April 2022).
  19. Khabbazan, Mohammad M. 2022a. Cost-Risk Analysis Reconsidered—Value of Information on the Climate Sensitivity in the Integrated Assessment Model PRICE. Energies 15: 4096. [Google Scholar] [CrossRef]
  20. Khabbazan, Mohammad M. 2022b. The EU’s Gain (Loss) from More Emission Trading Flexibility—A CGE Analysis with Parallel Emission Trading Systems. Journal of Open Innovation: Technology, Market, and Complexity 8: 91. [Google Scholar] [CrossRef]
  21. Khabbazan, Mohammad M., and Christian von Hirschhausen. 2021. The implication of the Paris targets for the Middle East through different cooperation options. Energy Economics 104: 105629. [Google Scholar] [CrossRef]
  22. Khabbazan, Mohammad M., and Hermann Held. 2019. On the Future Role of the most Parsimonious Climate Module in Integrated Assessment. Earth System Dynamics 10: 135–55. [Google Scholar] [CrossRef] [Green Version]
  23. Khabbazan, Mohammad M., Marius Stankoweit, Elnaz Roshan, Hauke Schmidt, and Hermann Held. 2021. How can solar geoengineering and mitigation be combined under climate targets? Earth System Dynamics 12: 1529–42. [Google Scholar] [CrossRef]
  24. Kirtman, B., S. B. Power, J. A. Adedoyin, G. J. Boer, R. Bojariu, I. Camilloni, F. J. Doblas-Reyes, A. M. Fiore, M. Kimoto, G. A. Meehl, and et al. 2013. Near-term climate change: Projections and predictability. In Climate Change 2013: The Physical Science Basis. Contribution of Working Group I to the Fifth Assessment Report of the Intergovernmental Panel on Climate Change. Cambridge: Cambridge University Press, pp. 953–1028. [Google Scholar]
  25. Kriegler, Elmar, and Thomas Bruckner. 2004. Sensitivity Analysis of Emission Corridors for the 21st Century. Climatic Change 66: 345–87. [Google Scholar] [CrossRef]
  26. Lamarque, Jean-François, G. Page Kyle, Malte Meinshausen, Keywan Riahi, Steven J. Smith, Detlef P. van Vuuren, Andrew J. Conley, and Francis Vitt. 2011. Global and regional evolution of short-lived radiatively-active gases and aerosols in the representative concentration pathways. Climatic Change 109: 191–212. [Google Scholar] [CrossRef]
  27. Leaders’ Declaration G7 Summit. 2015. June 7–8. Available online: https://www.consilium.europa.eu/en/meetings/international-summit/2015/06/07-08/ (accessed on 16 April 2022).
  28. Leaders’ Declaration G7 Summit. 2016. May 26–27. Available online: https://www.consilium.europa.eu/en/press/press-releases/2016/05/27/g7-japan-leaders-declaration/ (accessed on 16 April 2022).
  29. Leaders’ Declaration G7 Summit. 2017. May 26–27. Available online: https://www.consilium.europa.eu/en/meetings/international-summit/2017/05/26-27/ (accessed on 16 April 2022).
  30. Leaders’ Declaration G20 Summit. 2017. July 7–8. Available online: https://www.bundesregierung.de/breg-de/aktuelles/g20-summit-2017-leaders-declaration-751184 (accessed on 16 April 2022).
  31. Leaders’ Declaration G7 Summit. 2018. June 8–9. Available online: http://www.g7.utoronto.ca/summit/2018charlevoix/communique.html (accessed on 18 April 2022).
  32. Leaders’ Declaration G7 Summit. 2019. August 26. Available online: https://www.elysee.fr/en/g7/2019/08/26/g7-leaders-declaration (accessed on 18 April 2022).
  33. Leaders’ Declaration G7 Summit. 2021. June 11–13. Available online: https://www.g7uk.org/uks-2021-g7-presidency-helps-the-world-build-back-better/ (accessed on 18 April 2022).
  34. Leaders’ Declaration G7 Summit. 2022. June 28 (German and English Version). Available online: https://www.g7germany.de/g7-en (accessed on 1 July 2022).
  35. Li, Chao, Hermann Held, Sascha Hokamp, and Jochem Marotzke. 2020. Optimal temperature overshoot profile found by limiting global sea level rise as a lower-cost climate target. Science Advances 6: eaaw9490. [Google Scholar] [CrossRef] [Green Version]
  36. Lind, Arne, Eva Rosenberg, Pernille Seljom, Kari Espegren, Audun Fidje, and Karen Lindberg. 2013. Analysis of the EU renewable energy directive by a techno-economic optimisation model. Energy Policy 60: 364–77. [Google Scholar] [CrossRef]
  37. Lorenz, Alexander, Matthias G. W. Schmidt, Elmar Kriegler, and Hermann Held. 2012. Anticipating climate threshold damages. Environmental Modelling & Assessment 17: 163–75. [Google Scholar]
  38. Luderer, Gunnar, Valentina Bosetti, Michael Jakob, Marian Leimbach, Jan C. Steckel, Henri Waisman, and Ottmar Edenhofer. 2012. The Economics of Decarbonizing the Energy System—Results and Insights from the RECEIPE Model Intercomperison. Climatic Change 114: 9–37. [Google Scholar] [CrossRef]
  39. Meinshausen, Malte, Steven J. Smith, Katherine V. Calvin, John S. Daniel, M. L. T. Kainuma, J.-F. Lamarque, K. Matsumoto, S. A. Montzka, S. C. B. Raper, K. Riahi, and et al. 2011. The RCP Greenhouse Gas Concentrations and their Extensions from 1765 to 2300. Climatic Change 109: 213–41. [Google Scholar] [CrossRef] [Green Version]
  40. Mintenig, Jana, Mohammad M. Khabbazan, and Hermann Held. 2017. The Role of Bioenergy and Carbon Capture and Storage (BECCS) in the Case of Delayed Climate Policy–Insights from Cost-Risk Analysis. Earth System Dynamics Discussions 2017: 1–30. [Google Scholar] [CrossRef]
  41. Mohammadi, Naimeh, and Mohammad M. Khabbazan. 2022. The Influential Mechanisms of Power Actor Groups on Policy Mix Adoption: Lessons Learned from Feed-In Tariffs in the Renewable Energy Transition in Iran and Germany. Sustainability 14: 3973. [Google Scholar] [CrossRef]
  42. Neubersch, Delf. 2014. Value of Information under Climate Targets: An Application of Cost-Risk Analysis. Doctoral dissertation, Universität Hamburg, Hamburg, Germany. [Google Scholar]
  43. Neubersch, Delf, Hermann Held, and Alexander Otto. 2014. Operationalizing climate targets under learning: An application of cost-risk analysis. Climatic Change 126: 305–18. [Google Scholar] [CrossRef] [Green Version]
  44. Nordhaus, William. 2013. The Climate Casino, Risk, Uncertainty, and Economics for a Warming World. New Haven & London: Yale University Press. [Google Scholar]
  45. Nordhaus, William. 2014. Estimates of the Social Cost of Carbon: Concepts and Results from the DICE-2013R Model and Alternative Approaches. Journal of the Association of Environmental and Resource Economists 1: 273–312. [Google Scholar] [CrossRef]
  46. Nordhaus, William, and Paul Sztorc. 2013. DICE2013R: Introduction and User’s Manual. Available online: http://www.econ.yale.edu/~nordhaus/homepage/homepage/documents/DICE_Manual_100413r1.pdf (accessed on 19 April 2022).
  47. OECD/IEA, and IRENA. 2017. [Executive Summary/Chapter [1/4]] of Perspectives for the Energy Transition—Investment Needs for a Low Carbon Energy System. Available online: https://www.irena.org/publications/2017/Mar/Perspectives-for-the-energy-transition-Investment-needs-for-a-low-carbon-energy-system (accessed on 24 July 2022).
  48. Petschl-Held, Gerhard, Hans-Joachim Schellnhuber, Thomas Bruckner, Ferenc L. Tóth, and Klaus Hasselmann. 1999. The Tolerable Windows Approach: Theoretical and Methodological Foundations. Climatic Change 41: 303–31. [Google Scholar] [CrossRef]
  49. REN 21 (Renewable Energy Policy Network for the 21st Century). 2015. Renewables 2015 Global Status Report. Available online: https://www.ren21.net/wp-content/uploads/2019/05/GSR2015_Full-Report_English.pdf (accessed on 24 July 2022).
  50. REN 21 (Renewable Energy Policy Network for the 21st Century). 2016. Renewables 2016 Global Status Report. Available online: https://www.ren21.net/wp-content/uploads/2019/05/REN21_GSR2016_FullReport_en_11.pdf (accessed on 24 July 2022).
  51. Rogelj, Joeri, Michel den Elzen, Niklas Höhne, Taryn Fransen, Hanna Fekete, Harald Winkler, Roberto Schaeffer, Fu Sha, Keywan Riahi, and Malte Meinshausen. 2016. Paris Agreement climate proposals need a boost to keep warming well below 2 °C. Nature 534: 631–39. [Google Scholar] [CrossRef] [Green Version]
  52. Roshan, Elnaz, Mohammad M. Khabbazan, and Hermann Held. 2019. Cost-risk trade-off of mitigation and solar geoengineering: Considering regional disparities under probabilistic climate sensitivity. Environmental and Resource Economics 72: 263–79. [Google Scholar] [CrossRef]
  53. Roshan, Elnaz, Mohammad M. Khabbazan, and Hermann Held. 2021. A Scheme for Jointly Trading off Costs and Risks of Solar Radiation Management and Mitigation Under Long-Tailed Climate Sensitivity Probability Density Distributions. Environmental Modeling & Assessment 26: 823–36. [Google Scholar]
  54. Roth, Robert, Delf Neubersch, and Hermann Held. 2015. Evaluating Delayed Climate Policy by Cost-Risk Analysis. Paper presented at the 21st Annual Conference of the European Association of Environmental and Resource Economists, Helsinki, Finland, June 24–27. [Google Scholar]
  55. Schaeffer Michiel, Joeri Rogelj, Niklas Roming, Fabio Sferra, Bill Hare, and Olivia Serdeczny. 2015. Feasibility of Limiting Warming to 1.5 and 2 °C. Climate Analytics. Available online: https://climateanalytics.org/media/feasibility_1p5_2.pdf (accessed on 24 July 2022).
  56. Stein, Lukas, Mohammad M. Khabbazan, and Hermann Held. 2020. Replacing Temperature Targets by Subsidiary Targets: How Accurate Are They?: Overshooting vs. Economic Losses. Available online: https://www.wiso.uni-hamburg.de/forschung/forschungslabor/working-papers/pdfs-wp/wp57.pdf (accessed on 18 April 2022).
  57. Stern, Nicholas. 2007. The Economics of Climate Change. London: HM Treasury. [Google Scholar]
  58. Stocker, Thomas F., Dahe Qin, Gian-Kasper Plattner, L. V. Alexander, Simon K. Allen, N. L. Bindoff, F.-M. Bréon, J. A. Church, U. Cubasch, S. Emori, and et al. 2013. Technical Summary. In Climate Change 2013: The Physical Science Basis. Contribution of Working Group I to the Fifth Assessment Report of the Intergovernmental Panel on Climate Change. Cambridge and New York: Cambridge University Press. [Google Scholar]
  59. Tavoni, Alessandro, Astrid Dannenberg, Giorgos Kallis, and Andreas Löschel. 2009. Inequality, communication, and the avoidance of disastrous climate change in a public goods game. Proceedings of the National Academy of Sciences the United States of America 108: 1185–89. [Google Scholar] [CrossRef] [Green Version]
  60. The Copenhagen Diagnosis. 2009. Updating the World on the Latest Climate Science. Sydney: The University of New South Wales Climate Change Research Centre (CCRC). [Google Scholar]
  61. The World Bank. 2015. World Development Indicators Database. Available online: https://databank.worldbank.org/source/world-development-indicators (accessed on 24 July 2022).
  62. The World Bank. 2016. World Development Indicators Database. Available online: https://databank.worldbank.org/source/world-development-indicators (accessed on 24 July 2022).
  63. UNFCCC. 2022. Integrated Assessment Models (IAMs) and Energy Environment Economy e3 Models. Available online: https://unfccc.int/topics/mitigation/workstreams/response-measures/integrated-assessment-models-iams-and-energy-environment-economy-e3-models#eq-20 (accessed on 26 May 2022).
  64. UNFCCC (United Nations Framework Convention on Climate Change). 2010. Decisions-Cancun Climate Change Conference-November 2010. Available online: https://unfccc.int/process-and-meetings/conferences/past-conferences/cancun-climate-change-conference-november-2010/decisions-cancun-climate-change-conference-november-2010 (accessed on 18 April 2022).
  65. UNFCCC (United Nations Framework Convention on Climate Change). 2015a. Adoption of the Paris Agreement (COP 21). Available online: https://unfccc.int/resource/docs/2015/cop21/eng/l09r01.pdf (accessed on 24 July 2022).
  66. UNFCCC (United Nations Framework Convention on Climate Change). 2015b. Draft Paris Agreement. Available online: https://unfccc.int/files/bodies/awg/application/pdf/draft_paris_agreement_5dec15.pdf (accessed on 24 July 2022).
  67. UNFCCC (United Nations Framework Convention on Climate Change). 2016. Decisions adopted by the Conference of the Parties (COP 22). Available online: https://unfccc.int/resource/docs/2016/cop22/eng/10a02.pdf (accessed on 24 July 2022).
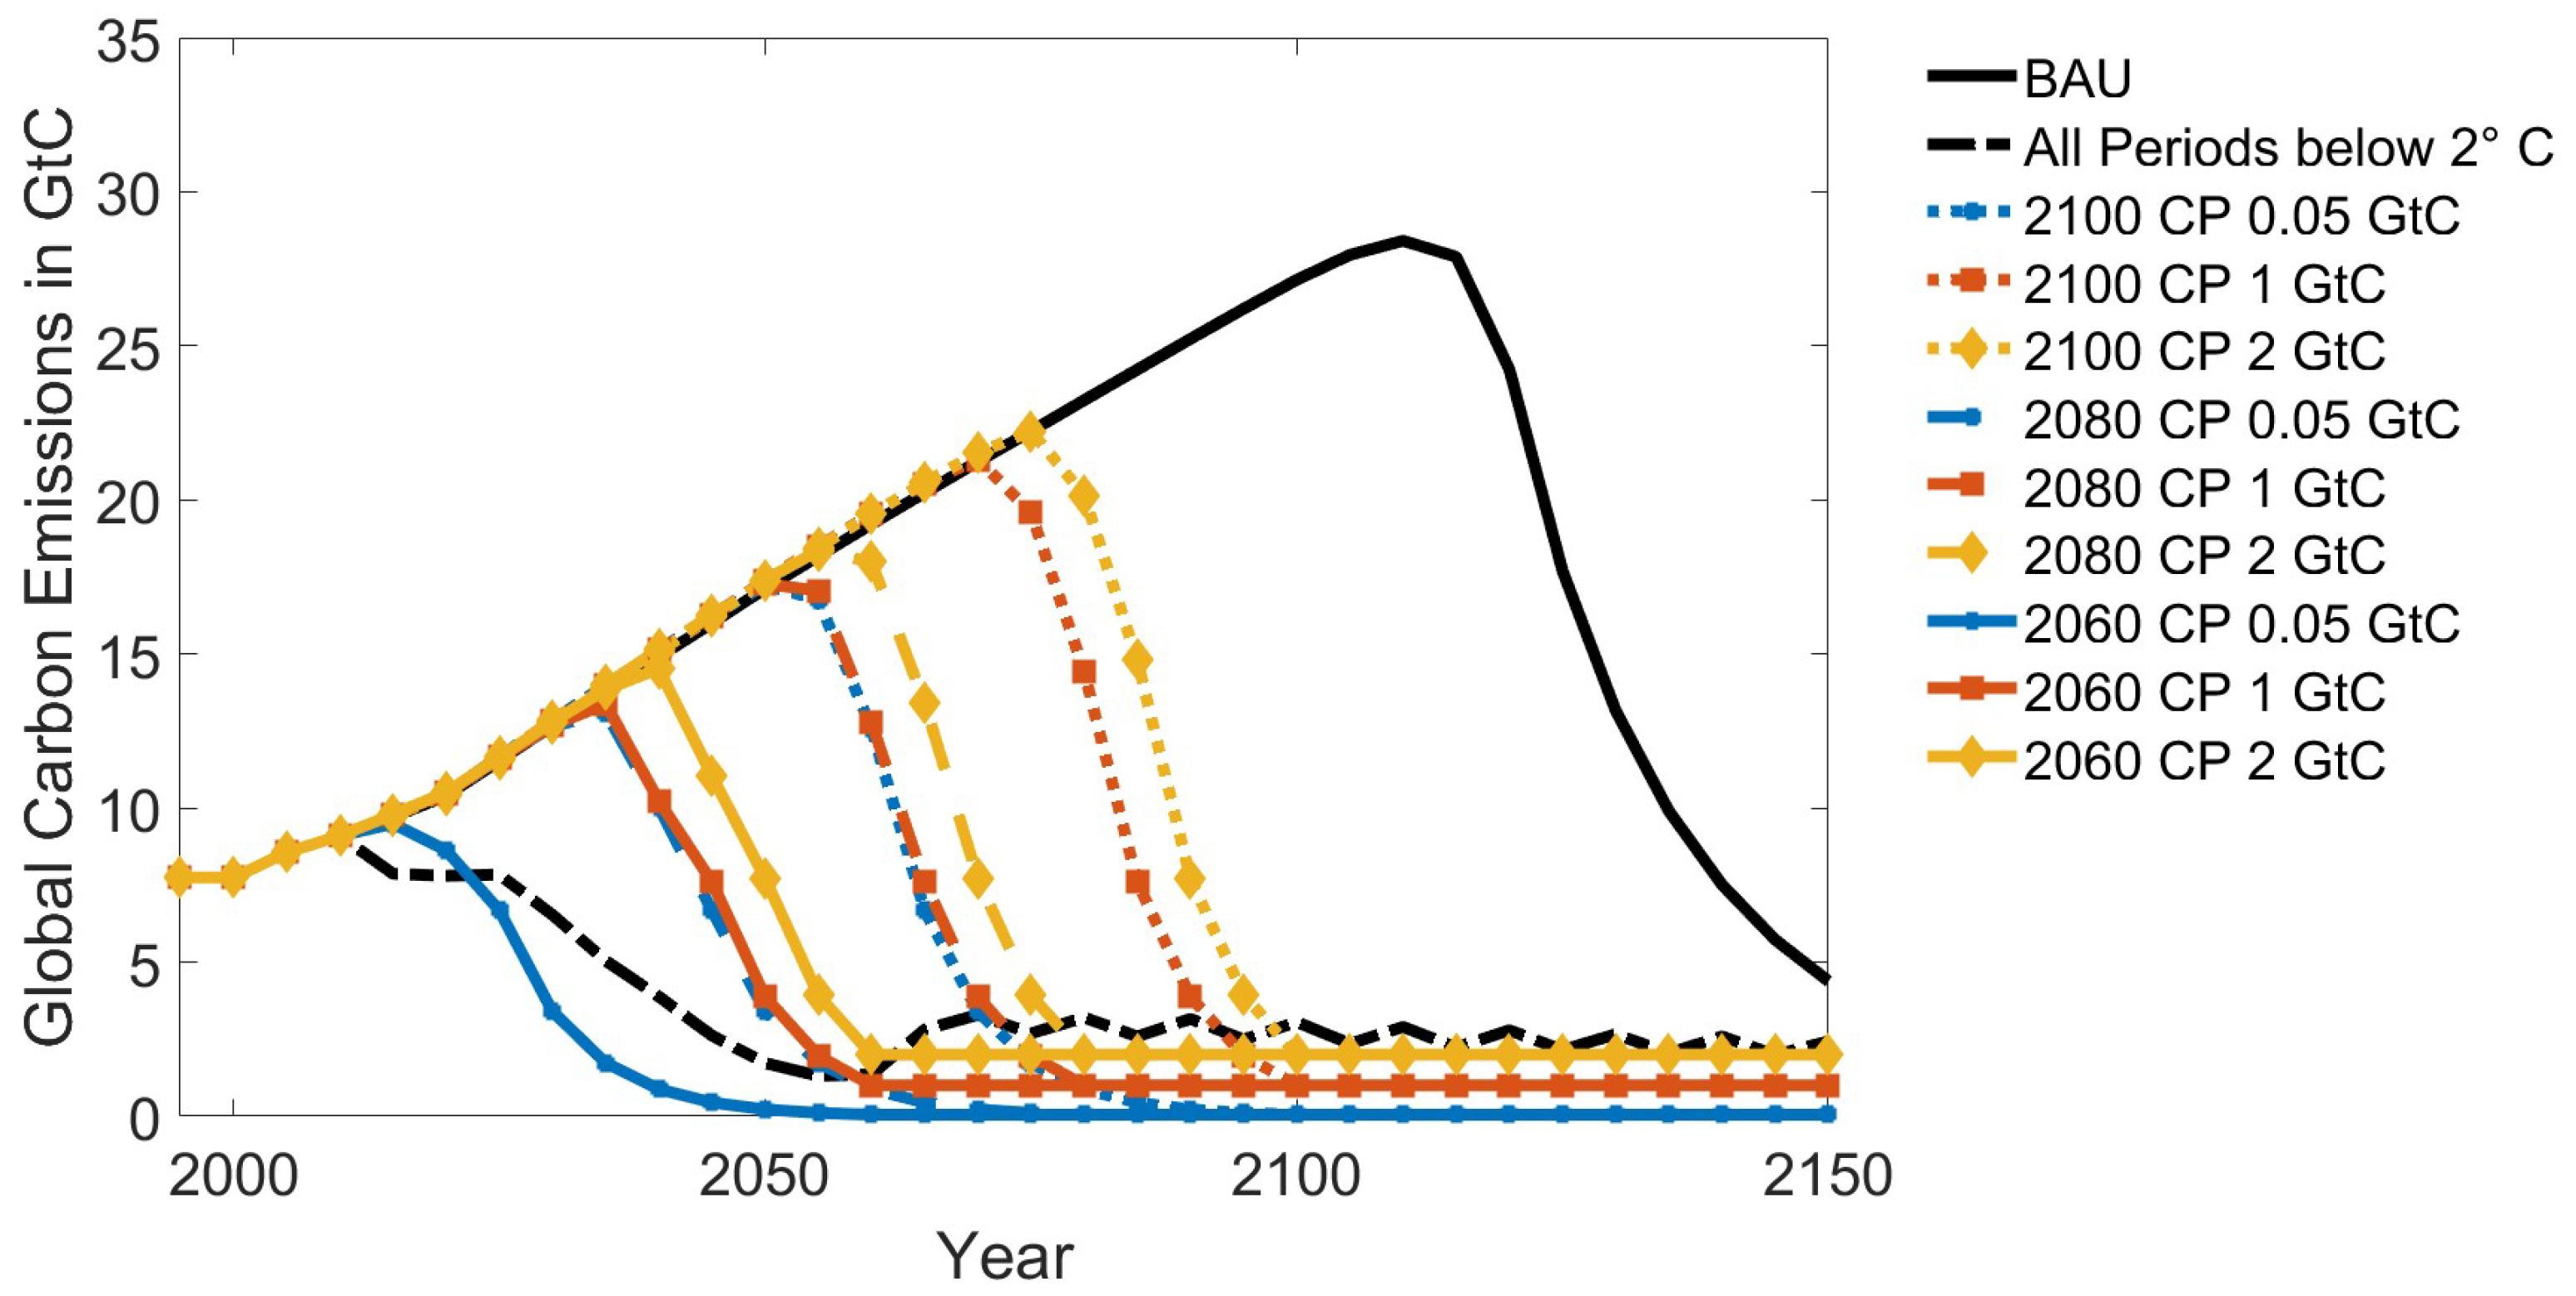
Figure 1. Global carbon emissions for different scenarios under CEI 12.6% p.a. and w/o INDC.
Economies 10 00186 g001
Figure 2. Global carbon emissions for different scenarios under CEI 3.7 p.a. and w/o INDC.
Economies 10 00186 g002
Figure 3. Global carbon emissions for different scenarios under CEI 12.6% p.a. and INDC.
Economies 10 00186 g003
Figure 4. Global carbon emissions for different scenarios under CEI 3.7% p.a. and INDC.
Economies 10 00186 g004
Figure 5. Global mean temperature change for different scenarios under CEI 12.6% p.a. and w/o INDC.
Economies 10 00186 g005
Figure 6. Global mean temperature change for different scenarios under CEI 3.7% p.a. and w/o INDC.
Economies 10 00186 g006
Figure 7. Global mean temperature change for different scenarios under CEI 12.6% p.a. and INDC.
Economies 10 00186 g007
Figure 8. Global mean temperature change for different scenarios under CEI 3.7% p.a. and INDC.
Economies 10 00186 g008
Figure 9. Investments in renewable energy production for different scenarios under CEI 12.6% p.a. and w/o INDC.
Economies 10 00186 g009
Figure 10. Investments in renewable energy production for different scenarios under CEI 3.7% p.a. and w/o INDC.
Economies 10 00186 g010
Figure 11. Investments in renewable energy production for different scenarios under CEI 12.6% p.a. and INDC.
Economies 10 00186 g011
Figure 12. Investments in renewable energy production for different scenarios under CEI 3.7% p.a. and INDC.
Economies 10 00186 g012
Table 1. Climate Policy Scenarios.
Climate PolicyInspired byShorthand
No Change of Climate PolicyBusiness as UsualBAU
All Periods below 1.5 CCOP 21GMT ≤ 1.5
All Periods below 2.0 CCOP 16GMT ≤ 2.0
Low Carbon Emissions from 2100 onwards41st G7 Summit, June 2015, COP 212100 CP
Low Carbon Emissions from 2080 onwardsCOP 212080 CP
Low Carbon Emissions from 2060 onwardsCOP 212060 CP
Table 2. Simulation Results: Global Mean Temperature (GMT) Change—Notes: The climate policies are described in Section 3.2. Four CEIs are considered: 12.6% (Lorenz et al. 2012), 9.0%, 5.3%, and 3.7% p.a. (The Copenhagen Diagnosis 2009). The GMT is measured in 2100 compared to 1900. Not defined (n. d.) indicates scenarios with infeasibility due to constraint violation. Abbreviations: BAU (Business As Usual); CP (Climate Policy); GtC (Gigaton Carbon); INDC (Intended National Contribution).
ScenarioCarbon Emission InertiaGlobal Mean Temperature Change in 2100
BAU12.6%3.12 C
GMT ≤ 1.5 C12.6%n. d.
GMT ≤ 2.0 C12.6%2.00 C
0.05 GtC1 GtC2 GtC
w/o INDCINDCw/o INDCINDCw/o INDCINDC
2100 CP12.6%2.86 C2.83 C3.26 C3.24 C3.28 C3.26 C
9.0%2.45 C2.41 C3.14 C3.12 C3.23 C3.21 C
5.3%n. d.n. d.2.79 C2.76 C3.03 C3.00 C
3.7%n. d.n. d.2.43 C2.40 C2.78 C2.75 C
2080 CP12.6%2.27 C2.24 C2.87 C2.84 C2.99 C2.96 C
9.0%1.92 Cn. d.2.69 C2.66 C2.88 C2.86 C
5.3%n. d.n. d.2.33 C2.30 C2.61 C2.58 C
3.7%n. d.n. d.2.06 Cn. d.2.39 C2.36 C
2060 CP12.6%1.77 Cn. d.2.30 C2.27 C2.46 C2.43 C
9.0%n. d.n. d.2.17 C2.14 C2.37 C2.34 C
5.3%n. d.n. d.1.92 Cn. d.2.18 Cn. d.
3.7%n. d.n. d.n. d.n. d.2.04 Cn. d.
Table 3. Simulation Results: Certainty and Balanced Growth Equivalents (CBGE)—Notes: The climate policies are described in Section 3.2. Four CEIs are considered: 12.6% (Lorenz et al. 2012), 12.6%, 9.0%, 5.3%, and 3.7% p.a. (The Copenhagen Diagnosis 2009). The differences in Certainty and Balanced Growth Equivalents (Anthoff and Tol 2009) are measured in percentage compared to the benchmark BAU. Not defined (n. d.) indicates scenarios with infeasibility due to constraint violation. Abbreviations: BAU (Business As Usual); CP (Climate Policy), GtC (Gigaton Carbon), INDC (Intended National Contribution).
ScenarioCarbon Emission Inertia Δ Certainty and Balanced Growth Equivalents
BAU12.6%Benchmark
GMT ≤ 1.5 C12.6%n. d.
GMT ≤ 2.0 C12.6%−0.88%
0.05 GtC1 GtC2 GtC
w/o INDCINDCw/o INDCINDCw/o INDCINDC
2100 CP12.6%−0.24%−0.26%−0.08%−0.09%−0.06%−0.07%
9.0%−0.45%−0.46%−0.11%−0.12%−0.07%−0.08%
5.3%n. d.n. d.−0.22%−0.24%−0.12%−0.14%
3.7%n. d.n. d.−0.43%−0.44%−0.22%−0.23%
2080 CP12.6%−0.59%−0.60%−0.23%−0.24%−0.17%−0.18%
9.0%−0.95%n. d.−0.29%−0.30%−0.20%−0.21%
5.3%n. d.n. d.−0.49%−0.51%−0.30%−0.32%
3.7%n. d.n. d.−0.80%n. d.−0.45%−0.47%
2060 CP12.6%−1.23%n. d.−0.54%−0.55%−0.42%−0.43%
9.0%n. d.n. d.−0.65%−0.66%−0.47%−0.49%
5.3%n. d.n. d.−0.96%n. d.−0.63%n. d.
3.7%n. d.n. d.n. d.n. d.−0.83%n. d.
Publisher’s Note: MDPI stays neutral with regard to jurisdictional claims in published maps and institutional affiliations.