1. Introduction
European fiscal governance is a key, and at times the most important, pillar of European integration policy. The creation of the European Union is a project of coordination and planning of common policies. All European countries are called upon to form a political union, which presupposes the existence of coordinated economic governance. Different countries with different economic sizes and different fiscal policies are called upon to join a common fiscal and economic policy framework. Each country keeps its own budget, but there are common principles for preparing, implementing and monitoring it.
In this context, it is extremely interesting to study all the factors that affect the effectiveness of fiscal governance in European countries and, in particular, in the euro area countries that are subject to fiscal rules. The importance of the Stability Pact for the pursuit of a common and sustainable fiscal policy was analysed by
Afonso and Rault (
2010), who state that if a country does not adapt to the common rules governing the coordination of fiscal policy, then the solvency of Europe’s fiscal policy as a whole is at risk.
Therefore, the coordination of national policies and the convergence of common fiscal objectives ensures the fiscal stability of the European monetary union. The Stability and Growth Pact was established to coordinate the level of each country’s fiscal figures (3% of GDP deficit and 60% of GDP public debt). Nevertheless, the institutional functioning of the Stability and Growth Pact and the general process of European fiscal governance have been the subject of debate in academia and politics (
Fatás et al. 2003;
Jonung 2002). Thus, the Eurozone countries have to adjust and converge on fiscal results. However, forecasting of fiscal data, which is accompanied by forecasting of macroeconomic data, is also carried out at the national level. Thus, each member state makes its own forecasts, and then the question arises as to whether each country makes realistic forecasts to comply with the rules. The extent to which the forecasts are realistic or not is reflected in the deviations of the forecasts from the realizations. Many studies analyse the importance of making predictions by an independent body in order to limit the degree of bias (
Frankel and Schreger 2016;
Merola and Pérez 2013;
Beetsma et al. 2019). The existence of an independent budgetary institution increases the credibility of the country and the work of the Ministry of Finance, and the possible existence of a budget deficit is of less concern and there is less questioning of creditworthiness when an independent agency is active (
Hallerberg and Wolff 2008).
Although EU countries are committed to achieving some specific results or stating that they have projected to achieve specific results, often reality might be different.
Budget forecast errors and the study of factors that divert budget execution from the targets set in forecasts in European countries are the subject of a wide range of papers.
Strauch et al. (
2004) collected data from the databases of the Stability and Convergence Programs for the period 1990–2002 to analyse the quality of the real GDP forecasts as well as the budget balance. They found that some European countries systematically presented overly optimistic forecasts. They also interpreted the economic cycle and the framework of fiscal governance as key factors in fiscal balance forecasts. It has been observed that European countries that implement fiscal policy based on a set of targets tend to be more cautious in terms of forecasts. This is mainly because the information available from the European Commission’s forecasts is not being used properly.
Jonung and Larch (
2006) highlighted the value of having independent fiscal institutions in the euro area, as they showed that when it comes to elections, governments make overly optimistic assessments of the economy. This leads to excessive forecasts for the budget figures, whereas an independent and non-politicized body would have much lower bias in the forecasts.
Pina and Venes (
2011), by analysing the self-published semi-annual forecasts of all European countries in the context of excessive deficits, showed that there is a systematic positive correlation between macroeconomic and budgetary forecast errors. Furthermore, for all European countries, there is a negative relationship between mistakes and elections, but their findings are not statistically significant. Further, an interesting point is that the errors of budget forecasts are more negative when the result is realized by a government whose party was in the opposition at the time of the forecast. This point is an important finding for the political economy of fiscal governance and the impact that political stability has on the proper execution of the state budget.
Von Hagen (
2010) analysed the errors in the fiscal and macroeconomic forecasts of the EU-15 countries for the period 1998–2004 with real-time data from the database of the Stability and Convergence Programs. He explains the importance of institutional factors such as fiscal governance and the political situation of the country for errors in forecasts, and that their bias is part of compliance with the SGP.
In any case, the period of entry into the Stability and Growth Plan was a period which, as
Brück and Stephan (
2006) characteristically state, brought about a “political cycle of forecasts”, as the pre-election periods were optimistic, and this bias was frequent. Furthermore,
Beetsma et al. (
2009b), using real-time data from the SGP database for European countries, found that, on average, actual fiscal outcomes fall short of forecasts, and this finding widens with the increase in the forecast horizon. A more recent study by
Rybacki (
2020) analysed the accuracy of predictions between the European Commission and national governments using forecasts of budget deficit, revenue and expenditure variables for the EU-27 countries as well as the United Kingdom for the period 2014–2019. For the next year, EU revenue and expenditure forecasts are about the same as those of governments, while for the final budget, EU forecasts are less effective. The accuracy of the forecasts varies from country to country, while, at the same time, there is no bias due to the political cycle. The authors conclude that the Stability and Growth Pact provides great accessibility to forecast data and thus makes comparisons easy. Moreover, this mechanism helped to reduce overly optimistic forecasts.
This study examines the factors that influence the effectiveness of fiscal governance in Europe by using panel data of 19 Eurozone countries for the period 1999–2019. By fiscal effectiveness, we mean the extent to which governments meet their own fiscal targets. The hypothesis to be tested, therefore, relates to the ability of governments to implement the fiscal strategy that they have scheduled. The value added by this paper is twofold: first, it creates a unique database with forecast errors until 2019; and secondly, it covers the period of existence of the Economic Adjustment Programs. As explained in more detail in
Section 3, the creation of a database with the data obtained from the budget of Eurozone member states represents a key innovation of this paper.
The next section of the paper presents some stylized facts regarding the forecast errors in the 19 Eurozone countries.
Section 3 discusses the data and the methodology used, while
Section 4 performs the empirical investigation and presents the results. The last section of the paper offers some concluding remarks.
2. Forecast Errors in the 19 Eurozone Countries: Stylized Facts
The main purpose of European fiscal governance is to coordinate members’ national fiscal policies in order to create budget outcomes that secure sustainable levels of debt/GDP.
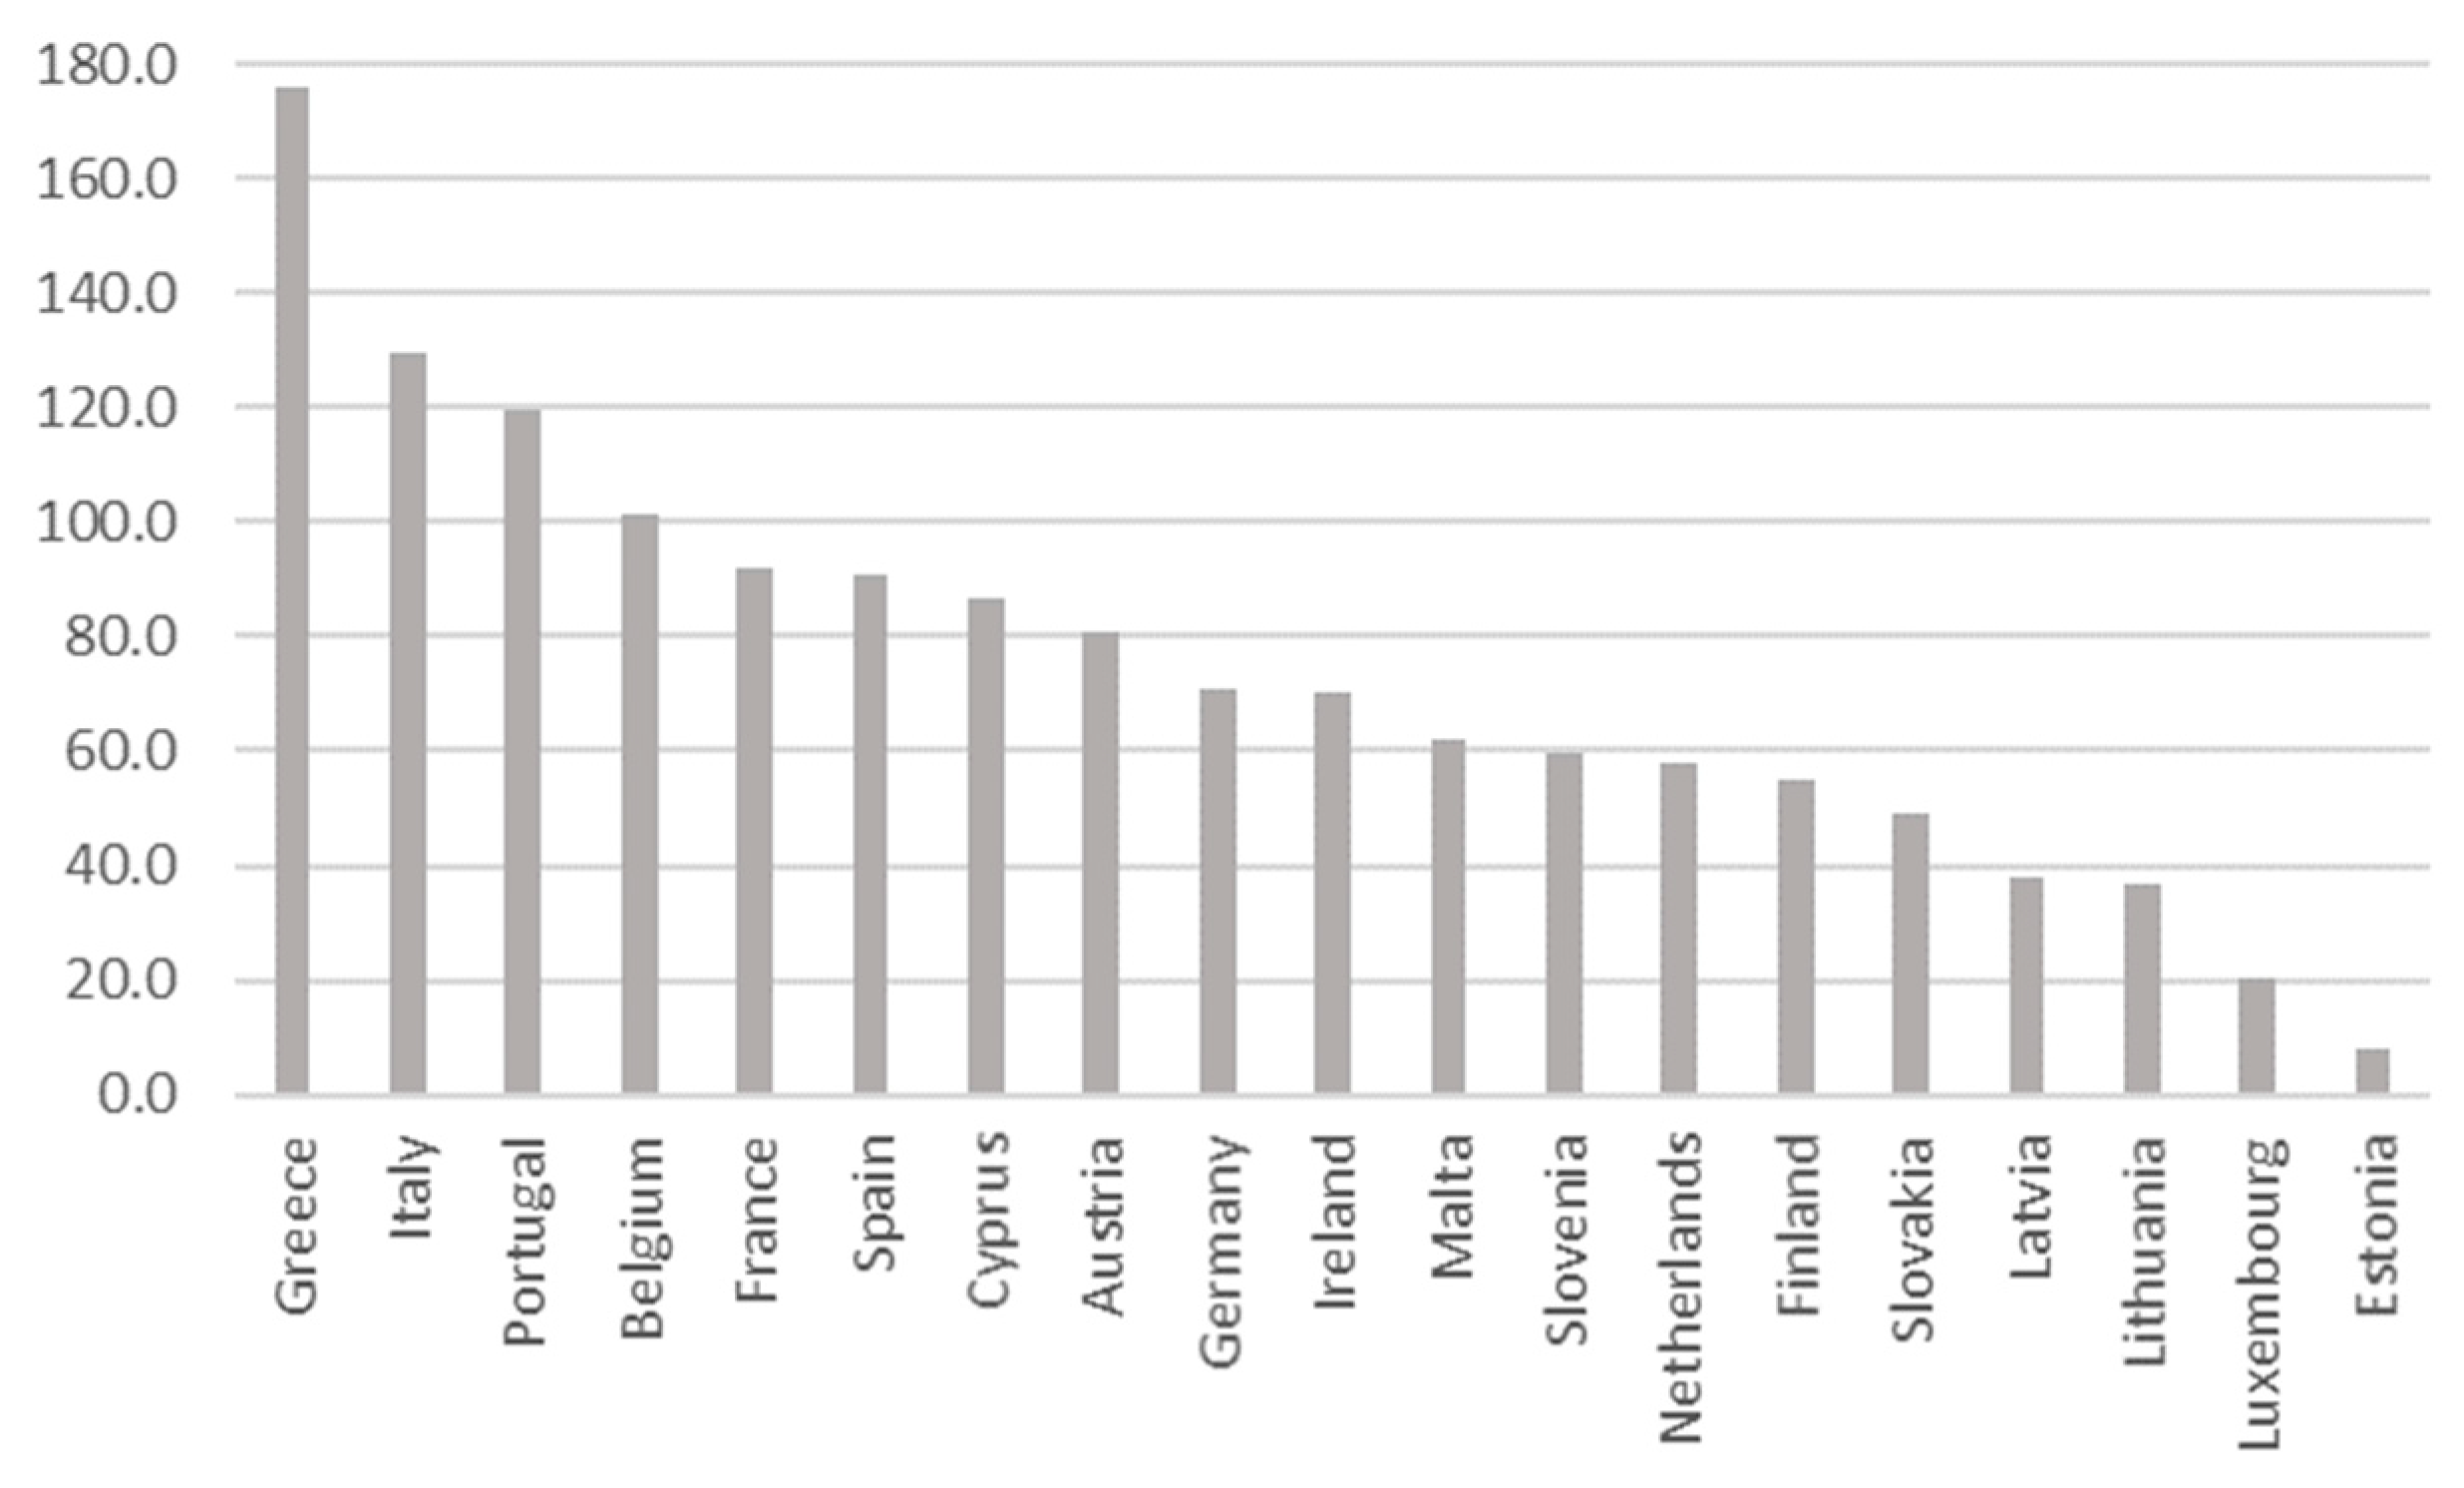
Figure 1 presents data regarding public debt as % of GDP for the period 2006–2019.
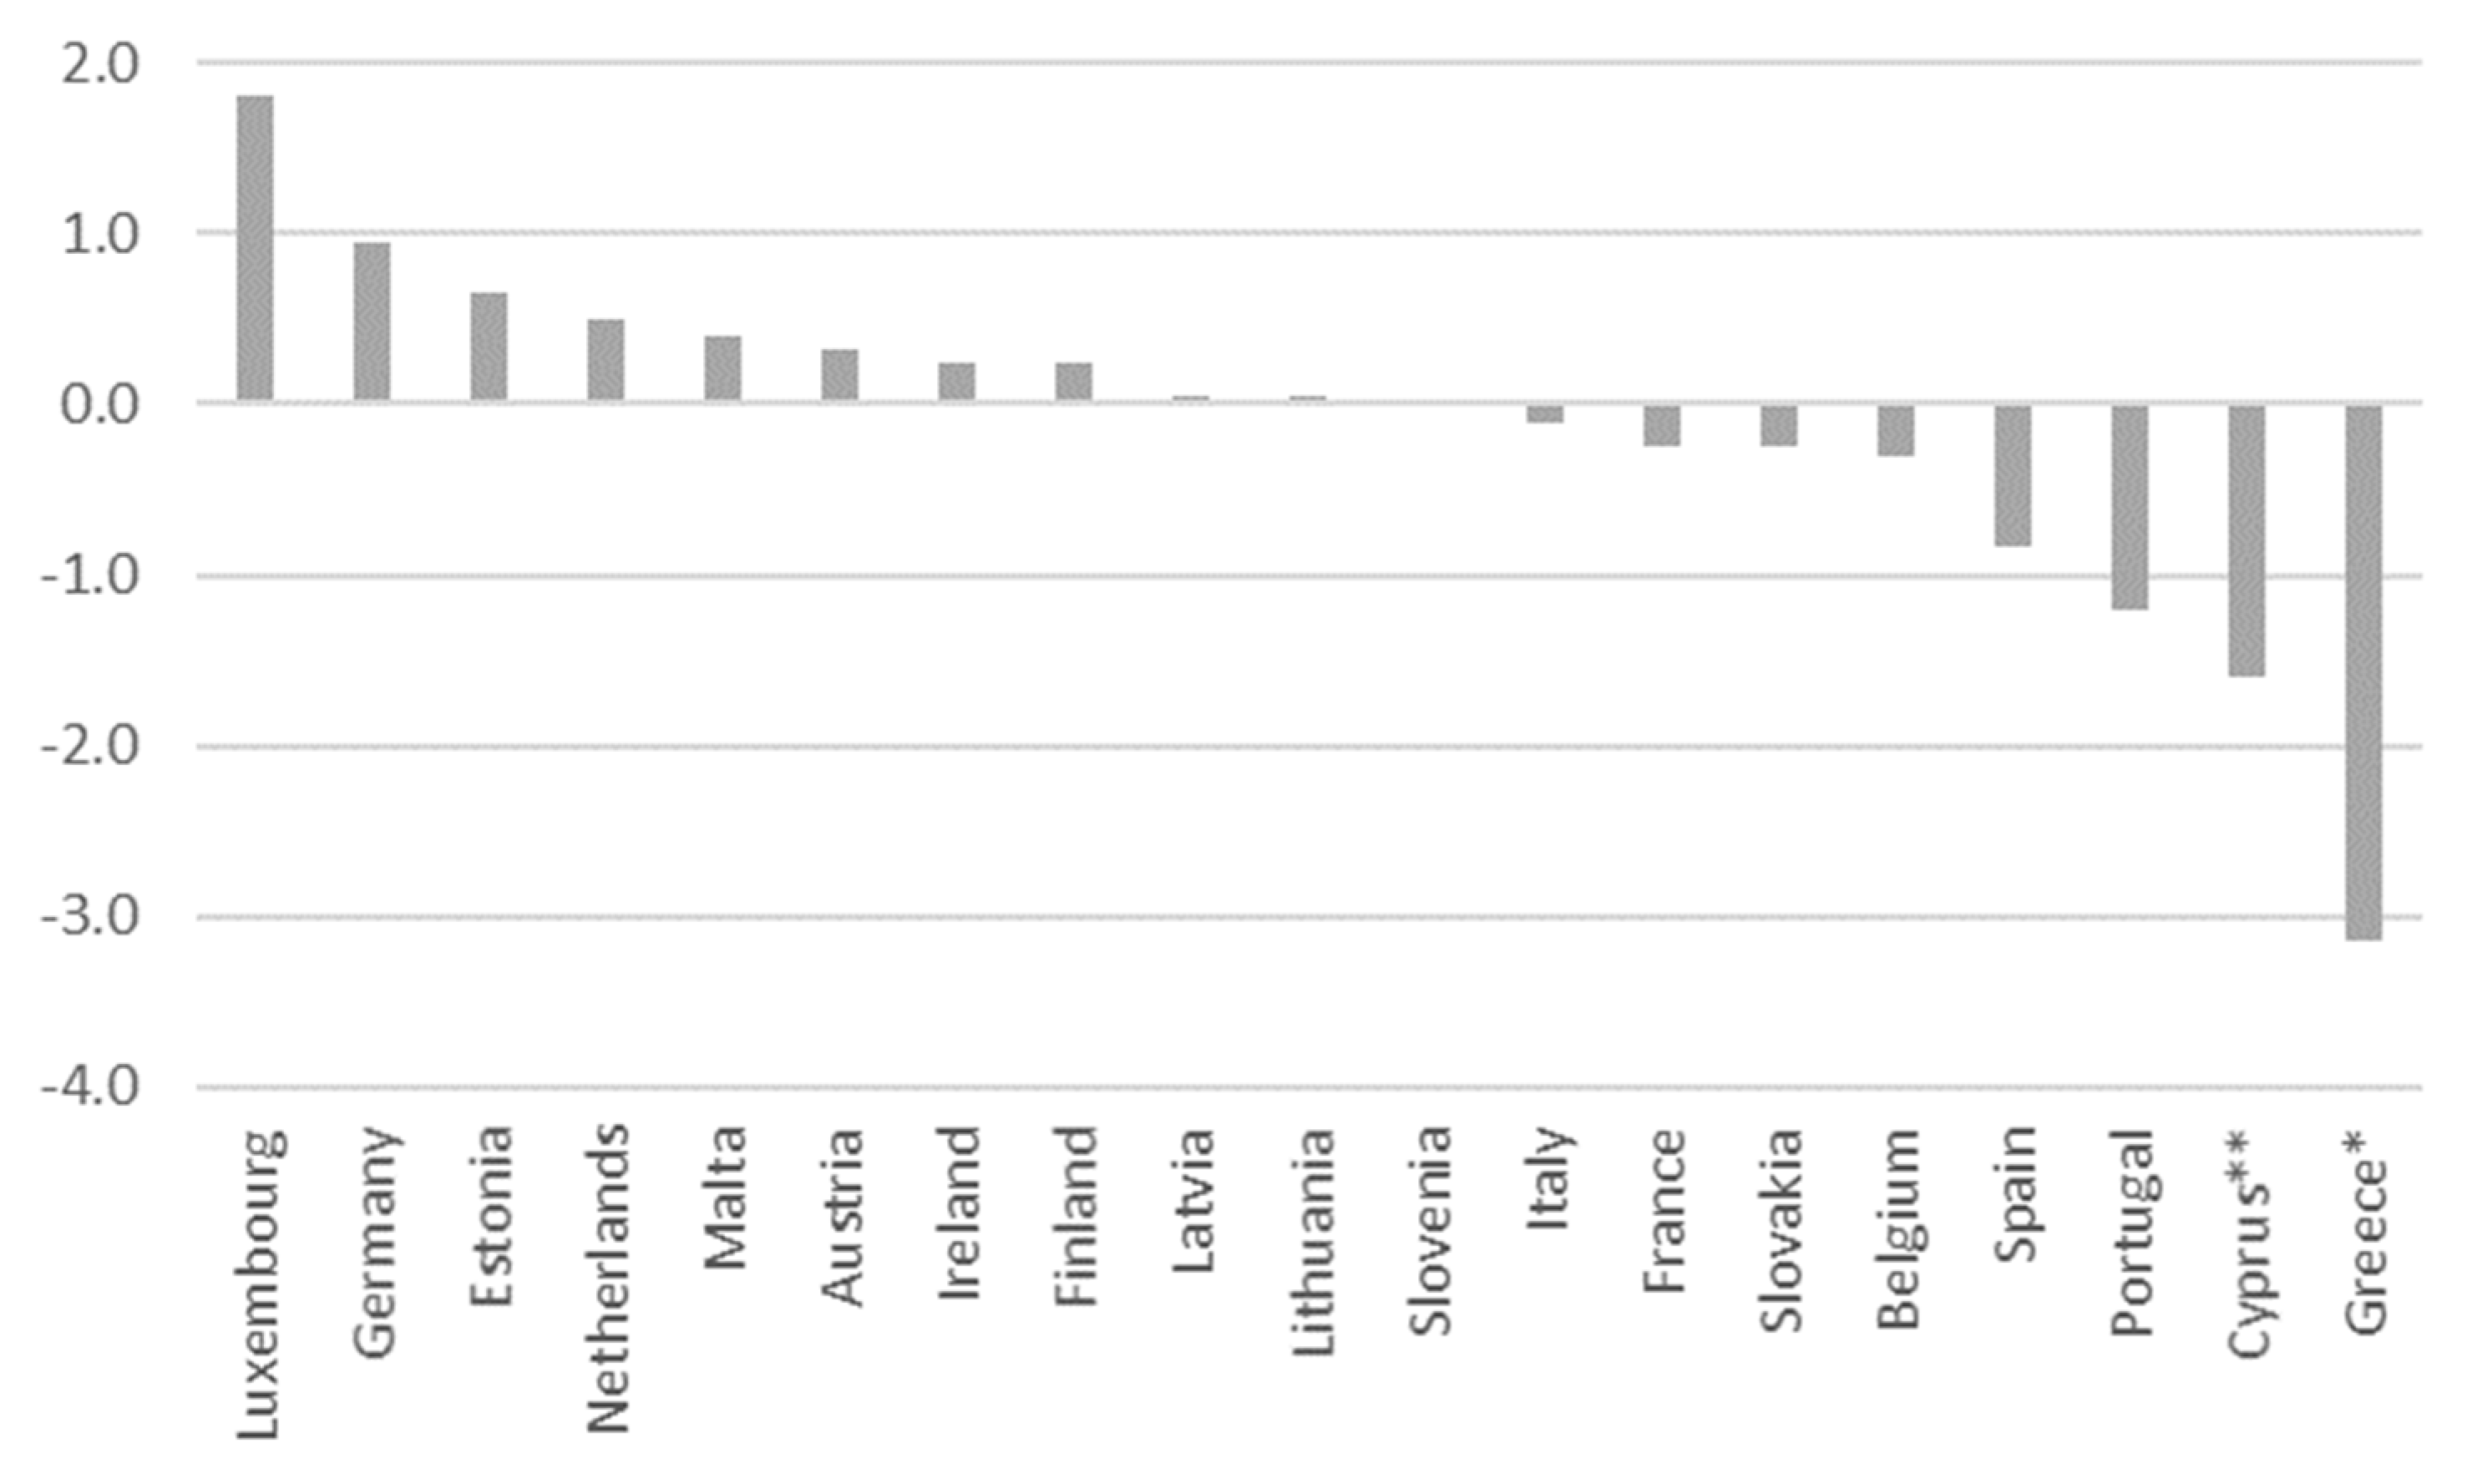
It is observed that Greece records the largest public debt as a percentage of GDP compared to other European countries, followed by Italy, Portugal, Belgium and France. Estonia has the lowest public debt as a percentage of GDP, followed by Luxembourg and Lithuania. All three countries have a positive or zero fiscal forecast error (
Figure 2). On the contrary, the countries with the largest public debt record a negative general government balance forecast error. All countries that joined Economic Adjustment Programs (EAPs) present debt as a percentage of GDP greater than 60%, a threshold set by the Stability Pact.
In other words, it is observed that countries that primarily overestimate general government balance forecasts or fail to meet the size of their forecasts have high levels of public debt. According to
Von Hagen and Harden (
1994) EU countries with high debt present overly optimistic revenue forecasts. Further,
Beetsma et al. (
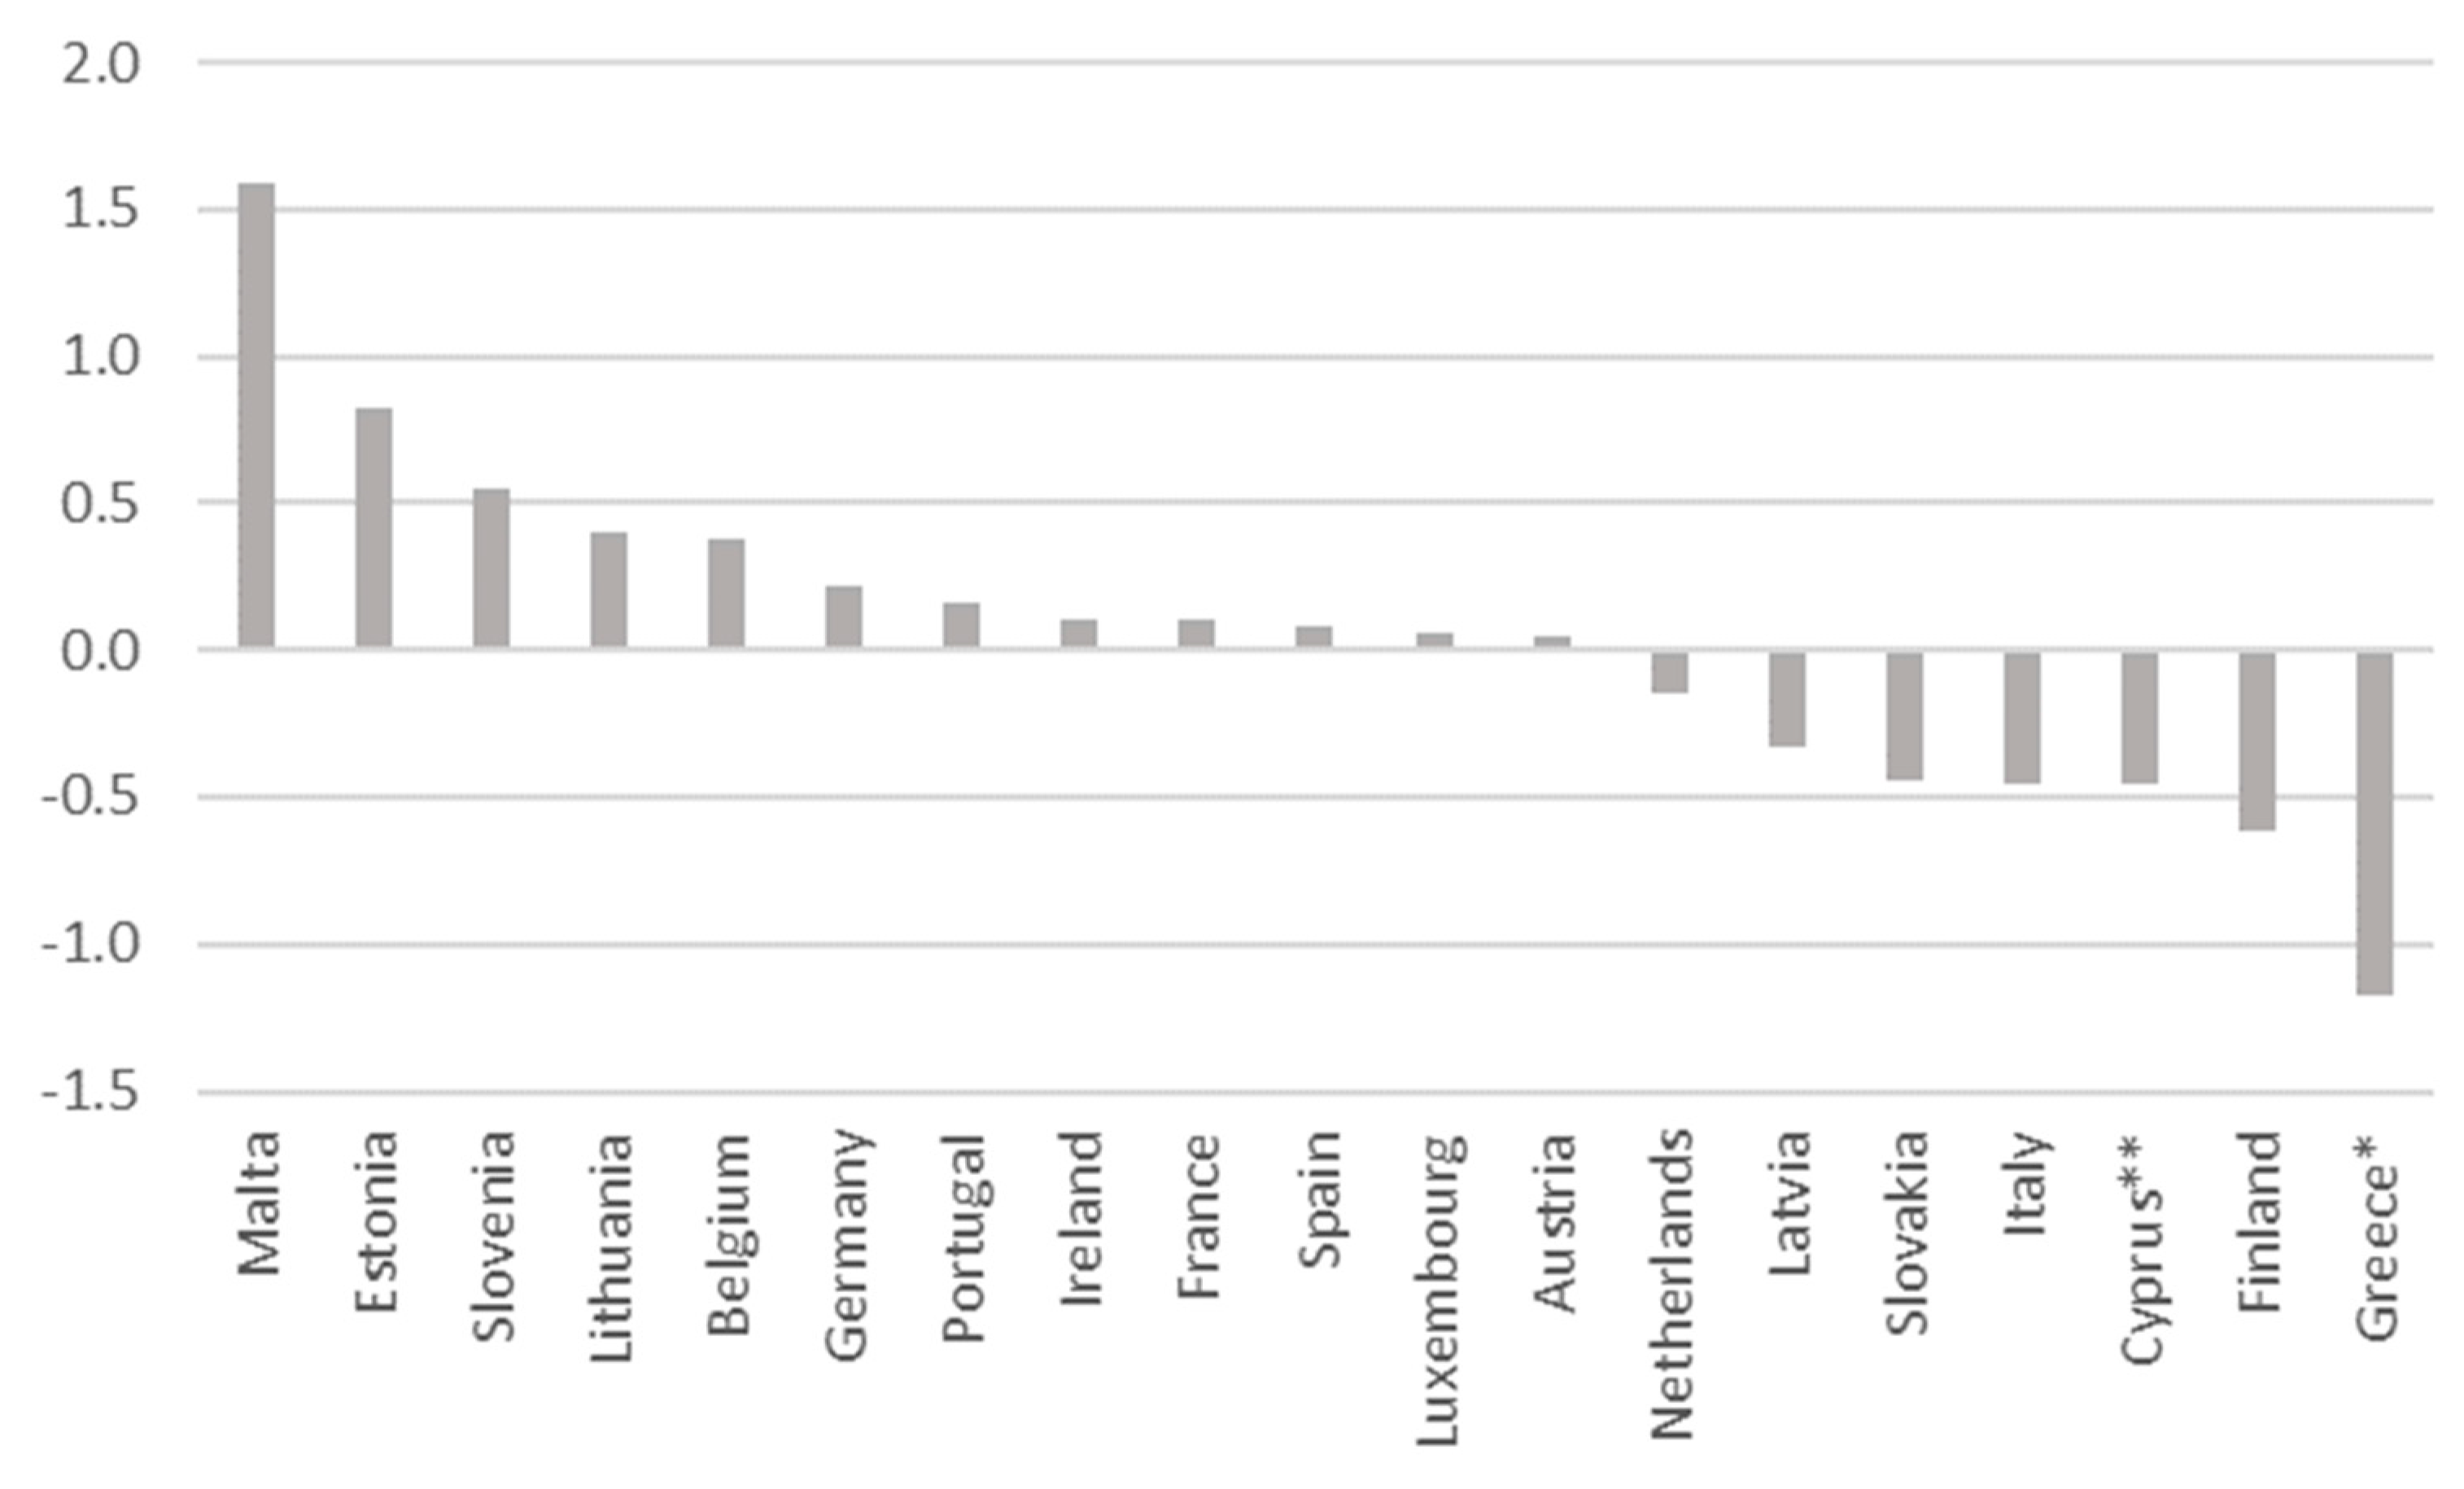
2009a) found that overly optimistic fiscal forecasts are associated with significant stock-flow adjustments. On the contrary, countries that are close to or achieve a higher-than-expected fiscal balance forecast present lower levels of debt. Except for Ireland, the other countries that have joined the Economic Adjustment Schemes (Greece, Cyprus, Portugal and Spain) have a negative general government balance forecast error (
Figure 3).
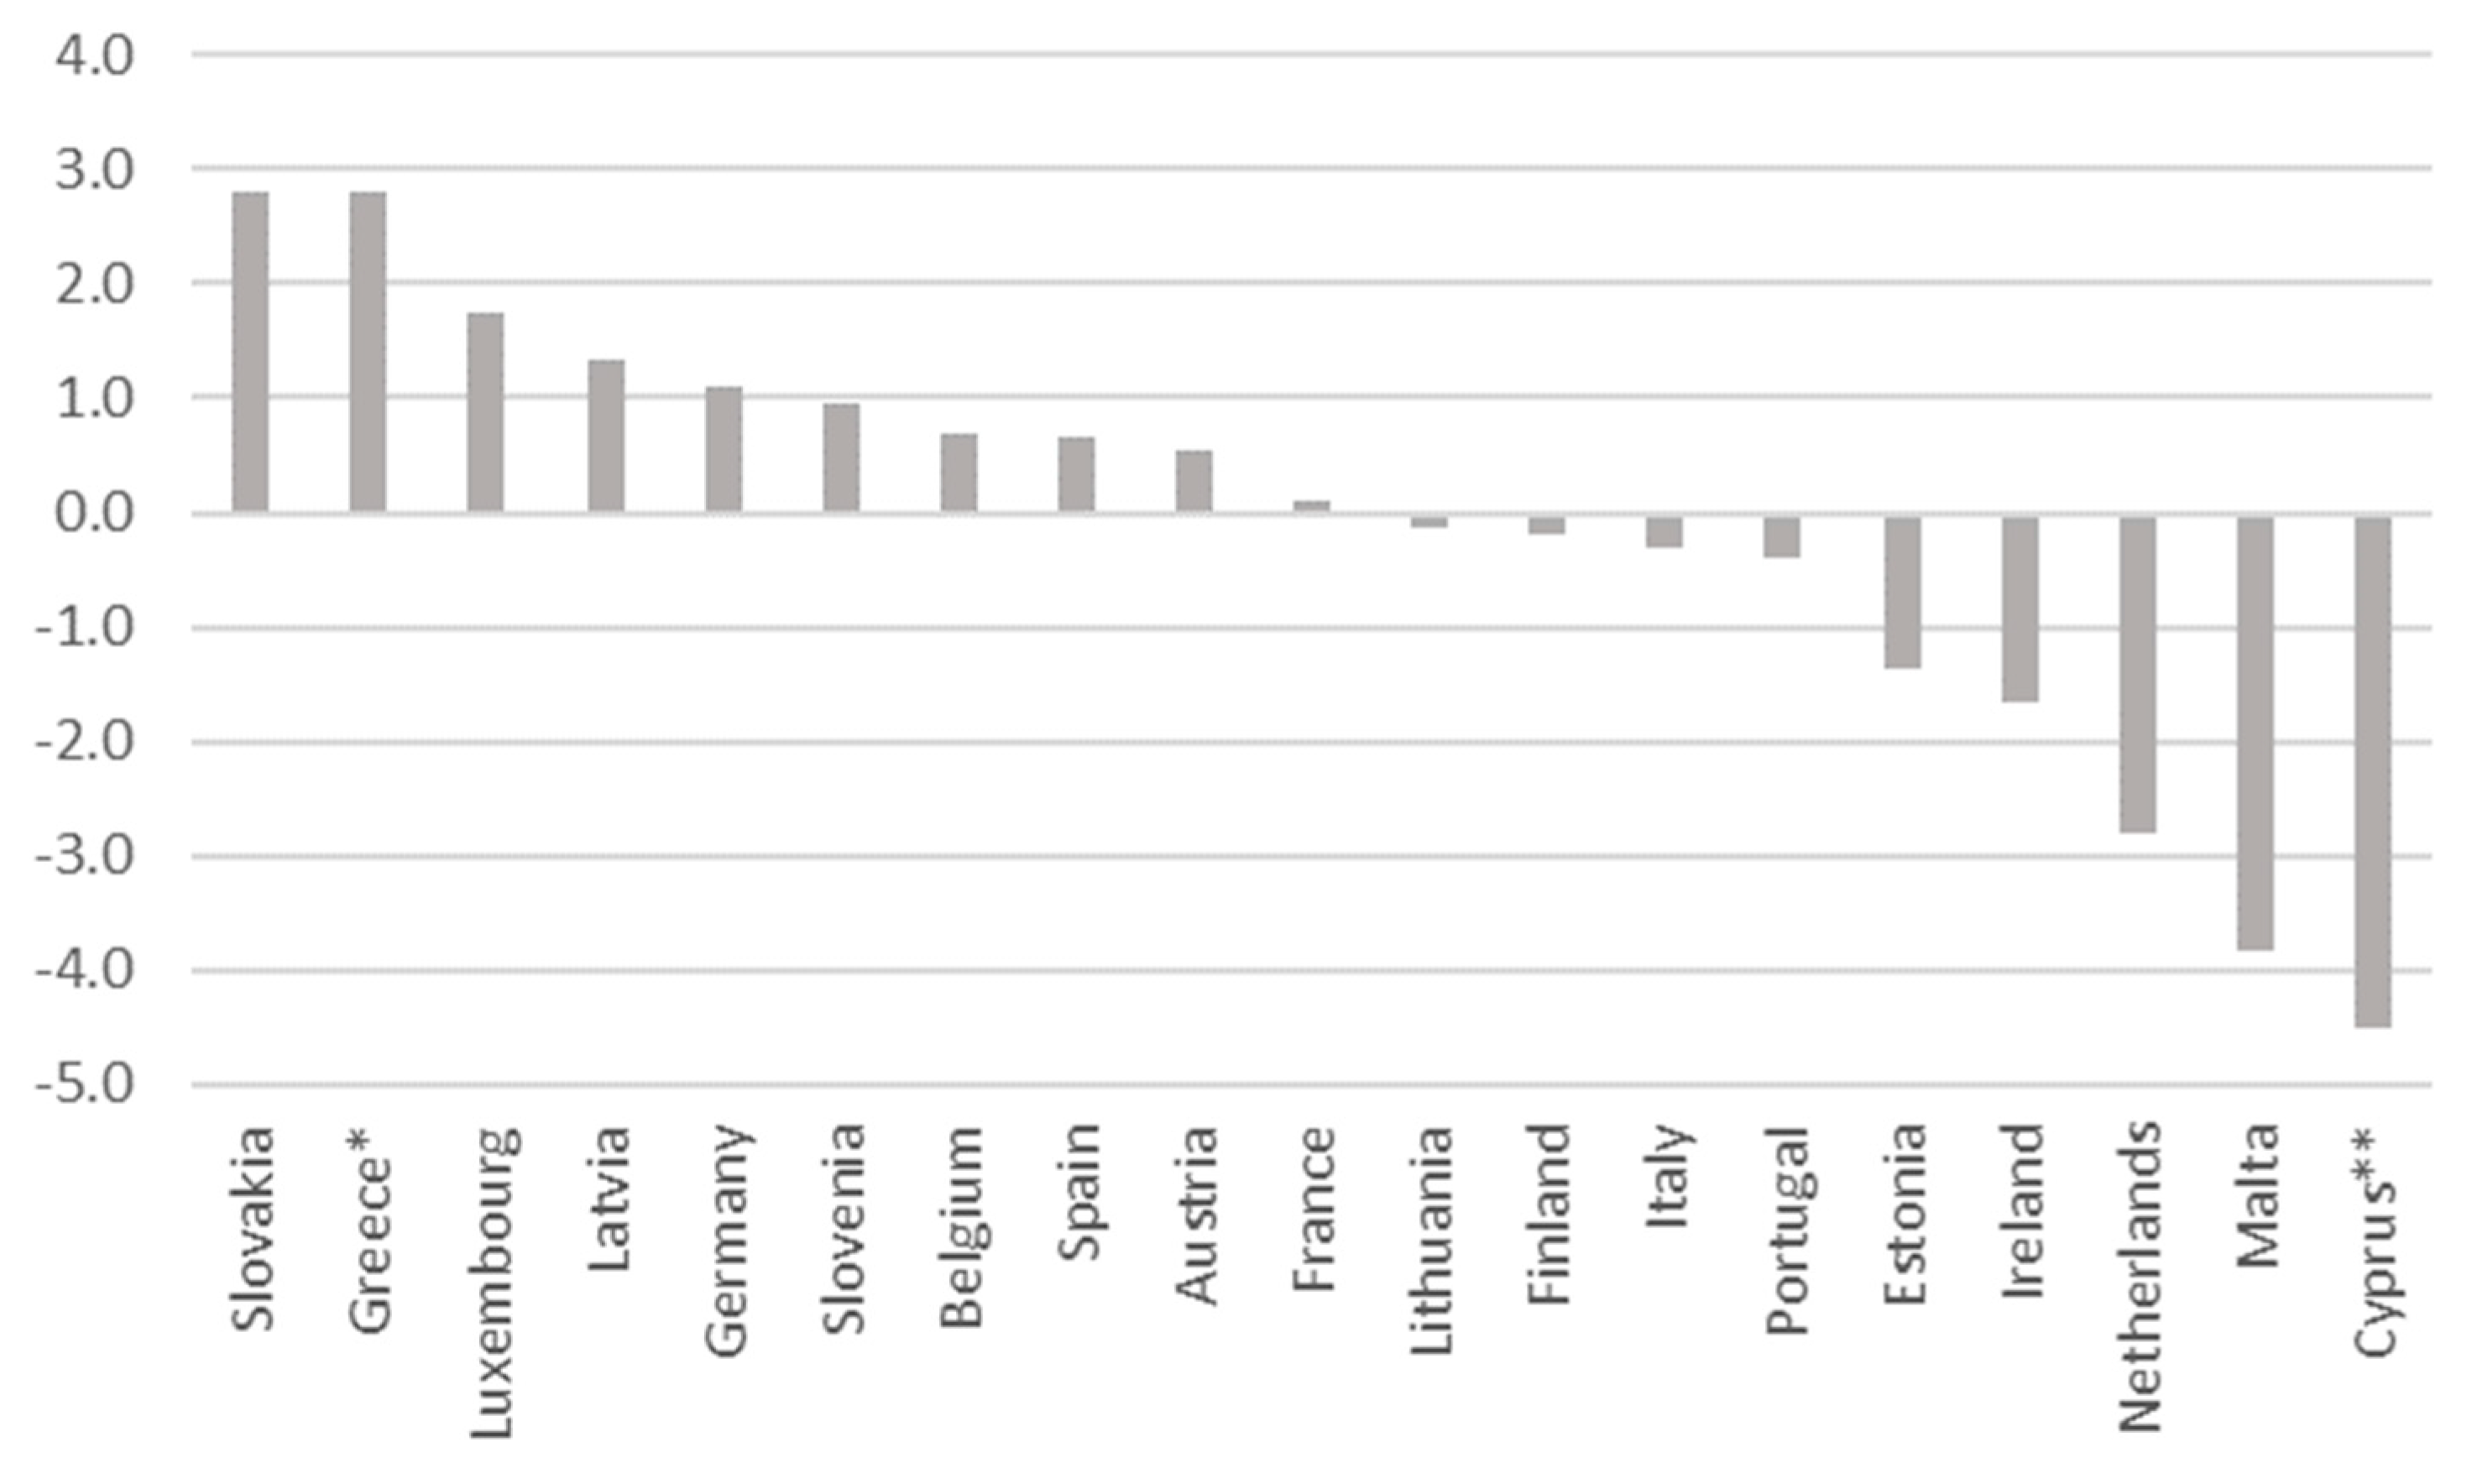
However, budget balance errors can be due to either overestimation of revenue or underestimation of expenditure. Regarding revenue error, the countries that joined the EAPs, such as Cyprus, Ireland and Portugal, had a negative revenue forecast error due to their overestimation of revenues (
Figure 4). Greece and Spain performed better in terms of revenues. Therefore, the error is positive, and the achievable revenue is higher than forecasted.
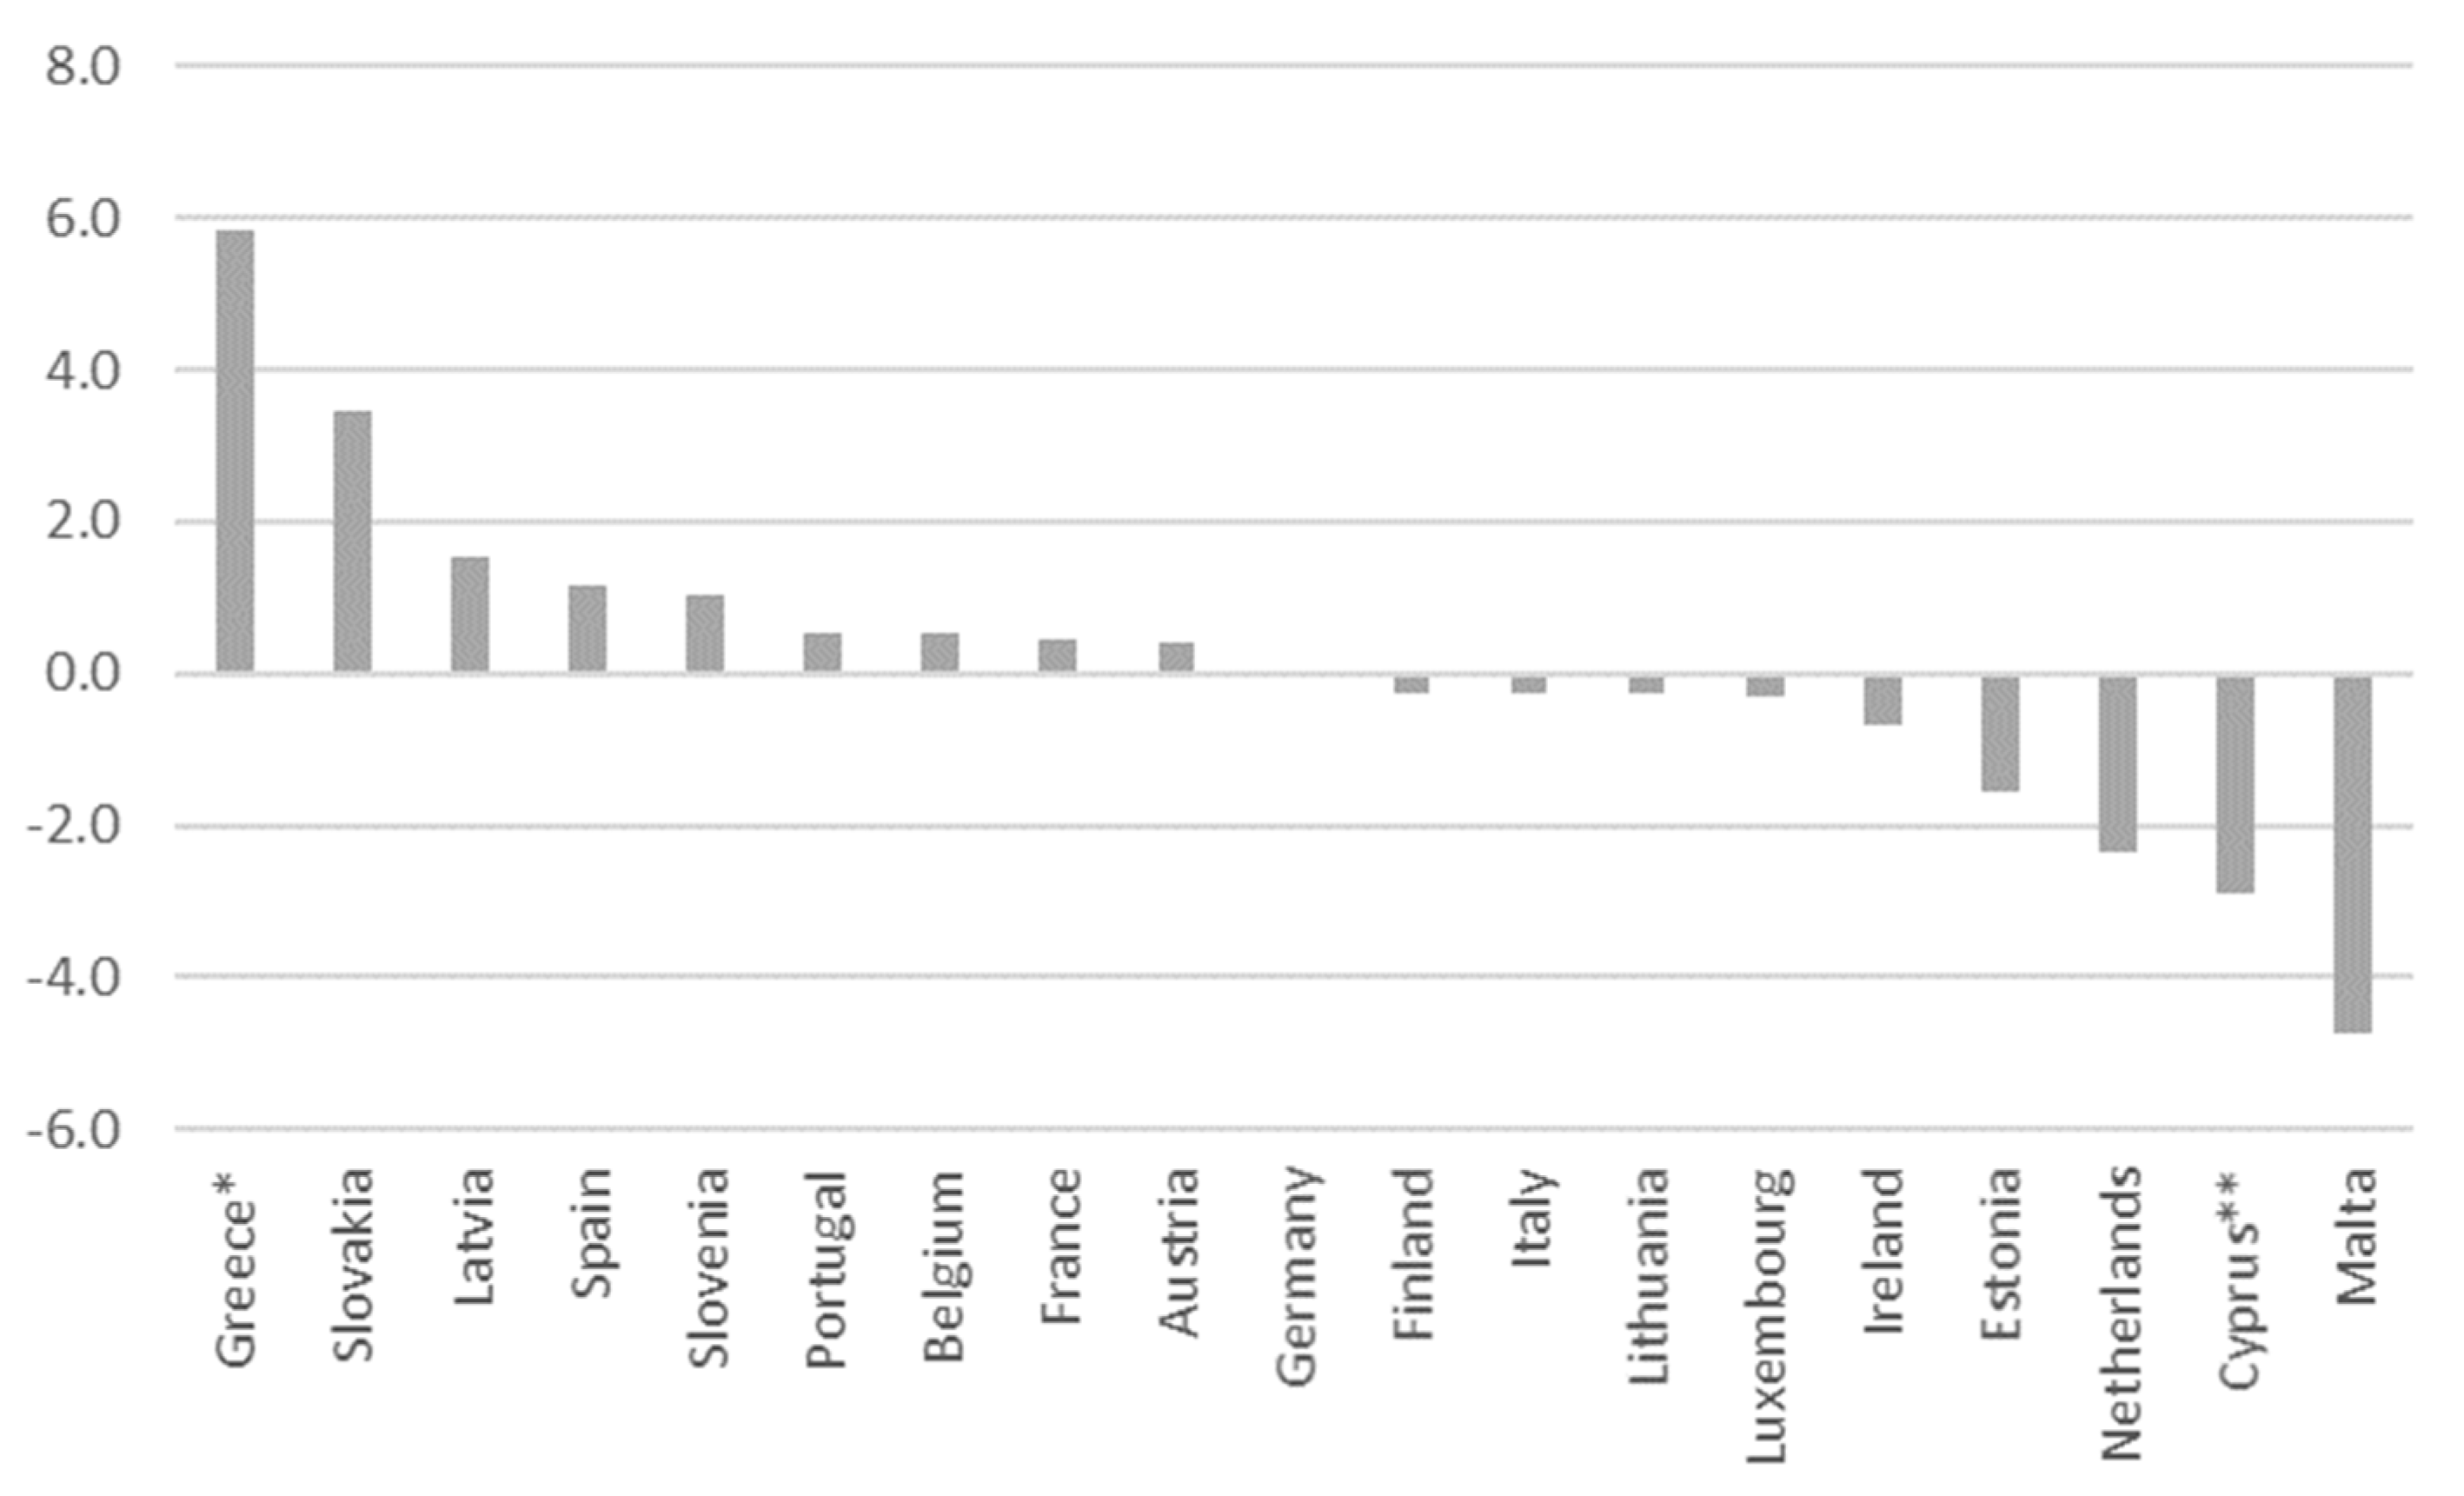
Portugal seems to be the country that presented worse-than-expected figures in both revenue and expenditure (
Figure 5). Greece and Spain showed positive errors in government spending. Both countries spent more than they predicted. Cyprus and Ireland, on the other hand, had a negative forecast error, indicating that these countries were spending less than they expected.
Summarizing, it is observed that: (i) For Ireland and Cyprus, the revenue forecast error and their under-execution interpret the negative general government balance forecast error. (ii) On the contrary, for Greece and Spain, the positive error of expenditure (over-execution of expenditure from the forecast) explains the negative error of forecast of the general government balance for these countries. (iii) Finally, the negative general government forecast error for Portugal is interpreted as both a positive expenditure error and a negative revenue error.
Figure 6 shows the errors of forecasting the annual percentage change of GDP for the Eurozone countries of our sample. Regarding the countries that joined the EAP, Greece achieved the worst negative error, while a negative error is also observed for Cyprus. On the contrary, a positive growth forecast error is presented for Portugal, Spain and Ireland. Further, Greece and Cyprus showed a bias or inability to forecast GDP and mainly overestimated the potential for economic development.
On the other hand, the other three countries —Spain, Ireland and Portugal— present a positive error in forecasting economic growth. These countries seem to be calculating correctly or sometimes even underestimating the possibilities of economic growth.
3. Data and Methodology
This study examines the deviations from budget results and investigates the causal factors for the period 1999–2019. The panel data shows all the discrepancies in the forecasts of the fiscal and macroeconomic data of 19 Eurozone countries. The fiscal forecast errors are calculated from forecast and actual data of general government balance. In addition, the deviations in the macroeconomic data are calculated, specifically in the annual percentage change.
Both fiscal and macroeconomic data forecasts are derived from each country’s state budget data. The sources of data for the forecasts of fiscal and macroeconomic variables originate from the database of the European Union, namely the Stability and Convergence program, for the period 1998–2014. The choice of data used in the research is related to the fact that the forecast should be as close as possible to the beginning of the year for which the forecast is made in order to assess, as much as possible, the ability of each country to make accurate and unbiased forecasts. For example, if forecasts for the year 2005 are available from the 2004 budget, or the 2005 budget or the 2006 budget, then we choose the forecast resulting from the publication of the 2005 state budget. This is because the 2004 budget is announced in the autumn of 2003, and we consider that the time horizon is long, and it may have been unfair to assess the country’s forecasting capability when the year to which the forecast refers is two years after. We also consider biased any assessment of the forecast of 2005 data from the 2006 budget, where an estimate of 2005 is announced, given that some realized data have already been announced, monthly or quarterly, for 2005.
Finally, in a few cases, it is observed that there is no announcement for budget forecasting data in the autumn of the previous year. In this case, the selection of data is applied with the method mentioned above, aiming that the forecast should have been announced as close as possible to the beginning of the year if it is an announcement of the previous year. In addition, in case there is no announcement before the beginning of the year and, at the same time, there is an announcement in the year of forecasting, then the same way of selecting the data applies.
Beetsma et al. (
2009b) and
Von Hagen (
2010) used this database (Stability and Convergence Programs Dataset) as an example.
Pina and Venes (
2011) also created panel data utilizing European Commission regulation no. 3605/93, according to which the member states should publish their forecasts and the results of the budgetary and economic figures. Further,
Beetsma and Giuliodori (
2009) created panels from the OECD Annual Economic Outlook Issue by selecting annual forecasts for OECD countries for the period 1995–2006.
For the continuation and completion of the database, the study uses regulation no. 473/2013 of the European Union, according to which the member states are obliged to publish, in the competent services of the European Commission, the budget of each following year. Given that there was no readily consolidated database for the period 2014–2019, a database was created with the data obtained from the published budgets. In cases where a country had not made public its budget for a year (such as Greece, Spain, Portugal, Cyprus and Ireland, because they participated in economic adjustment programs and were not obliged, according to regulation no. 473/2013, to announce their budget), a survey was conducted in the individual ministries of the countries, and the data to be analyzed were obtained in order to complete the database. This is a key innovation of this paper.
The actual data from which the errors in the budgetary and macroeconomic forecasts were determined were derived from the European Commission Ameco Database or Eurostat. Macroeconomic and budgetary data which is used in the first part of our analysis—inflation and government debt—were drawn from the Eurostat database.
In addition, the study uses the Fiscal Institution Databases of both the OECD and the IMF in order to find whether the countries we are analyzing have a fiscal institution. Following
Calmfors (
2010),
Calmfors and Wren-Lewis (
2014),
Beetsma et al. (
2019) and
Von Hagen (
2010), the study includes a dummy variable that determines whether the respective independent fiscal institution participates in forecasting or the forecasting process, or if it is limited only to recording budget execution. Thus, we examined whether the countries that have independent budget agencies that are effectively involved in the budgeting process have smaller deviations in the execution of budget data.
Table 1 lists the agencies that make up each national independent fiscal institution for each country in the sample. As can be observed, a significant percentage of countries set up an independent national institution following the adoption of European Directive 2011/85/EU.
In Austria, the Fiscal Advisory Council was originally established as the Government Debt Committee in 1970.
In Belgium, the Supreme Finance Council was established in 1936, but the functioning of the independent fiscal institution—the public sector lending requirements—was not established until 1989.
In Finland, the Economic Policy Council does not provide Finland’s official budget for EU purposes, but it is still being set up in response to EU budget management reforms.
The main functions of fiscal institutions are:
Long-term fiscal sustainability analysis;
Macroeconomic and/or budgetary forecasts;
Compliance with fiscal rules;
Direct support of the legislature in the analysis of the budget;
Analysis of the cost of the policy of political actors during election periods.
With regard to the analysis of long-term fiscal sustainability, the independent fiscal institutions of the sample countries—with the exception of Estonia, France, Germany, Ireland and Slovenia—carry out this analysis. Regarding macroeconomic and budgetary forecasts, those of Austria, Finland, France, Germany, Greece, Ireland, Italy, Latvia, Lithuania, Luxembourg, Portugal and Spain evaluate their macroeconomic and budgetary forecasts and give their opinion. The independent fiscal institutions of Belgium, Estonia, Slovakia and Slovenia are not involved in any specific role in macroeconomic and budgetary forecasts. It is worth noting, however, that Netherlands’ “Bureau for Economic Policy Analysis (CPB)” provides these forecasts to the government, thus clearly separating the process of conducting economic policy and forecasting actual fiscal and economic figures. This significantly reduces the possible bias on the part of the Ministry of Finance, which would exist so as to not reflect the exact budgetary and fiscal burden of the policies planned by the Ministry. In addition, all the independent fiscal institutions in the sample, with the exception of the Netherlands, have an active role to play in monitoring compliance with existing fiscal rules. Regarding the support provided by the independent fiscal institution to the legislature, this is mainly the case in countries where there is a Parliamentary Budget Office. In countries where this fiscal institution does not exist, the activities of the respective independent fiscal institution are not linked to the parliamentary process. The countries that have a Parliamentary Budget Office are Austria, Greece, Ireland and Italy, while the Netherlands Bureau for Economic Policy Analysis has the authority to assist in analyzing the state budget of the Netherlands. Another important role played by each fiscal institution is the cost of economic policy programs. This function ensures objectivity in a very critical part of fiscal policy: the fiscal cost of the policy announced by the Ministry of Finance. The opinion of the independent fiscal institution ensures the realistic impact of economic policy on the public budget, thus reducing the margins of bias for political reasons. This is the responsibility of the independent fiscal institutions of Austria, Ireland, Italy, the Netherlands and Slovakia.
Another very important element of the period under consideration, which is also part of the contribution of the present study, are the Economic Adjustment Programs. With the onset of the economic crisis in 2009, serious problems began to arise in many countries, either at the fiscal or banking level. Five European countries were forced to seek a more institutionalized solution to provide some financial assistance. This resulted in a sharp rise in country risk, which in turn led countries to high borrowing costs. The countries that asked for financial support were Greece, Cyprus, Ireland, Spain and Portugal. Greece was the first country that “inaugurated” this way of financial support of a member state of the European Union by other member states. In 2010, Greece was faced with an unprecedented situation, when, after the announcement of budget deficit data and in combination with high debt, its credit rating was repeatedly downgraded by international credit rating agencies, resulting in large increases in long-term borrowing rates. Distortions in both the structure of the economy and the management of public finances by the state created great debate and concerns about the credibility of the country. The low competitiveness of the Greek economy, the inefficiency of fiscal governance in general and problems with administration in the public sector were the main challenges that the country had to face. In May 2010, its temporary inability to finance deficits was covered through a loan agreement of EUR 110 billion between Greece, the International Monetary Fund and the Eurozone member states for a period of three years. This agreement was accompanied by a series of fiscal and structural reform measures. The fiscal measures were aimed at the immediate cure of fiscal problems through the gradual conversion of large deficits into surpluses. Thus, immediate fiscal discipline was a prerequisite for the progress and development of the Economic Adjustment Program, in conjunction with structural measures aimed at fiscal efficiency through significant reforms in fiscal governance and increased competitiveness of the Greek economy. The second Economic Adjustment Program for Greece was launched in 2012 with the IMF and the EFSF (European Financial Stability Facility). The second EAP focused, in addition to fiscal issues and further reforms, on the recapitalization of banks that was necessary due to the participation of the private sector (banks) in the government bond exchange program in order to reduce public debt. The third EAP was signed in 2015 by Greece and the newly established European Stability Mechanism (ESM). The program ended in August 2018. The key feature of all three EAPs is fiscal consolidation, with differences perhaps in the mix and the speed of fiscal policy change.
The second country to join the EAP was Ireland in November 2010, concluding an agreement with the EU, the EFSF and the IMF. Ireland’s main problems began in 2007, when a sharp drop in property prices caused serious problems for banks due to heavy losses. The government supported the banks by transferring the issue to fiscal policy decisions. The deficits that resulted from this government action to support the banks were asked to be covered by Irish taxpayers through higher tax collection, as well as through fiscal stabilization. This raised market concerns and pushed the country’s borrowing costs to unacceptable levels. Ireland, after controlling its budget deficit, in 2012 returned to the bond market with the issuance of a five-year bond, and in 2013 officially completed the EAP. In 2014, the Irish economy recorded its highest annual GDP growth rate, and in 2015 its annual growth rate exceeded 20%.
In May 2011, Portugal became the third country to join the EAP, concluding an agreement with the EU, the EFSF and the IMF. Low economic growth rates before the onset of the financial crisis and the failure to take advantage of low borrowing costs to achieve sustainable public debt management were the main problems that drove the Portuguese economy ahead of rising country risk. In addition to the fiscal problems and the questioning of the country’s debt by the bond markets through the increase in the long-term lending rate, the banking sector faced serious problems. Portugal returned to bond markets in 2013 and in May 2014 completed the EAP. After a period of four years, it recorded a positive rate of economic growth.
Spain is the fourth case of a European country resorting to a European financial support mechanism. Spain faced an exclusive problem in the banking sector. As in the case of Ireland, the banks suffered heavy losses, and the government proceeded with their restructuring in 2010. However, the financial crisis and subsequent recession in the economy found the Spanish government with a significant budget deficit, and support for banks became extremely difficult. The government did not address the problems in borrowing and exclusion from international bond markets, but banks could no longer find lending solutions to recapitalize them. Following this, the Spanish government requested assistance through the EU institutional framework in July 2012. The IMF did not participate in this scheme.
The fifth country to join the EAP was Cyprus, which requested assistance in June 2012. Cyprus joined the euro area in 2008, and since then, the Cypriot government’s borrowing costs have been lower than before its integration. This created rapid growth that was largely channeled through the banks. However, this growth was not sustainable. In April 2013, it joined the Economic Adjustment Program provided by the ESM and the IMF. In 2014, Cyprus returned to the bond markets and in March 2016 completed the EAP.
The key question of our analysis is to investigate the bias in the budget forecasts of 19 Eurozone countries. Following
Von Hagen and Harden (
1994),
Jonung and Larch (
2006),
Brück and Stephan (
2006),
Pina and Venes (
2011) and
Beetsma et al. (
2009a), we define the budget balance forecast error as the main dependent variable, which is calculated as realization–forecast. As independent variables of the first phase of the analysis, the study uses the percentage change of GDP, the change of the general government balance, the public debt as a percentage of GDP, the harmonized index of consumer prices and a variable that defines the electoral cycle. In the second phase of the analysis, the analysis maintains the same dependent variable, and add to the independent variables the error of forecasting economic growth, a variable of the existence of a fiscal institution and a variable indicated by the framework in an Economic Adjustment Program.
Table 2 presents the variables used.
Table 3 presents some descriptive statistics of the variables used.
4. Empirical Investigation and Results
In the first part of the analysis, the study looks at factors of the economic environment that may affect budget forecasting errors. These factors are considered external, and the government cannot control them. The variables chosen are the annual percentage change of real GDP, the change of the budget balance in relation to the previous year, the debt and the harmonized inflation;
Hadzi-Vaskov et al. (
2021) use inflation, among other factors, to explain fiscal forecast errors. Another variable added to this phase of the analysis is elections. The year in which national elections are held is something that the government cannot directly control, as the elections are either scheduled or arise due to political, economic and social developments. Thus, before we analyze the government’s bias regarding forecasts and factors that have to do with the governance framework that regulates the processes and to some extent binds the results of fiscal governance, we try to interpret the effect of factors of the external environment.
Creating an unbalanced panel, we estimate the following relationship. (In Cyprus our observations cover the period 2004–2013 and 2017–2019, in Estonia 2004–2019, in Lithuania 2004–2019, in Latvia 2005–2019, in Malta 2005–2019, in Slovenia 2006–2019 and in Slovakia 2005–2019).
After performing a Hausman test and having applied random effects regression with the least squares method (OLS), we apply the regression (OLS) with fixed effects. Empirical results are presented in
Table 4.
The results obtained from the empirical analysis are of significant importance. Initially, a positive correlation of the percentage change in GDP is observed with the general government balance error, statistically significant at the 1% level. That is, when we observe some increase in GDP by one point, then the realization of the fiscal balance in relation to the forecast is higher and the error increases by 0.15. When GDP decreases compared to the previous year, then the GDP forecast error decreases by 0.15 and the realization is less than the forecast. The interpretation of this result is obvious, as a reduction in GDP implies less taxes due to reduced consumption and tax base from labor and investment in general, and perhaps more government spending to support the economy. On the contrary, GDP growth means increased consumption, investment and exports, which leads to increased collection of government revenues from taxes. In a period of economic growth, governments do not have to support the economy and society with further government spending, and this reduces the tendency of governments to positively change the provision of government spending. The results for the second independent variable, which explains some of the fiscal balance error, are perfectly reasonable. The change from year to year of the general government balance as a percentage of GDP has a positive correlation with its forecast error with statistical significance at the level of 1%. More specifically, an increase in the general government balance by one point leads to an increase in the error—that is, a higher realization than the forecast—by 0.52. In contrast, a fiscal balance reduction unit is associated with a decrease in realization of 0.52 relative to the forecast. The reasons for the positive correlation between the change in the fiscal balance and its forecast error are external and may be due to the tax capacity of citizens, the effectiveness of fiscal governance (fiscal governance and administration–public spending review). The results for the independent variable of government debt show the negative relationship with the fiscal balance error, statistically significant at the level of 5%. We observe, thus, that a reduction in public debt by one percentage point increases the general government balance forecast error by 0.01. On the contrary, when a country has increased its debt by one unit in a given year, then the error decreases by 0.01. The interpretation of this finding is multifaceted, as debt as a percentage of GDP is also affected by the evolution of GDP itself, as the higher the GDP, the lower the debt-to-GDP ratio. In addition, due to the “government income limitation”, when the debt is reduced, then the fiscal return is better, as further expansion of debt is not necessary. Debt is necessary when the general government balance is negative and there is a deficit, so the deficit is intended to cover new borrowing. In this sense, better-than-expected fiscal performance is negatively related to government debt.
The fourth independent variable, the harmonized index of consumer prices, has a positive correlation with the forecast error of the fiscal balance and is statistically significant at the 1% level. A positive change in the harmonized index of consumer prices indicates inflation due to increased demand. The increase in demand stimulates economic activity, and therefore a positive change in GDP. As demand and consumption increase, revenues increase, and the balance improves. In addition, when deflationary trends prevail, the dynamics of the economy are negatively affected, and this can even cause a recession. When the economy is in a recession, budget revenues are limited, and the need for more government spending grows. We note here that the period we are considering is not characterized by any particular problem in supply. Conversely, due to the financial crisis that occurred after 2008, purchasing power and demand were significantly affected. Therefore, from our empirical study, it is observed that an increase in the consumer price index unit is related to an increase in the fiscal balance error by 0.02 and vice versa. Finally, the fifth independent variable of our current stage of analysis is the dummy variable that indicates the electoral cycle. In full correspondence with the existing literature, we prove the negative relationship between elections and the general government balance forecast error, where we also find statistical significance at the level of 5%. In the case of an election year, we observe a smaller realization than the forecast of the fiscal balance by 0.47 and vice versa. The tendency of governments to increase government spending in order to enhance their electorate is one of the main reasons for this.
In the second part of the analysis, this study tries to investigate the institutional factors that affect the effectiveness of general government fiscal forecasts, some of which are analyzed, on the one hand, from the literature, and others arise from the developments of the period under study. A key factor that is clearly identified in the literature is bias through error in predicting the evolution of the economy. Thus the economic growth forecast error—which is affected either by the government’s ability to predict the development of the economy, or by the government’s tendency to be overly optimistic or pessimistic for political reasons—will be the first independent variable that will be integrated into our analysis. Furthermore, the existence of an independent fiscal institution is the second independent variable (dummy variable). The existence of an independent fiscal institution ensures a level of transparency and impartiality in planning and forecasting the financial outlays of each government. Finally, the period covered by our study (1999–2019) includes the period of creation of the Economic Adjustment Programs that supported countries with public debt problems due to the debt crisis that began in 2009. Given that these programs were accompanied by reforms that included improving fiscal governance, as they referred to countries with serious fiscal governance and budget imbalances, the paper will try to determine whether the programs improved fiscal efficiency or forecasts of the fiscal data. Thus, Economic Adjustment Programs are considered another independent variable (dummy variable). The dependent variable remains the same.
Table 5 provides a description of factors of the internal environment.
Having created the unbalanced panel, as in the previous stage of the analysis, we proceed to a Hausman test having applied regression with the method of least squares (OLS) with random effects, and based on the result of the control, we proceed to the regression estimation (OLS) of the above relationship with constant effects. The model specification is as follows:
Empirical results are presented in
Table 6.
The positive and statistically significant correlation between the forecast error of economic growth and the forecast error in the fiscal balance confirms the findings in the literature for the reference period of the present study. For the 19 countries of our sample, an error of forecasting economic growth by 1 results in a corresponding error in the same direction by 0.33. The statistical significance of this finding at the level of 1% proves the bias of macroeconomic forecasts. This is the case either when the government underestimates growth and therefore the fiscal balance, or when it overestimates growth and therefore the general government balance. Furthermore, the existence and operation of an independent fiscal institution seems to work positively in improving the efficiency of fiscal governance. Based on the results, a fiscal institution increases the fiscal balance forecast error by 0.53. This finding is statistically significant at the 5% level.
Finally, a key finding of the analysis is that when a country is in an Economic Adjustment Program, then the general government’s balance error increases (improves) by 1.05.
5. Conclusions and Discussion
The economic crisis offered an important opportunity for further strengthening and developing economic and fiscal governance. The debt crisis brought EU to a point of intense reflection on how to address this issue in the context of a monetary union. The framework of fiscal rules established under the Stability and Growth Pact did not prevent such a situation, and some Eurozone countries went through Economic Adjustment Programs. This paper investigated the reasons why some Eurozone countries failed to bring their public finances to a sustainable level. Further, the paper analyzed the factors that influenced the execution of fiscal forecasts. This study, therefore, focused on budget forecast errors in Eurozone countries for the period 1999–2019. Using an OLS method and utilizing the database of the Stability and Convergence programs until 2014 and regulation 473/2013 of the EU until 2019, a unique dataset was created regarding the fiscal and macroeconomic forecasts of 19 Eurozone countries in order to estimate forecast errors.
This study found that the ability of a country to adhere to its fiscal plans depends on the factors that influence the year-on-year evolution of fiscal data. The evolution of GDP, the level of public debt and the harmonized index of consumer prices are external factors that significantly affect the implementation of government fiscal plans. An additional factor is whether a fiscal year is also an election year for a government. Thus, in order for each government to be able to control the development and shaping of public finances through the proper observance of its fiscal plans, it is important to create mechanisms for monitoring the general macroeconomic data, such as the evolution of GDP and the general level of prices. Furthermore, constant information regarding the level of public debt is another process that gives more control over the correct observance of budget plans. Finally, when a year is an election year, then the mechanisms and procedures for monitoring budget execution should be given increased attention, as expenditure tends to expand, and the potential for lower tax administration efficiency is high. The existence of an institution that will monitor developments in the economy and inflation and predict their development is a key policy proposal. Such an institution would enable the government to control the risks regarding the correct execution and the correct forecast of budget data. In addition, it would give the government the operational leeway to work diligently to optimize the processes governing the country’s fiscal governance. Finally, measures to ensure the effectiveness of fiscal governance in election years would not be disrupted if there were a national fiscal rule for public debt during election years. Such a rule should have a greater degree of commitment than the existing ones, and this can be achieved through the inclusion of this rule in the Constitution of each country. Thus governments will not be able to increase the debt for elections year by a certain percentage compared to the previous financial year. In this way, the government will be more careful in shaping the balance and will not make discounts either in terms of expenditure management or in terms of tax administration efficiency.
Furthermore, this study found that a country’s ability to meet its fiscal plans depends on the government’s ability to accurately assess the economy. It also depends on the existence of an independent fiscal institution in the country that will contribute to transparent and independent monitoring of fiscal policy. In addition, efficiency in meeting budget forecasts seems to ensure the framework of an Economic Adjustment Program, as it obliges countries to adhere to fiscal estimates. This seems to be a strong measure of excessive fiscal efficiency and accuracy in budget forecasts. One explanation could be that countries make pessimistic forecasts for the development of fiscal and macroeconomic data when they are in Economic Adjustment Programs in order to have space to negotiate and request more financial assistance.
However, in order for some countries not to get to the point of being forced to join Economic Adjustment Programs again, they must have ensured the sustainability of public finances through annual compliance with the planned fiscal policy. This could be done through the functioning of the independent budgetary institutions and the delegation of further responsibilities to them, giving them an active role and the ability to contribute to the consideration of the assumptions upon which that the annual state budget is drawn up and planned. More specifically, each independent fiscal institution should make its own independent forecasts, and these should be the forecasts of the budget data used by the government. Today, what prevails in most countries—with the exception of a few countries such as the Netherlands—is for the independent fiscal institution to simply express its views on the ministry’s existing forecasts. In addition, this paper suggests that fiscal institutions would make their own independent forecasts for macroeconomic data (GDP and inflation). These will be received by the Ministry of Finance as forecasts and will be the basis for the draft annual budget. This completely eliminates the possibility of government bias in forecasting GDP growth.
Finally, in terms of research, this paper points to some future research avenues: (1) more sophisticated econometric models and procedures that incorporate additional dynamics; (2) further expansion of the study by including all the countries of Europe; (3) it would be of significant interest to include a dummy variable in the analysis for the period of the coronavirus pandemic, as the pandemic was a major factor for immediate and unpredictable fiscal expansion; (4) in addition, investigation of the effectiveness of EU fiscal governance in a supply constrained environment (as in energy) would be of interest. Such an environment creates problems in the supply chain and drives up prices. Furthermore, the reduction in energy supply increases prices, and this leads to increased production costs. This has the consequence that the nominal GDP is strengthened due to the increase in prices, while the real GDP is limited. The volatility of inflation creates uncertainty and worsens the accuracy of macroeconomic predictions. Furthermore, increases in prices that are not due to increased demand but are due to decreased supply significantly reduces disposable income, and this increases the risk of forecasting tax revenues due to the restriction of consumption. In addition, interventions concerning social policy during periods of increased inflation, specifically energy, bring about an increase in public expenditure. Strengthening of the institutions that support the effectiveness of fiscal governance, including independent fiscal institutions, is necessary to avoid fiscal imbalances as a result of expansionary fiscal policy and the risk of forecasting under these conditions.


