1. Introduction
Modelling is defined as a mathematical and statistical way of reproducing events and their possible consequences due to policy decisions (
Shanahan et al. 2016). In econometric modelling, models formed on a theoretical framework are constructed using one or many exogenous variables, identifying quantitative relationships which generate various responses. Dynamic Stochastic General Equilibrium (DSGE) models have ruled as a tool for policy decisions. Then the 2008 financial crisis became the downfall of this modelling technique because of “no response” to policy problems afterwards. These models cannot predict a crisis or any non-linear event. Meanwhile, the Agent-Based Modelling (ABM) approach emerged as an alternative to DSGE models. ABM emergence property allows foreseeing complex behaviours. The Great Recession made policymakers see the “economy as [a] complex evolving system” consisting of heterogeneous agents and non-equilibrium state continuously change the economy’s structure.
Bibliometric analysis is a method to explore the information-rich environment on research activities and findings extracted through data from research publications in academic journals and their citations. Bibliometric indicators help investigate the knowledge structure of a particular field and its scope in the future. In the framework of research developments, questions like “where are we now?” and “where will we be in the future?” are answered by this form of analysis. There are two types of bibliometric analysis techniques: (1) performance analysis and (2) science mapping. In essence, performance analysis considers the contributions of research parts, whereas science mapping considers the relationships among them.
This article is dedicated to exploring the research development of agent-based modelling in economics using bibliometric analysis techniques. This study aims to use bibliometric analytic approaches to investigate the knowledge base of agent-based modelling in economics. We used both performance analysis metrices and scientific mapping methodologies to achieve the study’s research aims. Also, ABM in economics is examined in terms of its conceptual and social structure.
2. What ABM Has and What DSGE Lacks
The primary instrument for generating policy judgments remains DSGE models. These models did not predict the financial crisis of 2008. These models’ limitation in addressing many policy concerns is their data-driven approach and lack of macroeconomic data. These models’ openness and transparency is a strength, but it also leaves them vulnerable to criticism. It is possible to draw attention to suspicious assumptions. Evidence of inconsistencies are readily apparent. It is possible to identify elements that are not included in the model (
Christiano et al. 2018). DSGE modelling is a death tale that has been predicted. Joseph Stiglitz writes, “...much of the main parts of the DSGE model are defective—sufficiently seriously wrong that they do not give even a good starting point for creating a good macroeconomic model” (
Stiglitz 2018). Vines and Wills want DSGE models to be able to achieve what they desire, which is to allow modellers to get a quick look at crucial issues. Central banks routinely use estimated DSGE models for forecasting and quantitative policy analysis. Estimating these models and interpreting the results to formulate policy are both difficult tasks (
Schorfheide 2011). The issues and flaws of DSGE models are similar to those of generalised equilibrium (GE) models. Many researchers have discovered that the agents in DSGE models cannot be constrained so that their uniqueness and stability are preserved.
Furthermore, assuming individual rationality does not imply aggregate rationality. Because reactions to shocks or parameter changes may not resemble in aggregate, the representative agent assumption in these models is not reliable for policy analysis. In DSGE models, solving systems of equations can lead to another difficulty of identification, resulting in skewed estimates of some structural parameters and raising doubts about statistical significance. This modelling technique cannot predict infrequent economic crises, which is not surprising given that fat tail densities are approximated distributions of macroeconomic time series (
Fagiolo et al. 2008), and Gaussian distributed shocks are a typical assumption in DSGE models. The assumption that Representative Agents (RAs) are rational prevents these models from addressing distributional issues because it implies that one: agents are fully aware of the economy; two: agents are capable of understanding and solving any problem they encounter without making mistakes; and three: agents are aware that all others follow the same pattern. These issues demonstrate that DSGE models are ill-equipped to solve policy concerns and cannot forecast future crises. The DSGE approach is so enthralled by its internal logic that it confuses the model’s precision with the real one. (
Caballero 2010).
ABM has evolved rapidly in economics over the previous two decades. Due to the following features of this modelling method;
Bottom-up Perspective,
Heterogeneity,
A complex system approach that is always evolving,
Non-linearity,
Endogeneity vs direct interactions,
Rationality with bounds,
Agents’ ability to learn,
a market mechanism that is based on selection,
These models are computer simulations that use a top-down strategy to investigate developing dynamic patterns. Policies and the social behaviours that result from them act like a weather system constantly battered by storms and invasions. The ability to make large-scale modifications and crash systems are inherited. External disturbances throw the equilibrium condition off. ABM allows little effects like herding and fear driving bubbles and crashes to be amplified via feedback processes. Models are non-linear in mathematical terms, implying that the result may not be proportional to the cause. The capacity to represent emergent phenomena resulting from the interaction of each agent is a major advantage of this modelling technique. Emergent phenomena can have traits that are opposed to those of their constituents. Agent-based models are a natural way to describe a system of behavioural elements. ABM can explain that designing a virtual agent with a shopping basket is more natural than describing average effects using a synthetic basket density. The flexibility of these models allows for the addition of new agents and changes in behaviour, learning, evolution, and complexity by altering interaction rules.
3. Bibliometric Analysis: A Technique of Systematic Literature Review
One of the most important knowledge discovery methods is synthesising the results of earlier studies. The use of bibliometric analysis is growing in popularity (
Zupic and Čater 2015). In a qualitative study of published research papers, journals, and books, the bibliometric technique has been employed (
Ellegaard and Wallin 2015). It aids in the identification of frequently referenced authors and institutions, related publications, and the keywords most commonly used in a given study filed (
Daim et al. 2006). Furthermore, bibliometric analysis can be used to assess the publication’s popularity among specialists and verify the author’s reputation (
Ball and Tunger 2005). It also aids in literature review by leading the researcher to influential research works or publications, as well as objectively mapping the study field (
Zupic and Čater 2015). (
Donthu et al. 2021) discused in detail the methodology to conduct bibliometric analysis and concluded that bibliometric analysis can aid knowledge generation not just in business research but also in other sectors, thanks to a better comprehension of science.
Bibliometric approaches are used for a variety of purposes, including performance analysis and science mapping (
Cobo et al. 2011). Performance analysis is used to assess individual, institutional, and individual research and publishing performance. A generic approach of domain analysis and visualization is science mapping. A scientific discipline, a field of research, or topic areas related to specific research topics can all be included in the scope of a science mapping study. In other words, an area of scientific knowledge expressed through an aggregated collection of intellectual contributions from members of a scientific community or more clearly defined specialty is the unit of analysis in science mapping (
Chen 2017).
Citation analysis, co-citation analysis, bibliographic coupling, co-word analysis, and co-authorship analysis are some of the methodologies utilised in science mapping. Such methodologies are beneficial for illustrating the bibliometric and intellectual structure of a study field when combined with network analysis (
Baker et al. 2020;
Tunger and Eulerich 2018).
4. Study Design
The goal of this study was to fulfil two purposes. The first was to determine research trends over time, and the second was to investigate research content in order to assess the application of agent-based modelling techniques in various economic sectors. Hence we combined both bibliometric methodologies; performance analysis and science mapping to reach our objectives.
Research Objectives: The analysis is constructed in such a way as to achieve the following goals.
Identifying the knowledge base of agent-based modelling and its intellectual structure particularly in economics.
Examine the research front/conceptual structure of agent-based modelling in context of monetary policy.
Exploring the social network structure of agent-based modelling in economics.
Research Design: Many methods are described in
Section 3 of the bibliometric analysis. Citation and co-citation analysis (by author and journal), co-word analysis, and network analysis were among the bibliometric methodologies we considered.
Bibliometric Data Collection: The Scopus database offered a total of 1568 documents for examination. A sophisticated keyword selection was required for data extraction in order to provide a relevant set of data. The keywords chosen must match the following four criteria: high search volume, relevancy, high conversion value, and low competition. The search terms “agent-based modelling” AND (“DSGE” OR “monetary policy” OR “crisis” OR “central banks”) were used to extract bibliometric data.
Inclusion Criteria: After filtering the data based on the inclusion and exclusion criteria, a total of 1568 data were gathered. Three inclusion rules were followed: (1) Articles in which one of the keywords appears in the title, abstract, or keywords (2) The publication date ranges from 2000 to 2020. (3) Journal articles, conference papers, and book chapters. If they met all inclusion criteria, English language abstracts were included in the bibliometric review.
Exclusion Criteria: All documents with a core subject of agent-based modelling but not relevant to the field of economics were left out of the analysis.
Methodology and Software: We used the Scopus dataset in the analysis and the approaches listed above to answer our research questions. R was chosen as software for both visuals and quantitative analysis.
5. Knowledge Base of ABM: Results and Findings
5.1. Productivity Assessment
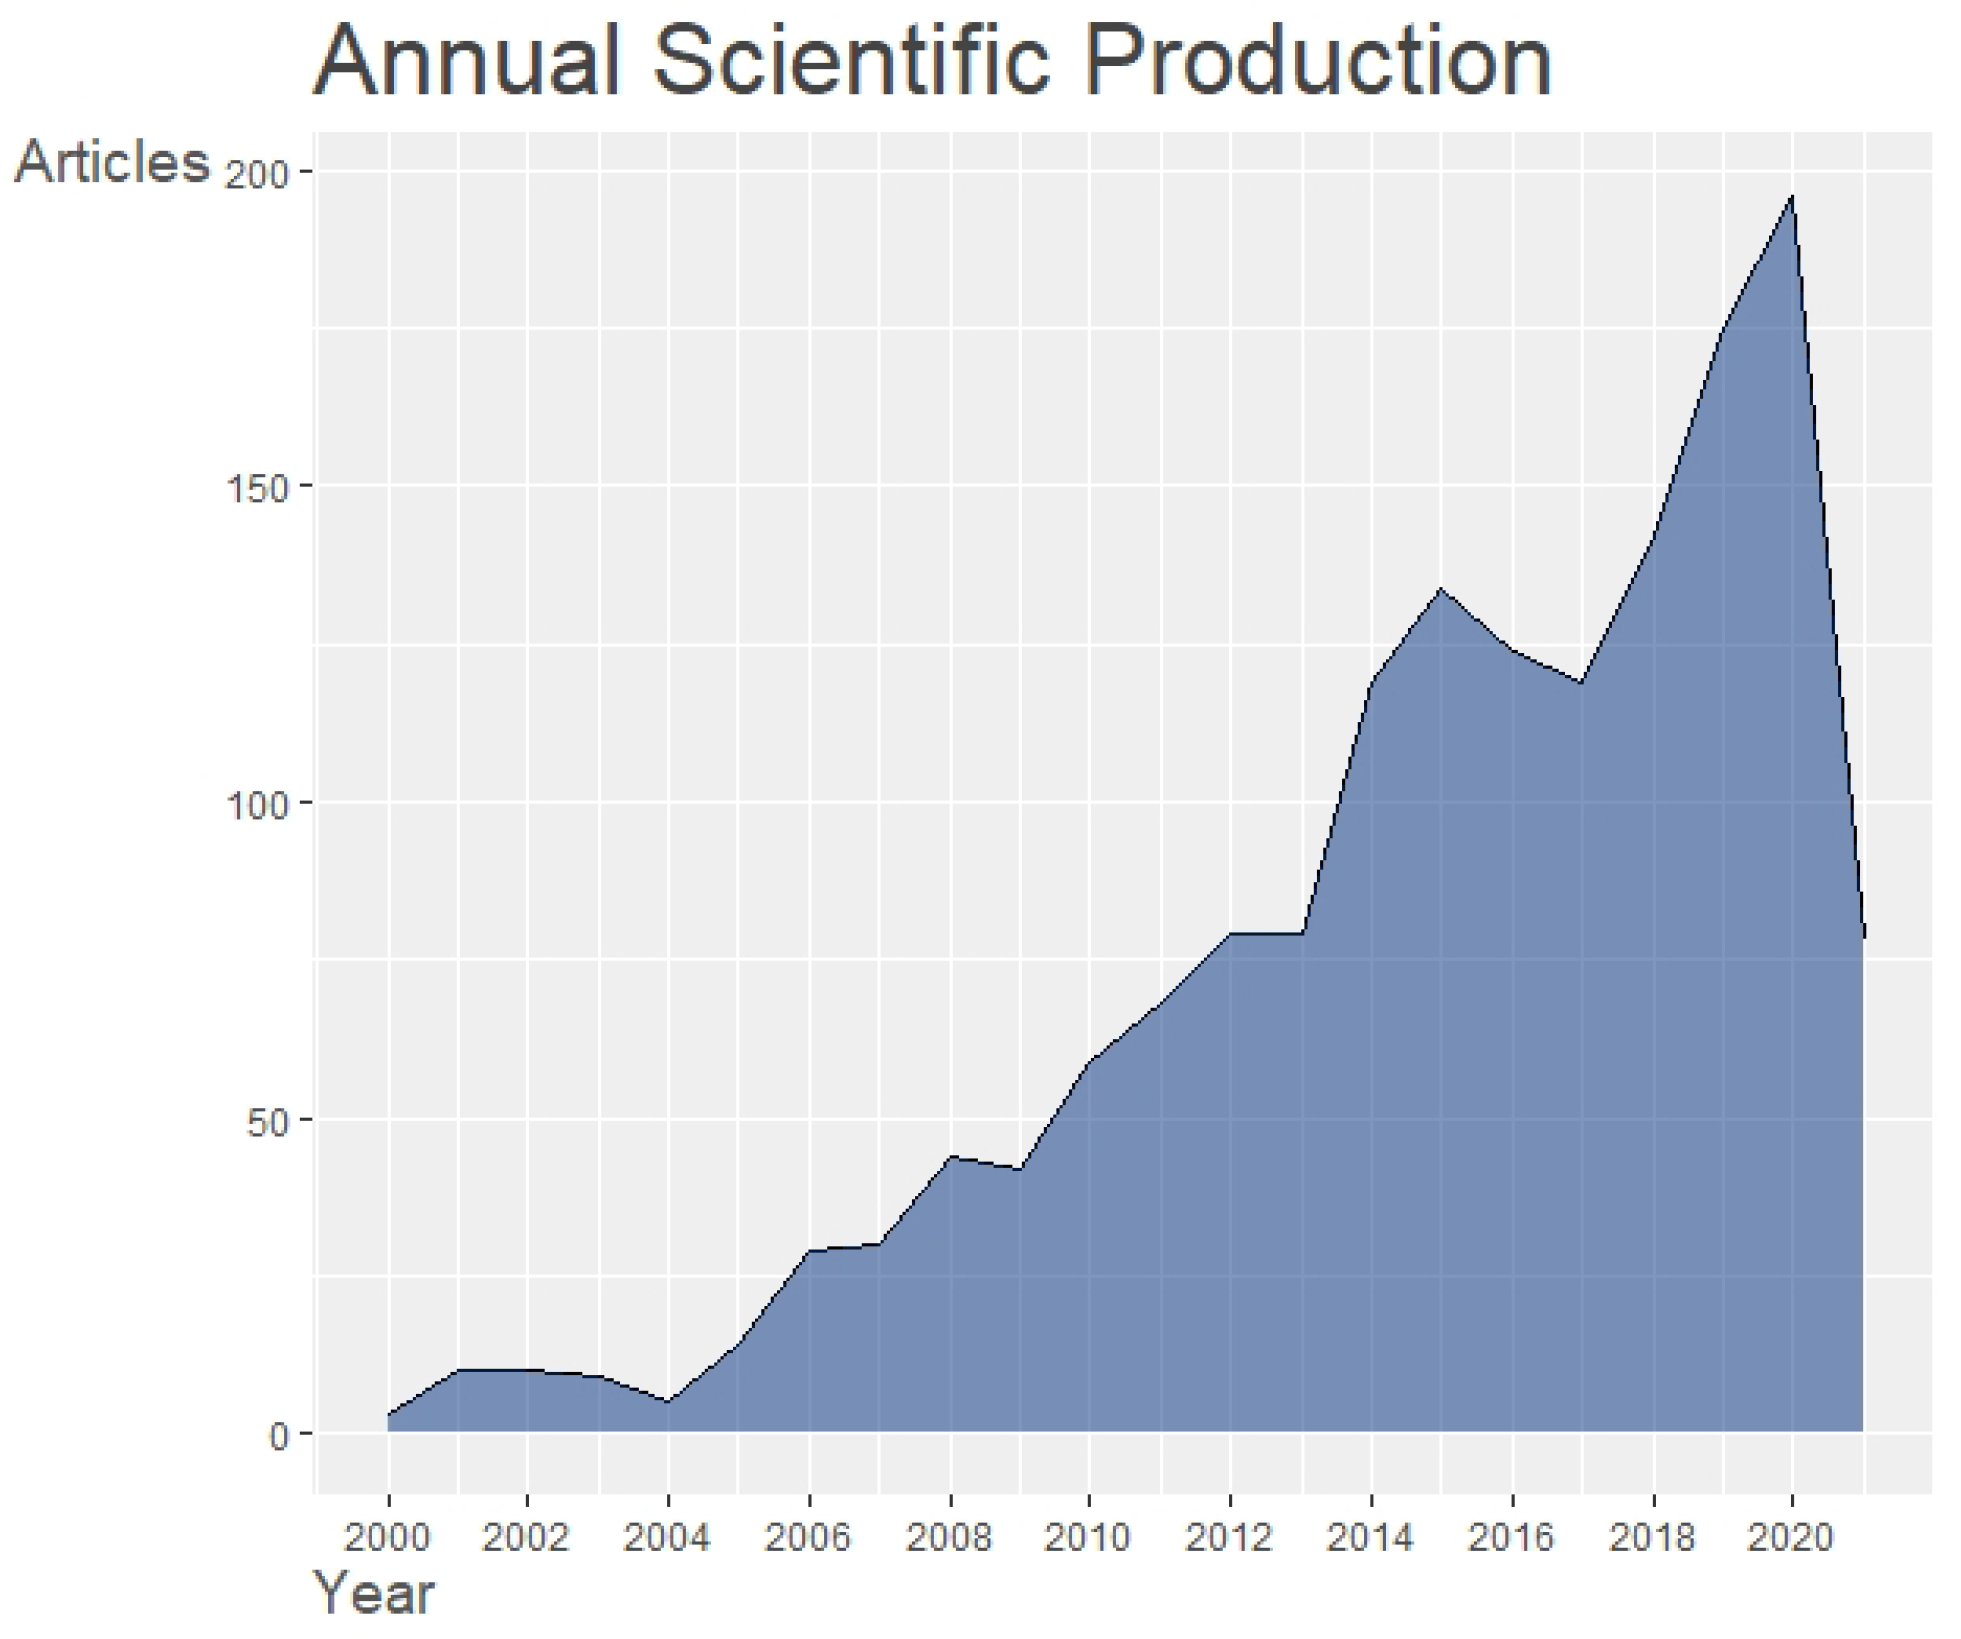
After the financial crisis of 2008, the agent-based model became a widely researched topic. The crisis was not predicted by DSGE models, and they also did not respond to policy questions. Since the most publications were in 2020, ABM has become a new topic in its development. ABM is also the ideal tool for experimenting with different policy scenarios during a pandemic (
Figure 1).
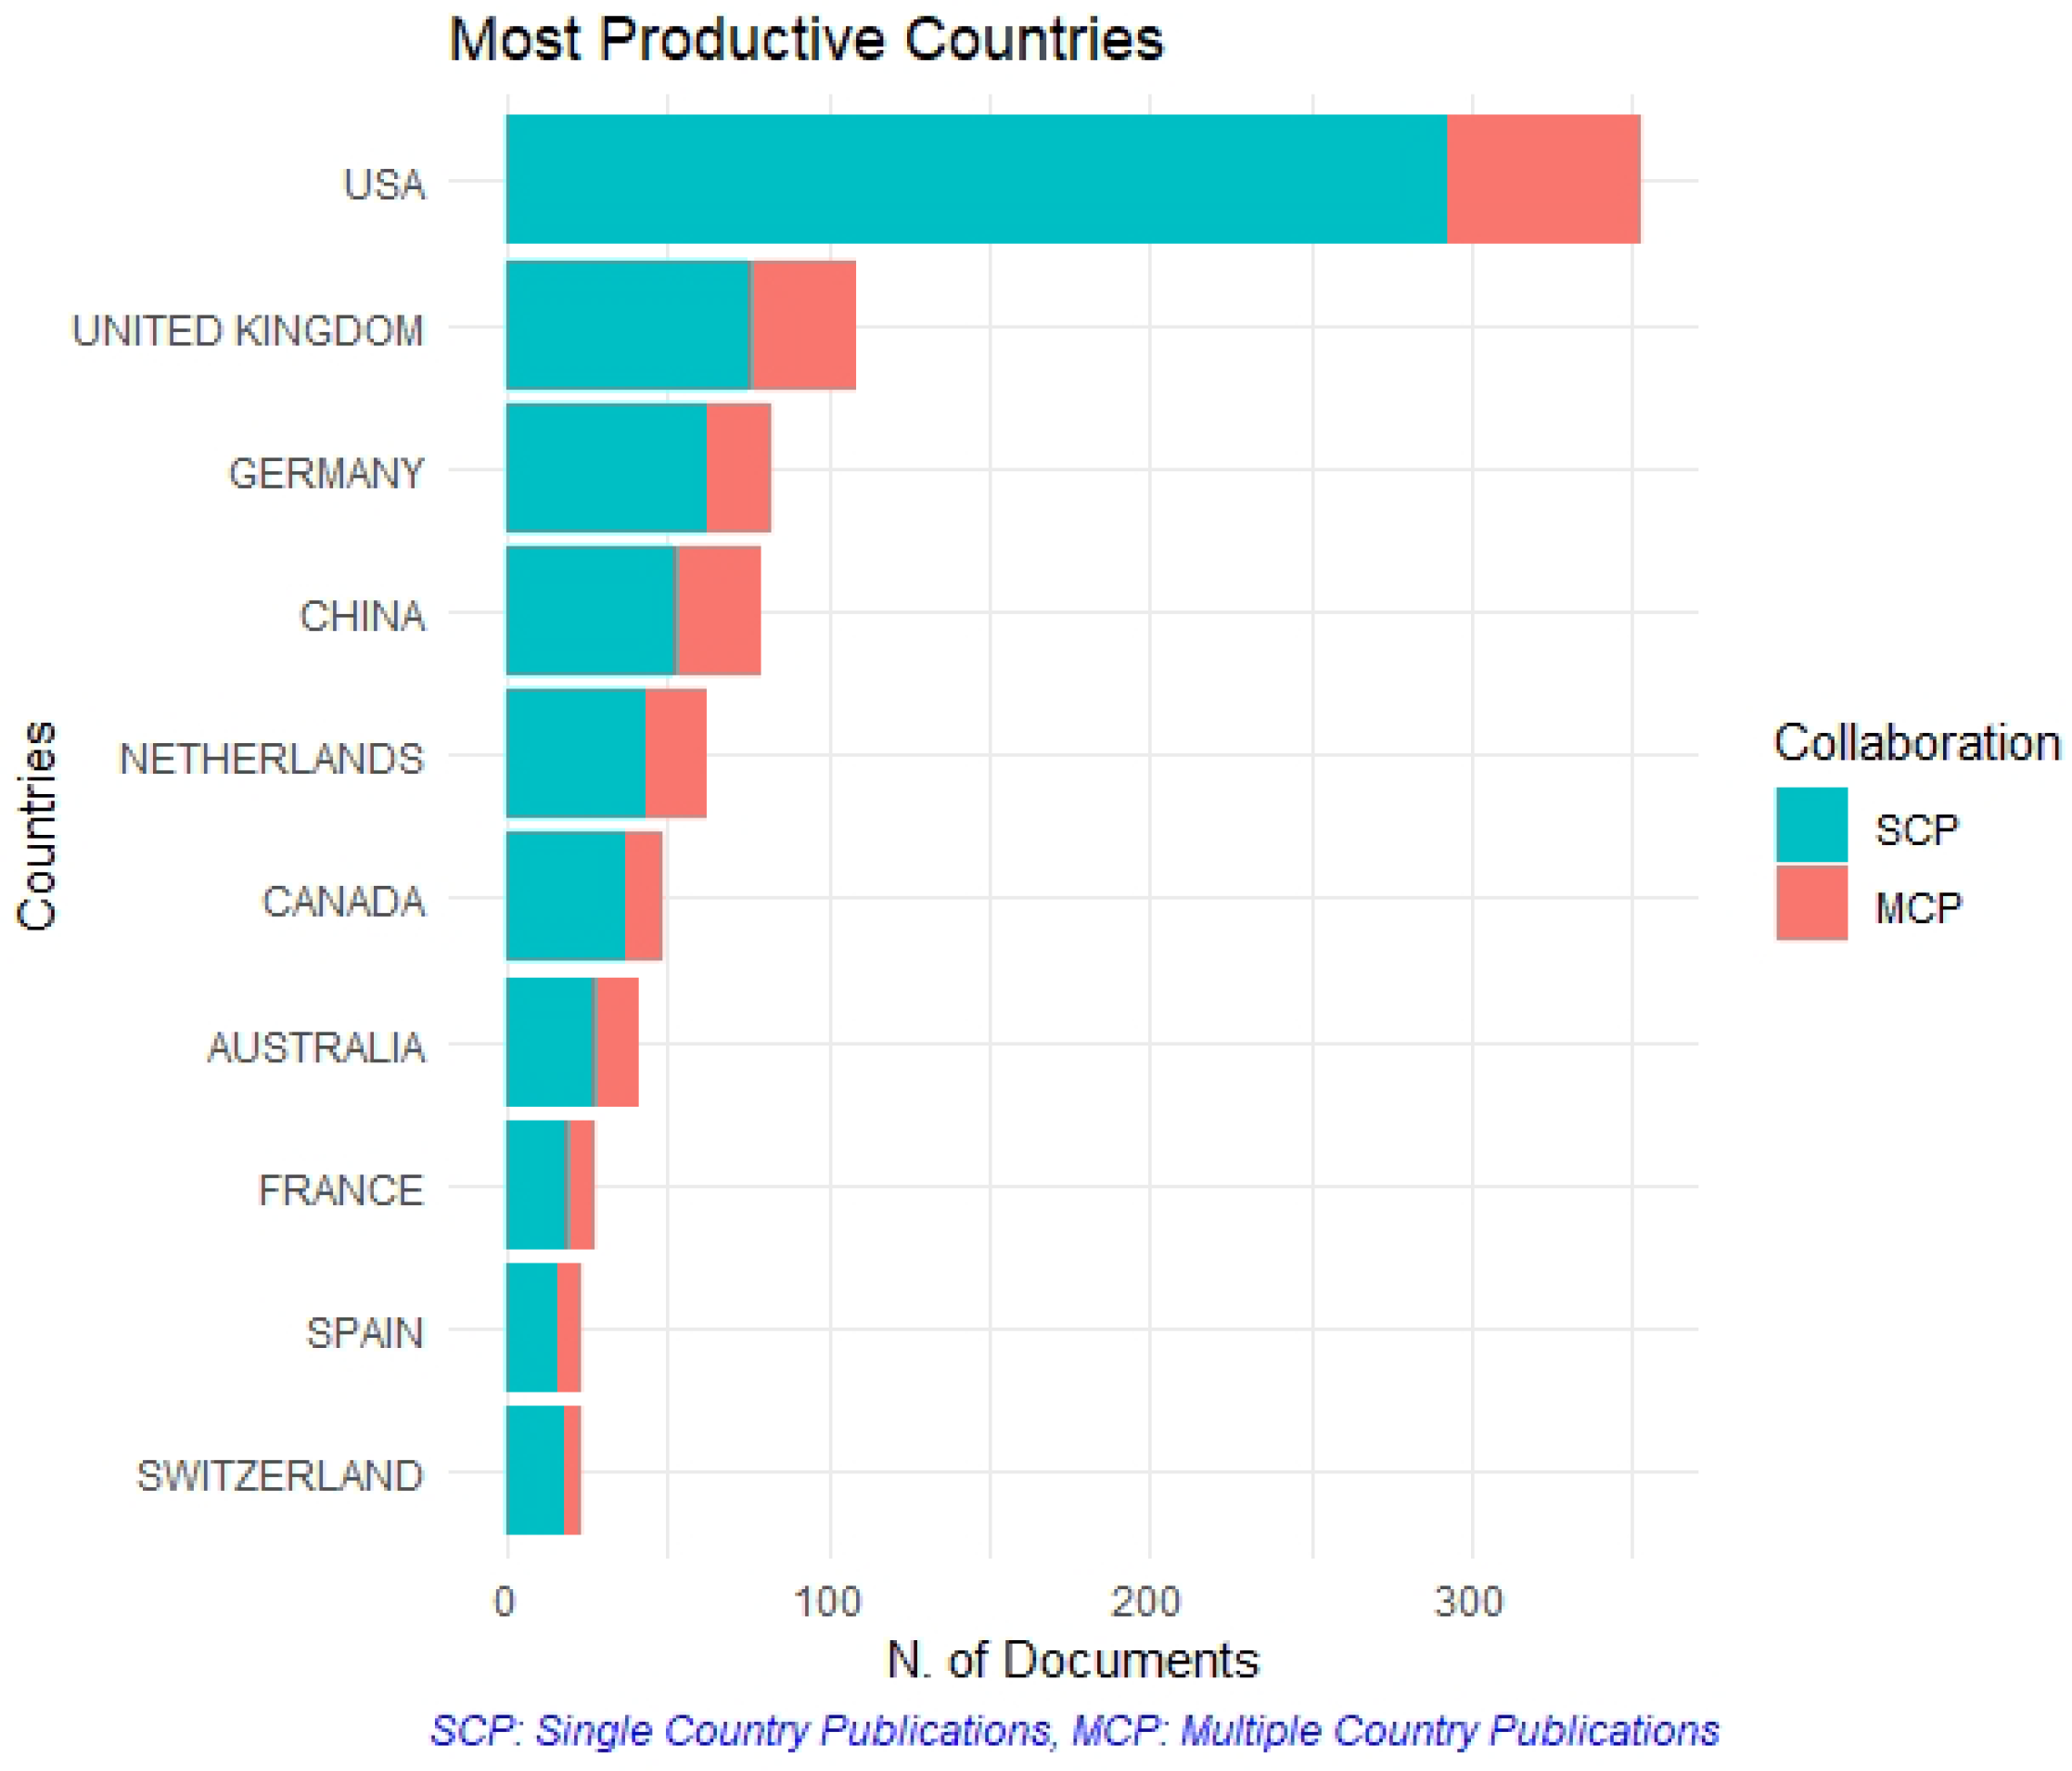
Countries such as the United States have played a critical role in the field’s continuous progress. The authors are working with researchers from the same country as well as from other ones. The top nations and authors working on the issue of agent-based modelling in economics are shown in
Figure 2. According to the findings, American researchers are putting a greater emphasis on this modelling technique and examining its possibilities for solving difficult challenges. Researchers prefer to collaborate with researchers from their own nation rather than researchers from other countries, according to stacked bar charts.
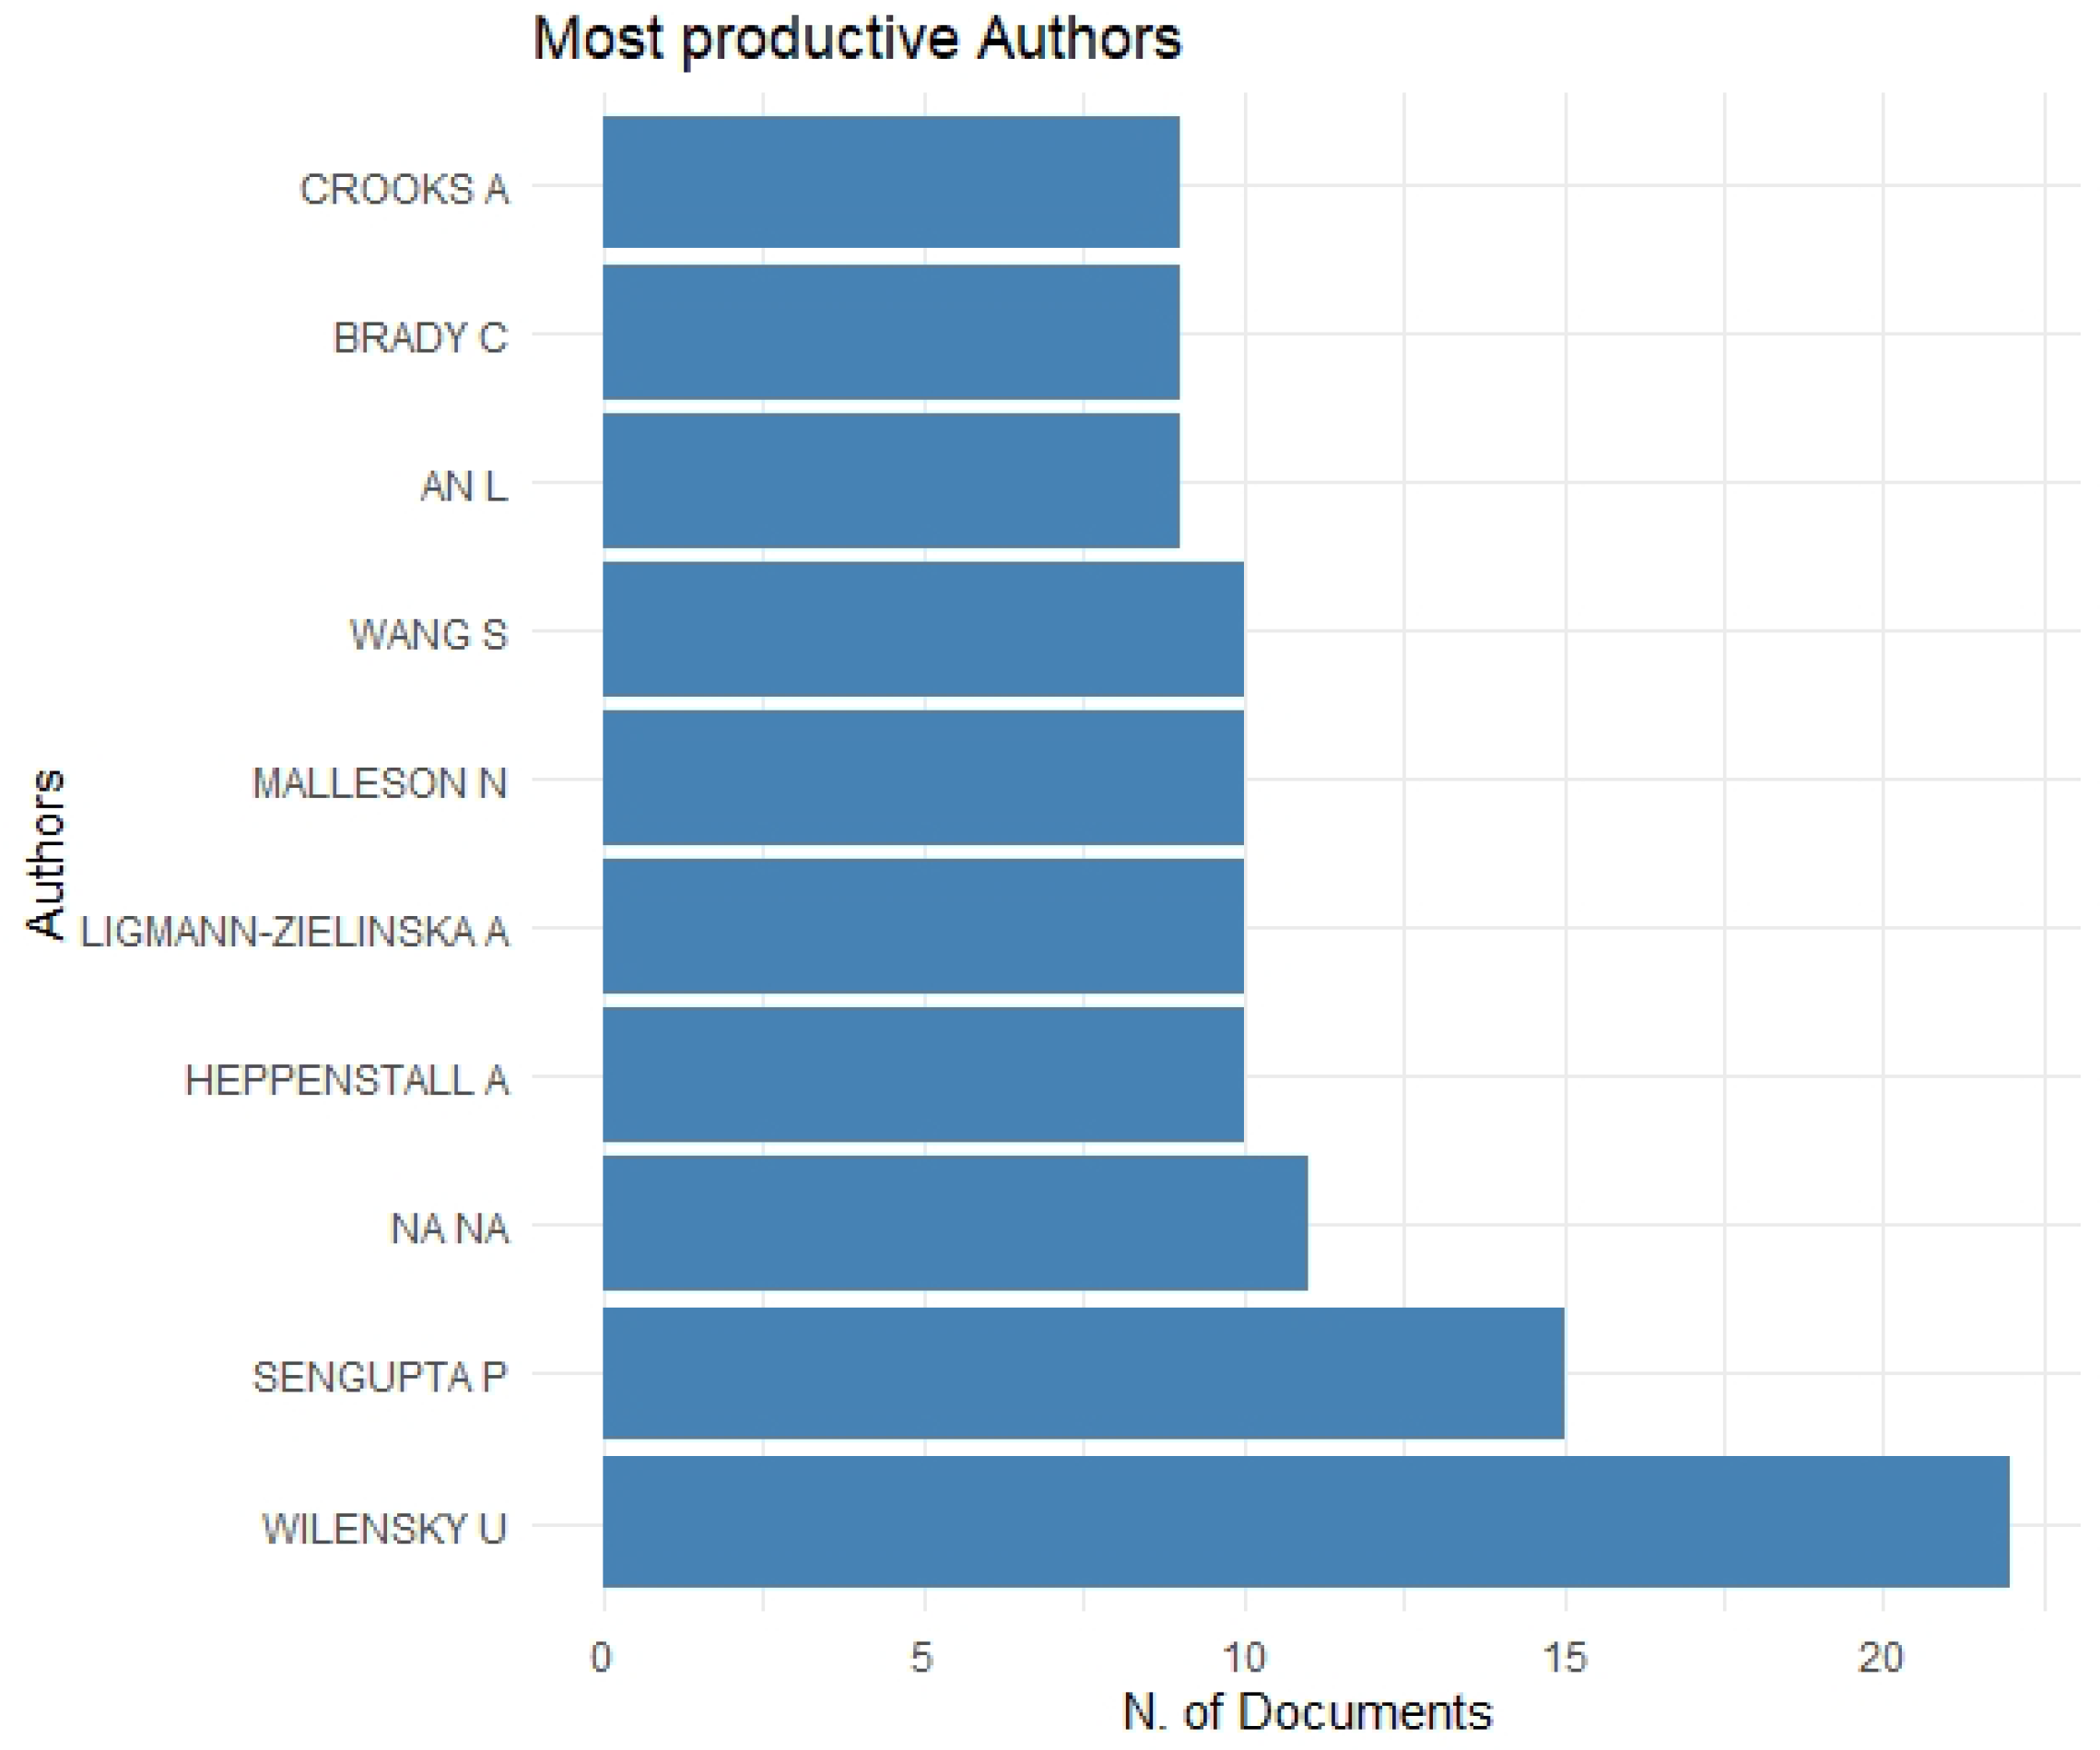
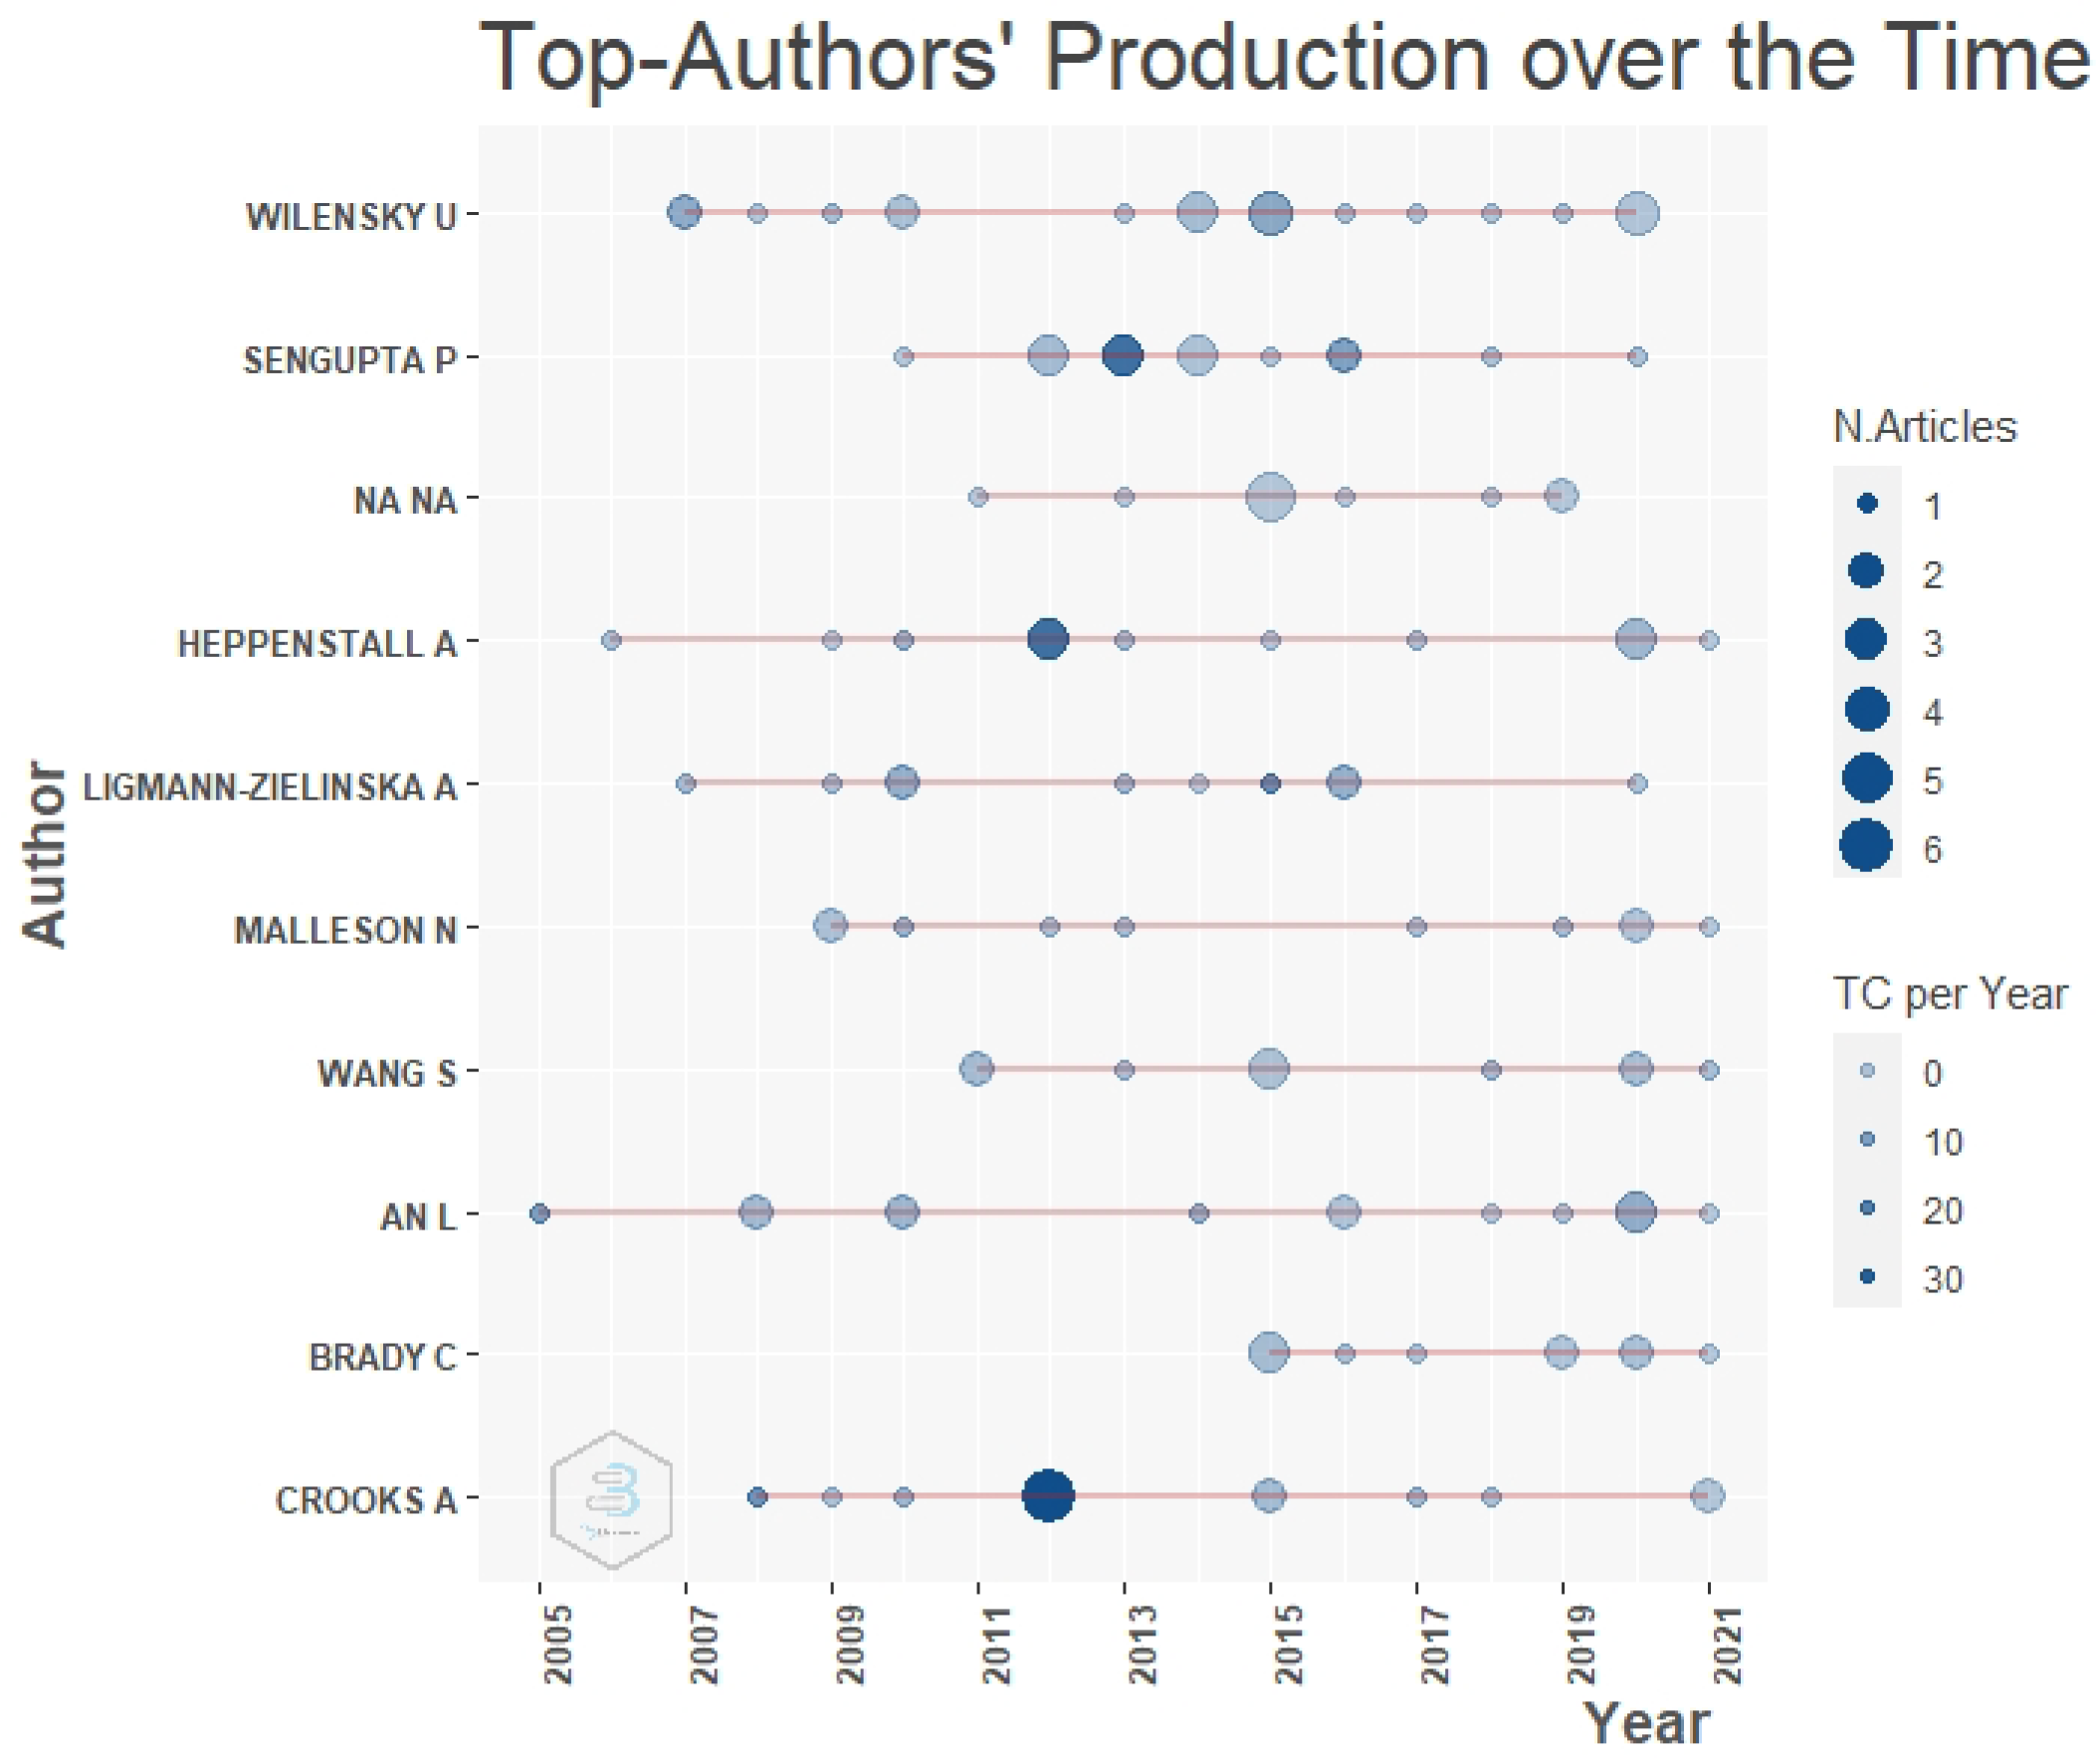
Wilensky, being the most active contributor, also described how to use agent-based simulations to answer complex questions. His writings capture the thrill of re-creating social phenomena in computer simulations to better understand them (
Wilensky and Rand 2015) (See
Figure 3). In
Figure 4, we can see that in which year the authors were most productive and long lived. There are authors from economics who were working on agent-based modelling before the financial crisis took place. But the focus of their research was not directed to answer the policy questions to overcome the aftershocks of crisis.
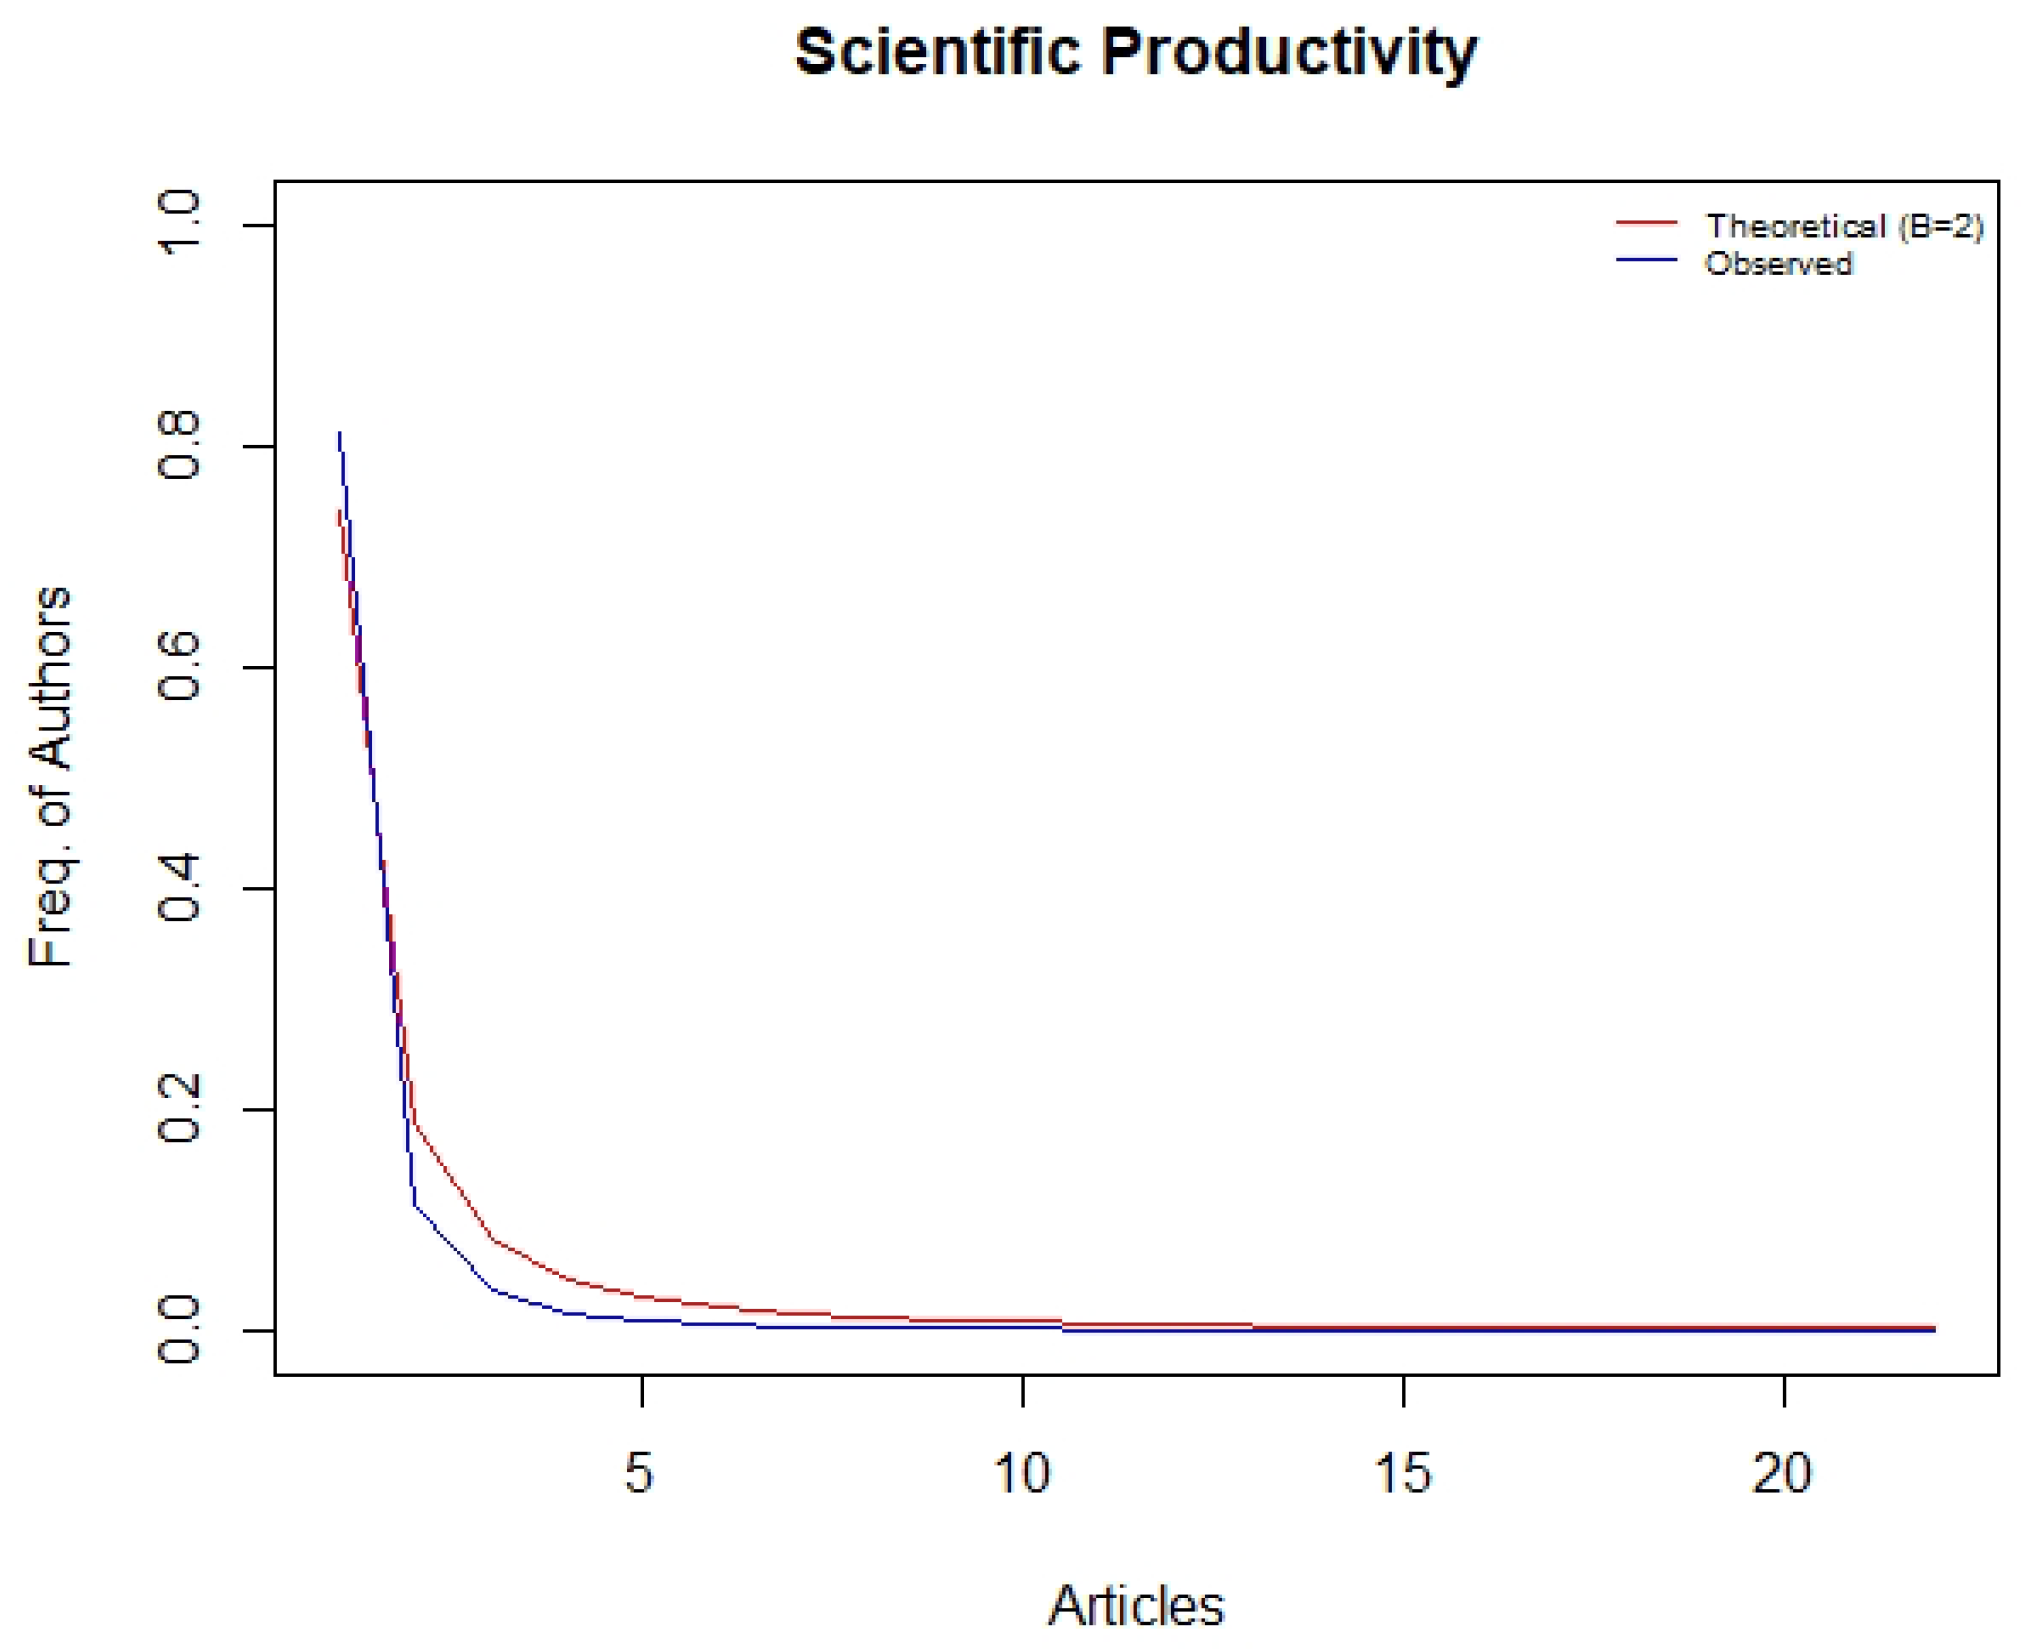
Lotka’s Law is one of the most fundamental bibliometric rules, and it deals with the frequency with which authors in a specific subject publish. The frequency of publishing by authors in a specific field is described by Lotka’s law, presented as follows:
where
f(
x) is the frequency of authors having
x publications, and
x is the positive integer, representing number of publications. The parameter estimates of Lotka’s Law are
and
. According to the findings, there are 2833 writers with a single ABM publication in economics. There are approximately 70 authors with at least five published works. Over 20 documents were released by only one contributor. Theoretical and observed frequency are depicted graphically in
Figure 5.
A journal’s impact on a specific study topic can be measured by its publications. It can be seen from
Table 1 regarding ABM research in economics, Journal of Artificial Societies and Social Simulations (JASSS) is head and shoulders above in the league table. JASSS has the highest number of publications on the theme of agent-based modelling in Scopus index journals followed by Computer environment and urban system on the league table.
The sum of published documents on ABM in the top five journals is around 450 in ten years.
The value of dominance factor indicates collaboration in the field. A value less than 0.5, reflects a good sign for collaboration. Authors who have published nine or more publications on the theme of agent-based modelling are selected and their dominance factor is calculated by using the above formula. Sengupta and Wilensky are top authors with respect to publication number, i.e., 15 and 22, but they rank 6th and 10th, respectively. If the authors’ dominance factor values are less than 0.5, this is a good sign of collaboration.
5.2. Importance Assessment
Table 3 is about author level metrics based on three indices.
H-index measures the productivity as well as the impact of publication. The H-index is calculated as “author has H publications, and each publication has H or more citations”. Whereas
g-index is one variant of H-index which gives credits for highly cited authors in the data set. (
Hirsch 2005), its inventor says: highly cited papers play a key role in the determination of H-index. The selected paper for the top h category are then dropped for the further determination of the H-index over time. This means that the H-index of the subsequent years are not influenced by the papers of the top category, even if the number of citations increases over time. Value of g-index is always either equal to or greater than H-index.
The
m-index is another form of H-index. The M index in the
Table 3 shows the comparison of authors within the field of agent-based modelling but with very different career lengths. The h-index is constrained by the fact that it is time-based and field-specific, and it ignores highly cited works. In the early identification of young researchers, bibliometrics that account for time, such as the m-index, should be evaluated, ideally in conjunction with critical peer review. The m-index has the most potential for identifying early-stage high-potential researchers. An m-index of 1 is normal, 1–2 is above average, and >2 is exceptional, according to a suggested rule of thumb for interpreting the index (
Ndwandwe et al. 2021).
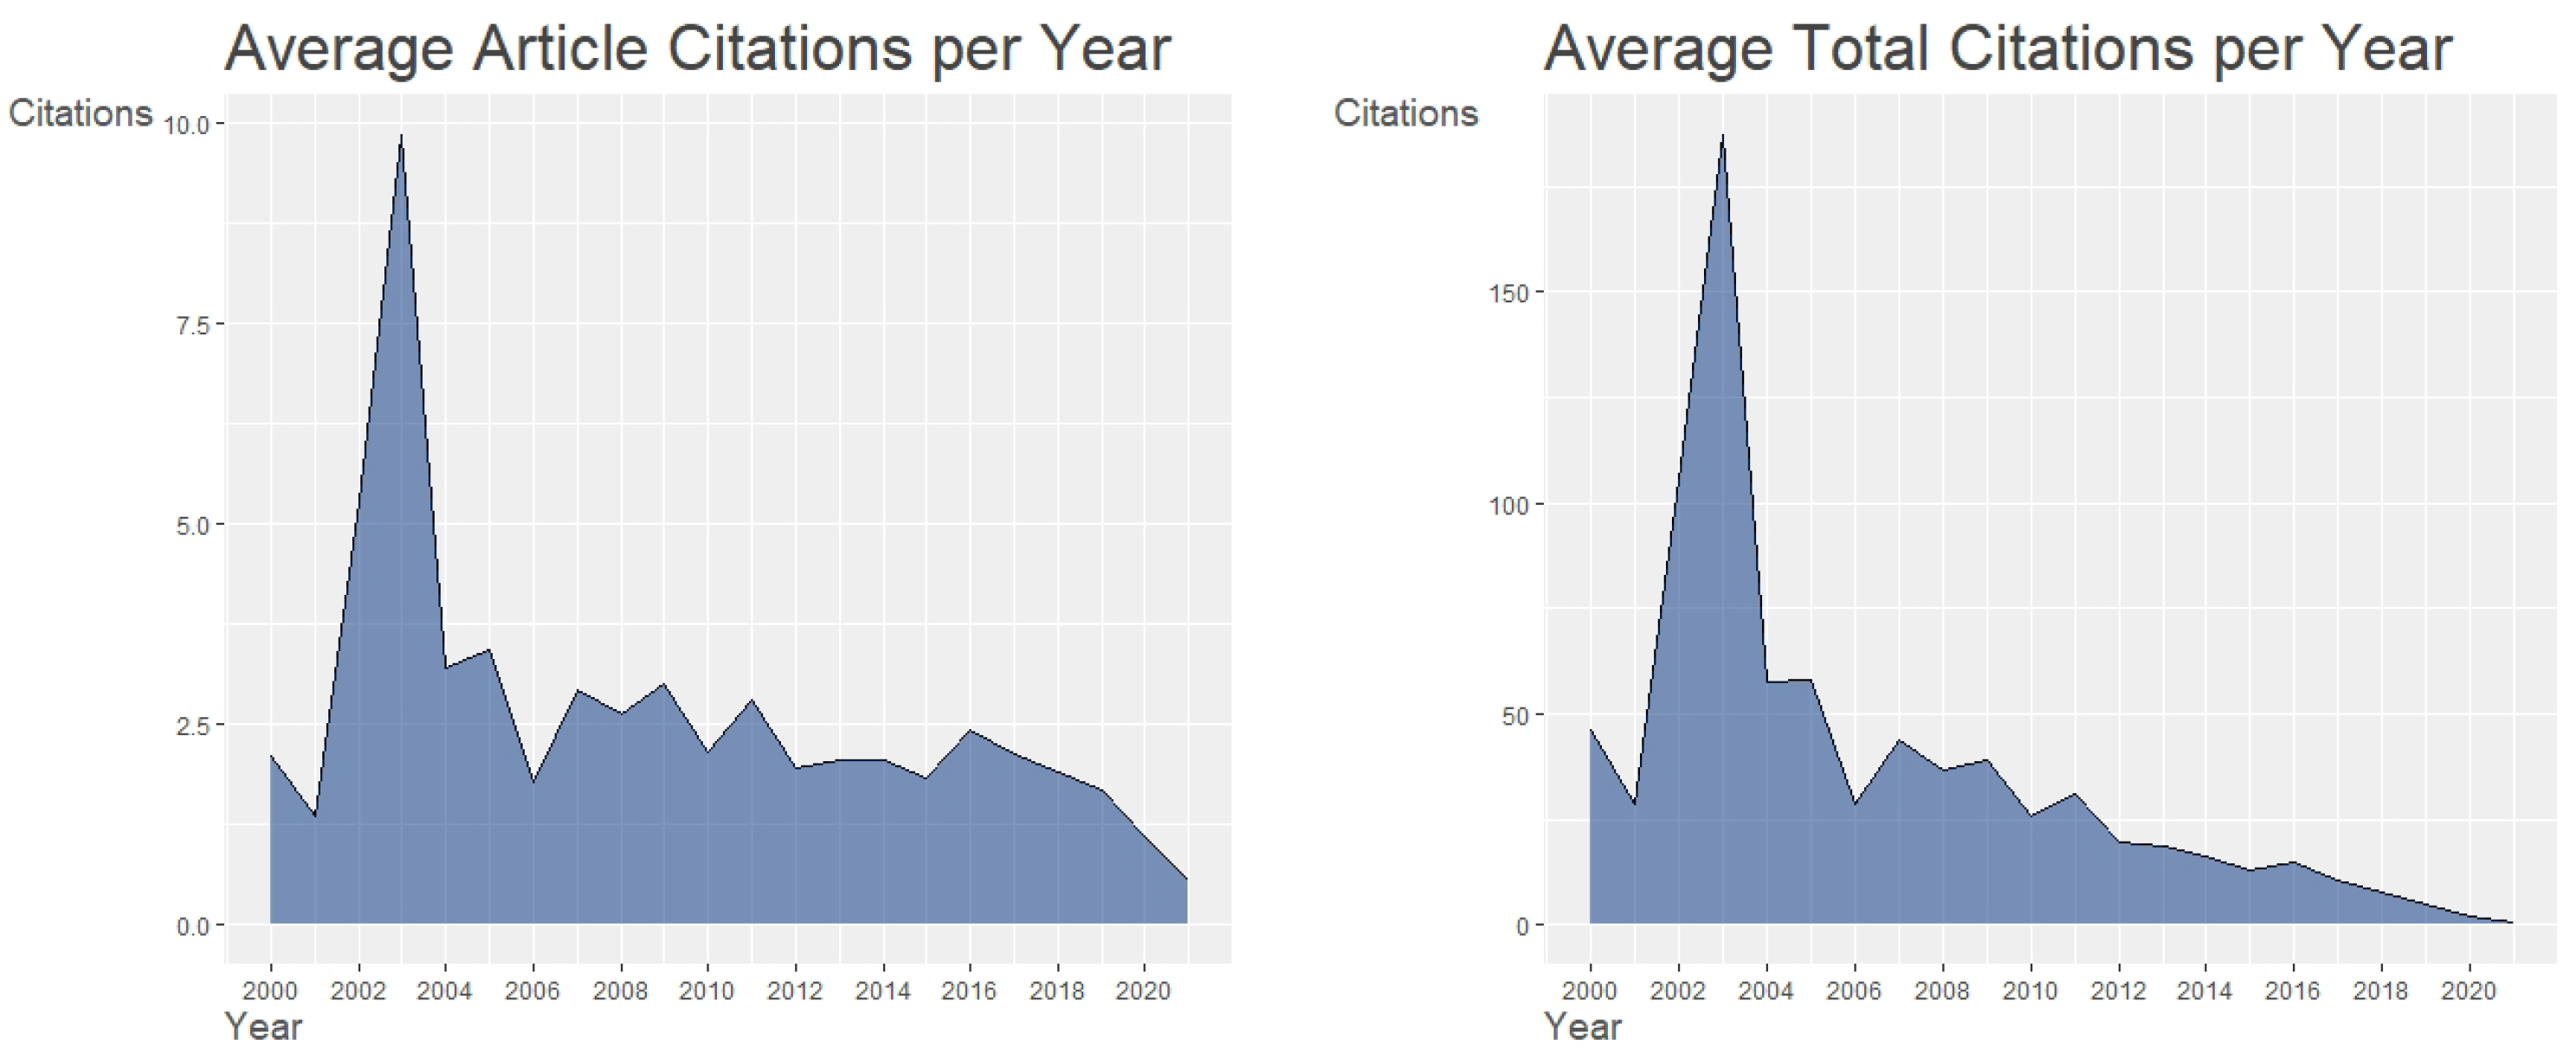
We attempted to plot average citations and average total citations (see
Figure 6) over time in order to study the most cited literature on the application of ABM in economics. We can readily see that total citations were much higher for work published prior to 2008, with a downward trend after that. On the other side, due to the pandemic, average citations climbed in 2020.
5.3. Network Analysis
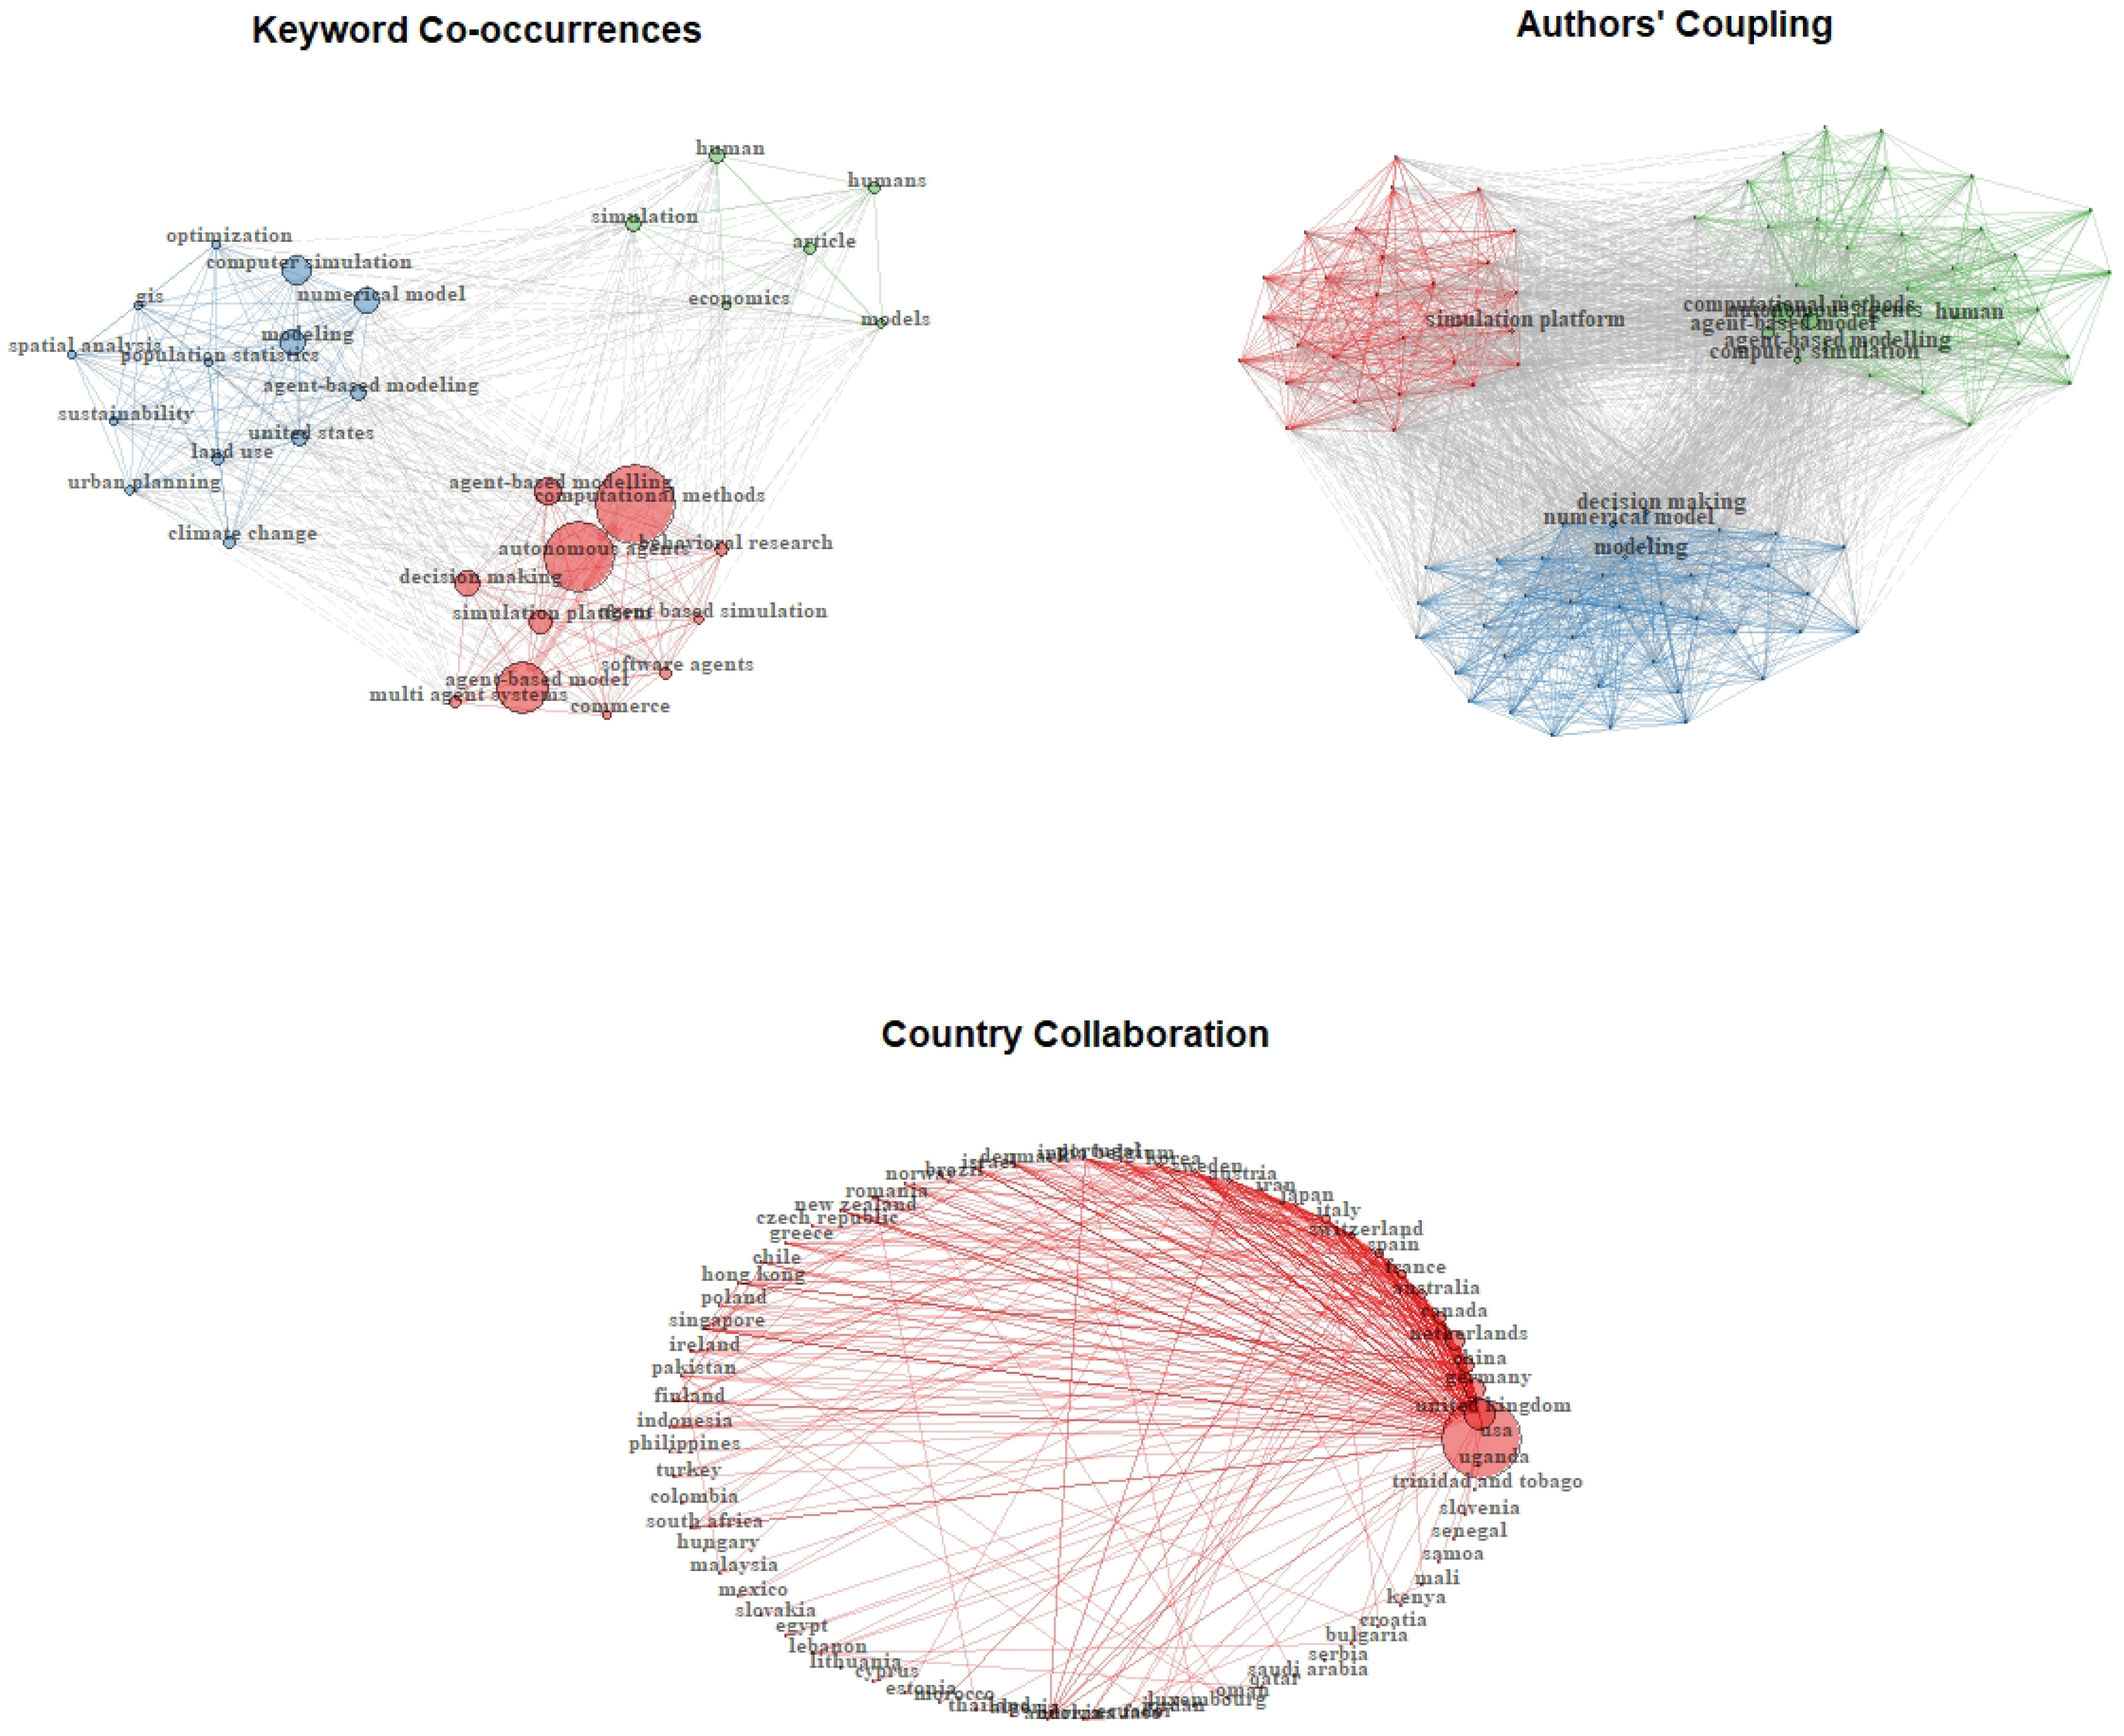
Figure 7 shows the social network maps of the co-occurance matrix, collaboration matrix and coupling.The size of the nodes reflects the frequency of keywords in each cluster. A larger size suggests a stronger citation burst and suggests high significance of the subfield. The conceptual structure captured through keyword co-occurrence indicates diversity within the research sub-fields.
The network indicates three clusters in Keyword Co-occurrence and Author’s Coupling. Each cluster represents a theme/field of study in economics research using ABM. Three major themes emerge from the Keyword Co-occurrence network: human behavioral research, climate change and urban development, and the development of agent-based models that may be used to investigate various economic phenomena. The citing authors in the topic area that are mapped are known as author coupling, and these maps can be used to focus on research areas that are shared by many currently active authors. These are split into three groups in this instance. One of the primary cluster authors shares simulation platforms, while the other two work on computational simulations and numerical models together.
The expansion of international collaboration in ABM research was placed in a highly stratified way, resulting in a clear divide between the main contributing countries and many others who collaborated globally on a more occasional basis. The network is made up of a core that is dominated by research outputs from scholars in research-intensive countries, with numerous additional countries gravitating around that core—unsurprisingly, given the emphasis on English-language journals.
5.4. Research HotSpots
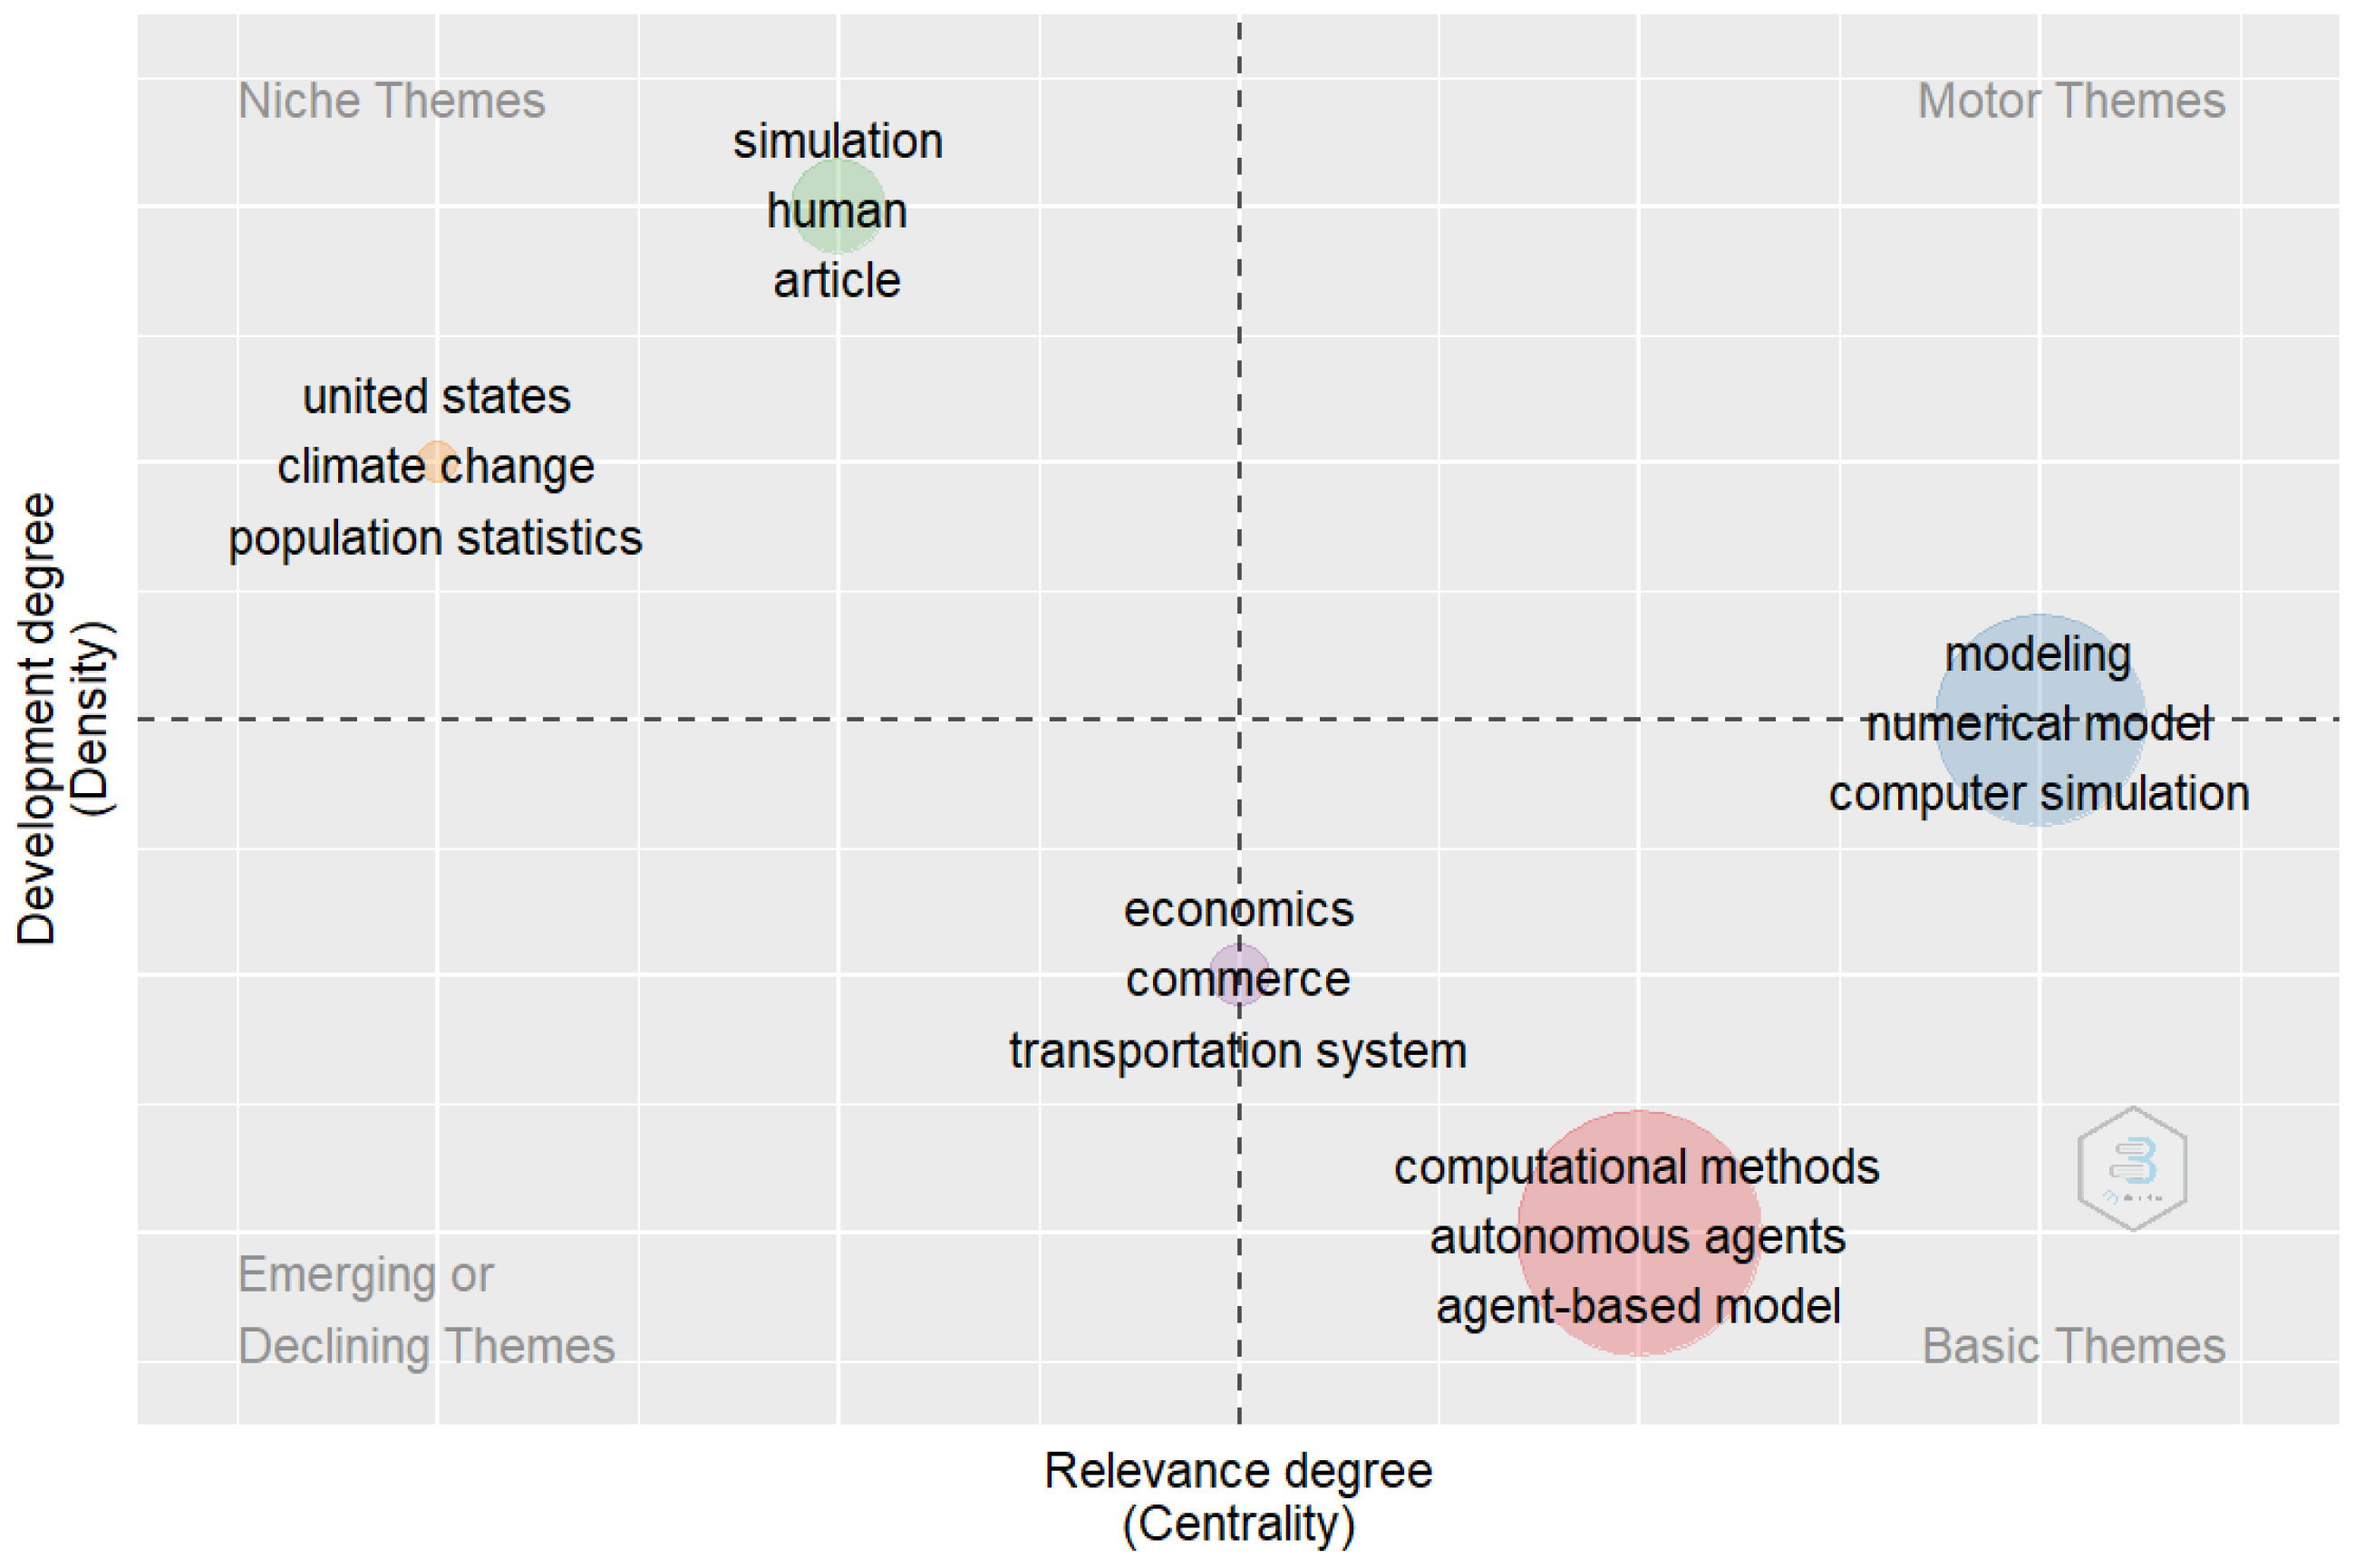
Conceptual structure of agent-based modelling in economics is shown in a thematic map (
Figure 8). The map was constructed by using keywords with min word frequency of 250. Minimum cluster frequency per 1000 documents is 5 and number of labels to each cluster are 3. On the x-axis we have centrality, which measures degree of interaction of one network with other networks, while density on the y-axis is measure of internal strength of a network. Themes on the upper right quadrant, i.e., motor themes have well developed internal ties and are important for the structure of the research field. Motor skills have strong centrality and high density. Niche themes are of marginal importance in the research field as they have well developed internal ties but unimportant external ties. Emerging or disappearing themes with low density and low centrality are weakly developed and marginal. Whereas basic themes are of high importance for the field of ABM in economics, but these are not well developed.
We discovered that research on agent-based modelling in economics can be classified in two ways, the first being the development of an agent-based model, and the second being the use of a developed agent-based model to investigate policy possibilities, based on Keyword Co-occurance analysis. The development of agent-based models employing economic theories, the application of diverse computational methods to calibrate these models, and the simulation of these models are all major topics in ABM currently. Although the largest bubble incorporates numerical models, computer simulations, and computational methods, these motor themes and basic themes both require a significant amount of research to get to a good measure of density and centrality.
6. Research Frontiers
There are several intriguing options for agent-based modelling research. ABM’s versatility in applying to new issues has always been one of its best attributes. While certain classes of models have been established in fields like macroeconomics or financial markets, ABM has always been a transdisciplinary methodology that can be applied to problems involving a variety of rules, interactions, and behavioral phenomena (
Steinbacher et al. 2021). ABMs can also be used to investigate issues that arise due to greater AI use, such as the societal impact of ranking algorithms and recommender systems and the potential reinforcement of social inequities and biases. ABMs can be used to build priors for machine learning algorithms in a semi-supervised manner in cases where the given data are noisy or biassed, reducing errors and preventing the amplification of distortions. Artificial agents can also be incorporated into large-scale simulators once they have been built based on the behavior of human subjects (
Dosi et al. 2020). Such synergy between ABM and experimental technique is still in its infancy, but it represents an exciting avenue for future research, in our opinion. Further research on the estimation of ABMs is also required, as little is known about the benefits and drawbacks of various techniques. The majority of current models allow for the formulation and stochastic approximation of a likelihood function. As models become more complicated, such approximations will become increasingly difficult. In such instances, Approximation through Bayesian Computation methods and GMM/SMM should be considered (ABC). This approach (
Sisson et al. 2007;
Toni et al. 2009) employs measurements (moments) of the data other than the likelihood to approximate the posterior distribution of the parameters using a rejection sampling or Markov Chain Monte Carlo technique. While this approach has gained much traction in ecological ABMs (
Csilléry et al. 2010), economic applications are still a work in progress.
7. Conclusions
During the 2008 financial crisis, the discussion began when economists began to investigate the possibility of agent-based modelling techniques for answering policy problems and performing “what-if” scenarios to aid policy decisions. This discussion about the future of agent-based modelling has yielded the desired result, with researchers currently working on developing agent-based models so that simulations based on simple rules can portray the complex economy. The European Central Bank is funding projects to construct agent-based economic models. The science of economics has long been in need of more robust methodologies that do not assume reasonable expectations and do not encourage optimism about the behaviours of agents. The economy appears to be a system, yet individual decisions cause the system’s complex nonlinearity. Similarly, agent-based models recognise individual interactions and adapt in response to them.
The objective of the review analysis was to investigate the current developments in economics using this new modelling technique. According to the study’s findings, research on the topic of agent-based modelling in economics is growing at a quick pace. Researchers experiment and publish their findings in research papers, books, and conference papers. Researchers are increasingly collaborating in order to improve the quality of their publications. The United States of America (USA), the United Kingdom (UK), Germany, and China are the most productive countries. The most prominent research on this topic has been published in the United States of America (USA), and American-based journals have taken the lead in publishing research in this field. This might be due to the increased formation trend of academic journals in the USA. The most often used keywords by the researchers (e.g., decision making, sustainability, and commerce) indicate the hotspots in ABM research. The main purpose of adopting different bibliometric analysis methodologies was to uncover research trends and the substance of published work. The knowledge structure and research trends were discovered through co-occurrence analysis. According to the findings, several well-established economic themes benefit from ABM techniques, but many require them. Researchers are not introducing central banks in an agent-based economy and conducting more monetary policy experiments. However, monetary policy had a considerable impact during and after the Great Recession. The channels of collaboration among scholars worldwide were uncovered through social network analysis. In the field of agent-based modelling, researchers promote cross-national and intra-national collaboration, which fosters the creation of new ideas. Although there has been much research into using agent-based modelling to comprehend the complexities of economic problems, underdeveloped countries like Pakistan have been slow to adopt this modelling technique. Even after a decade of economic disaster, economists discover agent-based modelling. This policy decision modelling technique is not widely used in economics, especially in monetary policy issues. Agent-based models, in addition to existing ones, could be critical instruments for assessing economic policy.


