1. Introduction
A growing number of “place-based” policies are implemented in geographically targeted areas to improve economic performances
Neumark and Simpson (
2015). For instance, Enterprise Zone programs in the US and some European countries, and Special Economic Zone programs in developing countries. Such policies are thrown into doubt as to whether they are simply a form of reallocating resources for arbitrage benefits
Glaeser and Gottlieb (
2008);
Greenstone and Looney (
2010). On the other hand, some literature supports implementing the policies and provides rationales for them
Kline and Moretti (
2014).
The question arises whether the rationales of the policies in developed countries such as knowledge spillovers still hold for developing countries. Knowledge spillovers are expected to produce positive effects on the local economy, more specifically, bringing additional people who have more skills can improve the other’s productivity through sharing of knowledge and faster technology adoption
Moretti (
2011). Knowledge spillovers from additional human capital in targeted areas are crucial for policy-makers to understand the efficiency of the policies, especially for developing countries that have constraint resources to allocate.
Among developing countries, this paper focuses on place-based policies in the China–Special Economic Zone (SEZ) program. SEZ programs are usually intended to increase investments, and export earnings and government revenues. The objective of SEZs in China includes generating demonstration effects and improving regional productivity. China has been implementing SEZ programs as a vital part of Chinese economic reforms since 1978. In recent decades, the government has cost a huge amount of money and allocated millions of acres to set up SEZs for regional developments. Empirical literature finds that implementing the policies has positive impacts for the firms located within SEZs or the cities hosting the SEZ program
Wang (
2013);
Zheng et al. (
2017). However, few attempts were made to study the extent of geography diffusion of the impacts, assuming that the spillovers of SEZs are only limited to their considered regions.
The relation of knowledge spillovers and regional growth is investigated in a geographical dimension
Döring and Schnellenbach (
2006). A common mechanism for a transfer of knowledge is the mobility of individuals and the trade of goods, which carry production-related knowledge with them
Matusik and Hill (
1998), and notably, would also allow a spilling over of embodied knowledge. Human capital refers to an employee’s skills, education, and other implied values, which is one of the parts of knowledge spillovers. Hereafter, the impacts of human capital are defined as human capital spillovers.
Human capital spillovers are regarded as catalysts for the development of a city
Lucas (
1988). More generally, the human capital of others in close proximity can raise everyone’s human capital and increase firm productivity through sharing of knowledge and faster adoption of innovations
Moretti (
2011). Lots of literature measures human capital by the educational level, such as the share of workers with a college degree or comparable education, because positive spillovers are more likely to diffuse from more highly educated workers, due to the knowledge they possess and perhaps the work they do. Human capital spillovers do not only occur within one particular region, but also transfer to neighboring ones
Fischer et al. (
2009);
López-Bazo et al. (
2004).
Ramos et al. (
2010) investigate the effects of human capital spillovers on regional productivity and growth, not only for the considered region, but also for the neighboring ones.
Baltagi et al. (
2016) estimate firm-level productivity spillovers in China’s chemical industry considering the neighbor’s skilled labor ratio.
In China, the firms in SEZs are encouraged to make connections with local firms. With support from human capital of SEZs, local firms update the information on markets and have faster adoption of new technology. In this way, human capital of SEZs may have positive impacts on the local economy. The human capital of SEZs is not equal, however. In this paper, we assume that positive impacts are more likely to diffuse from highly educated workers. In addition, we suppose that the impacts of human capital may not occur within one particular region, but also transfer to neighboring ones. In the context of the SEZ program, we need to consider spillover effects beyond the targeted zones. Some literature evaluates the impacts of place-based policies in the further scope
Rosenthal and Strange (
2008);
Zheng et al. (
2017). As a development policy widely accepted in many countries, the externalities from targeted zones to the local economy should also be included for policy-makers to do a cost-benefit analysis. Corresponding preferential policies such as tax deduction and subsidy are provided by the government to attract skilled labor in order to stimulate regional growth. However, one may be concerned that entrants of targeted zones that have higher human capital put local firms at disadvantage. They may poach away locally trained talent and crowd out firms outside the zones in the same industry.
This study aims to address two important questions on human capital spillovers from SEZs to the local economy. First, does the human capital of SEZs diffuse positive externalities to the same region? Second, will the human capital of SEZs benefit neighboring regions? Only considering the regions that host the SEZ program may overestimate the magnitude of the externalities of SEZs. Bringing additional skilled labor to SEZs is suspected to be simply a form of reallocating resources to another location. On the contrary, attracting firms that have relatively higher human capital is likely to spill over knowledge or advanced technology to stimulate the productivity of local industries.
This paper builds on the research estimating the human capital spillovers at the regional level. In many studies, they set the human capital of a county as an explanatory variable and reveal the existence of human capital externalities
López-Bazo et al. (
2004);
Ramos et al. (
2010). To evaluate the spillovers of SEZs to the local economy, we set the human capital of the firms within SEZs as an explanatory variable. In addition, we focus on the human capital spillovers in the same industry rather than across all the industries, supposing that the observation in proximity has high similarity in the same industry.
This paper builds on the spatial econometric literature, which allows us to examine spillovers in three channels
Elhorst (
2014);
LeSage and Pace (
2009). Specifically, an increase in the human capital of a SEZ is likely to affect its own region (direct effect) and may affect the neighboring regions (indirect effect). Moreover, spatial regression can measure impacts passing through the neighboring regions and back to the region itself (feedback loops). These effects seek to investigate both intra- and inter-regional effects of human capital spillovers on regional productivity. In the context of the SEZ program, it should be examined that whether the externalities arising from a SEZ have impacts on the geographical proximal regions. However, to the best of the author’s knowledge, existing literature focuses on the impacts of SEZs in an intra-region dimension that SEZs exert influences on the hosting regions in China. To fill this gap, the paper adds to the existing literature by considering spatial proximity. Both intra- and inter-regional examinations are necessary for policymakers to revise the cost-benefit analysis of the SEZ program.
In this paper, we answer the question of whether the externalities of human capital in SEZs are able to raise local productivity. From the empirical results, we conclude that the human capital of SEZs contributes to diffusing knowledge and thus improving productivity in the same region. In addition, this paper further addresses whether the spillover effects of SEZs can benefit neighboring regions in spatial proximity as well. The positive spillovers to wider geographic scope imply that the rising proportion of college-educated workers in SEZs does not harm the firms in the proximity, instead, the driving effect of human capital to facilitate local firms to improve productivity is evident.
The rest of this paper is organized as follows.
Section 2 presents related literature that mainly focuses on place-based policies in developing countries.
Section 3 introduces the background of the SEZ program released in China.
Section 4 describes the data.
Section 5 and
Section 6 present estimation models and empirical results. The conclusion is summarized in the last section.
2. Related Literature
Place-based policies in developed countries differ from those in developing countries on both policy goals and implement measures. To contrast empirical evidence for similar types, this paper directly relates to place-based policies operated in developing countries.
In developing countries, implementing place-based policies is a way to stimulate the local economy, as well as to promote development within the zones.
Johansson and Nilsson (
1997) find that SEZs have positive effects on exports in Hong Kong, Malaysia, Singapore, and Sri Lanka. In particular, they highlight the performances of SEZs in Malaysia for attracting foreign investors who transfer knowledge to local markets.
Wang (
2013) and
Alder et al. (
2016) find that SEZs exert positive influences on the local economy with respect to employment, export, and foreign direct investment in China. Since using macro-level data, they evaluate the influences on the whole SEZ-operating counties, do not separate firms in zones with those outside zones in a county.
Zheng et al. (
2017) and
Lu et al. (
2019) distinguish firms located within SEZs and those outside zones by using geocoded firm-level data.
Zheng et al. (
2017) find that in several major cities of China SEZs have positive spillovers with respect to wage, employment, and productivity for non-SEZ firms located nearby SEZs.
Ciżkowicz et al. (
2017) also find that implementing place-based policies creates jobs for the firms outside zones in Poland.
With regards to research methods, existing literature studying place-based policies can be divided into two types. One is literature that summarizes experiences and rationales of implementing place-based policies based on case studies and interviews.
Zeng (
2011) describes experiences in China and discusses keys of success and faced opportunities.
Farole (
2011) introduces experiences in Africa and possible reasons for those outcomes. The other one is literature that employs econometric models to estimate the effects of place-based policies. Many empirical studies evaluate the impacts of place-based policies by a quasi-experimental approach such as the difference-in-difference method (See
Lu et al. (
2019);
Zheng et al. (
2017)). These studies that allow for comparisons of treatment groups and appropriate control groups make valid identification of causal effects. The quasi-experimental approach is broadly applied to investigate the impacts of place-based policies in both developing and developed countries. Except for this kind of approach, spatial econometric models are used to assess the spillover effects of place-based policies by taking into account the geographical proximity of the observations
Ciżkowicz et al. (
2017).
3. Background
This section introduces the background of SEZ programs implemented in China. SEZs are geographically designated areas by the government that aim to stimulate economic growth in their jurisdiction. Generally, the term “SEZ” is a zone that includes some common characteristics such as—it is located in geographically designated areas; it offers benefit to investors within the zone; it has separate customs areas; and it has single administrations
Zeng (
2011).
The SEZ program has been implemented over the last 40 years as a crucial part of Chinese economic reforms since 1978. Before the reforms, China was an isolated socialist state dominated by central planning. Instead of carrying on previous policies, the creation of SEZs in the initial stage was an experiment to test for the market-oriented economy. By 1980, the first four SEZs were approved to set up in Shenzhen, Zhuhai, Shantou, and Xiamen. Since these regions were eastern coastal areas near Hong Kong, Macao, and Taiwan, the designation at that time took into account both economic and political factors. With the success of these regions, an additional 14 coastal regions were designated as SEZs in 1984 to gain further access to foreign markets and investment. The next wave of SEZs in the 1990s gradually began to extend from eastern coastlines towards inland regions, especially after Deng Xiaoping’s southern tour to SEZs in 1992. By 2001, SEZs were established one after another, covering all provinces across China. As of 2006, SEZs number 1,568, occupying 9,949 acres of land in total
Zheng et al. (
2017).
By administrative levels, SEZs are divided into two categories: national-level and provincial-level. The former one is conducted by the central government, and the latter one is directed by the provincial governments. National-level SEZs grant more autonomy and enjoy more privileges than provincial-level SEZs. Only authorized by the central government or the governments that have provincial administrative level are legal SEZs in China. The others that were not approved by the central or provincial governments violated related laws and regulations, and were abolished in 2006.
Although there are some differences between specific privileges of national- and provincial-level, SEZs are all granted market-oriented freedom and offered preferential benefits. The SEZ program is given greater autonomy to adjust related regulations along the basic lines of national ones by removing some constraints within the scope of the zones. Additionally, the government provides a series of preferential policy packages for foreign and domestic investors, which enter the zones as the following
1:
1. In General, the policy deducts corporate income tax rate to 15-24% for firms in SEZs relative to 33% for ordinary domestic firms outside SEZs. Additionally, customs duty is exempted and duty-free allowances of intermediate inputs are offered for the firms located in SEZs.
2. The land is owned by the government and the land use right is strictly regulated in China. Different from many countries, officials can allocate land on a large scale and convert agricultural land for industrial purposes when necessary. Land use rights for industrial purposes are granted for domestic and foreign investors that enter the SEZs. Besides land use rights, land use fees are discounted for entrants relative to the firms outside zones.
3. The state-owned bank loosens lending policies and gives priority to the firms in SEZs to apply for a loan.
4. For potential investors who enter the zones, procedures are simplified and approved for high-speed.
5. The government commits to the investors who enter the zones that all of their private properties are under-protected.
Besides these preferential policies, the government also makes a great effort to improve infrastructures of zones such as roads, ports, electricity, gas, water, telecommunications, and other service facilities. Furthermore, to attract skilled human capital, SEZs offer an extra personal income tax deduction, allowances, and Hukou registration priority benefit to a highly qualified individual
2.
Each SEZ has its administrative committee that performs management functions within its geographical scope. Administrative committees are not under the control of local governments, they are directly controlled by the state or the provincial governments. They direct and administer affairs of SEZs on the behalf of the government such as project approval, local taxation, land management, public facilities planning, financial revenue, personnel, environment protection, and so on. For example, administrative committees take responsibility to attract investors from domestic or abroad that meet the standards of local development. Each administrative committee has the right to decide which investors could enter the zone. They offer a bundle of preferential policies and negotiate with potential entrants for details. After these negotiations, the investors decide whether to enter the zone or not.
4. Data
The main data is firm-level data from the Annual Survey of Industrial Firms (ASIF) conducted by the National Bureau of Statistics of China (NBS). The ASIF data covers all state-owned firms and non-state-owned firms with an annual turnover exceeding five million yuan (approximately
$700,000), and those firms occupy over 90% of the total industrial outputs of China in 2004. The ASIF data contains more than 100 variables, providing information on industrial output, intermediate input, total employment, industry affiliation, and geographic location. Since covering comprehensive variables, the data has been widely used in empirical literature such as
Brandt et al. (
2012).
The ASIF data in 2004 are more comprehensive than other years’ ASIF data. Besides the basic information, the data in 2004 include the level of employee education. To evaluate the spillover effects of human capital, we exclusively use the 2004 data
3. In addition, our paper focuses on manufacturing firms in Yangtze Delta, which is made up of three province-level areas in east-central China: Shanghai City, Jiangsu, and Zhejiang Provinces. Although occupying about 2% of the total land area, Yangtze Delta contributes more than 21% of the GDP in China.
The information of SEZs is from notices of the government. One is “The review of Special Economic Zones in China”, which was published by the National Development and Reform Commission and the Ministry of Land and Resources in 2006. It contains authorized SEZs’ names, approved times, and occupied areas. The other one is “the notice of four directions”, which includes geographic information on SEZs released by the Ministry of Land and Resources of China. It has detail information on the geographic boundary of SEZs, which covers specific villages, roads, or coasts.
The ASIF data does not report any information about SEZs; however, it contains each firm’s address and geographic location code. The geographic location consists of a 12-digit geographic code, which provides location information at the most disaggregated level. It consists of district (or county), jiedao (streets or avenues), and juweihui (communities or villages). Following
Zheng et al. (
2017), each firm’s geographic location code and the exact geographic boundaries of SEZs can be used to identify whether a firm is located in SEZs or not. By comparing geographic location code and boundaries, there are about 15% of the firms located in SEZs.
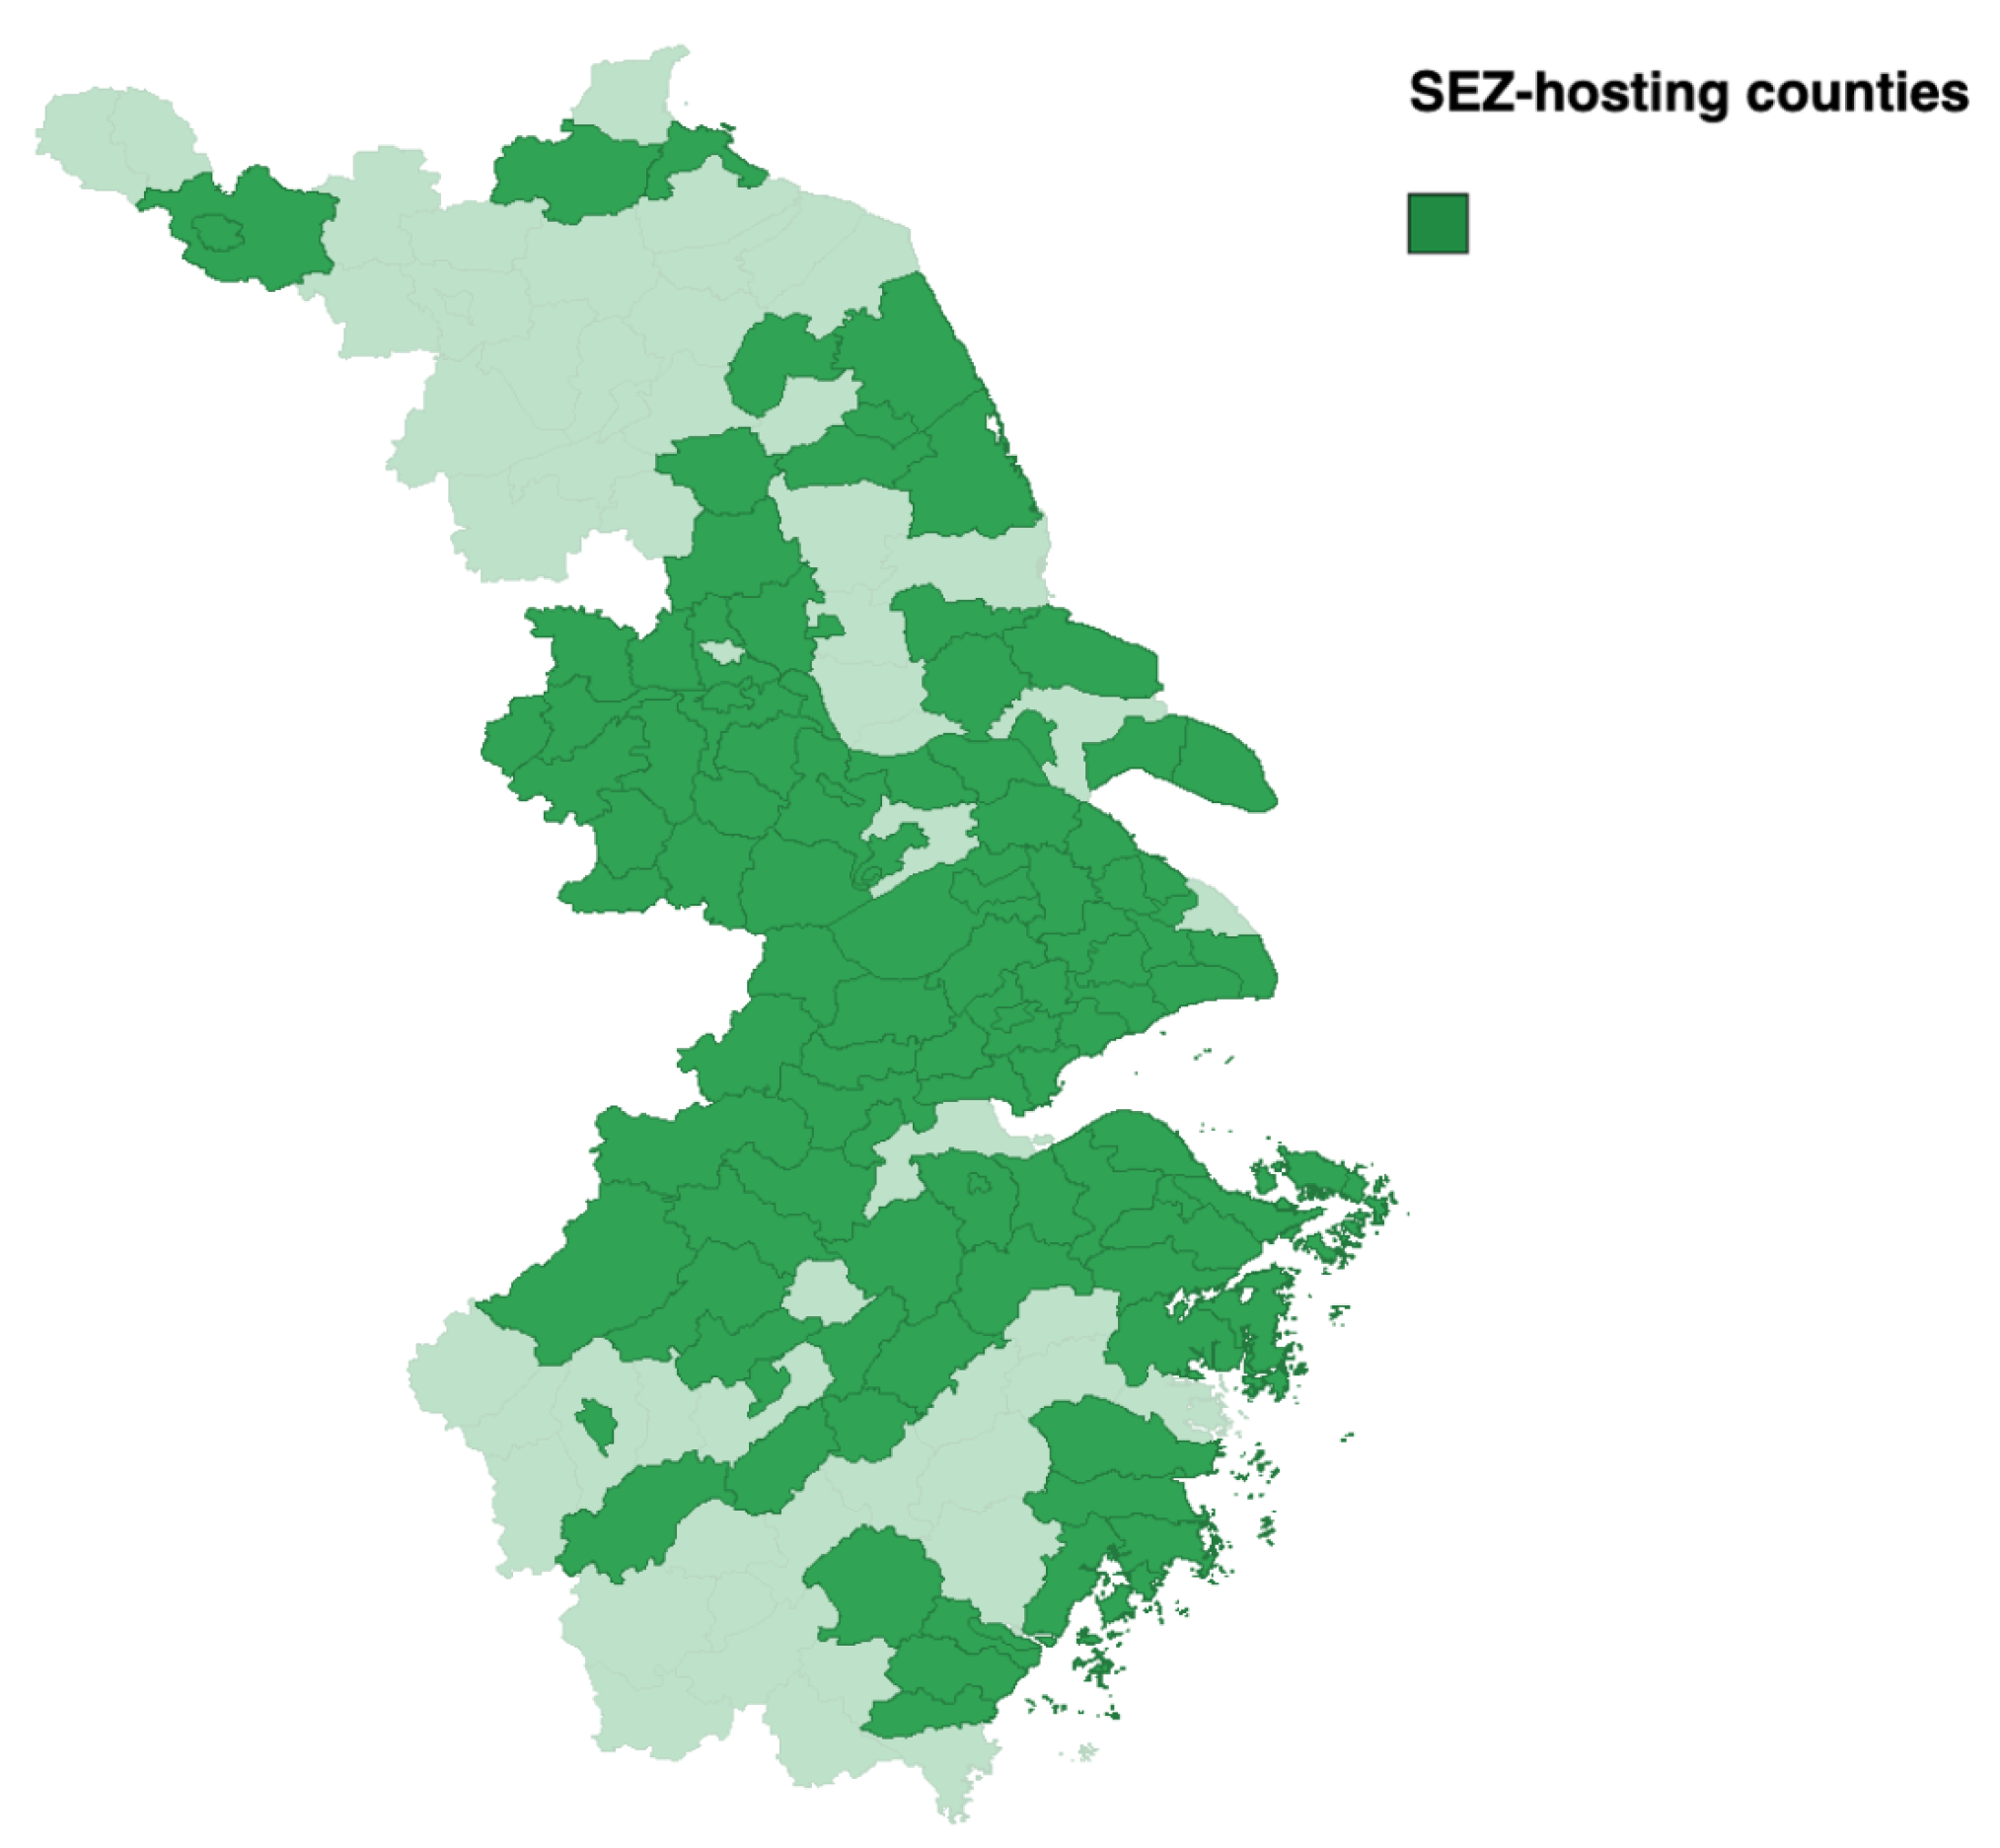
To investigate intra- and inter-regional spillovers from SEZs, we define
region as a county in this paper. In
Figure 1, we present the counties hosting SEZ programs in Yangtze Delta. SEZ-hosting counties are mainly distributed on the east coast or along the Yangtze River. There are as many as 108 SEZ-hosting counties in Yangtze Delta in 2004, which means SEZ-hosting counties occupy about two-thirds of all the counties in the area.
In this paper, all variables are aggregated at the county-level by using firm-level data information. In particular, we define regional productivity as the log of value-added per employed worker of industry
k in county
i (
). We assume that the regional productivity function depends on three factors. First, we employ the level of education as a measure of human capital.
denotes the share of labor who have college degrees or above for the firms
located in the zones of industry
k in county
i;
denotes the average numbers of schooling years for the firms
outside the zones of industry
k in county
i. Second, since investment is fundamental to regional productivity, we use physical capital into the function as a proxy variable to describe regional productivity: the log of capital stock per employed worker of each industry in county
i (
). Third, we control for competition index (
) and industrial diversity index (
). The strength of competition of an industry in a local market is likely to influence regional productivity. Fierce competition may decrease regional productivity due to diminishing marginal returns. On the other hand, intensive competition forces local firms to adopt advanced techniques to improve productivity. In this paper, we define a competition index as follows,
where
denotes an Herfindahl index of sales revenue concentration of industry
k in county
i;
is sales revenue of firm
f belongs to industry
k in county
i; and
denotes the sum of sales revenue of industry
k in county
i. Additionally, we control for industrial diversity index (
). Productivity of an industry in a region can be influenced by different industries, and the more diverse, the more likely to improve regional productivity. Following
Henderson (
1997), an industrial diversity index is defined as the follows:
where
denotes total employment in county
i;
denotes the total employment of industry
k in county
i.
5. Model Specification
In this paper, we introduce spatial dependence to analyze the spillover effects of the human capital of SEZs to their own counties and the neighboring ones. Considering spatial dependence to examine the effects of SEZs to intra- and inter-region is plausible because a positive shock on the productivity of an industry in a county could also be transferred to the same industry in the nearby counties. Moreover, the spatial lag of explanatory variables can also be included because externalities arising from neighbor’s human capital or other neighbor characteristics could also play a role in determining the productivity of the local industry.
There are two advantages to employ spatial regressions. First, spatial regressions can take into account the spatial lag of the dependent variable and independent variables to describe the outcome of interest. The introduction of spatial dependence allows observations to have associations with each other and to explore the relationship between a county and the neighboring counties. In addition, spatial regression captures spillover effects through three channels. A 1% increase in the humans of SEZs will affect the SEZ-hosting county itself (direct effect) and possibly affect the neighboring counties (indirect effect). Furthermore, spatial regression exploits impact passing through the neighboring counties and back to the counties themselves (feedback effect). The inclusion of spatial information makes it possible to assess the effects of the SEZ program more comprehensively through multiple channels.
In this paper, we divide manufacturing firms into 28 industries by 2-digit level classification, for the reason that the same industry clusters together and has similar characteristics in proximity. We estimate human capital spillovers of SEZs on the local economy via a Spatial Durbin Model (SDM) as follows:
where
is regional productivity for industry
k in county
i;
is row-standardized inverse weight matrix within 150 km, otherwise zero;
denotes the share of employees who have college degrees or above for the firms
located in the zones in county
i;
controls the average numbers of schooling years for the firms
outside the zones of industry
k in county
i;
is the capital stock per employed worker of each industry in county
i;
and
denote competition index and industrial diversity index; and
is the error term, normally distributed by (0,
).
The coefficient of describes the spillover effects from the human capital of SEZs on regional productivity. If the coefficient of is significantly positive, which means that a 1% increase in the human capital of SEZs stimulates regional productivity. Additionally, if the estimate is statistically significant, it implies that a spatial autocorrelation exists and introducing spatially lagged dependent variable is meaningful. Furthermore, if the coefficient of is significantly positive, which means that the human capital of SEZ in a county is similar to the one in neighboring counties located in close distance.
With respect to the selection of models, we compare SDM models with other spatial regression models. As noted by
LeSage and Pace (
2009), SDM models nest most of the other specifications like Spatial Error Model (SEM) and Spatial Autoregressive Model (SAR). Hence, we estimate the SDM models and then compare them with SEM or SAR models by Likelihood Ratio (LR) test. The estimation results obtained from these models can be used to test the hypothesis:
The former one examines the hypothesis of whether the SDM model can be simplified to forms of SAR model. If the null hypothesis is rejected, it demonstrates that the SDM model better describes the data; the latter one is used to examine between SDM and SEM model. If the null hypothesis is rejected, it means that the SDM model cannot be simplified to the SEM model. Since the SDM model is a generated form nesting the other two models, it is more favored than the two models in the case that either of the two hypotheses is rejected.
As suggested by
LeSage and Pace (
2009), we measure average direct and indirect effects to explain the marginal effects of the explanatory variable. Average direct effect, measured by taking an average of the own derivatives for the counties themselves, which captures the effects of SEZs to its own county. The average indirect effect is calculated by the average of derivatives with respect to neighboring counties, which measures the spillovers of SEZs to neighboring counties. To illustrate, we take the partial derivative of the dependent variable with respect to
as follows:
where
are
idempotent matrices. From Equation (4), the partial derivative is not only depends on
, but also
,
, and the spatial weight matrix. By definition, the average indirect effect is calculated by the average of diagonal elements of
, and the average indirect effect is measured by the average of off-diagonal elements of
. From the above equation, we can capture spillover effects through three channels. An increase in human capital in SEZs will affect the firms in the considered county itself (direct effect) and arouse spillovers passing through neighboring counties and back to the counties themselves (feedback effect). Furthermore, a growth in human capital in a county may affect the neighboring counties (indirect effect).
Ramos et al. (
2010) suggest that one needs to estimate the effects of human capital on growth rate of productivity because the human capital used in most literature is a stock variable, which may arouse the problem of endogeneity. Following
López-Bazo et al. (
2004);
Ramos et al. (
2010), we transform the Equation (
1) as follows:
where
denotes the growth rate of regional productivity of industry
k in county
i for the period from 2003 to 2004; and
denotes the regional productivity of industry
k in county
i in 2003.
The Equation (
3) evaluates the effects of human capital on the growth of regional productivity controlling for the neighbors, lagged value of the productivity, and other variables. If the estimate
is significantly positive, it implies that the growth of regional productivity depends on the one in the neighbors. Additionally, the coefficient of
describes the spillover effects from the human capital of SEZs on the growth of regional productivity when controlling for the lagged productivity and other explanatory variables. Furthermore, if the coefficient of
is significantly positive, it implies that the human capital of SEZ in a county is similar to one another that is located in close distance.
6. Empirical Results
Table 1 reports the results of spatial regression models using regional productivity as the dependent variable. To diagnose the existence of spatial dependence, we first estimate the Equation (
1) using linear ordinary least squares (OLS) models without spatial effects. The estimated coefficients of
from the OLS to SDM model are all significantly positive. In addition, the estimated coefficients of the spatially lagged dependent variable in the SAR and SDM models are both significant at the 1% significance level, which suggests the existence of spatial dependence. In the SDM model, the coefficient of
amounts to 0.7936, which implies that a 1% increase in the human capital of SEZs will lead to 0.7936% improvement in regional productivity. Furthermore, the spatial lag of
is significantly positive in the SDM model, which implies that the human capital in a zone is similar to the one in the neighbor zones.
The coefficients of in the OLS and SAR models are significantly positive, however, the one in the SDM model is insignificant. One may doubt that the human capital outside the zones has a limited impact on the local productivity. The coefficients of physical capital are all significantly positive. In the third column, the coefficient of amounts to 0.3993, which implies that a 1% increase in the physical capital of SEZs will lead to a 0.3993% improvement in regional productivity. The coefficients of the competition index are close to zero and insignificant. Stronger competition may contribute to adopting advanced techniques to improve productivity. On the other hand, fierce competition decreases the market share of individual producers, and thus may partly offset the increase in productivity.
Likelihood ratio (LR) tests are carried out to compare the SDM model with the SAR or SEM model. As presented in
Table 1, the first hypothesis, whether the SDM model can be simplified to the SAR model, should be rejected at the 1% significance level; the second hypothesis, whether the SDM model can be replaced by the SEM model, should also be rejected. Thus, we come to a conclusion that the SDM model best describes the data, and the remains of this paper employs the SDM model to calculate average direct, indirect, and total effects.
Table 2 reports direct, indirect, and total effects of the SDM model in the Equation (
1). As noted in the previous section, one cannot interpret the estimate
as a partial derivative with respect to the explanatory variable, one should calculate the estimates of direct, indirect, and total effects to interpret the marginal effects. In particular, the direct effect of the human capital of SEZs on regional productivity is positive and similar to the coefficient of
. In addition, the feedback loops calculated by the difference between them are insignificantly different from zero, so that feedback loops can be neglected. The result implies that the regional productivity benefits from the human capital of SEZs in the considered counties, however, the spillovers from SEZs pass through neighboring ones are not back to the considered counties.
From the second column, we find that the indirect effect of the human capital of SEZs on the neighboring counties is significantly positive. The estimation result indicates that a 1% increase in the human capital of SEZs will lead to a 1.7844% increase in the regional productivity of the neighbors, that is, the neighboring counties benefit from the human capital of SEZs about two times more than the one in the considered counties. Because the indirect effects are cumulative impacts from all other neighboring counties, aggregating indirect effects from the neighborhood would lead to a larger magnitude than the direct effect itself.
Table 3 presents sensitivity checks of our estimates with alternative spatial weight matrices. We employ alternative weight matrices based on cut-off distance from 160 km to 200 km, respectively. In particular, we present the derivative with respect to the variable
and compare it with the results in
Table 2, which used the cut-off distance as 150 km. The direct effect estimates are not affected by alternative weight matrices from 160 km to 200 km. In addition, while the indirect effect estimates are bigger than that of 150 km, the estimates are not changed much with alternative weight matrices.
The empirical results of Equation (
3) using OLS, SAR, as well as SDM models are shown in
Table 4, respectively. As the estimates of Equation (
1), the ones of the spatially lagged dependent variable in SAR or SDM model are significant at the 1% significance level and suggest the existence of spatial lag of the growth of productivity. Additionally, the estimates of human capital are significantly positive at a 5% confidence level. The magnitude of the coefficient for human capital accounts for 0.5634 in the SDM model, which means a 1% increase in the human capital of SEZs will lead to a 0.5634% improvement in the growth of regional productivity when controlling for the lagged value of the productivity and other variables. Moreover, the spatial lag of human capital is significantly positive as the one in
Table 1.
From
Table 5,
Table 6,
Table 7 and
Table 8, we present the estimated results of the alternative explanatory variable: entrants of SEZs. Firms located within SEZs include entrants and incumbent firms. Since incumbent firms were established before SEZs were introduced, they strictly were not supposed to be called “additional” firms or people to the zones. In addition, the incumbent firms are unable to enjoy preferential policies like the entrants
Zheng et al. (
2017). For these reasons, we drop them from the sample and focus on the entrants to evaluate whether human capital spillovers of SEZs have positive effects on regional productivity.
In
Table 5, we report the estimates of the Equation (
1) replacing
with the human capital of entrants in SEZs, and find that the magnitude of the estimates remains virtually unchanged relative to the ones in
Table 1. In
Table 6 and
Table 7, we report average direct, indirect effects and the estimates with alternative weight matrices based on the results of the SDM model in
Table 5. In
Table 8, we present the estimates of Equation (
3) with the human capital of entrants in SEZs. From
Table 5,
Table 6,
Table 7 and
Table 8, the estimates of the human capital of entrants are a little smaller than the ones from
Table 1,
Table 2,
Table 3 and
Table 4 because the number of entrants occupies 77% of all the firms in SEZs. Since entrants are a subsample of all the firms in SEZs, it is reasonable that the estimates are smaller than the ones in previous estimation results.
To sum up, our results find that local firms benefit from the human capital of SEZs in the same industry. Positive spillover effects are not only confined to their own counties, but also neighboring ones. In addition, we find that the human capital of SEZs contributes to the growth of regional productivity. Moreover, positive externalities of human capital still hold for the sample of entrants.
There are two possible explanations for the estimated results. Both of them are beyond the scope of this paper and should be carefully investigated in further research. First, most firms that enter SEZs are engaged in new productive activities rather than simply reallocating capital and labor from elsewhere. Those firms bring additional people with high skill to the local industry. They generally have their own competitive advantages and do not compete with lower technology firms. Positive spillovers from higher-skilled workers to lower ones lead to faster new technology adoption. In addition, establishing strong linkages with local firms like sub-contracting is a feature of the SEZ program in China
Zeng (
2016). Many firms in SEZs make strong connections with local firms relative to a few multinationals that have little connection with local firms. This would facilitate interactions with skilled labor in SEZs and technical upgrades for local firms, and thus seems likely to improve productivity.
7. Conclusions
This paper evaluates the spillover effects of SEZs in Yangtze Delta using 2004 manufacturing data. Taking into account spatial proximity, this paper quantifies the spillover effects of the human capital in SEZs. One major finding is that regional productivity benefits from the human capital in SEZs. The spillover effects are not only confined to their own counties, but also neighboring counties. SEZs contribute more to the regional productivity of neighboring counties than the one of the hosting county itself. Moreover, positive spillover effects of the human capital in SEZs still hold for the growth of regional productivity.
This paper answers the question of whether the externalities of human capital in SEZs raise regional productivity. From the empirical results, we conclude that the human capital of SEZs contributes to improving productivity in the same region. In addition, this paper further answers whether the spillover effects of human capital can benefit neighboring regions in spatial proximity as well. The positive spillovers to wider geographic scope imply that the rising proportion of college-educated workers in SEZs does not harm the firms in the proximity, instead, the driving effect of human capital to improve regional productivity is evident.
Although this paper sheds light on the spillover effects of human capital in SEZs, there are remaining issues for further research. We can make an extension to firm-level data, which would enable us to analyze inter-firm issues in spatial econometric models that have been discussed in recent literature
Baltagi et al. (
2016);
Hashiguchi and Tanaka (
2015). In addition, we can identify spatial spillovers of human capital in own- and other industry sectors as
Autant-Bernard and LeSage (
2011) examining for MAR and Jacobs knowledge externalities. We leave the remaining issues for further research.
[custom]


