
The Influence of Green Product Development Performance to Enhance Enterprise Effectiveness and Innovation


Abstract
:1. Introduction
2. Literature Review and Theoretical Background
2.1. Green Creativity
2.2. Green Dynamic Capabilities
2.3. Green Transformational Leadership
2.4. Reactive Green Innovation
2.5. Proactive Green Innovation
2.6. Green Product Development Performance
3. Research Methods
3.1. Research Design
3.2. Data Collection Method
3.3. Data Analysis Method
4. Results
4.1. Profile of Respondents
4.2. Test of the Reliability of Scale
4.3. Exploratory Factor Analysis (EFA)
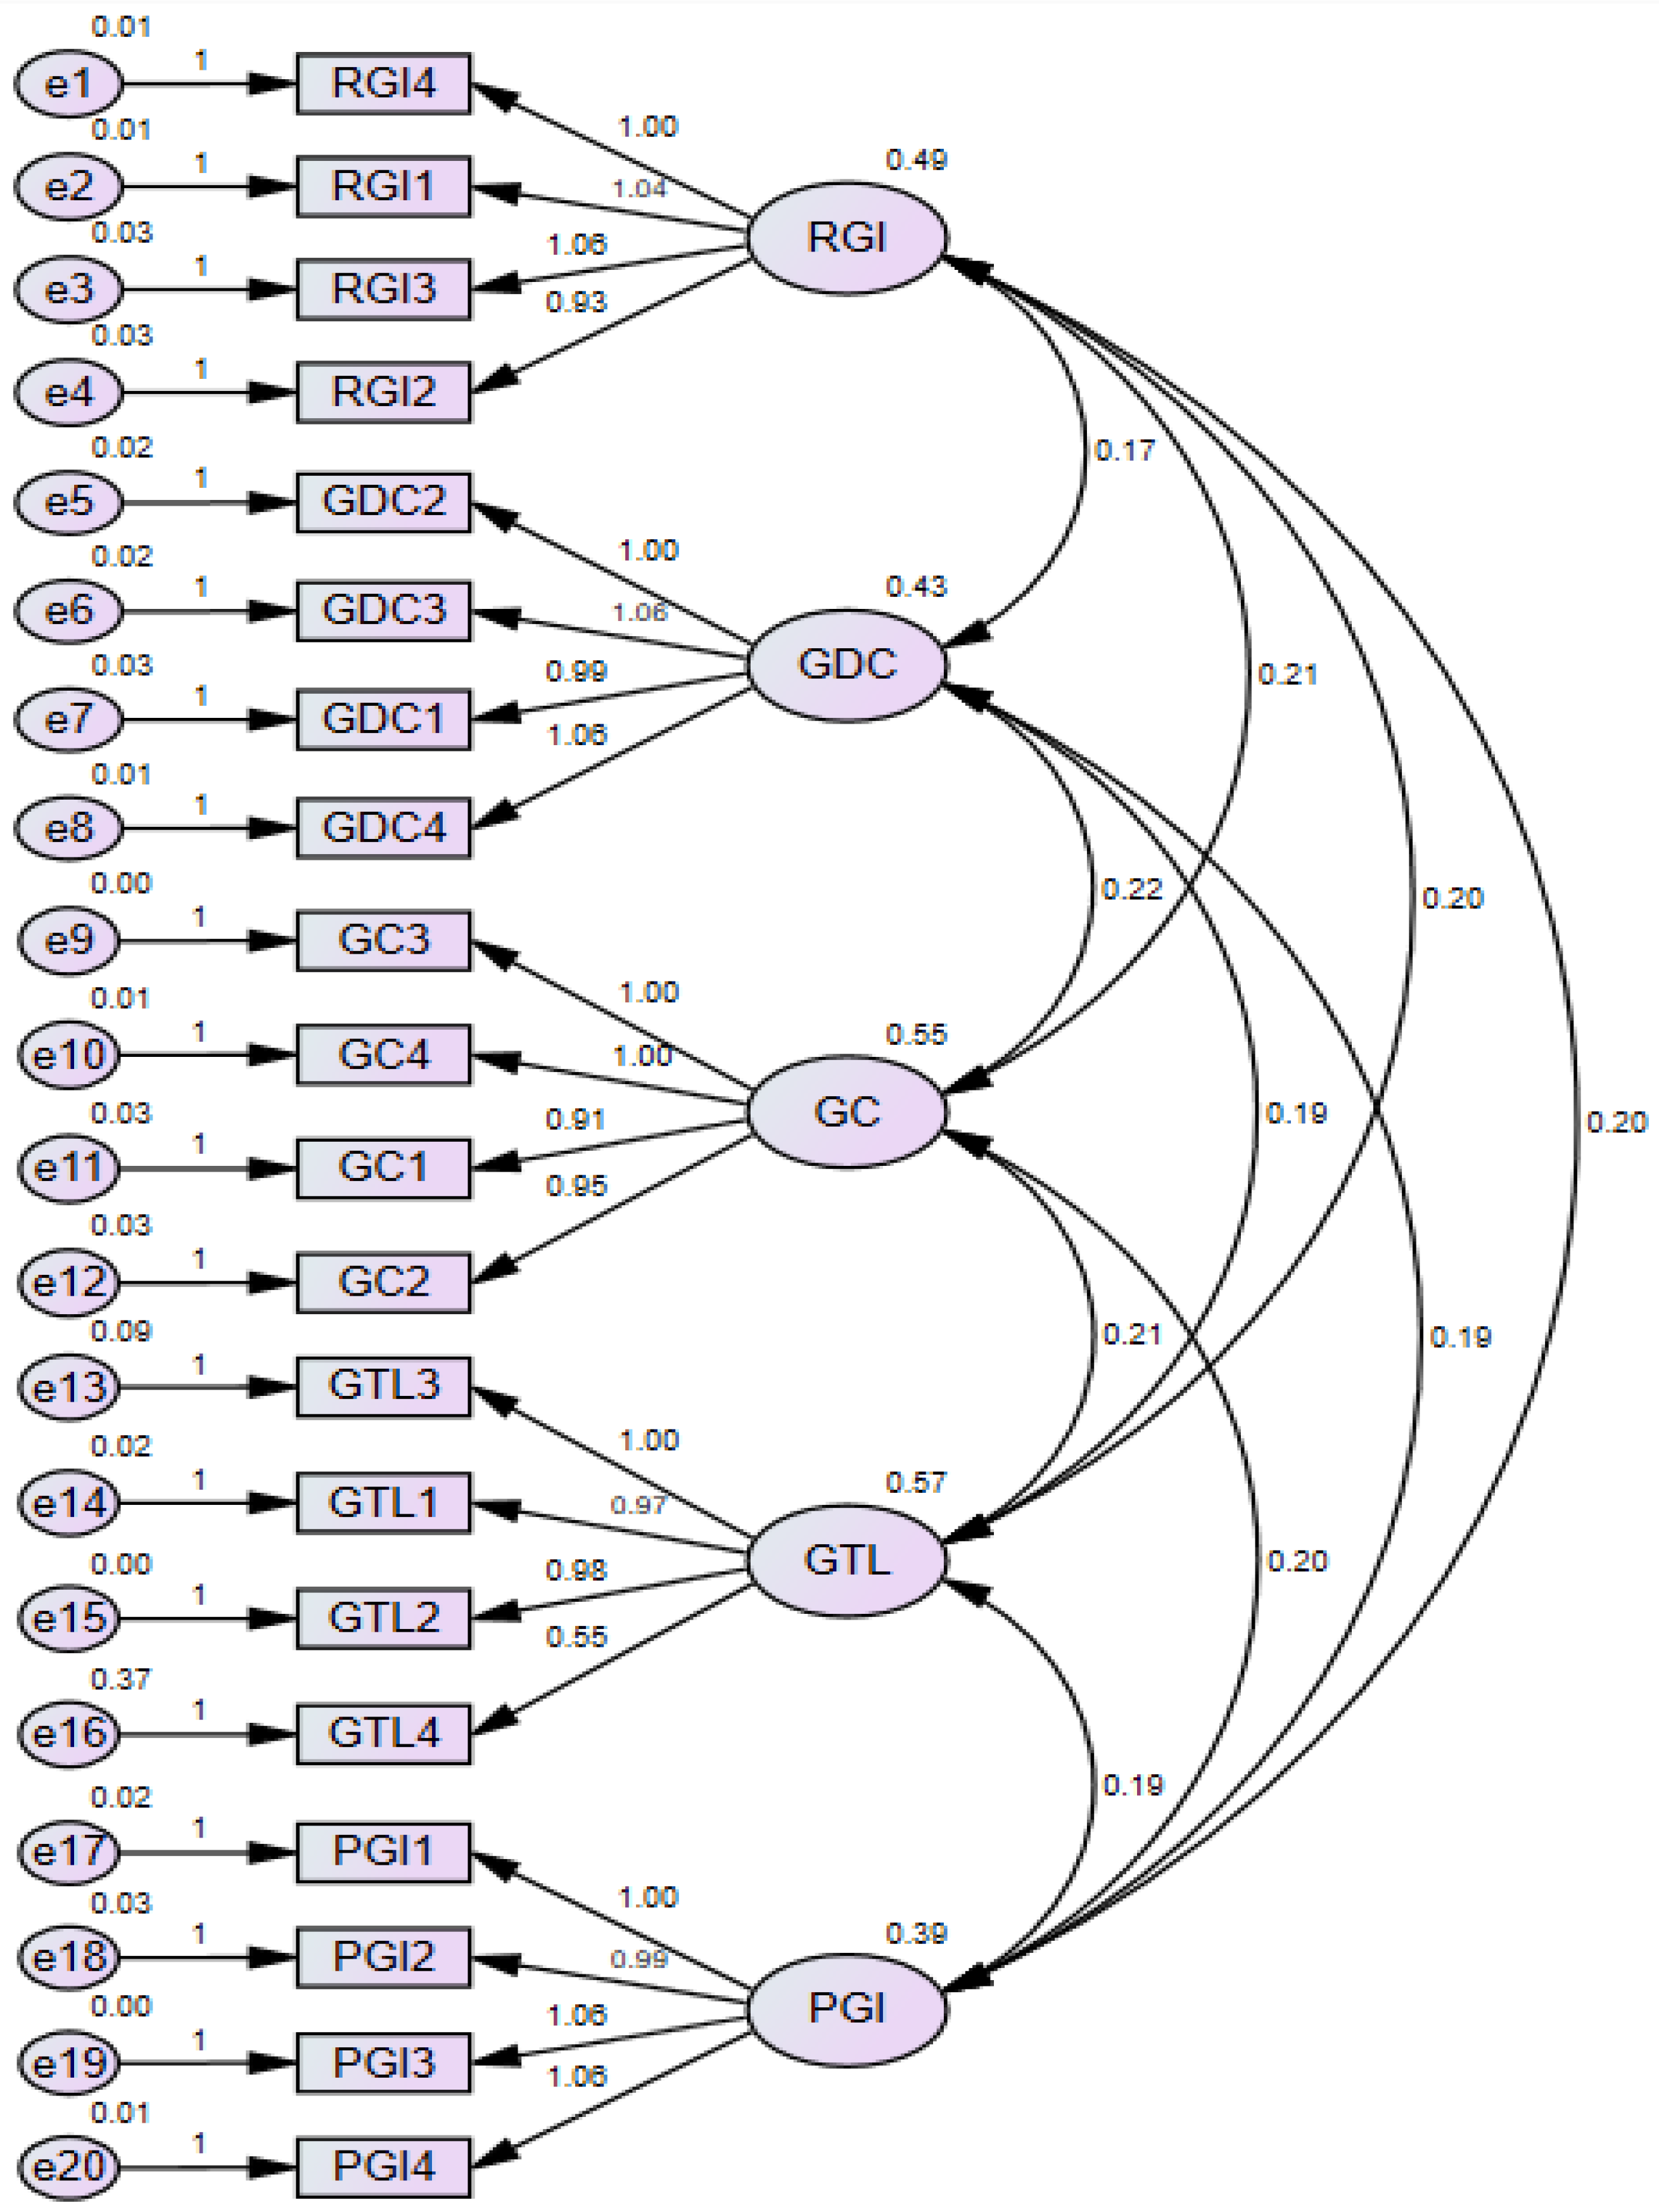
4.4. Confirmatory Factor Analysis (CFA)
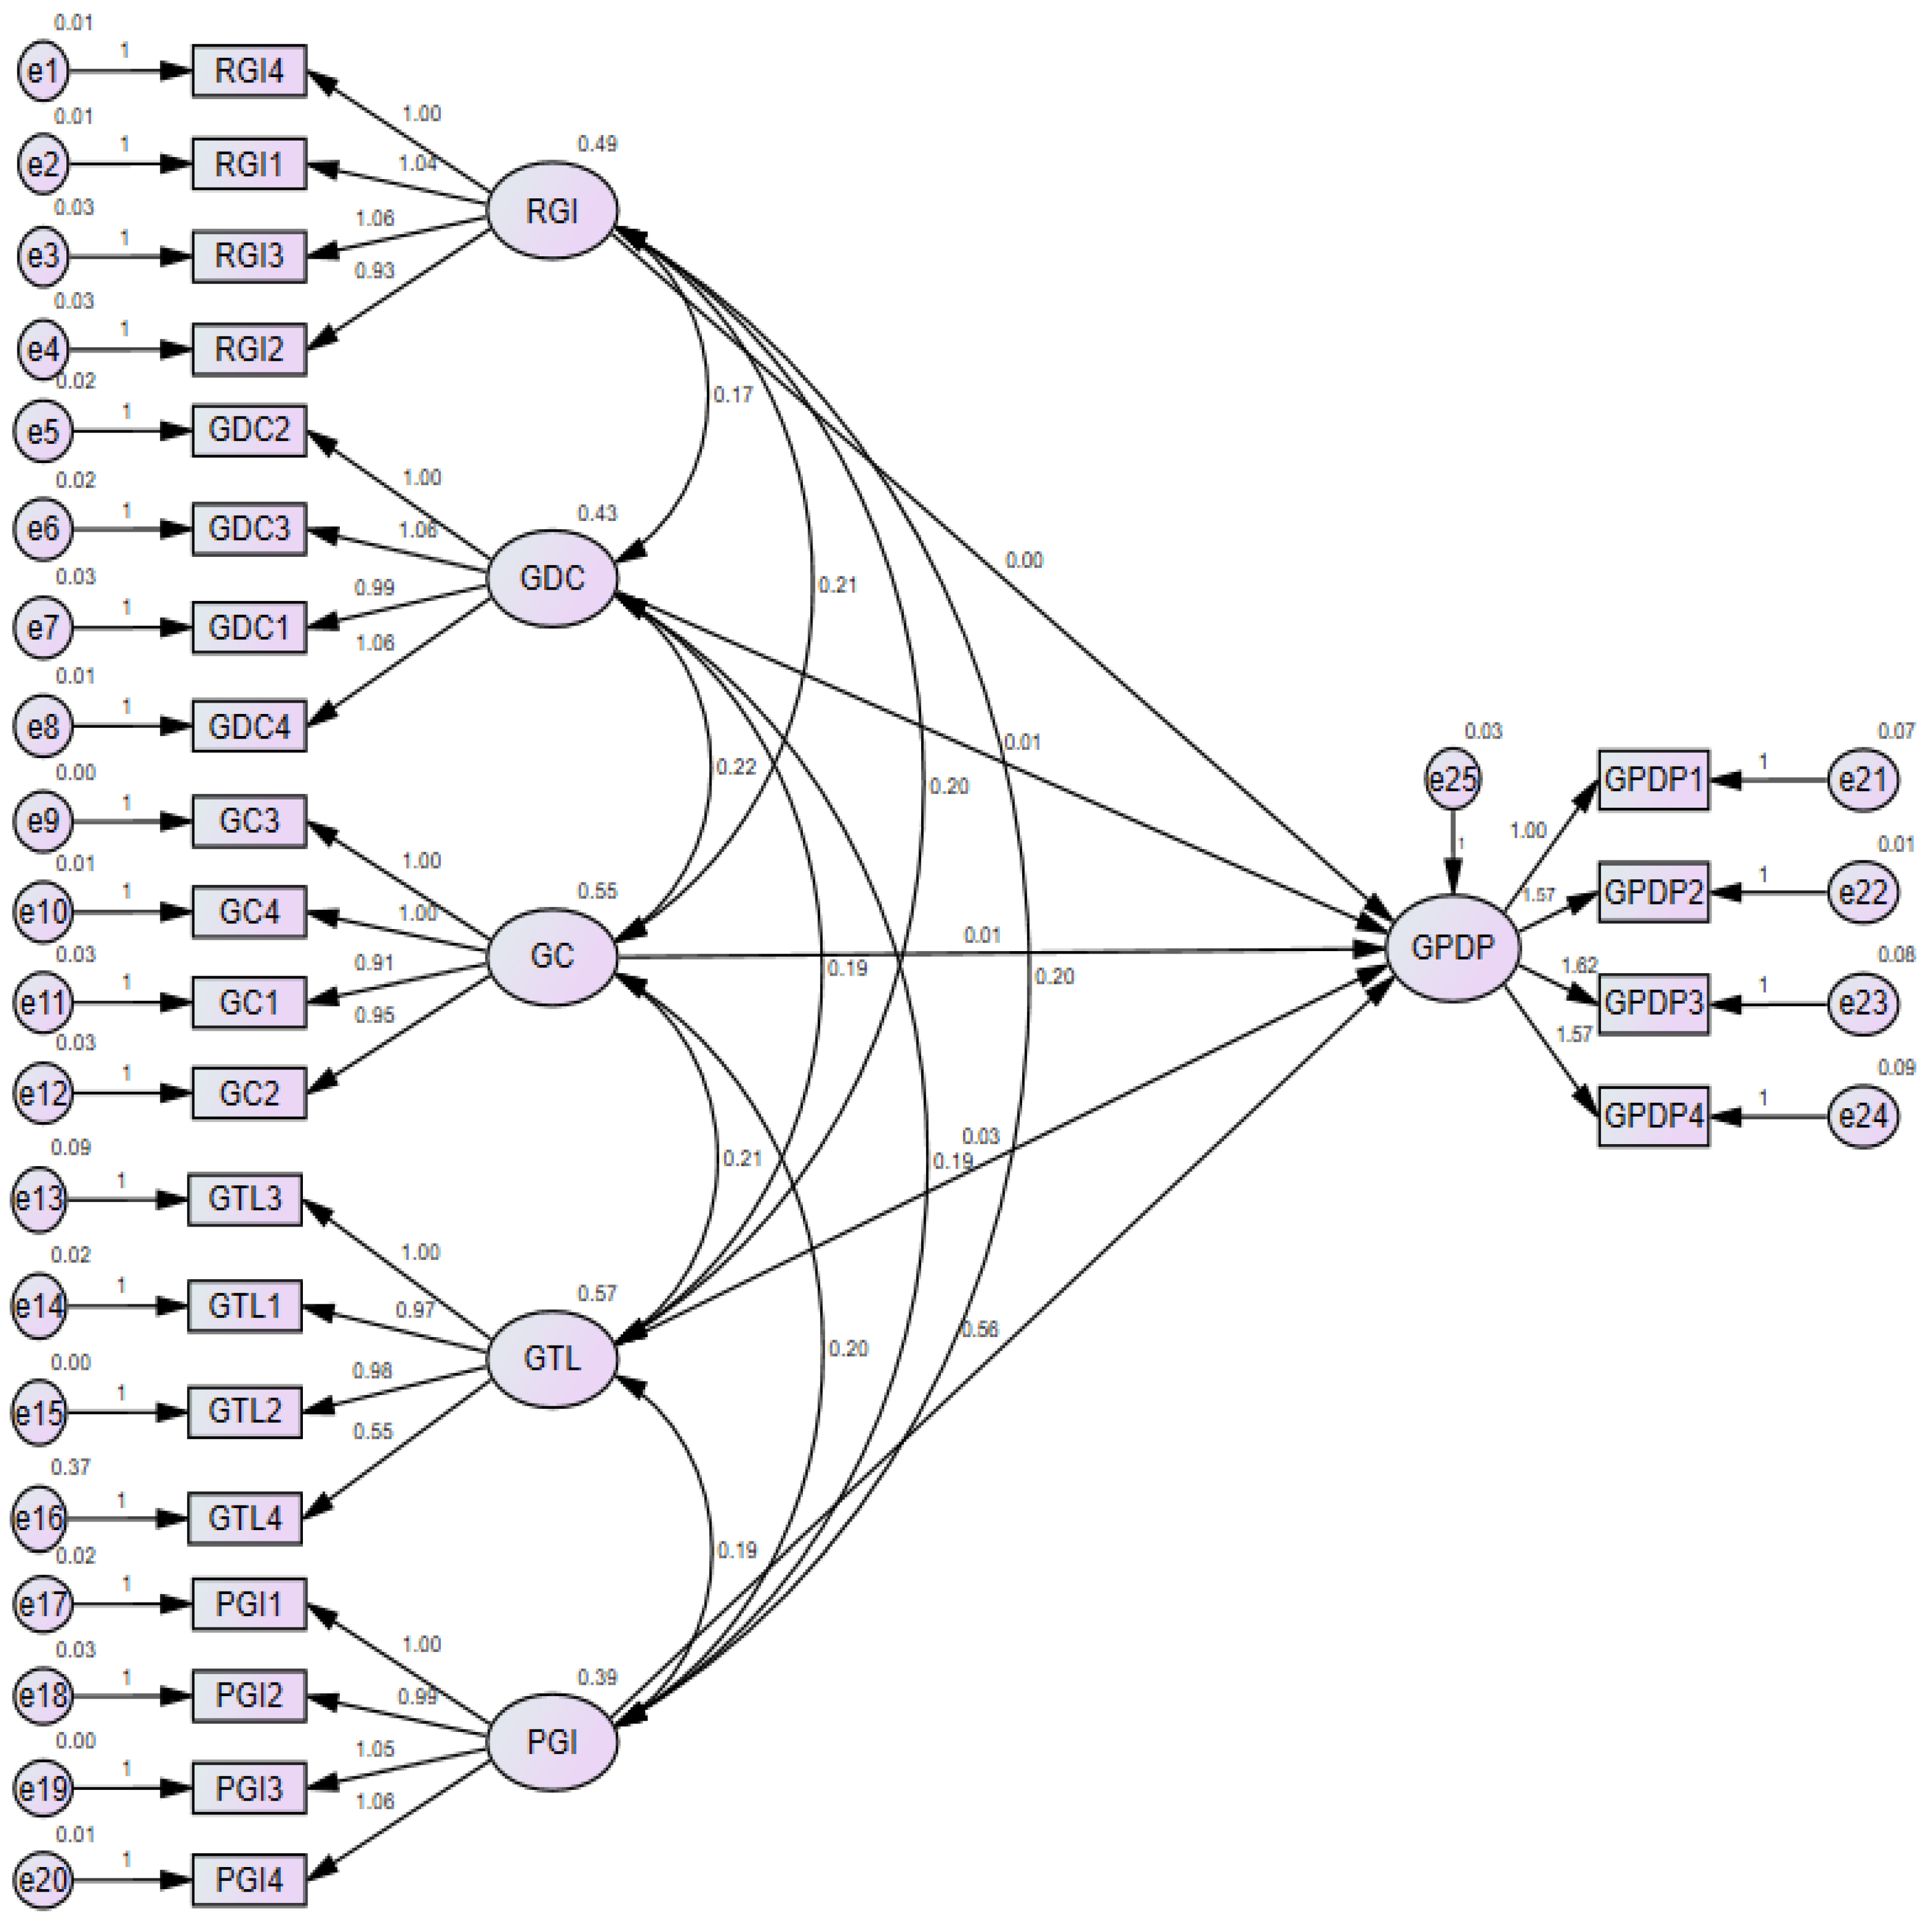
4.5. Structural Equation Model (SEM)
5. Discussion
6. Conclusions and Implications
6.1. Conclusions
6.2. Theoretical Contribution
6.3. Practical Implications
7. Research Limitations and Future Research Directions
Author Contributions
Funding
Institutional Review Board Statement
Informed Consent Statement
Data Availability Statement
Conflicts of Interest
References
- Albino, Vito, Azzurra Balice, and Rosa Maria Dangelico. 2009. Environmental strategies and green product development: An overview on sustainability-driven companies. Business Strategy and the Environment 18: 83–96. [Google Scholar] [CrossRef]
- Amabile, Teresa M., Regina Conti, Heather Coon, Jeffrey Lazenby, and Michael Herron. 1996. Assessing the work environment for creativity. Academy of Management Journal 39: 1154–84. [Google Scholar]
- Anderson, James C., and David W. Gerbing. 1988. Structural equation modeling in practice: A review and recommended two-step approach. Psychological Bulletin 103: 411. [Google Scholar] [CrossRef]
- Andriopoulos, Constantine. 2001. Determinants of organisational creativity: A literature review. Management Decision 39: 834–40. [Google Scholar] [CrossRef]
- Andriopoulos, Constantine, and Marianne W. Lewis. 2010. Managing innovation paradoxes: Ambidexterity lessons from leading product design companies. Long Range Planning 43: 104–22. [Google Scholar] [CrossRef]
- Arora, Ravi. 2002. Implementing KM—A balanced scorecard approach. Journal of Knowledge Management 6: 240–49. [Google Scholar] [CrossRef]
- Avolio, Bruce J., Bernard M. Bass, and Dong I. Jung. 1999. Re-examining the components of transformational and transactional leadership using the Multifactor Leadership Questionnaire. Journal of Occupational and Organizational Psychology 72: 441–62. [Google Scholar] [CrossRef]
- Ayag, Zeki. 2005. An integrated approach to evaluating conceptual design alternatives in a new product development environment. International Journal of Production Research 43: 687–713. [Google Scholar] [CrossRef]
- Bass, Bernard M. 1985. Leadership and Performance beyond Expectations. New York: Free Press. [Google Scholar]
- Bass, Bernard M. 1998. Transformational Leadership: Industrial, Military, and Educational Impact. Mahwah: Lawrence Erlbaum Associates. [Google Scholar]
- Benn, Suzanne, Melissa Edwards, and Tim Williams. 2014. Organizational Change for Corporate Sustainability. London: Routledge, p. 364. [Google Scholar]
- Bentler, Peter M. 1990. Comparative Fit Indexes in Structural Models. Psychological Bulletin 107: 238–46. [Google Scholar] [CrossRef]
- Bentler, Peter M., and Douglas G. Bonett. 1980. Significance tests and goodness-of-fit in the analysis of covariance structures. Psychological Bulletin 88: 588–606. [Google Scholar] [CrossRef]
- Boehm, Stephan A., David J. G. Dwertmann, Heike Bruch, and Boas Shamir. 2015. The missing link? Investigating organizational identity strength and transformational leadership climate as mechanisms that connect CEO charisma with firm performance. The Leadership Quarterly 26: 156–71. [Google Scholar] [CrossRef]
- Brown, Shona L., and Kathleen M. Eisenhardt. 1995. Product development: Past research, present findings, and future directions. The Academy of Management Review 20: 343–78. [Google Scholar] [CrossRef]
- Byrne, Barbara M. 2010. Structural Equation Modeling with Amos: Basic Concepts, Applications, and Programming, 2nd ed. New York: Taylor and Francis Group. [Google Scholar]
- Caplan, Robert D. 1987. Person-environment fit theory and organizations: Commensurate dimensions, time perspectives, and mechanisms. Journal of Vocational Behavior 31: 248–67. [Google Scholar] [CrossRef] [Green Version]
- Chang, Ching-Hsun. 2016. The Determinants of Green Product Innovation Performance. Corporate Social Responsibility and Environmental Management 23: 65–76. [Google Scholar] [CrossRef]
- Chang, Shih-Chia, Shiaw-Wen Tein, and Hsi-Ming Lee. 2010. Social capital, creativity, and new product advantage: An empirical study. International Journal of Electronic Business Management 8: 43–45. [Google Scholar]
- Chen, Chialin. 2001. Design for the Environment: A Quality-Based Model for Green Product Development. Management Science 47: 250–63. [Google Scholar] [CrossRef]
- Chen, Tingting, Fuli Li, and Kwok Leung. 2016. When Does Supervisor Support Encourage Innovative Behavior? Opposite Moderating Effects of General Self-Efficacy and Internal Locus of Control. Personnel Psychology 69: 123–58. [Google Scholar] [CrossRef]
- Chen, Yu-Shan. 2010. The drivers of green brand equity: Green brand image, green satisfaction, and green trust. Journal of Business Ethics 93: 307–19. [Google Scholar] [CrossRef]
- Chen, Yu-Shan. 2011. Green organizational identity: Sources and consequence. Management Decision 49: 384–404. [Google Scholar] [CrossRef] [Green Version]
- Chen, Yu-Shan, and Ching-Hsun Chang. 2012. Enhance green purchase intentions: The roles of green perceived value, green perceived risk, and green trust. Management Decision 50: 502–20. [Google Scholar] [CrossRef]
- Chen, Yu-Shan, and Ching-Hsun Chang. 2013. The Determinants of Green Product Development Performance: Green Dynamic Capabilities, Green Transformational Leadership, and Green Creativity. Journal of Business Ethics 116: 107–19. [Google Scholar] [CrossRef]
- Chen, Yu-Shan, Ching-Hsun Chang, and Feng-Shang Wu. 2012. Origins of green innovations: The differences between proactive and reactive green innovations. Management Decision 50: 368–98. [Google Scholar] [CrossRef]
- Choi, Youngkeun. 2020. A study of the role of perceived organizational support among sexual harassment and employees’ attitudes. Journal of Asian Finance, Economics, and Business 7: 229–36. [Google Scholar] [CrossRef]
- Chu, Thi Thu Ha. 2018. Environmental pollution in Vietnam: Challenges in management and protection. Journal of Vietnamese Environment 9: 1–3. [Google Scholar] [CrossRef]
- Clark, Kim B., and Takahiro Fujimoto. 1991. Product Development Performance: Strategy, Organization, and Management in the World Auto Industry. Boston: HBS Press. [Google Scholar]
- Cooper, Robert G. 1979. The dimensions of industrial new product success and failure. Journal of Marketing 43: 93–103. [Google Scholar] [CrossRef]
- Costa, Joana, Diana Cancela, and João Reis. 2021. Neverland or Tomorrowland? Addressing (In)compatibility among the SDG Pillars in Eu-rope. International Journal of Environmental Research and Public Health 18: 11858. [Google Scholar]
- Cronbach, Lee J. 1951. Coefficient alpha and the internal structure of tests. Psychometrika 16: 297–334. [Google Scholar] [CrossRef] [Green Version]
- Cronin, J. Joseph, Jr., Jeffery S. Smith, Mark R. Gleim, Edward Ramirez, and Jennifer Dawn Martinez. 2011. Green marketing strategies: An examination of stakeholders and the opportunities they present. Journal of the Academy of Marketing Science 39: 158–74. [Google Scholar] [CrossRef]
- Deshpande’, Rohit, John U. Farley, and Frederick E. Webster Jr. 1993. Corporate culture, customer orientation, and innovativeness in Japanese firms: A quadrad analysis. Journal of Marketing 57: 23–37. [Google Scholar]
- Eisenhardt, Kathleen M., and Jeffrey A. Martin. 2000. Dynamic capabilities: What are they? Strategic Management Journal 21: 1105–21. [Google Scholar] [CrossRef]
- Fitzsimmons, James A., Panagiotis Kouvelis, and Debasish N. Mallick. 1991. Design strategy and its interface with manufacturing and marketing: A conceptual framework. Journal of Operations Management 10: 398–415. [Google Scholar] [CrossRef]
- Ford, Cameron M. 1996. A theory of individual creative action in multiple social domains. Academy of Management Review 21: 1112–42. [Google Scholar] [CrossRef]
- Gabler, Colin B., Robert Glenn Richey Jr., and Adam Rapp. 2015. Developing an eco-capability through environmental orientation and organizational innovativeness. Industrial Marketing Management 45: 151–61. [Google Scholar] [CrossRef]
- Galunic, D. Charles, and Kathleen M. Eisenhardt. 2001. Architectural innovation and modular corporate forms. Academy of Management Journal 44: 1229–49. [Google Scholar]
- Gong, Yaping, Jia-Chi Huang, and Jiing-Lih Farh. 2009. Employee learning orientation, transformational leadership, and employee creativity: The mediating role of employee creative self-efficacy. Academy of Management Journal 52: 765–78. [Google Scholar] [CrossRef]
- Griffin, Abbie. 1997. The effect of project and process characteristics on product development cycle time. Journal of Marketing Research 34: 24–35. [Google Scholar] [CrossRef]
- Hair, Joe F., Christian M. Ringle, and Marko Sarstedt. 2011. PLS-SEM: Indeed a silver bullet. The Journal of Marketing Theory and Practice 19: 139–52. [Google Scholar] [CrossRef]
- Hair, Joseph F, William C. Black, Barry J. Babin, and Rolph E. Anderson. 2014. Multivariate Data Analysis, 7th ed. Upper Saddle River: Pearson Education. [Google Scholar]
- Hair, Joseph, William Black, Barry Babin, and Rolph Anderson. 2010. Multivariate Data Analysis: A Global Perspective, 7th ed. Upper Saddle River: Prentice-Hall. [Google Scholar]
- Hair, Joseph, William Black, Barry Babin, Rolph Anderson, and Ronald Tatham. 2006. Multivariate Data Analysis, 6th ed. Harlow: Pearson Education. [Google Scholar]
- Hair, Joseph, William C. Black, Barry J. Babin, Rolph E. Anderson, and Ronald L. Tatham. 1998. Multivariate Data Analysis. Upper Saddle River: Prentice Hall, vol. 5, pp. 207–19. [Google Scholar]
- Halbesleben, Jonathon R. B., Milorad M. Novicevic, Michael G. Harvey, and M. Ronald Buckley. 2003. Awareness of temporal complexity in leadership of creativity and innovation: A competency-based model. Leadership Quarterly 14: 433–54. [Google Scholar] [CrossRef]
- Han, Seung-hyun, Gaeun Seo, Jessica Li, and Seung Won Yoon. 2016. The mediating effect of organizational commitment and employee empowerment: How transformational leadership impacts employee knowledge sharing intention. Human Resource Development International 19: 98–115. [Google Scholar] [CrossRef]
- Haque, Amlan, Mario Fernando, and Peter Caputi. 2017. The relationship between responsible leadership and organisational commitment and the mediating effect of employee turnover intentions: An empirical study with Australian employees. Journal of Business Ethics 156: 759–74. [Google Scholar] [CrossRef]
- Haque, Amlan, Mario Fernando, and Peter Caputi. 2020. How is responsible leadership related to the three- component model of organisational commitment? International Journal of Productivity and Performance Management 70: 1137–61. [Google Scholar] [CrossRef]
- Hoffman, Andrew John. 2018. The next phase of business sustainability. Stanford Social Innovation Review 16: 34–39. [Google Scholar] [CrossRef] [Green Version]
- Hooper, Daire, Joseph Coughlan, and Michael R. Mullen. 2008. Structural Equation Modelling: Guidelines for Determining Model Fit. The Electronic Journal of Business Research Methods 6: 53–60. [Google Scholar]
- Hsu, Ya-Hui, and Wenchang Fang. 2009. Intellectual capital and new product development performance: The mediating role of organizational learning capability. Technological Forecasting and Social Change 76: 664–77. [Google Scholar] [CrossRef]
- Hu, Li-tze, and Peter M. Bentler. 1999. Cutoff criteria for fit indexes in covariance structure analysis: Conventional criteria versus new alternatives. Structural Equation Modeling 6: 1–55. [Google Scholar] [CrossRef]
- Hunt, Shelby D., and Robert M. Morgan. 1995. The comparative advantage theory of competition. Journal of Marketing 59: 1–15. [Google Scholar] [CrossRef]
- Iansiti, Marco, and Kim B. Clark. 1994. Integration and dynamic capability: Evidence from product development in automobiles and main frame computers. Industrial and Corporate Change 3: 557–605. [Google Scholar] [CrossRef]
- Jabbour, Charbel Jose Chiappetta, Daniel Jugend, Ana Beatriz Lopes de Sousa Jabbour, Angappa Gunasekaran, and Latan Hengky. 2015. Green product development and performance of Brazilian firms: Measuring the role of human and technical aspects. Journal of Cleaner Production 87: 442–51. [Google Scholar] [CrossRef]
- Joshi, Ankur, Saket Kale, Satish Chandel, and Dinesh Kumar Pal. 2015. Likert scale: Explored and explained. British Journal of Applied Science & Technology 7: 46. [Google Scholar]
- Kidder, Louise H., and Michelle Fine. 1987. Qualitative and quantitative methods: When stories converge. New Directions for Program Evaluation 1987: 57–75. [Google Scholar] [CrossRef]
- Kline, Rex B. 2005. Principals and Practice of Structural Equation Modelling, 2nd ed. New York: The Guilford Press. [Google Scholar]
- Kline, Rex B. 2016. Methodology in the Social Sciences. In Principles and Practice of Structural Equation Modeling. New York: Guilford Press. [Google Scholar]
- Krishnan, Viswanathan, and Karl Ulrich. 2001. Product development decisions: A review of the literature. Management Science 4: 1–21. [Google Scholar] [CrossRef] [Green Version]
- Kuzma, Edson, Luccas Santin Padilha, Simone Sehnem, Dulcimar José Julkovski, and Darlan José Roman. 2020. The relationship between innovation and sustaina-bility: A meta-analytic study. Journal of Cleaner Production 259: 120745. [Google Scholar] [CrossRef]
- Le, Phong Ba, and Hui Lei. 2018. The mediating role of trust in stimulating the relationship between transformational leadership and knowledge sharing processes. Journal of Knowledge Management 22: 521–37. [Google Scholar] [CrossRef]
- Lee, Hyunsuk, and Donna Kelley. 2008. Building dynamic capabilities for innovation: An exploratory study of key management practices. R & D Management 38: 155–68. [Google Scholar]
- Liere, Van Kent D., and Riley E. Dunlap. 1980. The social bases of environmental concern: A review of hypotheses, explanations and empirical evidence. Public Opinion Quarterly 44: 181–97. [Google Scholar] [CrossRef]
- Luyten, Hans, and Manuel Bazo. 2019. Transformational leadership, professional learning communities, teacher learning and learner cen-tred teaching practices; Evidence on their interrelations in Mozambican primary education. Studies in Educational Evaluation 60: 14–31. [Google Scholar] [CrossRef]
- Lymperopoulos, Constantine, Ioannis Chaniotakis, and Magdalini Soureli. 2012. A model of green bank marketing. Journal of Financial Services Marketing 17: 177–86. [Google Scholar] [CrossRef]
- MacCallum, Robert C., Michael W. Browne, and Hazuki M. Sugawara. 1996. Power Analysis and Determination of Sample Size for Covariance Structure Modeling. Psychological Methods 1: 130–49. [Google Scholar] [CrossRef]
- MacKenzie, Scott B. 2001. Opportunities for improving consumer research through latent variable structural equation modeling. Journal of Consumer Research 28: 159–66. [Google Scholar] [CrossRef]
- March, James G. 1991. Exploration and exploitation in organizational learning. Organization Science 2: 71–87. [Google Scholar] [CrossRef]
- Milliman, John. 2014. Leading-Edge Green Human Resource Practices: Vital Components to Advancing Environmental Sustainability. Environmental Quality Management 23: 31–45. [Google Scholar] [CrossRef]
- Mittal, Swati, and Rajib Lochan Dhar. 2016. Effect of green transformational leadership on green creativity: A study of tourist hotels. Tourism Manage 57: 118–27. [Google Scholar] [CrossRef]
- Nguyen, Nhu Ty, Le Hoang Anh Nguyen, and Thanh Tuyen Tran. 2021. Purchase behavior of young consumers toward green packaged products in Vietnam. Journal of Asian Finance, Economics and Business 8: 985–96. [Google Scholar]
- Norton, Thomas A., Hannes Zacher, Stacey L. Parker, and Neal M. Ashkanasy. 2017. Bridging the gap between green behavioral intentions and employee green be-havior: The role of green psychological climate. Journal of Organizational Behavior 38: 996–1015. [Google Scholar] [CrossRef]
- Nunnally, Jum C., and Ira H. Bernstein. 1994. The assessment of reliability. Psychometric Theory 3: 248–92. [Google Scholar]
- Oh, Ah-Hyun, and Hye-Yoon Park. 2020. The effect of airline’s professional models on brand loyalty: Focusing on mediating effect of brand attitude. Journal of Asian Finance, Economics, and Business 7: 155–66. [Google Scholar] [CrossRef]
- Orsato, Renato J. 2006. Competitive environmental strategies: When does it pay to be green? California Management Review 48: 127–43. [Google Scholar] [CrossRef] [Green Version]
- Pallant, Julie. 2005. SPSS Survival Manual: A Step by Step Guide to Data Analysis Using SPSS for Windows. Buckingham: Open University Press. [Google Scholar]
- Pasha, Obed, Theodore H. Poister, Bradley E. Wright, and John C. Thomas. 2017. Transformational Leadership and Mission Valence of Employees: The Varying Effects by Organizational Level. Public Performance & Management Review 40: 722–40. [Google Scholar]
- Pavlou, Paul A., and Omar A. El Sawy. 2011. Understanding the elusive black box of dynamic capabilities. Decision Sciences 42: 239–73. [Google Scholar] [CrossRef]
- Pirola-Merlo, Andrew, and Leon Mann. 2004. The relationship between individual creativity and team creativity: Aggregating across people and time. Journal of Organizational Behaviour 25: 235–57. [Google Scholar] [CrossRef]
- Podsakoff, Philip M., Scott B. MacKenzie, Robert H. Moorman, and Richard Fetter. 1990. Transformational leader behaviors and their effects on followers’ trust in leader, satisfaction, and organizational citizenship behaviours. Leadership Quarterly 1: 107–42. [Google Scholar] [CrossRef]
- Pujari, Devashish, Gillian Wright, and Ken Peattie. 2003. Green and competitive: Influences on environmental new product development performance. Journal of Business Research 56: 657–71. [Google Scholar] [CrossRef]
- Raza, Muhammad Haseeb, Muhammad Abid, Muhammad Faisal, Tingwu Yan, Shoaib Akhtar, and K. M. Mehedi Adnan. 2022. Environmental and Health Impacts of Crop Residue Burning: Scope of Sustainable Crop Residue Management Practices. International Journal of Environmental Research and Public Health 19: 4753. [Google Scholar] [CrossRef] [PubMed]
- Reiter-Palmon, Roni, and Jody J. Illies. 2004. Leadership and creativity: Understanding leadership from a creative problem-solving perspective. The Leadership Quarterly 15: 55–77. [Google Scholar] [CrossRef]
- Robertson, Jennifer L. 2018. The Nature, Measurement and Nomological Network of Environmentally Specific Transformational Leadership. Journal of Business Ethics 151: 961–75. [Google Scholar] [CrossRef]
- Rodrigo-Alarcón, Job, Pedro M. García-Villaverde, María J. Ruiz-Ortega, and Gloria Parra-Requena. 2018. From social capital to entrepreneurial orientation: The mediating role of dynamic capabilities. European Management Journal 36: 195–209. [Google Scholar] [CrossRef]
- Sarros, James C., Brian K. Cooper, and Joseph C. Santora. 2008. Building a climate for innovation through transformational leadership and or-ganizational culture. Journal of Leadership & Organizational Studies 15: 145–58. [Google Scholar]
- Sethibe, Tebogo Gilbert. 2018. Towards a comprehensive model on the relationship between leadership styles, organisational climate, inno-vation and organisational performance. International Journal of Innovation Management 22: 1850021. [Google Scholar] [CrossRef]
- Shevlin, Mark, and Jeremy N. V. Miles. 1998. Effects of sample size, model specification and factor loadings on the GFI in confirmatory factor analysis. Personality and Individual Differences 25: 85–90. [Google Scholar] [CrossRef]
- Smith, Preston G., and Donald G. Reinertsen. 1992. Shortening the product development cycle. Research- Technology Management 35: 44–49. [Google Scholar] [CrossRef]
- Song, Wenhao, and Hongyan Yu. 2018. Green innovation strategy and green innovation: The roles of green creativity and green organizational identity. Corporate Social Responsibility and Environmental Management 25: 135–50. [Google Scholar] [CrossRef]
- Stark, John. 2015. Product lifecycle management. In Product Lifecycle Management 1: 1–29. [Google Scholar]
- Taherdoost, Hamed. 2018. Validity and reliability of the research instrument: How to test the validation of a questionnaire/survey in research. SSRN Electronic Journal 1: 111–21. [Google Scholar] [CrossRef]
- Teece, David J., Gary Pisano, and Amy Shuen. 1997. Dynamic Capabilities and Strategic Management. Strategic Management Journal 18: 509–33. [Google Scholar] [CrossRef]
- Thomas, W. H. Ng. 2017. Transformational leadership and performance outcomes: Analyses of multiple mediation pathways. The Leadership Quarterly 28: 385–417. [Google Scholar]
- Vietnam Academy of Social Sciences—VAOSS. 2016. Hội thảo: “Thúc đẩy tiêu dùng bền vững ở Viện Hàn lâm Khoa học xã hội Việt Nam”. Available online: https://vass.gov.vn/UserControls/News/pFormPrint.aspx?UrlListProcess=/noidung/tintuc/Lists/DoanThanhNienTinHoatDong&ListId=8e5e75ae-e76a-4bf5-be1...ee32ecf5 (accessed on 5 May 2022).
- Wang, Jichuan, and Xiaoqian Wang. 2012. Structural Equation Modeling Applications Using Mplus. Chichester: Wiley/Higher Education Press. [Google Scholar]
- Winter, Sidney G. 2003. Understanding dynamic capabilities. Strategic Management Journal 24: 991–95. [Google Scholar] [CrossRef] [Green Version]
- Wohlgemuth, Veit, and Matthias Wenzel. 2016. Dynamic capabilities and routinization. Journal of Business Research 69: 1944–48. [Google Scholar] [CrossRef]
- Woodman, Richard W., John E. Sawyer, and Ricky W. Griffin. 1993. Toward a theory of organizational creativity. Academy of Management Review 18: 293–321. [Google Scholar] [CrossRef]
- Yoon, Seung Won, Ji Hoon Song, Doo Hun Lim, and Baek-Kyoo Joo. 2010. Structural determinants of team performance: The mutual influences of learning culture, creativity, and knowledge. Human Resource Development International 13: 249–64. [Google Scholar] [CrossRef]
- Zientara, Piotr, and Anna Zamojska. 2016. Green organizational climates and employee pro-environmental behaviour in the hotel industry. Journal of Sustainable Tourism 26: 1142–59. [Google Scholar] [CrossRef]


| Demographic | Characteristics (n = 1009) | Frequency | Percentage (%) |
|---|---|---|---|
| Gender | Female | 520 | 51.5 |
| Male | 489 | 48.5 | |
| Age | Under 18 years old | 18 | 1.8 |
| 18–22 years old | 63 | 6.2 | |
| 22–30 years old | 833 | 82.6 | |
| Over 30 years old | 95 | 9.4 | |
| Education | High school | 30 | 3 |
| Intermediate | 49 | 4.9 | |
| College | 68 | 6.7 | |
| University | 820 | 81.3 | |
| Postgraduate | 42 | 4.2 | |
| Occupation | Student | 51 | 5.1 |
| College Student | 37 | 3.7 | |
| Civil servant | 68 | 6.7 | |
| Workers—Employees | 693 | 68.7 | |
| Business | 42 | 4.2 | |
| Housewives | 45 | 4.5 | |
| Freelance | 73 | 7.2 | |
| Income | Under 3 Million VND | 126 | 12.5 |
| 3–5 Million VND | 431 | 42.7 | |
| 5–10 Million VND | 369 | 36.6 | |
| Over 10 Million VND | 83 | 8.2 |
| Construct | Items | Corrected Item-Total Correlation | Cronbach’s Alpha if Item Deleted |
|---|---|---|---|
| Green Creativity (GC): Cronbach’s Alpha = 0.991 | GC1 | 0.965 | 0.992 |
| GC2 | 0.973 | 0.989 | |
| GC3 | 0.990 | 0.985 | |
| GC4 | 0.983 | 0.987 | |
| Green Dynamic Capabilities (GDC): Cronbach’s Alpha = 0.992 | GDC1 | 0.971 | 0.991 |
| GDC2 | 0.974 | 0.991 | |
| GDC3 | 0.990 | 0.986 | |
| GDC4 | 0.982 | 0.989 | |
| Green Transformational Leadership (GTL): Cronbach’s Alpha = 0.995 | GTL1 | 0.976 | 0.996 |
| GTL2 | 0.992 | 0.991 | |
| GTL3 | 0.992 | 0.991 | |
| GTL4 | 0.984 | 0.993 | |
| Reactive Green Innovation (RGI): Cronbach’s Alpha = 0.990 | RGI1 | 0.988 | 0.984 |
| RGI2 | 0.960 | 0.992 | |
| RGI3 | 0.971 | 0.989 | |
| RGI4 | 0.988 | 0.984 | |
| Proactive Green Innovation (PGI): Cronbach’s Alpha = 0.991 | PGI1 | 0.972 | 0.990 |
| PGI2 | 0.969 | 0.991 | |
| PGI3 | 0.990 | 0.985 | |
| PIG4 | 0.980 | 0.988 | |
| Green Product Development Performance (GPDP): Cronbach’s Alpha = 0.961 | GPDP1 | 0.893 | 0.954 |
| GPDP2 | 0.959 | 0.933 | |
| GPDP3 | 0.886 | 0.955 | |
| GPDP4 | 0.896 | 0.952 |
| Factor | Pattern Matrix a | ||||
|---|---|---|---|---|---|
| 1 | 2 | 3 | 4 | 5 | |
| GTL2 | 0.948 | ||||
| GTL3 | 0.946 | ||||
| GTL1 | 0.944 | ||||
| GTL4 | 0.936 | ||||
| RGI4 | 0.944 | ||||
| RGI1 | 0.939 | ||||
| RGI3 | 0.922 | ||||
| RGI2 | 0.909 | ||||
| GC3 | 0.934 | ||||
| GC4 | 0.932 | ||||
| GC1 | 0.928 | ||||
| GC2 | 0.910 | ||||
| GDC2 | 0.931 | ||||
| GDC3 | 0.927 | ||||
| GDC1 | 0.922 | ||||
| GDC4 | 0.918 | ||||
| PGI1 | 0.929 | ||||
| PGI2 | 0.923 | ||||
| PGI3 | 0.918 | ||||
| PGI4 | 0.911 | ||||
| Parameters | Observed Value | Ideal Threshold | Result |
|---|---|---|---|
| Chi-square/df | 2.492 | <3 | Good |
| GFI | 0.969 | >0.9 | Good |
| CFI | 0.995 | >0.9 | Good |
| TLI | 0.986 | >0.9 | Good |
| RMSEA | 0.059 | <0.08 | Acceptable |
| PCLOSE | 0.04 | >0.01 | Acceptable |
| Goodness-of-Fit Indices | Criterion | Results of This Study |
|---|---|---|
| Chi-Square (CMIN) | <3.00 (Hair et al. 2006) | 2.230 |
| Goodness-of-Fit Index (GFI) | >0.90 (Shevlin and Miles 1998) | 0.961 |
| Adjusted Goodness of Fit Index (AGFI) | >0.90 (Hooper et al. 2008) | 0.945 |
| Normed Fit Index (NFI) | >0.90 (Bentler and Bonett 1980) | 0.956 |
| Comparative Fit Index (CFI) | >0.90 (Bentler 1990) | 0.993 |
| Turker Lewis Index (TLI) | >0.90 (Bentler and Bonett 1980) | 0.982 |
| Root Mean Square Error of Approximation (RMSEA) | <0.08 (MacCallum et al. 1996) | 0.061 |
| Root Mean Square Residual (RMR) | <0.05 (Hair et al. 2006) | 0.029 |
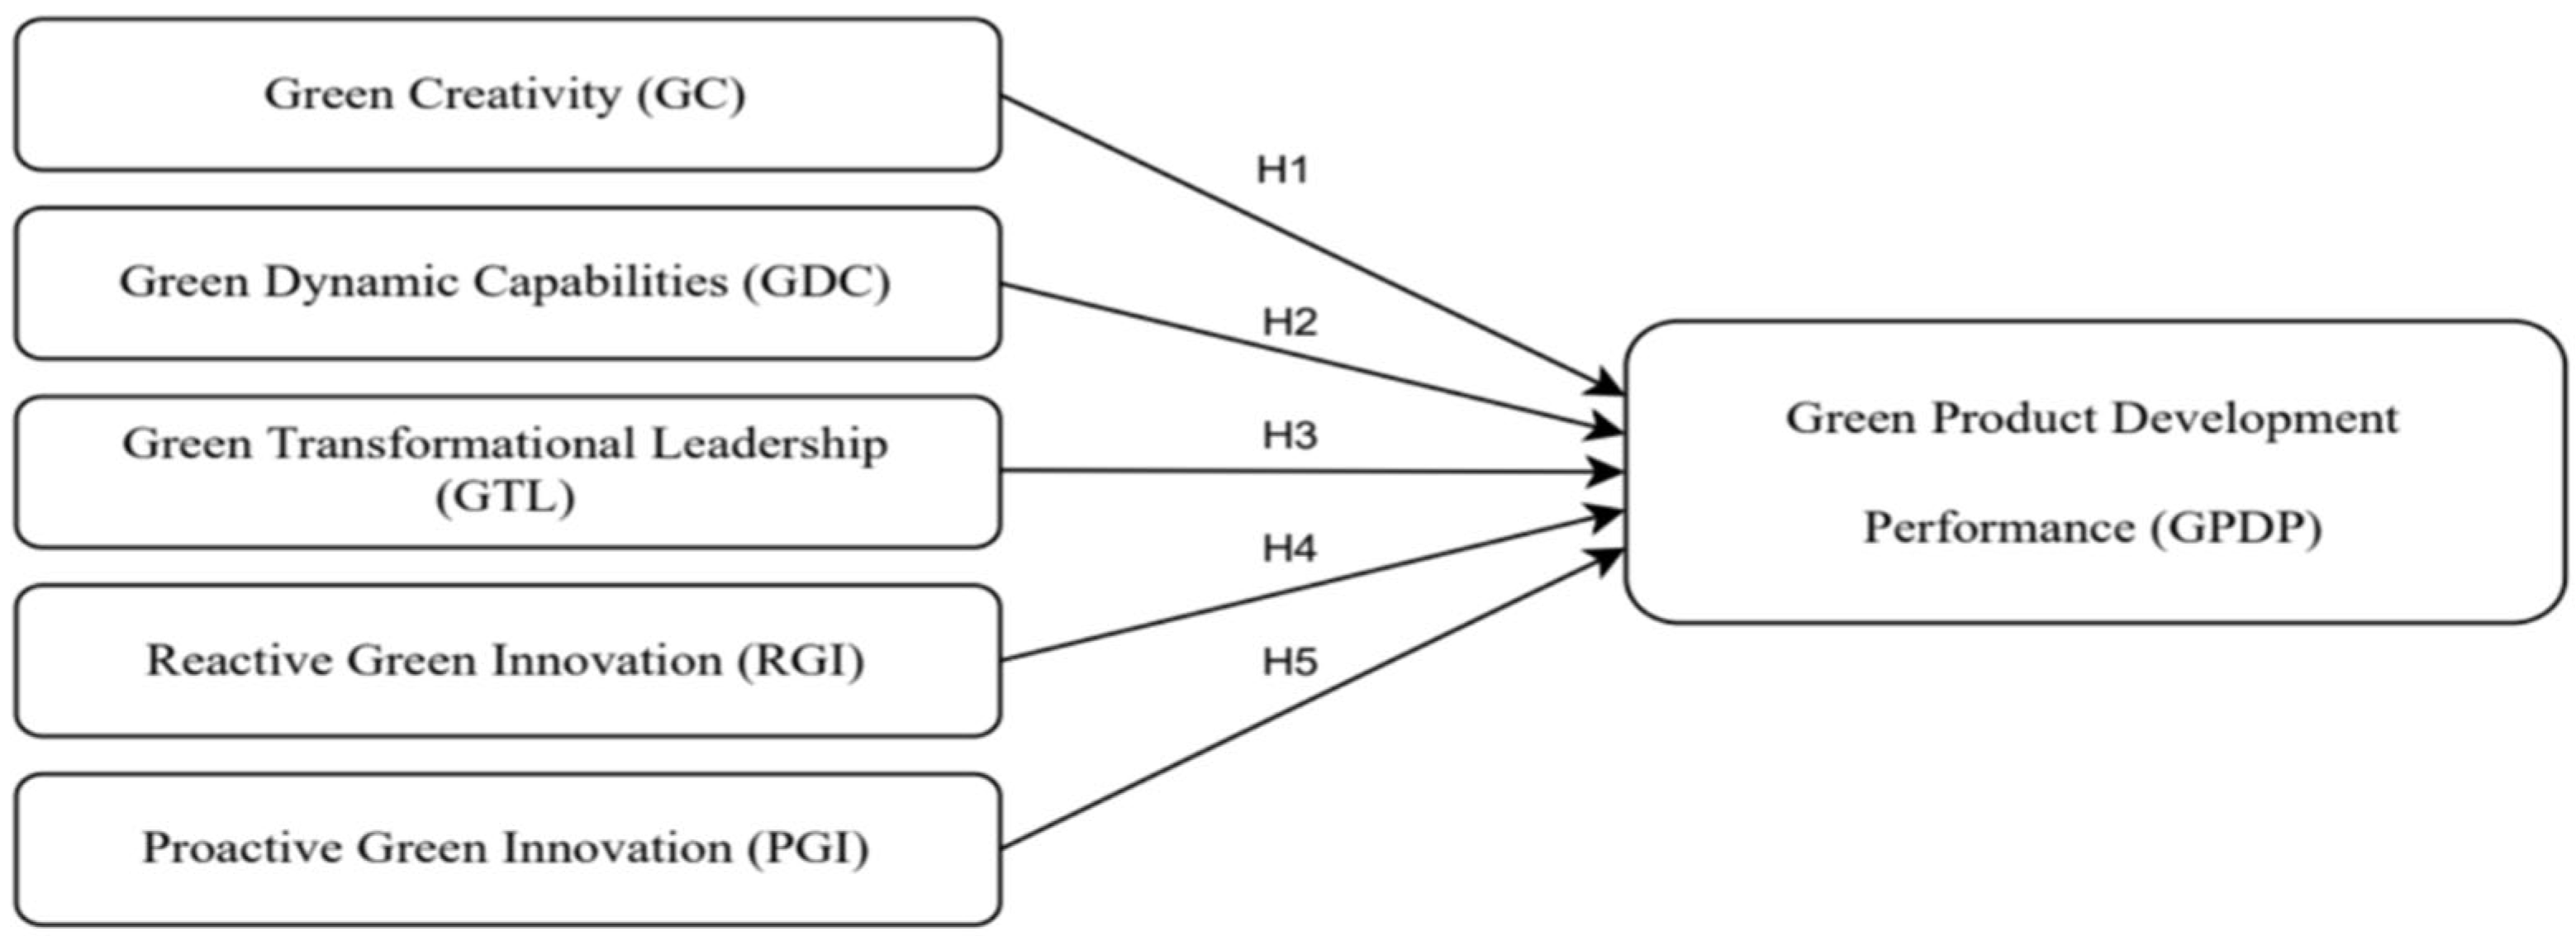
| Hypotheses | Path | Explanatory Variables | Estimate | Standardized Regression Weights | S.E. | C.R. | p-Value | Results |
|---|---|---|---|---|---|---|---|---|
| H1 | GC → GPDP | Green creativity is positively related to green product development performance. | 0.544 | 0.437 | 0.084 | 6.865 | 0.000 | Accepted H1 |
| H2 | GDC → GPDP | Green dynamic capabilities is positively related to green product development performance. | 0.366 | 0.211 | 0.068 | 5.724 | 0.000 | Accepted H2 |
| H3 | GTL → GPDP | Green transformational leadership is positively related to green product development performance. | 0.615 | 0.874 | 0.079 | 8.631 | 0.000 | Accepted H3 |
| H4 | RGI → GPDP | Reactive green innovation is positively related to green product development performance. | 0.270 | 0.260 | 0.073 | 4.167 | 0.000 | Accepted H4 |
| H5 | PGI → GPDP | Proactive green innovation is positively related to green product development performance. | 0.523 | 0.455 | 0.081 | 5.375 | 0.000 | Accepted H5 |
Publisher’s Note: MDPI stays neutral with regard to jurisdictional claims in published maps and institutional affiliations. |
© 2022 by the authors. Licensee MDPI, Basel, Switzerland. This article is an open access article distributed under the terms and conditions of the Creative Commons Attribution (CC BY) license (https://creativecommons.org/licenses/by/4.0/).
Share and Cite
Luan, N.T.; Hau, D.N.D.; Thu, N.T.A. The Influence of Green Product Development Performance to Enhance Enterprise Effectiveness and Innovation. Economies 2022, 10, 113. https://doi.org/10.3390/economies10050113
Luan NT, Hau DND, Thu NTA. The Influence of Green Product Development Performance to Enhance Enterprise Effectiveness and Innovation. Economies. 2022; 10(5):113. https://doi.org/10.3390/economies10050113
Chicago/Turabian StyleLuan, Nguyen Trong, Doan Nguyen Duy Hau, and Nguyen Thi Anh Thu. 2022. "The Influence of Green Product Development Performance to Enhance Enterprise Effectiveness and Innovation" Economies 10, no. 5: 113. https://doi.org/10.3390/economies10050113
APA StyleLuan, N. T., Hau, D. N. D., & Thu, N. T. A. (2022). The Influence of Green Product Development Performance to Enhance Enterprise Effectiveness and Innovation. Economies, 10(5), 113. https://doi.org/10.3390/economies10050113