Abstract
Ecuador’s credit unions or COACs play a key role inside the local economy, and the pandemic period has shown the weakness of the entities. Understanding the efficiency of the country’s largest COACs and the different factors related to it can provide important information for policymakers and the sector in general. Therefore, our main goal was the evaluation of technical efficiency and the factors that influenced it during the years from 2009 to 2020 which included the pandemic period. For this, the DEA model was applied with production and intermediation focus, and this was applied to 19 COACs from the first segment of the sector. Findings reveal that the level of technical efficiency was larger in the pre-pandemic than the pandemic period. Efficient credit unions were characterized by higher profitability, low levels of liquidity and portfolio coverage, and a high rate of financial intermediation, among others, through the pre-pandemic period; however, debt restructuring was one the most important characteristics of nonefficient Credit Unions. The most important contribution of this study is the possible projection of different decisions that will allow the COACs to improve their role in the system given all the difficulties that the pandemic is causing around the world.
1. Introduction
The expansion of the cooperative and noncooperative banking sector has an important effect on the economy as a whole (Harimaya et al. 2015), primarily because of its important social function (Haq et al. 2010; Martínez-Campillo et al. 2017; Van Damme et al. 2016; Wijesiri et al. 2017), and there are a wide range of technical tools available to support an accurate assessment of this sector. Technical efficiency is an indicator used to assess the vulnerability of banks (Igan et al. 2022), intervention policies (Stewart et al. 2016), deregulation in the financial markets (Harimaya et al. 2015), the accelerated cost increases (Wijesiri et al. 2017), and the likelihood of possible bankruptcy (Adusei 2016).
In Ecuador, the Ministry of Social Welfare, through the Directorate of Cooperatives, controlled 4000 financial and nonfinancial organizations from 1961 to 2012, where the group of the largest financial institutions (39 savings and credit cooperatives (COACs) and 1 central caja) was directly supervised by the Superintendence of Banks and Insurance (SBS). As a result, this prevented the control, monitoring, and sizing of the space occupied by the cooperative sector within the national financial system (Ruiz and Egüez 2014). In 2012, with the creation of the Superintendence of Popular and Solidarity Economy (SEPS), the registration process began, through a cadaster, which allowed the identification of all organizations and, on this basis, the generation of a supervision and monitoring plan, implementing preventive and control measures that contributed to the strengthening of the sector (Superintendencia de Economía Popular y Solidaria 2020).
In 2020, the credit portfolio and public deposits of the Popular and Solidarity Financial System represented 12.9% and 14.5% of the gross domestic product (GDP), respectively (Superintendencia de Economía Popular y Solidaria 2020). According to the latest official registry of the current cadaster (2020), the Popular and Solidarity Economy (EPS) sector is made up of 15,695 organizations, of which 522 (3.3%) are entities of the Popular and Solidarity Financial Sector (SFPS), including COACs and a central caja (Superintendencia de Economía Popular y Solidaria 2020).
With the promulgation of the Organic Monetary and Financial Code in 2014 (Second Supplement. Official Register Nº 332; as 12 September 2014) and the creation of the Monetary and Financial Policy and Regulation Board (JPRMF), the new segmentation for the SFPS was defined, dividing it into five segments according to the volume of assets, where segment 1 encompasses COACs with assets of more than 80 million USD. As of December 2020, these 39 cooperatives, which barely represent 7.5% of the SFPS, but register a total of 5,433,708 members (67% of the SFPS), had a loan portfolio of 9913 million USD (79% of the SFPS), together with assets of 14,375 million USD (81% of the SFPS) (Superintendencia de Economía Popular y Solidaria 2020).
In Ecuador’s credit union sector, economic growth has been observed in general (Marchio 2009). However, this sector has also been characterized by problems such as (a) forced liquidations due to lack of liquidity, (b) noncompliance with the corporate purpose, and (c) inadequate portfolio management. This made it necessary for the SEPS to intervene, having liquidated 359 SFPS entities to date (Superintendencia de Economía Popular y Solidaria 2020). This confirms the need to constantly evaluate their efficiency as an indicator for monitoring. The problems faced by this sector in Ecuador are not different from those of other countries, which, through the analysis of efficiency, try to identify the factors for the poor performance of the COACs (Asawaruangpipop and Suwunnamek 2014; Haq et al. 2010; Kipesha 2012).
The method used to measure the efficiency of the traditional banking sector does not seem to be the most appropriate way to evaluate a sector that pursues objectives beyond profitability and profit (Asawaruangpipop and Suwunnamek 2014; Haq et al. 2010; Hassan et al. 2012). To measure efficiency in Ecuador, univariate criteria have been used to measure efficiency on the basis of a single indicator (Marchio 2009), which involves a limited process of analysis (Athanassopoulos and Ballantine 1995; Marchio 2009; Wijesiri et al. 2017).
Globally, the effect of the pandemic has had a negative impact on the financial efficiency of lending institutions and has led to a change in the structure of lending in these institutions (Zheng and Zhang 2021). However, the impact of the pandemic on single entities depends on specific conditions (Colak and Öztekin 2020).
Currently, the scientific studies published on the measurement of technical efficiency in the Ecuadorian COACs with a multivariate approach are insufficient, and even more so those that evaluate technical efficiency through the use of nonparametric models. Therefore, the objective of this paper was to evaluate the technical efficiency of the Ecuadorian COACs that are a part of segment 1 (according to the SEPS classification) and the factors that influenced it during the period 2009–2020, with the linear programming technique called data envelopment analysis (DEA), applying two approaches: intermediation and production.
DEA and the technical efficiency (TE) for each decision-making unit (DMU) are considered powerful tools utilized for benchmarking and performance in general. DEA uses two different orientations: toward input variables where inputs are minimized, and toward the maximization of the output variables, as described in the next section (Wang et al. 2021, 2022). The application of the DEA model for the measurement of efficiency in banks or credit unions constitutes a proposal that covers the analysis of the entity in several aspects at the same time. It allows identifying the factors that have a direct impact on the entities that present lower levels of efficiency according to the main financial indicators, allowing them to improve their performance and reach optimal levels of operation (Gao et al. 2021).
2. Methodology
The calculations carried out were divided into two steps: (a) first, the technical efficiency of the COACs was determined using the DEA model under the production and intermediation approaches during the period 2009–2020; (b) second, the factors that had a statistically significant influence (p < 0.10) on technical efficiency were analyzed, using the methodology applied by SEPS and SBS, for the determination of financial indicators such as liquidity, profitability, capital vulnerability, portfolio yield, structure, and asset quality. Depending on the approach considered for the DEA analysis, the statistical significance was evaluated by classifying the COACs in efficiency ranges, after which an analysis of variance (ANOVA) of models and parameters was performed together with the use of Tukey’s HSD test.
2.1. Collection of Information
For the calculation of efficiency, the annual financial information available to the public from the financial control agencies was used to temporarily evaluate each COAC with secondary information provided by the Superintendency of Banks and Insurance during the period 2009–2012 (Superintendencia de Bancos 2022) and the current control entity, SEPS (period 2013–2020), with which a data matrix was constructed with the same information for each COAC, with similar variables for inputs and outputs (Martínez-Campillo et al. 2017; Van Damme et al. 2016). The analysis and its conclusions were approached on an annual basis, so that the technological changes adopted by the savings and credit cooperative sector in recent years could influence whether a COAC that is not efficient in 1 year would be efficient in the following year(s) (Sufian and Noor 2009).
2.2. Cooperative Selection
The COACs, candidates for evaluation, belong to the SFPS, which, according to the classification established by the JPRMF, are segmented into five clusters (segments). To obtain stable results (Wijesiri et al. 2017), we used information from the COACs corresponding to segment 1 of this classification. These COACs have a greater number of assets and loan portfolios, obligations to the public, results, and operating expenses than the other four segments (Superintendencia de Economía Popular y Solidaria 2020).
The assets of segment 1 entities across all years are disparate and show large differences (Superintendencia de Economía Popular y Solidaria 2020). However, this aspect was ignored given the statistical method. In addition, the COACs that did not remain in segment 1 throughout the proposed study period (2009–2020) were excluded from the analysis.
As a result, 19 entities complied with the proposed premises. This number of COACs exceeded the minimum allowing robust estimates to be obtained in the calculation of efficiency (Cooper et al. 2007; Van Damme et al. 2016). However, the use of bootstrap techniques allowed mitigating the shortcomings due to a small data size and the presence of some outliers, thus avoiding a bias in the calculation of efficiency (Wijesiri et al. 2017).
2.3. Mathematical Model
The model was built on the basis of data envelopment analysis (Charnes et al. 1978). Considering n productive units, such as the COACs, which produce “yi” units of an output but with “xki” units of the k-th input, being these in turn m inputs, the model with output orientation maximizes the latter (Equation (1); if the orientation were input, it would prioritize the minimization of input use (Martínez-Campillo et al. 2017). Therefore, the equation to maximize would be
This applies under the following conditions:
The model proposed here is based on that of Charnes et al. (1978), where θi is the proportional increase in output that can be realized for the i-th productive unit, and λj corresponds to the use of the inputs. If the restriction (Equation (2)) was discarded, then constant returns to scale would be obtained. In addition, the level of the production frontier for the i-th COAC was calculated using Equation (3).
Thus, the measure of the technical efficiency (TE) of the i-th COAC was calculated by means of the ratio shown in Equation (4).
2.4. Analysis of the Model, Parameter Assumptions, and Restrictions
The determination of efficiency involves assuming two types of models (Martínez-Campillo et al. 2017; Sravani 2015): (a) the model under constant returns to scale (CRS), known as the global technical efficiency (Wijesiri et al. 2017), and (b) the model under variable returns to scale (VRS) (Hassan et al. 2012), with which the scale efficiency (SE) can be found. Once the overall technical efficiency is determined, it can be divided into two aspects: the pure technical efficiency and the scale efficiency, where both are mutually exclusive and not additive, but multiplicative (Surender 2013; Wijesiri et al. 2017). Pure technical efficiency reflects deviations from the optimal frontier of each unit due to inefficient management (Surender 2013). In this work, both CRS and VRS models were used to determine the technical efficiency.
The DEA model when identifying the variables—input(s) and/or output(s)—makes it necessary to choose the approach under which this identification is established. First of all, the production approach, from a business point of view, assumes that the COACs use several production factors with the aim of providing a greater quantity of services under advantageous conditions (Barra et al. 2013; Martínez-Campillo et al. 2017; Rosman et al. 2014). One of the criticisms of this approach is that it does not take into account interest costs, which in some countries could be a significant proportion of expenditure (Sanjeev 2006).
Secondly, the intermediation approach considers COACs as financial intermediaries (Asawaruangpipop and Suwunnamek 2014; Wijesiri et al. 2017) between the suppliers of money and the demanders of these resources with a profit on the side (Gutiérrez-Nieto et al. 2007; Martínez-Campillo et al. 2017), where the relationship between deposits (input) and portfolio or loans (output) is clear (Sanjeev 2006). Unlike the first approach, this second approach does consider interest as part of the expense, which is a classic feature of the financial activity of both banks and COACs (Sanjeev 2006).
The variables selected for the determination of the model were as follows: (i) size, represented by total assets: TA (Asawaruangpipop and Suwunnamek 2014; Garden and Ralston 1999; Glass et al. 2014a; Wijesiri et al. 2017); (ii) social capital: CS (Glass et al. 2014a, 2014b; Martínez-Campillo et al. 2017); (iii) operating expenditure: GO (Asawaruangpipop and Suwunnamek 2014; Haq et al. 2010; Van Damme et al. 2016; Wijesiri et al. 2017); (iv) total deposits: TD (Asawaruangpipop and Suwunnamek 2014; Garden and Ralston 1999; Glass et al. 2014a; Haq et al. 2010; Martínez-Campillo et al. 2017; Oteng-Abayie et al. 2011); (v) total portfolio: TC (Asawaruangpipop and Suwunnamek 2014; Garden and Ralston 1999; Glass et al. 2014a; Haq et al. 2010; Martínez-Campillo et al. 2017; Spulbar et al. 2015; Van Damme et al. 2016; Wijesiri et al. 2017).
When the production approach was used, TC and TD were used as output variables, while GO and TA were used as inputs. When the intermediation approach was used, TC was used as the only output variable, while TD and CS were used as inputs. For the calculation of technical efficiency with bootstrap simulations, the R© program version 3.3.3 was used (R Foundation for Statistical Computing, Vienna, Austria), together with the rDEA© package. Subsequently, SPSS software (IBM Corp. Released 2012. IBM SPSS Statistics for Windows, Version 21.0. Armonk, NY, USA: IBM Corp.) was used for statistical analysis of the results.
2.5. Factor Identification
The identification of efficient COACs corresponded to those COACs whose technical efficiency (VRS) showed a value of 1 (Martínez-Campillo et al. 2017). It is of interest to recognize which factors determine the differences between the efficient COACs and the rest, using the financial ratios presented monthly by the SBS and SEPS control agency, according to time periods. In addition to the ratios or variables related to credit and liquidity risks, other variables were considered related to profitability (Pasiouras 2008; Sufian 2006), size (Isik and Hassan 2003; Rosman et al. 2014), and capitalization (Casu and Girardone 2004; Sufian and Noor 2009), in addition to the main accounts, which are part of the statements of position and income.
3. Results
3.1. Technical Efficiency According to Approaches, COACs, and Years
The technical efficiency (VRS), either with the production approach or with the intermediation approach, during the period 2009–2020, showed values in the range of 70–99% (Figure 1).
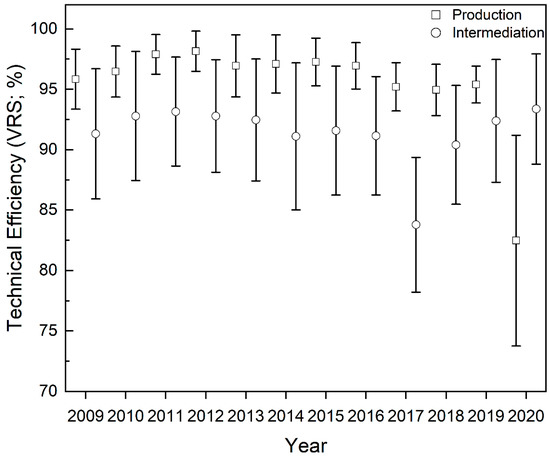
Figure 1.
Mean and 95% confidence intervals of the technical efficiency (VRS) of all the COACs studied, under the production and intermediation approaches, during the period (2009–2020).
The value of efficiency depends on the approach, and, in its evolution, it is easy to observe the effect of the pandemic. Its value was always higher with the production approach (0.96 ± 0.014) than with the intermediation approach (0.90 ± 0.037) before the pandemic. However, efficiency with the production approach was atypically low for the year 2020, in addition to having a behavior different from the normal one described recently. On the other hand, the production approach seemed to show an increasing trend until 2012, before decreasing until 2013 and, thereafter, remaining stable; with the intermediation approach, it grew until 2011, decreased until 2014 and, thereafter, showed some stability. In general, technical efficiency decreased from 2017 onward, which was notably accentuated in 2020 due to the pandemic, when the lowest values were observed for technical efficiency using the production approach (Figure 1).
When technical efficiency was analyzed in each financial institution (Table 1), it was observed that the COACs “Jardín Azuayo” and “CACPE Biblián” showed the highest values under both approaches and for more years than the rest. In general, the average technical efficiency VRS (TEVRS) and CRS (TECRS), as well as SE, were above 90% for the intermediation or production approaches during the years studied (2009–2020). In all cases, the average value of efficiency (VRS and CRS) with the production approach was higher than with the intermediation approach until the onset of the pandemic.

Table 1.
(a) Technical efficiency (TEVRS and TECRS) and scale efficiency (SE), with the intermediation (I) approach, from 2009 to 2020, in the COACs under study. (b) Technical efficiency (TEVRS and TECRS) and scale efficiency (SE), with the production (P) approach, from 2009 to 2020, in the COACs under study.
The two COACs analyzed maintained technical efficiency levels (VRS) equal to 1, both with the intermediation approach and with the production approach, during all years despite the pandemic period.
During the study period, the percentage of efficient COACs was always higher with the production approach than with the intermediation approach (Figure 2), and the largest differences were observed during the years 2012 and 2013, a trend that was reversed in 2018 and accentuated during the following 2 years.
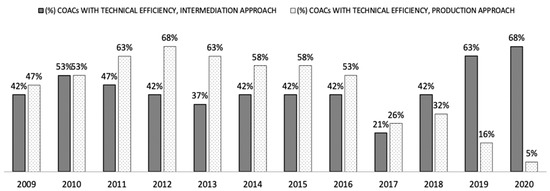
Figure 2.
COACs with technical efficiency (%, VRS = 1) under production and intermediation approaches per year.
3.2. Main Determinants of Technical Efficiency, by Approach
The DEA model applied to the data determined that the coverage of the consumer portfolio was significant during some years, depending on the approach. With the production approach (Table 2), the coverage of the consumer portfolio was significant in 2014, while, with the intermediation approach (Table 3), this coverage was significant in 2012.
Table 2.
Statistically significant financial indicators (factors) under the production approach.
Table 3.
Statistically significant financial indicators (factors) under the intermediation approach.
The liquidity indicator, one of the most important indicators linked to management, presented a significant result with the production approach and with the intermediation approach.
On the other hand, the delinquency indicator of the portfolio, both commercial and consumer, had a different behavior depending on the approach. Under the production approach (Table 2), commercial delinquency was not significant; conversely, consumer portfolio delinquency was significant only in 2011. Under the intermediation approach (Table 3), neither commercial nor consumer delinquencies were significant. In other words, it was generally found that delinquencies in both the consumer and the commercial portfolios were not significant under any approach, which could indicate that these indicators are not relevant for defining an efficient COAC.
The delinquencies of both the housing and the microcredit portfolios were also significant depending on the approach and the years analyzed. For example, according to the production approach, housing portfolio delinquency was statistically significant for the years 2010 and 2011 (Table 2), while microenterprise portfolio delinquency was statistically significant only for the year 2010. On the other hand, when considering the intermediation approach (Table 3), the delinquency of the microenterprise portfolio was significant for the years 2011 and 2013, while the housing portfolio was not significant for any year. Therefore, the influence of delinquencies, both housing and microcredit, despite being significant factors, appeared to be of little relevance during all the years considered in the study.
For the years 2009–2012, according to the production approach, in addition to liquidity, capital vulnerability indicators were significant in determining efficient COACs. In 2010, again the group of capital vulnerability indicators accompanied the delinquency indicators to identify efficient COACs. In subsequent years, the structure changed slightly. In 2011, in addition to the delinquency and capital vulnerability indicators, the portfolio coverage indicator was also added. However, in 2012, the significant indicators were different from those of previous years and concerned microeconomic efficiency, basically focused on the structure of expenditure.
During the subsequent years (2013–2016), the indicators related to capital vulnerability were significant in determining whether a COAC was efficient or not. During this same period, with the exception of 2014, the liquidity indicator was always significant. The portfolio coverage indicators were also significant during these years with the exception of 2015. In this same year, the indicators of asset structure and quality and profitability also stood out. In 2016, in addition to the liquidity, capital vulnerability, and portfolio coverage indicators, the asset structure and quality indicator was also added.
For the 2017–2020 period, operating/staff expenses were statistically significant. This was in addition to the significance of available funds during the same period. In the latter and with the exception of 2017, the ratio was always higher for efficient entities compared to inefficient ones. However, the year 2020 revealed statistical significance in a financial ratio called “restructured loan portfolios”, which was statistically higher in inefficient entities. Capitalization was also lower in inefficient institutions.
Nevertheless, if we consider the intermediation model (Table 3), during the period 2009–2012, the significant factors were again more than those of credit and liquidity risk. In the case of 2009, the significant indicators for the COACs were to a greater extent those related to asset structure and quality, than those of microeconomic efficiency, equity vulnerability, and portfolio performance itself.
In 2010, the most significant factors were those related to profitability, where the ROA (return on assets) and ROE (return on profits) ratios made up this group. However, it seems logical to point out that indicators of capital vulnerability were no longer relevant and, in their place, microeconomic efficiency, portfolio performance, asset structure and quality, and financial intermediation stood out. Regarding this last group, it should be noted that this is the first time in the analysis that the only indicator directly related to intermediation was significant, which was precisely related to the application of the DEA model with an intermediation approach.
For 2011, in addition to the credit risk indicators, the indicators of capital vulnerability, profitability, microeconomic efficiency, asset structure and quality, and intermediation were also significant. Lastly, during the first period of the analysis (2009–2012), in 2012, the statistically significant indicators corresponded to those related to capital vulnerability, including technical equity and portfolio yield, as well as asset structure and quality and, again, intermediation.
For the second period (2013–2016), the composition of the indicators changed. In 2013, the indicators corresponding to asset structure and quality were the most prominent; in addition, that of financial intermediation was also significant. For the year 2014, together with the credit risk and liquidity indicators, those related to asset structure and quality were also significant to a greater extent, as well as those of capital vulnerability, portfolio yield, and financial intermediation.
In 2015, unlike previous years, with the intermediation approach, there was a drastic decrease in significant factors; only the liquidity and intermediation indicators were significant. Subsequently, in 2016, financial intermediation was the only significant indicator.
In the following period (2017–2020), operating expenses were significant, and earnings ratios were always higher for technically efficient entities. Among other results in Table 3, in the pandemic year, problem portfolio coverage was on average at least three times higher in the less efficient entities, which could be related to portfolio restructuring in the production approach.
4. Discussion
The existence of efficient Ecuadorian COACs has already been described by Haq et al. (2010) by comparing 39 entities in Asia, Africa, and Latin America, applying the DEA model with the intermediation and product-oriented production approaches, where the overall average technical efficiency under the intermediation approach was much higher than that of the intermediation approach. Despite the fact that the literature has always described a higher efficiency under the production approach versus the intermediation approach due to the methodology applied, the average technical efficiency under the production approach was 0.79, much higher than that of the intermediation approach (0.45) (Haq et al. 2010).
The results show the relationship between technical efficiency and liquidity, demonstrating statistically that the higher the economic resources of the COACs that have not been adequately inserted in the financial business through the level of placements, the lower their efficiency (Adusei 2016). An inverse relationship was observed between efficiency and liquidity, which in turn is related to the high financial intermediation scores of the COACs classified as efficient.
The results show that credit risk has not proven to be a significant factor in determining technical efficiency (Adusei 2016). The low influence of arrearage over time could be observed, despite its relationship with loan coverage, which, in turn, showed an inverse relationship with efficiency. The latter is necessarily linked to profitability indicators, whether ROA or ROE, since the direct relationship between profitability and efficiency is substantial (Adusei 2016). Along the same lines, it has been observed that a lower operating cost was positively related to efficiency (Haq et al. 2010), which confirms the search for greater profitability by efficient COACs.
To date, much of the literature consulted has shown that the largest and best capitalized COACs are the most efficient (Glass et al. 2014a; Wijesiri et al. 2017); however, results are shown here that contradict this assertion. It seems that larger size negatively affects technical efficiency, while capital has no effect (Adusei 2016). They are even less capitalized, implying higher financial risk (Martínez-Campillo et al. 2017). The latter evidence coincides with our results, given that capitalization levels showed an inverse and significant relationship with efficiency. In the same sense, the structure and quality of assets were always directly related to efficiency in a general way.
We cannot overlook that some external economic event will necessarily affect the operation and efficiency of these types of financial entities, since they are part of the economic fabric and even more so in the presence of a pandemic (Martínez-Campillo et al. 2017). The changes observed during the periods 2009–2012 and 2013–2016, in relation to the way in which different factors affect efficiency, could indicate that state intervention, through the respective control body (SEPS), generated structural changes in the COACs, such that, in order to maintain or increase efficiency, the necessary adjustments in different ratios were modified over time. The need to intervene and control these types of financial entities, as an adequate means to raise efficiency levels, has already been pointed out by Adusei (2016).
The results presented here reveal that the weakness of the financial cooperative system, related to the placement of money, specifically financial efficiency, in general terms was affected, which is consistent with what has been observed in several Asian countries (Zheng and Zhang 2021). This effect would not only affect the loans made by the entities, but also those to be made (Colak and Öztekin 2020). There is evidence that financial institutions with better liquidity buffers had and will have a better performance in the face of the pandemic (Simoens and Vennet 2021); therefore, it is worrying that institutions with better efficiency have less liquidity even though they carried out less debt restructuring than less efficient institutions.
5. Conclusions
Technical efficiency under the two approaches was generally high and in line with theory, although the pandemic period changed this structure in 2020. On average, overall efficiency and scale efficiency were higher with the production approach than with the intermediation approach, with this relationship reversing in the last year of the study.
The trend observed in efficient COACs in keeping equity performance indicators low indicates how the rapid movement of the business allows for adequate management of resources, without falling into greater risks, which in turn benefits other ratios such as profitability, which, despite not being transcendental given the purpose of COACs in the financial market, are an indicator of efficiency. However, the pandemic makes it necessary to review these indicators again.
The technical efficiency found in the COACs analyzed suggests that some of their economic practices could serve as a reference for the solidarity financial market in Ecuador’s Austro, at least before the pandemic. Until a study of the efficiency of all segments of this financial system is available, the most efficient COACs in segment 1 of the SFPS could serve as a reference regarding their performance with respect to credit risk and liquidity ratios. This is a niche study proposed in this paper along the same lines of technical efficiency.
Author Contributions
C.S.T.-I. and C.V.-H., conceptualization, writing—original draft preparation; C.V.-H., G.E.G.-V., and R.V.G.-V., methodology; C.S.T.-I. and G.E.G.-V., formal analysis; A.J.A.-d.J., supervision, validation, and writing—review and editing. All authors read and agreed to the published version of the manuscript.
Funding
This research received no external funding.
Institutional Review Board Statement
Not applicable.
Informed Consent Statement
Not applicable.
Data Availability Statement
Data supporting reported results can be found using the following links: for years 2009–2014, https://estadisticas.seps.gob.ec/index.php/estadisticas-sfps/ (accessed on 15 February 2022); for years 2015–2020, https://estadisticas.superbancos.gob.ec/portalestadistico/portalestudios/?page_id=322 (accessed on 16 February 2022).
Acknowledgments
The authors are grateful for the general support from the Universidad del Azuay through the postgraduate department. They would like to specifically thank the director of this research project and those who contributed with important criteria that enabled the completion of this work. The authors would finally like to thank classmates and friends of parallel B of the Master in Integral Auditing and Financial Risk Management, especially Mauro, Gabriel, Alexandra, Nelly, and Alex.
Conflicts of Interest
The authors declare no conflict of interest.
References
- Adusei, Michael. 2016. Determinants of bank technical efficiency: Evidence from rural and community banks in Ghana. Cogent Business & Management 3: 1. [Google Scholar] [CrossRef]
- Asawaruangpipop, Poramate, and Opal Suwunnamek. 2014. Analysis on Savings and Credit Cooperatives Efficiency in Thailand: A Data Envelopment Analysis (DEA) Approach. Research Journal of Business Management 8: 242–53. [Google Scholar] [CrossRef][Green Version]
- Athanassopoulos, Antreas D., and Joan A. Ballantine. 1995. Ratio and Frontier Analysis for Assessing Corporate Performance: Evidence from the Grocery Industry in the UK. The Journal of the Operational Research Society 46: 427–40. [Google Scholar] [CrossRef]
- Barra, Cristian, Sergio Destefanis, and Giuseppe Lubrano Lavadera. 2013. Regulation and the Crisis: The Efficiency of Italian Cooperative Banks, Centre for Studies in Economics and Finance (CSEF), Working Paper No. 338. Available online: https://www.csef.it/WP/wp338.pdf (accessed on 16 February 2022).
- Casu, Barbara, and Claudia Girardone. 2004. Financial conglomeration: Efficiency, productivity and strategic drive. Applied Financial Economics 14: 687–96. [Google Scholar] [CrossRef]
- Charnes, Abraham, William W. Cooper, and Edwardo Rhodes. 1978. Measuring the efficiency of decision making units. European Journal of Operational Research 2: 429–44. [Google Scholar] [CrossRef]
- Colak, Gonul, and Özde Öztekin. 2020. The Impact of COVID-19 Pandemic on Bank Lending around the World. Journal of Banking and Finance 133: 106207. [Google Scholar] [CrossRef]
- Cooper, William W., Lawrence M. Seiford, and Kaoru Tone. 2007. Data Envelopment Analysis. A Comprehensive Text with Models, Applications, References and DEA-Solver Software. New York: Springer. [Google Scholar]
- Gao, Penghui, William Secor, and Cesar L. Escalante. 2021. U.S. agricultural banks’ efficiency under COVID-19 Pandemic conditions: A two-stage DEA analysis. Paper presented at the Agricultural & Applied Economics Association Annual Meeting, Austin, TX, USA, August 1–3. [Google Scholar]
- Garden, Kaylee A., and Deborah E. Ralston. 1999. The x-efficiency and allocative efficiency effects of credit union mergers. Journal of International Financial Markets, Institutions and Money 9: 285–301. [Google Scholar] [CrossRef]
- Glass, J. Colin, Donal G. McKillop, and Barry Quinn. 2014a. Modelling the Performance of Irish Credit Unions, 2002 to 2010. Financial Accountability & Management 30: 430–53. [Google Scholar]
- Glass, J. Colin, Donal G. McKillop, Barry Quinn, and John Wilson. 2014b. Cooperative bank efficiency in Japan: A parametric distance function analysis. The European Journal of Finance 20: 291–317. [Google Scholar] [CrossRef]
- Gutiérrez-Nieto, Begoña, Carlos Serrano-Cinca, and Cecilio Mar-Molinero. 2007. Microfinance institutions and efficiency. Omega 35: 131–42. [Google Scholar] [CrossRef]
- Haq, Mamiza, Michael Skully, and Shams Pathan. 2010. Efficiency of Microfinance Institutions: A Data Envelopment Analysis. Asia-Pac Financ Markets 17: 63–97. [Google Scholar] [CrossRef]
- Harimaya, Kozo, Kei Tomimura, and Nobuyoshi Yamori. 2015. Efficiencies of Small Financial Cooperatives in Japan: Comparison of Estimation Methods. Kobe: Research Institute for Economics & Business Administration, Kobe University. [Google Scholar]
- Hassan, M. Kabir, Benito Sánchez, and Geoffrey Ngene. 2012. Scales and technical efficiencies in Middle East and North African (MENA) micro financial institutions. International Journal of Islamic and Middle Eastern Finance and Management 5: 157–70. [Google Scholar] [CrossRef]
- Igan, Deniz, Ali Mirzaei, and Tomoe Moore. 2022. Does macroprudential policy alleviate the adverse impact of COVID-19 on the resilience of banks? Journal of Banking & Finance, 106419. [Google Scholar] [CrossRef]
- Isik, Ihsan, and M. Kabir Hassan. 2003. Efficiency, Ownership and Market Structure, Corporate Control and Governance in the Turkish Banking Industry. Journal of Business Finance & Accounting 30: 1363–421. [Google Scholar]
- Kipesha, Erasmus Fabian. 2012. Efficiency of Microfinance Institutions in East Africa: A Data Envelopment Analysis. European Journal of Business and Management 4: 77–88. [Google Scholar]
- Marchio, Nick A. 2009. Are credit unions in Ecuador achieving economies of scale? Honors Projects. Paper 20: 1–34. [Google Scholar]
- Martínez-Campillo, Almudena, Yolanda Fernández-Santos, and María del Pilar Sierra-Fernández. 2017. Eficiencia técnica en las cooperativas de crédito españolas: Una aproximación al impacto de la crisis. Spanish Journal of Finance and Accounting/Revista Española de Financiación y Contabilidad 46: 484–506. [Google Scholar] [CrossRef]
- Oteng-Abayie, Eric Fosu, Kofi Amanor, and Joseph Magnus Frimpong. 2011. The Measurement and Determinants of Economic Efficiency of Microfinance Institutions in Ghana: A Stochastic Frontier Approach. African Review of Economics and Finance 2: 149–66. [Google Scholar]
- Pasiouras, Fotios. 2008. Estimating the technical and scale efficiency of Greek commercial banks: The impact of credit risk, off-balance sheet activities, and international operations. Research in International Business and Finance 22: 301–18. [Google Scholar] [CrossRef]
- Rosman, Romzie, Norazlina Abd Wahab, and Zairy Zainol. 2014. Efficiency of Islamic banks during the financial crisis: An analysis of Middle Eastern and Asian countries. Pacific-Basin Finance Journal 28: 76–90. [Google Scholar] [CrossRef]
- Ruiz, María José, and Santiago Egüez. 2014. Un aporte a la discusión sobre profundización financiera en el Ecuador desde las cooperativas de ahorro y crédito; Quito: Superintendencia de Economía Popular y Solidaria, Intendencia de Estadisticas, Estudios y Normas.
- Sanjeev, Gunjan M. 2006. Data Envelopment Analysis (DEA) for Measuring Technical Efficiency of Banks. The Journal of Business Perspective 10: 13–27. [Google Scholar] [CrossRef]
- Simoens, Mathieu, and Rudi Vander Vennet. 2021. Does diversification protect European banks’ market valuations in a pandemic? Finance Research Letters 44: 102093. [Google Scholar] [CrossRef]
- Spulbar, Cristi, Mihai Nitoi, and Lucian Anghel. 2015. Efficiency In Cooperative Banks And Savings Banks: A Stochastic Frontier Approach. Romanian Journal of Economic Forecasting XVIII: 5–21. [Google Scholar]
- Sravani, M. 2015. Performance Evaluation of MFIs in India-A study measuring technical efficiency of selected MFIs in India. IOSR Journal of Business and Management 17: 80–85. [Google Scholar]
- Stewart, Chris, Roman Matousek, and Thao Ngoc Nguyen. 2016. Efficiency in the Vietnamese banking system: A DEA double bootstrap approach. Research in International Business and Finance 36: 96–111. [Google Scholar] [CrossRef]
- Sufian, Fadzlan. 2006. The efficiency of Islamic banking industry: A non-parametric analysis with non-discretionary input variable. Islamic Economic Studies 14: 54–87. [Google Scholar]
- Sufian, Fadzlan, and Mohamad Akbar Noor Mohamad Noor. 2009. The determinants of Islamic banks’ efficiency changes: Empirical evidence from the MENA and Asian banking sectors. International Journal of Islamic and Middle Eastern Finance and Management 2: 120–38. [Google Scholar] [CrossRef]
- Superintendencia de Bancos. 2022. Plan de Cuentas y Catalogos: Activo y Pasivo; Quito: SBS. Available online: https://www.superbancos.gob.ec/bancos/catalogo-de-cuentas/ (accessed on 16 February 2022).
- Superintendencia de Economía Popular y Solidaria. 2020. Rendición de Cuentas. SEPS. Available online: https://www.seps.gob.ec/wp-content/uploads/Rendicion-Cuentas-2020.pdf (accessed on 16 February 2022).
- Surender, Singh. 2013. Technical efficiency and its determinants in microfinance institutions in India: A firm level analysis. Journal of Innovation Economics & Management 1: 15–31. [Google Scholar]
- Van Damme, Patrick, Mahinda Wijesiri, and Michele Meoli. 2016. Governance and Efficiency of Microfinance Institutions: Empirical Evidence from Sri Lanka. South Asia Economic Journal 17: 236–47. [Google Scholar] [CrossRef]
- Wang, Chia-Nan, Kristofer N. Imperial, Ching-Chien Huang, and Thanh-Tuan Dang. 2022. Output Targeting and Runway Utilization of Major International Airports: A Comparative Analysis Using DEA. Mathematics 10: 551. [Google Scholar] [CrossRef]
- Wang, Chia-Nan, Ngoc-Ai-Thy Nguyen, Thanh-Tuan Dang, and Thi-Thuy-Quynh Trinh. 2021. A Decision Support Model for Measuring Technological Progress and Productivity Growth: The Case of Commercial Banks in Vietnam. Axioms 10: 131. [Google Scholar] [CrossRef]
- Wijesiri, Mahinda, Jacob Yaron, and Michele Meoli. 2017. Assessing the financial and outreach efficiency of microfinance institutions: Do age and size matter? Journal of Multinational Financial Management 40: 63–76. [Google Scholar] [CrossRef]
- Zheng, Chen, and Junru Zhang. 2021. The impact of COVID-19 on the efficiency of microfinance institutions. International Review of Economics & Finance 71: 407–23. [Google Scholar]
Publisher’s Note: MDPI stays neutral with regard to jurisdictional claims in published maps and institutional affiliations. |
© 2022 by the authors. Licensee MDPI, Basel, Switzerland. This article is an open access article distributed under the terms and conditions of the Creative Commons Attribution (CC BY) license (https://creativecommons.org/licenses/by/4.0/).