The Influence of Family Governance on the Value of Chinese Family Businesses: Signal Transmission Effect of Financial Performance
Abstract
:1. Introduction
2. Theoretical Analysis and Research Hypotheses
2.1. Concept Definition
2.1.1. Family Business
2.1.2. Family Governance
2.1.3. Financial Performance
2.1.4. Enterprise Value
2.2. Conceptual Framework
2.3. Research Hypotheses
2.3.1. Family Governance and Corporate Value
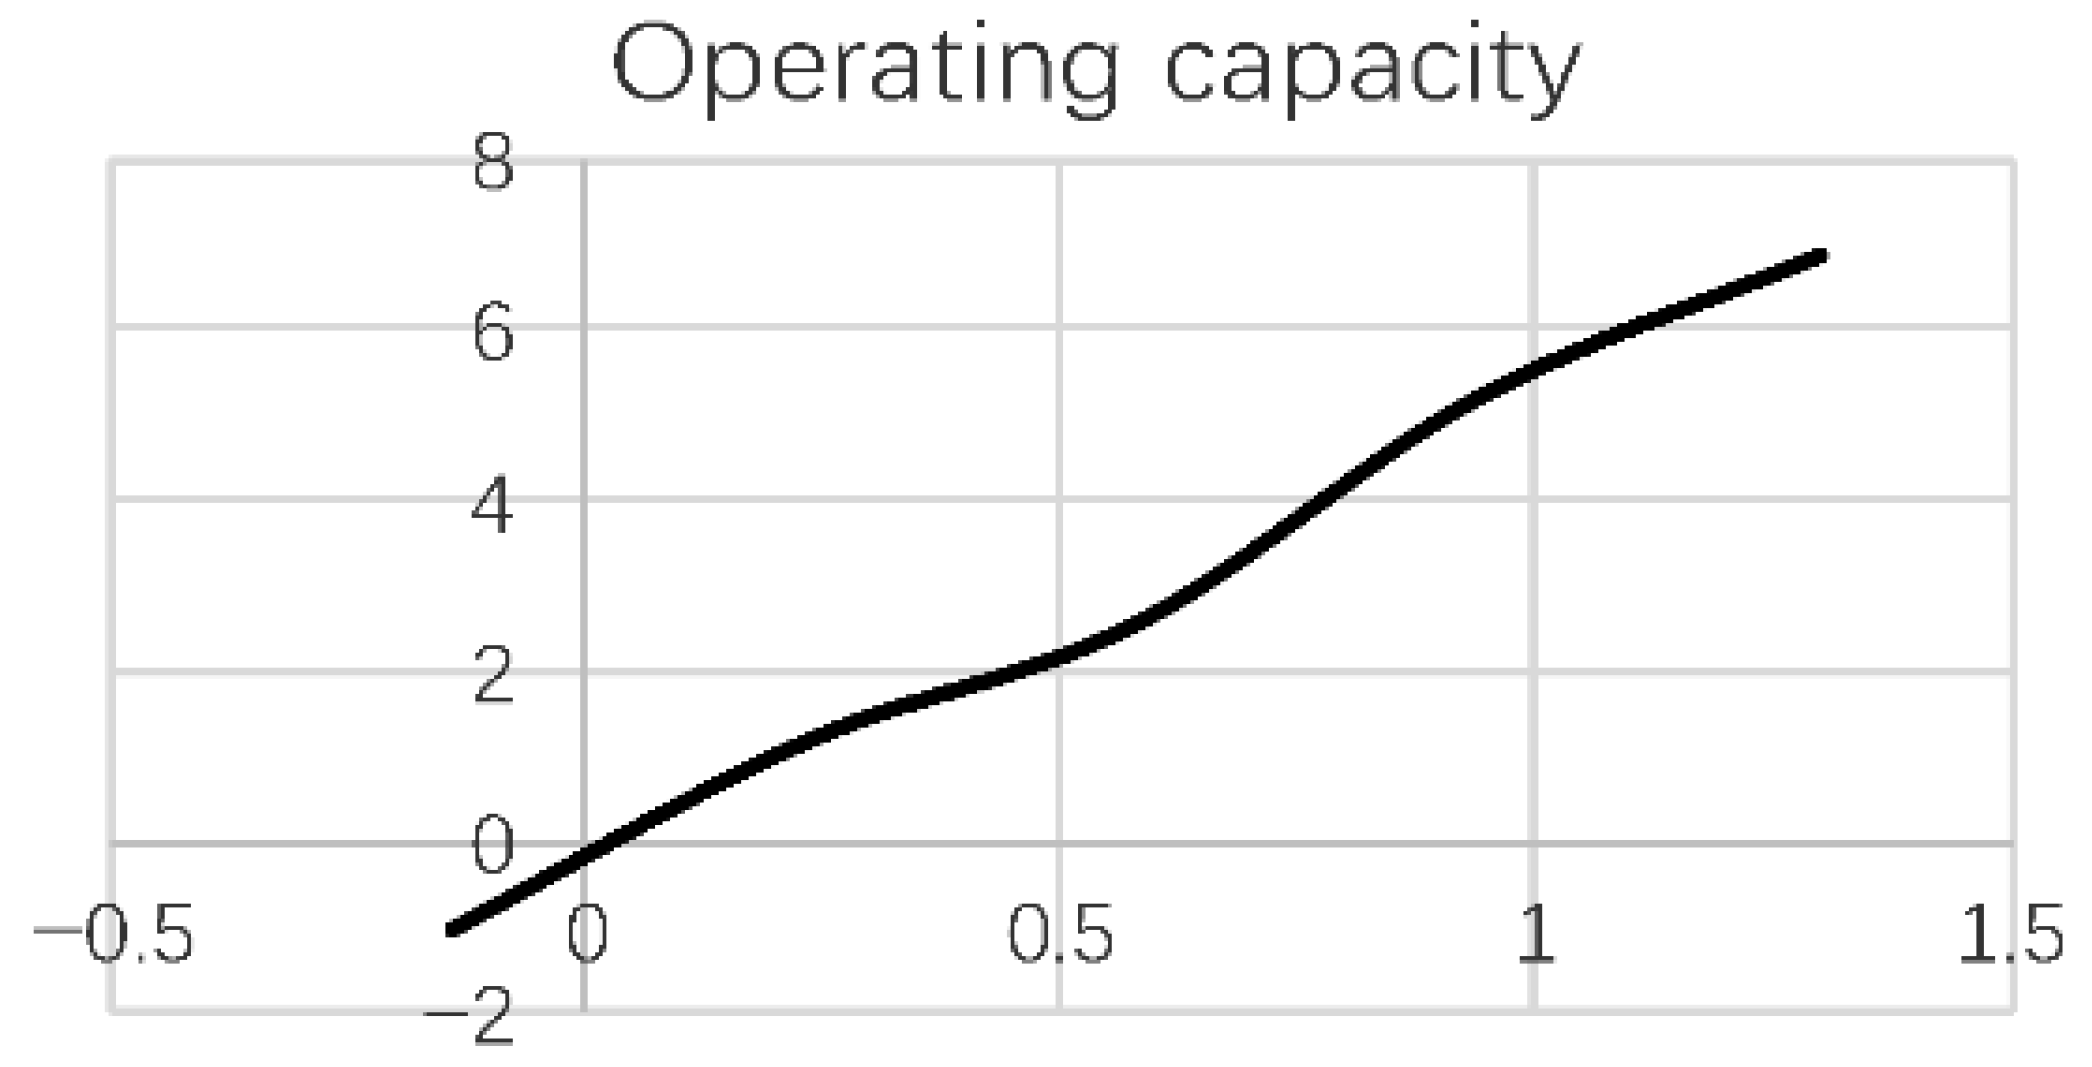
2.3.2. The Signaling Role of a Company’s Operating Capacity
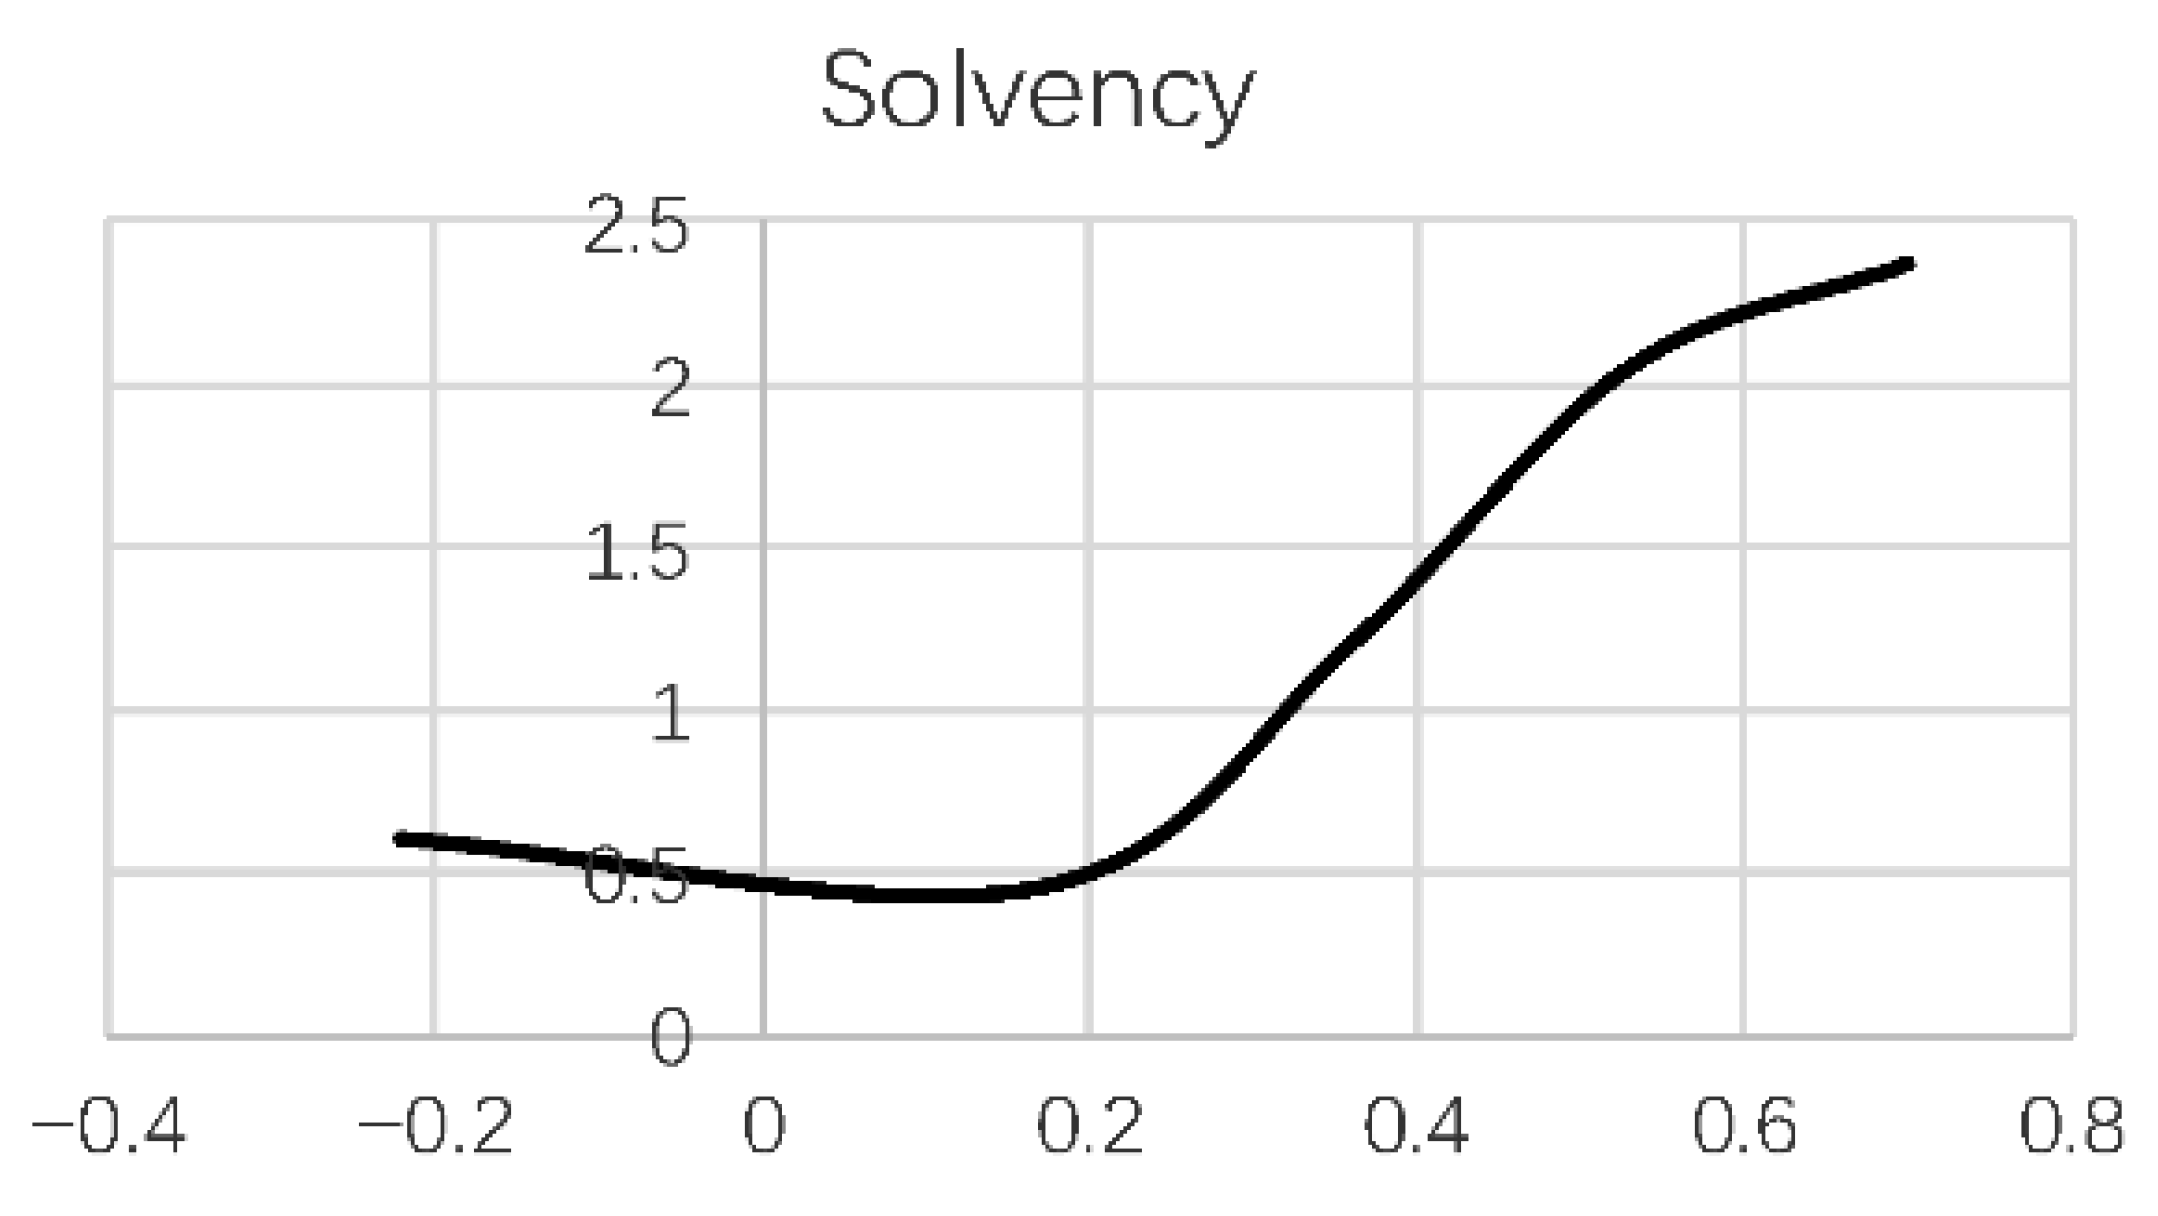
2.3.3. The Signaling Role of the Company’s Solvency
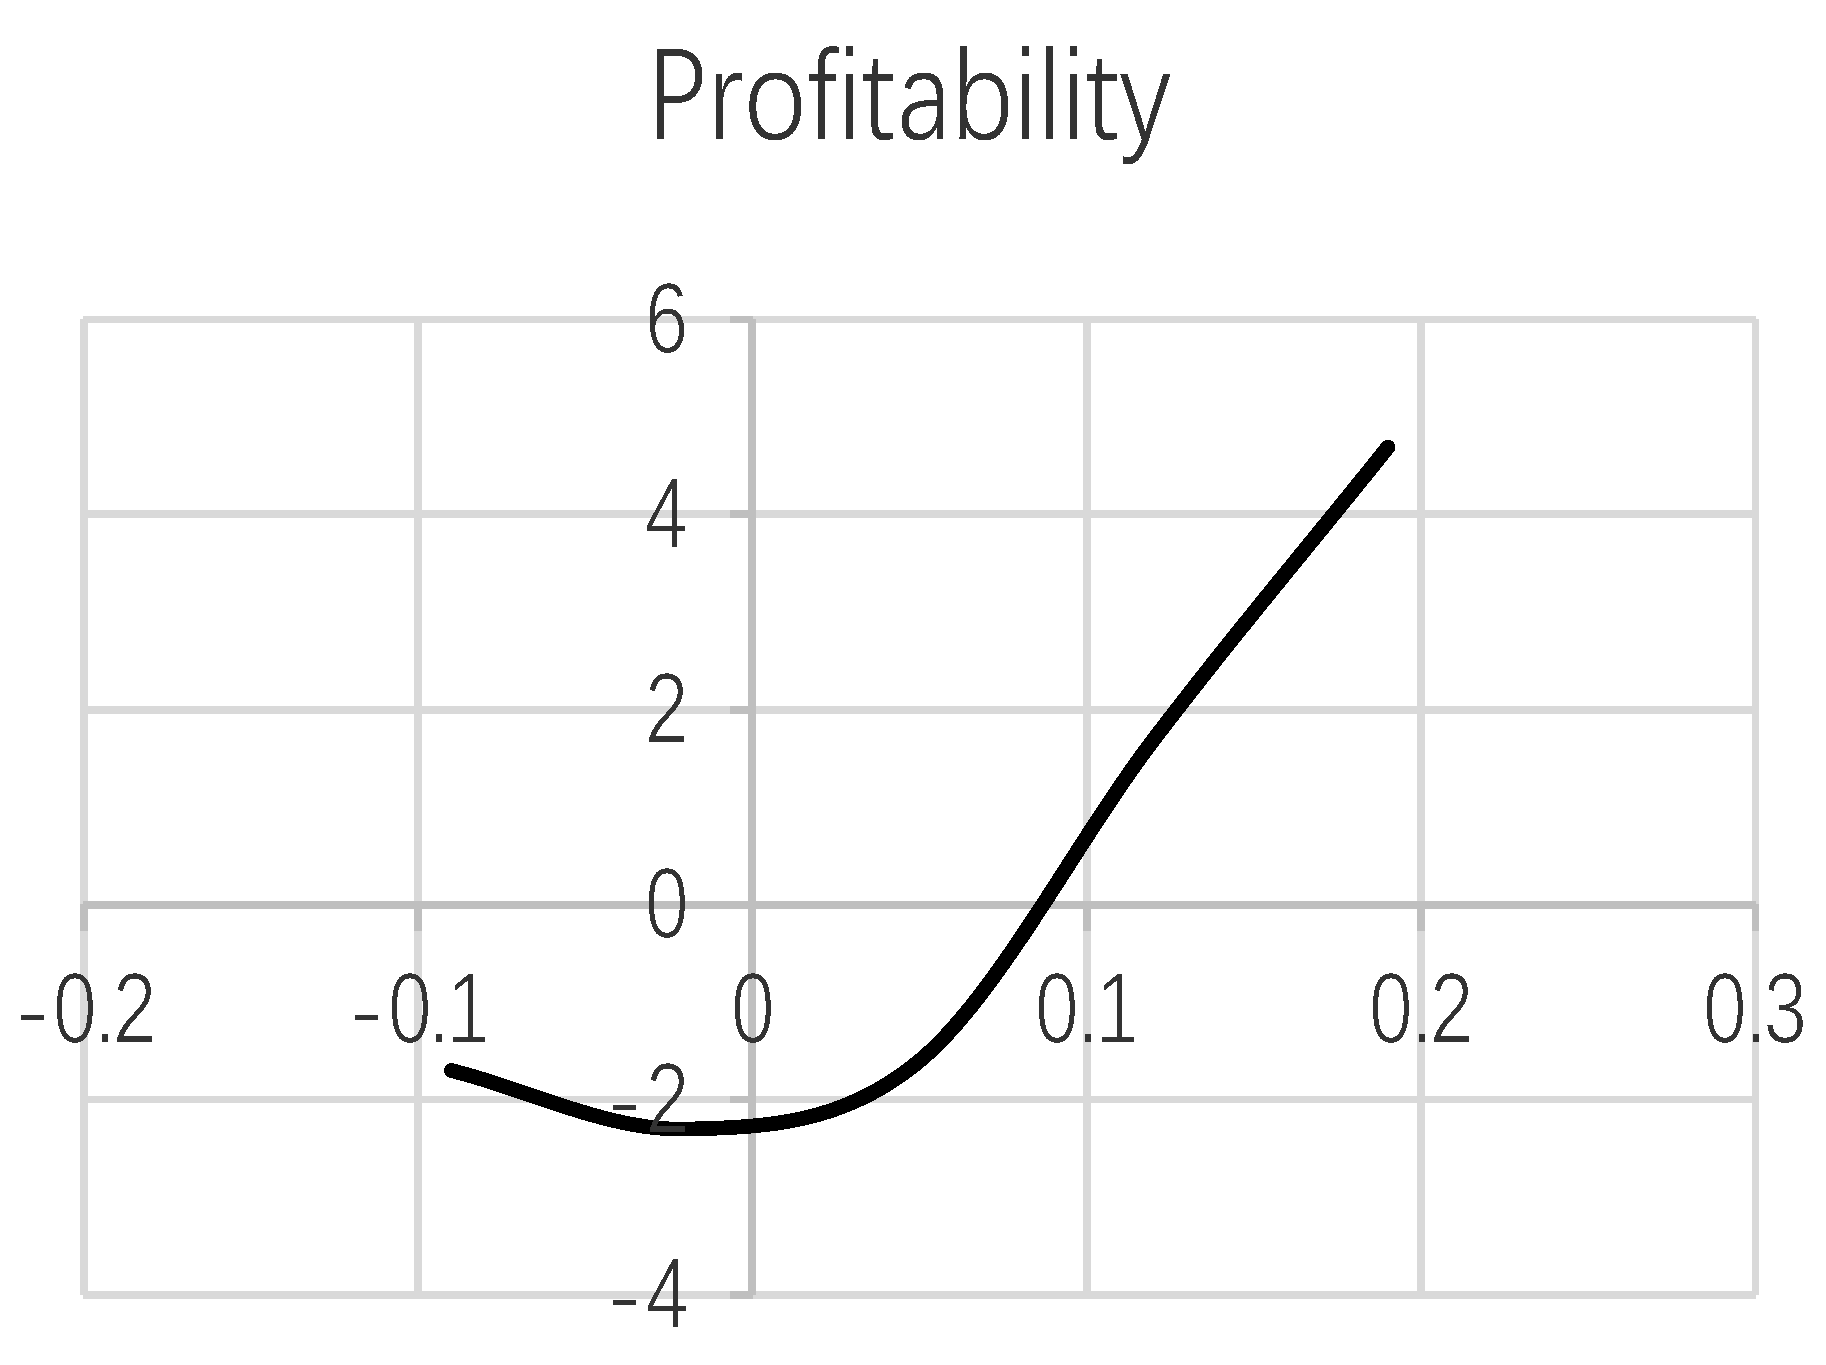
2.3.4. The Signaling Role of Corporate Profitability
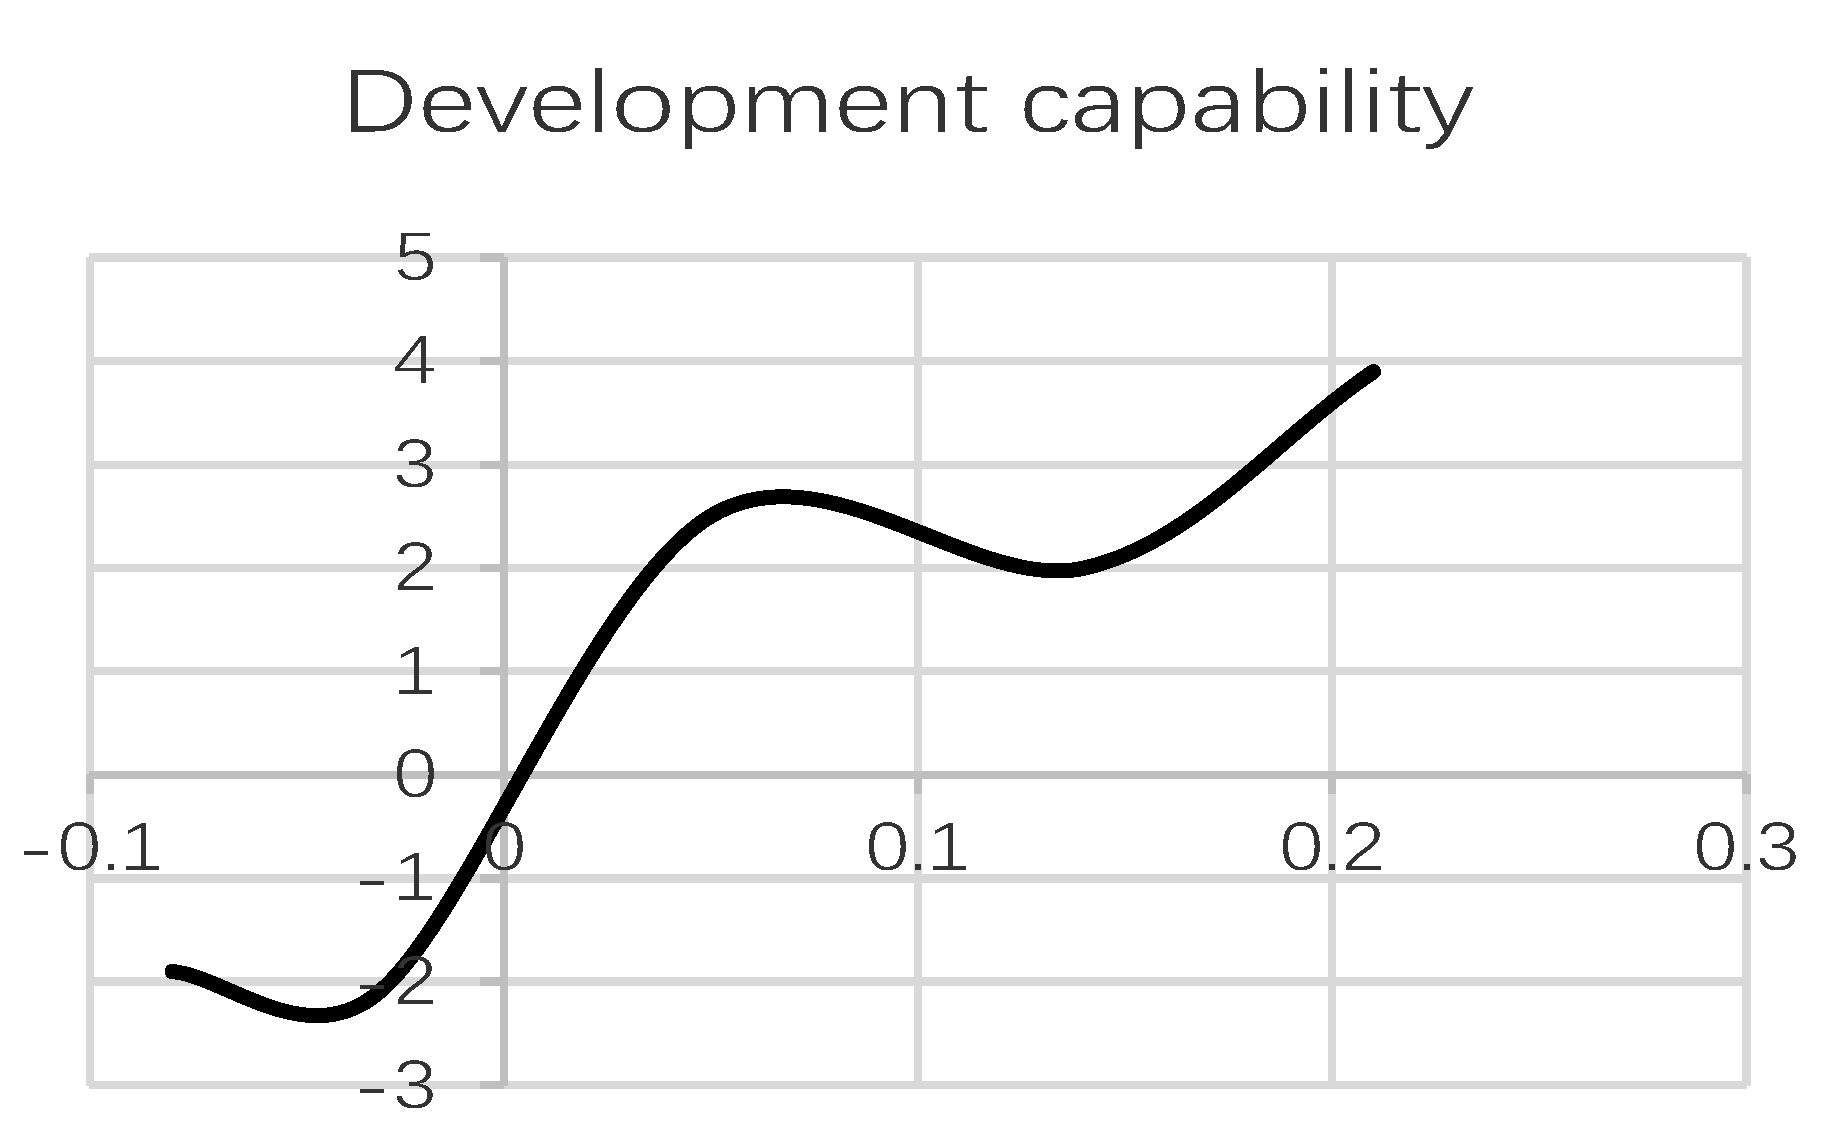
2.3.5. The Signaling Role of Enterprise Development Capability
3. Research Design
3.1. Sample Selection
3.2. Variable Selection
3.2.1. Dependent Variable
3.2.2. Independent Variables
3.2.3. Moderator Variables
3.2.4. Control Variables
3.3. Model Setting
4. Empirical Analyses
4.1. Descriptive Statistics
4.2. Correlation Analysis
4.3. Regression Analysis
4.4. Financial Performance Signal Function Test
4.5. Robustness Test
4.6. Further Analysis
5. Discussion and Conclusions
5.1. Discussion
5.2. Conclusions
Funding
Institutional Review Board Statement
Informed Consent Statement
Data Availability Statement
Conflicts of Interest
References
- Ahn, He Soung, EuiBeom Jeong, and Hyejin Cho. 2021. Toward an understanding of family business sustainability: A network-based systematic review. Sustainability 13: 5. [Google Scholar] [CrossRef]
- Amore, Mario Daniele, Danny Miller, Isabelle Le Breton-Miller, and Guido Corbetta. 2017. For Love and Money: Marital Leadership in Family Firms. Journal of Corporate Finance 46: 461–76. [Google Scholar] [CrossRef]
- Cano-Rubio, Myriam, Guadalupe Fuentes-Lombardo, and Manuel Carlos Vallejo-Martos. 2017. Influence of the lack of a standard definition of “family business” on research into their international strategies. European Research on Management & Business Economics 23: 132–46. [Google Scholar]
- Chemmanur, Thomas J., Gang Hub, Chaopeng Wu, Shinong Wu, and Zehao Yan. 2020. Transforming the management and governance of private family firms: The role of venture capital. Journal of Corporate Finance 66: 101828. [Google Scholar] [CrossRef]
- Chen, Jian Lin, Xin Jun Feng, and Rui Qin Li. 2020. Does The family business promote innovation or hinder innovation? Debate and integration. Foreign Economy and Management 40: 140–52. [Google Scholar]
- Chua, Jess H., James J. Chrisman, and Pramodita Sharma. 1999. Defining family business by behavior. Entrepreneurship Theory and Practice 26: 113–30. [Google Scholar] [CrossRef]
- Connelly, Brian L., S. Trevis Certo, R. Duane Ireland, and Christopher R. Reutze. 2011. Signaling theory: A review and assessment. Journal of Management 37: 39–67. [Google Scholar] [CrossRef]
- Costa, Joana. 2020. Innovation and internationalization as efficiency engines for family businesses: Analyzing the case of Portugal. In Intrapreneurship and Sustainable Human Capital. Cham: Springer, pp. 249–67. [Google Scholar]
- Croci, Ettore, John A. Doukas, and Halit Gonenc. 2011. Family control and financing decisions. European Financial Management 17: 860–97. [Google Scholar] [CrossRef] [Green Version]
- Davis, Peter S., and Paula D. Harveston. 2001. The phenomenon of substantive conflict in the family firm: A cross-generational study. Journal of Small Business Management 39: 14–30. [Google Scholar] [CrossRef]
- Fali, Ibrahim, Terzungwe Nyor, and Olumide Lateef Mustapha. 2020. Financial Risk and Financial Performance of listed Insurance Companies in Nigeria. European Journal of Business and Management 12: 143–53. [Google Scholar]
- Fan, Zuo Bing, Sheng Ling Li, and Min Lv. 2017. Research on the Influence of Board Structure on the Performance of Family Businesses: Taking Listed Family Businesses as an Example. Journal of Hangzhou Dianzi University (Social Science Edition) 13: 28–33. [Google Scholar]
- Gallucci, Carmen, Rosalia Santulli, Michele Modina, and Michela De Rosa. 2020. The role of family governance beyond financial ratios: An integrated perspective on family firms’ survival. Journal of Financial Management Markets and Institutions 8: 1–27. [Google Scholar] [CrossRef]
- Gatuhu, Rosemary N. 2013. The Effect of Credit Management on the Financial Performance of Microfinance Institutions in Kenya. Master’s dissertation, University of Nairobi, Nairobi, Kenya. Unpublished work. [Google Scholar]
- Gu, Lulu, Liang Cai, and Yue Lei. 2017. Family governance, alteration of ownership and firm innovation: Empirical study based on Chinese family-owned firms. Management Science 30: 39–53. [Google Scholar]
- Hategan, Camelia-Daniela, Ruxandra-Ioana Curea-Pitorac, and Vasile-Petru Hategan. 2019. The Romanian family businesses philosophy for performance and sustainability. Sustainability 11: 1715. [Google Scholar] [CrossRef] [Green Version]
- Hayes, Andrew F., and Jörg Matthes. 2009. Computational procedures for probing interactions in OLS and logistic regression: SPSS and SAS Implementations. Behavior Research Methods 41: 924–36. [Google Scholar] [CrossRef] [Green Version]
- He, Xiao Gang, Xin Chun Li, and Yan Ling Lian. 2011. Power Concentration of family members and corporate performance: Research on listed family business. Management Sciences 14: 86–96. [Google Scholar]
- Leopizzi, Rossella, Simone Pizzi, and Fabrizio D’Addario. 2021. The Relationship among Family Business, Corporate Governance, and Firm Performance: An Empirical Assessment in the Tourism Sector. Administrative Sciences 11: 8. [Google Scholar] [CrossRef]
- Li, J. W., Y. Yuan, and D. A. Gan. 2017. A study on the relationship between family culture and innovation investment of family firms. Science and Technology Management Research 37: 31–36. [Google Scholar]
- Li, Xin, Tie Nan Wang, and Fan Hao Hao. 2016. Investors’ Reaction to R&D Investment: The Signal Effect of Corporate Financial Status. China Soft Science 12: 121–31. [Google Scholar]
- Mai, Wenzhen, and Nik Intan Norhan binti Abdul Hamid. 2021. Short-Selling and Financial Performance of SMEs in China: The Mediating Role of CSR Performance. International Journal of Financial Studies 9: 22. [Google Scholar]
- Miller, Danny, Isabelle Le Breton-Miller, Alessandro Minichilli, Guido Corbetta, and Daniel Pittino. 2014. When do Non-Family CEOs Outperform in Family Firms? Agency and Behavioral Agency Perspectives. Journal of Management Studies 51: 547–72. [Google Scholar] [CrossRef]
- Ni, Hu Ping, and Zhao Ke Wang. 2005. The Influence of “Wu Lun” Thinking in the Chinese family on the Family Business Organization. Journal of Zhejiang Technology and Business University 2: 77–81. [Google Scholar]
- Rovelli, Paola, Marcos Ferasso Alfredo De Massis, and Sascha Krausa. 2021. Thirty Years of Research in Family Business Journals: Status Quo and Future Directions. Journal of Family Business Strategy 6: 100422. [Google Scholar] [CrossRef]
- Spence, Michael. 1978. Job Market Signaling. Uncertainty in Economics 87: 281–306. [Google Scholar] [CrossRef]
- Villalonga, Belen, and Raphael Amit. 2006. How Do Family Ownership, Control and Management Affect Firm Value? Journal of Financial Economics 80: 385–417. [Google Scholar] [CrossRef] [Green Version]
- Wahyudi, Indra, Arif Imam Suroso, Bustanul Arifin, Rizal Syarief, and Meika Syahbana Rusli. 2021. Multidimensional Aspect of Corporate Entrepreneurship in Family Business and SMEs: A Systematic Literature Review. Economies 9: 156. [Google Scholar] [CrossRef]
- Xie, Hui Li, Jing Ye Cheng, and Lu Lin Zhang. 2019. The Influence of Family Control Characteristics on R&D Investment. Journal of Financial and Accounting Monthly 2: 63–71. [Google Scholar]
- Xie, Tao. 2015. The Evolutionary Game of Chinese Family Business Under the Background of External Environment Changes: A Comparative Analysis of The Nie, Rong and Feng Families. Economic Management 37: 53–64. [Google Scholar]
- Xu, Nian Xing, Rong Rong Xie, and Shi Nong Wu. 2019. Chinese-Style Family Business Management: Governance Model, Leadership Model and Company Performance. Economic Research 54: 165–81. [Google Scholar]
- Xu, Yu Peng. 2020. Will Husband and Wife Co-Governance Change the Cost Stickiness of Enterprises? Based on the Empirical Evidence of Chinese Family Listed Companies. Journal of Shanghai University of Finance and Economics 22: 100–22. [Google Scholar]
- Yao, Yu Jian. 2019. The Moderating Effect Between Family Involvement and Firm performance. Accounting Communication 24: 71–75. [Google Scholar]
- Ye, Chen Gang, Li Qiu, and Li Juan Zhang. 2016. Company Governance Structure, Internal Control Quality and Enterprise Financial Performance. Audit Research 3: 104–12. [Google Scholar]
- Zellweger, Thomas Markus, Robert S. Nason, and Mattias Nordqvist. 2012. From Longevity of Firms to Transgenerational Entrepreneurship of Families: Introducing Family Entrepreneurial Orientation. Family Business Review 25: 136–55. [Google Scholar] [CrossRef] [Green Version]
- Zhao, Chang Wen, Ying Kai Tang, Jing Zhou, and Hui Zou. 2008. Independent Directors and Corporate Value of Family Business: A Test of the Rationality of the Independent Director System of Chinese Listed Companies. Management World 8: 119–126+167. [Google Scholar]
- Zingales, Luigi. 2015. The “Cultural Revolution” in Finance. Journal of Financial Economics 117: 1–4. [Google Scholar] [CrossRef]


| Variable Name | Measure | |
|---|---|---|
| Independent variable | DUAL | DUAL was assigned a value of 1, and in other cases, DUAL was counted as 0. |
| Dependent variable | TQ | Company market value/total assets |
| Moderator | Operating Capability (TURNTA) | Sales revenue/total assets |
| Solvency (LEV) | Total liabilities/total assets | |
| Profitability (ROA) | Earnings Before Interest and Tax/total assets | |
| Development capacity (TAGR) | R&D/total assets | |
| Control variable | Firm size (Size) | ln (total assets at the end of the period) |
| Family age control (AGE) | Statistics of the current year—the year of family control | |
| Equity check and balance (SHRZ) | Total shareholding ratio of the second–fifth largest shareholder/shareholding ratio of the largest shareholder | |
| Age of family founders (FA) | Actual founder age of the family | |
| Number of family managers (FN) | Number of family members serving as managers in family businesses | |
| Industry (Ind) | The industry classification in the “Guidelines for Industry Classification of Listed Companies” issued by the CSRC | |
| Year (year) | Statistics of the current year |
| Min | Mean | P50 | Max | SD | |
|---|---|---|---|---|---|
| TQA | 0.31 | 2.34 | 1.81 | 11.01 | 1.85 |
| DUAL | 0.00 | 0.65 | 1.00 | 1.00 | 0.48 |
| TURNTA | 0.08 | 0.58 | 0.50 | 2.10 | 0.36 |
| LEV | 0.04 | 0.36 | 0.35 | 0.85 | 0.19 |
| ROA | −0.33 | 0.05 | 0.05 | 0.23 | 0.07 |
| TAGR | −0.35 | 0.24 | 0.12 | 2.55 | 0.43 |
| SHRZ | 0.36 | 2.54 | 1.51 | 20.42 | 3.14 |
| FA | 46 | 51.4 | 54 | 74 | 0.43 |
| FN | 4 | 10.8 | 14 | 21 | 0.30 |
| AGE | 2.21 | 5.31 | 5.00 | 20.00 | 3.96 |
| Variable | VIF | 1/VIF |
|---|---|---|
| DUAL | 1.03 | 0.93 |
| FA | 1.08 | 0.94 |
| FN | 1.03 | 0.92 |
| SHRZ | 1.07 | 0.96 |
| Size | 1.04 | 0.96 |
| AGE | 1.04 | 0.97 |
| Mean VIF | 1.05 | |
| TQ | DUAL | TURNTA | LEV | ROA | TAGR | SHRZ | FA | FN | AGE | |
|---|---|---|---|---|---|---|---|---|---|---|
| TQ | 1.000 | |||||||||
| DUAL | 0.265 *** | 1.000 | ||||||||
| TURNTA | −0.116 *** | −0.027 * | 1.000 | |||||||
| LEV | 0.025 * | 0.008 | 0.113 *** | 1.000 | ||||||
| ROA | 0.005 | 0.001 | −0.058 *** | −0.406 *** | 1.000 | |||||
| TAGR | 0.024 * | 0.016 | 0.110 *** | 0.042 *** | 0.079 *** | 1.000 | ||||
| SHRZ | −0.030 ** | 0.007 | 0.018 | 0.039 *** | 0.007 | −0.012 | 1.000 | |||
| FA | 0.044 *** | 0.126 *** | −0.076 *** | −0.055 *** | −0.037 *** | 0.016 | −0.140 | 1.000 | ||
| FN | 0.027 * | 0.081 * | 0.017 | 0.125 ** | −0.033 * | 0.203 | 0.089 * | 0.216 | 1.000 | |
| AGE | −0.003 | 0.001 | −0.001 | 0.006 | −0.005 | −0.001 | −0.004 | −0.001 | −0.171 | 1.000 |
| Model 1 | Model 2 | Model 3 | Model 4 | Model 5 | |
|---|---|---|---|---|---|
| Coefficient | Coefficient | Coefficient | Coefficient | Coefficient | |
| DUAL | 0.418 *** (4.04) | 0.319 * (1.63) | 0.220 * (1.74) | 0.181 * (1.83) | 0.188 *** (2.16) |
| TURNTA | 0.469 *** (2.72) | ||||
| LEV | 0.137 ** (2.41) | ||||
| ROA | 0.725 * (1.69) | ||||
| TAGR | 0.145 * (1.68) | ||||
| DUAL*TURNTA | 0.692 ** (2.16) | ||||
| DUAL*LEV | 1.069 *** (2.74) | ||||
| DUAL*ROA | 0.769 *** (3.62) | ||||
| DUAL*TAGR | 0.089 * (1.74) | ||||
| SHRZ | 0.176 (0.98) | 0.008 * (1.78) | 0.008 * (1.90) | 0.008 * (1.72) | 0.011 * (1.74) |
| FA | 0.214 *** (4.36) | 0.287 * (1.75) | 0.348 ** (2.19) | 0.329 * (1.66) | 0.310 * (1.65) |
| FN | 0.197 (1.02) | 0.236 ** (2.21) | 0.096 * (1.90) | 0.176 *** (3.09) | 0.280 *** (2.77) |
| AGE | 0.002 (0.26) | −0.018 * (−1.89) | −0.003 * (−1.66) | −0.002 (−1.28) | −0.008 * (−1.80) |
| Size | −0.665 *** (−24.03) | −0.903 *** (−9.45) | −0.929 *** (9.68) | −0.913 *** (−9.85) | −0.964 *** (−9.64) |
| _cons | 15.967 *** (25.18) | 21.837 *** (10.26) | 22.203 *** (9.78) | 21.893 *** (10.57) | 23.048 *** (10.34) |
| YEAR | Control | Control | Control | Control | Control |
| IND | Control | Control | Control | Control | Control |
| P | 0.001 | 0.001 | 0.001 | 0.002 | 0.001 |
| R2 | 0.136 | 0.119 | 0.131 | 0.120 | 0.128 |
| F | 134.91 | 22.67 | 37.14 | 27.49 | 19.81 |
| N | 4732 | 4737 | 4737 | 4737 | 4591 |
| Model 1 | Model 2 | Model 3 | Model 4 | Model 5 | |
|---|---|---|---|---|---|
| DUAL | 0.601 *** (2.60) | 0.207 *** (3.59) | 0.075 * (1.78) | 0.149 *** (2.66) | 0.011 *** (5.21) |
| TURNTA | 0.229 * (1.73) | ||||
| LEV | 0.587 *** (4.28) | ||||
| ROA | 2.761 *** (3.31) | ||||
| TAGR | 3.181 *** (3.91) | ||||
| DUAL*TURNTA | 0.311 * (1.65) | ||||
| DUAL*LEV | 0.391 * (1.65) | ||||
| DUAL*ROA | 0.125 ** (2.27) | ||||
| DUAL*TAGR | 1.118 ** (2.37) | ||||
| SHRZ | 0.011 *** (5.21) | 0.229 (1.33) | 0.359 *** (2.88) | 0.383 ** (2.07) | 0.467 *** (4.65) |
| FA | −0.587 *** (−11.28) | −0.001 (−0.27) | −0.582 *** (−11.05) | −0.004 (−0.11) | −0.573 *** (−10.78) |
| FN | −2.761 *** (−11.31) | 0.103 *** (3.62) | −2.781 *** (−11.42) | 0.099 *** (3.32) | −2.698 *** (−11.19) |
| AGE | 3.181 *** (3.91) | 0.205 * (1.78) | 3.169 *** (3.93) | 0.198 * (1.70) | 2.880 *** (3.64) |
| Size | 0.311 * (1.65) | 0.349 *** (4.02) | 0.308 * (1.66) | 0.350 *** (4.03) | 0.309 * (1.69) |
| _cons | 16.079 *** (14.52) | 0.019 (0.22) | 16.045 *** (14.52) | 0.018 (0.21) | 15.467 *** (13.37) |
| YEAR | Control | Control | Control | Control | Control |
| IND | Control | Control | Control | Control | Control |
| P | 0.001 | 0.001 | 0.001 | 0.001 | 0.001 |
| R2 | 0.319 | 0.288 | 0.281 | 0.314 | 0.279 |
| F | 31.79 | 32.26 | 28.94 | 24.30 | 22.47 |
| N | 4045 | 4045 | 4045 | 4045 | 4045 |
| Model 1 | |
|---|---|
| DUAL | 0.445 *** (3.76) |
| SHRZ | 0.103 (1.27) |
| FA | 0.202 ** (2.50) |
| FN | 0.218 (1.03) |
| AGE | −2.563 ** (−1.97) |
| Size | −0.202 (−0.98) |
| _cons | 0.331 *** (34.19) |
| YEAR | Control |
| IND | Control |
| P | 0.001 |
| R2 | 0.494 |
| IMR | 0.019 |
| Model 1 | Model 2 | Model 3 | Model 4 | Model 5 | |
|---|---|---|---|---|---|
| DUAL | 0.474 ** (2.19) | 0.145 *** (4.89) | 0.251 *** (3.48) | 0.084 * (1.71) | 0.187 * (1.75) |
| TURNTA | 0.162 *** (4.24) | ||||
| LEV | 0.260 * (1.88) | ||||
| ROA | 0.081 *** (3.19) | ||||
| TAGR | 0.062 ** (2.28) | ||||
| DUAL*TURNTA | 0.881 *** (2.88) | ||||
| DUAL*LEV | 0.092 ** (2.27) | ||||
| DUAL*ROA | 0.087 * (1.74) | ||||
| DUAL*TAGR | 1.485 * (1.90) | ||||
| SHRZ | 0.418 ** (2.14) | 0.093 * (1.60) | 0.124 *** (3.11) | 0.011 (0.32) | 0.033 *** (2.70) |
| FA | −0.150 (−0.79) | 0.113 *** (3.53) | 0.085 *** (2.96) | −0.168 *** (−3.20) | 0.062 (0.69) |
| FN | −0.098 *** (−3.16) | 0.114 (0.48) | 0.021 ** (1.92) | −0.030 *** (−5.88) | 0.154 ** (2.48) |
| AGE | −0.159 *** (−3.26) | 0.031 (0.43) | 0.171 ** (2.48) | 0.161 *** (2.70) | −0.063 (−0.37) |
| Size | 0.321 * (1.65) | 0.127 *** (3.13) | −0.081 (1.48) | 0.466 (1.39) | 0.215 *** (3.58) |
| _cons | 0.027 *** (33.60) | −0.343 *** (26.67) | 0.167 *** (30.30) | −0.325 *** (−26.18) | 0.234 *** (30.41) |
| YEAR | Control | Control | Control | Control | Control |
| IND | Control | Control | Control | Control | Control |
| P | 0.001 | 0.001 | 0.001 | 0.001 | 0.001 |
| R2 | 0.289 | 0.194 | 0.342 | 0.315 | 0.236 |
| F | 21.55 | 22.84 | 28.84 | 26.17 | 24.30 |
| N | 7791 | 7791 | 7791 | 7791 | 7791 |
| Calculation | |
|---|---|
| Low-capacity group | Mean − 2SD |
| Lower-capacity group | Mean − SD |
| Average-capacity group | Mean |
| Higher-capacity group | Mean + SD |
| High-capacity group | Mean + 2SD |
| Research Hypothesis | Results of the Analysis | The Coefficients of Main Results |
|---|---|---|
| H1: In family business, the integration of ownership and control governance model promotes the enhancement of the corporate value of a business. | Validated | 0.418 *** (4.04) |
| H2: Operating capacity information can positively regulate investors’ response to family governance. | Validated | 0.692 ** (2.16) |
| H3: Debt solvency information can positively regulate investors’ response to family governance. | Validated | 1.069 *** (2.74) |
| H4: Profitability information can positively regulate investors’ response to family governance. | Validated | 0.769 *** (3.62) |
| H5: Development capacity information can positively regulate investors’ response to family governance. | Validated | 0.089 * (1.74) |
Publisher’s Note: MDPI stays neutral with regard to jurisdictional claims in published maps and institutional affiliations. |
© 2022 by the author. Licensee MDPI, Basel, Switzerland. This article is an open access article distributed under the terms and conditions of the Creative Commons Attribution (CC BY) license (https://creativecommons.org/licenses/by/4.0/).
Share and Cite
Li, Y. The Influence of Family Governance on the Value of Chinese Family Businesses: Signal Transmission Effect of Financial Performance. Economies 2022, 10, 63. https://doi.org/10.3390/economies10030063
Li Y. The Influence of Family Governance on the Value of Chinese Family Businesses: Signal Transmission Effect of Financial Performance. Economies. 2022; 10(3):63. https://doi.org/10.3390/economies10030063
Chicago/Turabian StyleLi, Yanan. 2022. "The Influence of Family Governance on the Value of Chinese Family Businesses: Signal Transmission Effect of Financial Performance" Economies 10, no. 3: 63. https://doi.org/10.3390/economies10030063
APA StyleLi, Y. (2022). The Influence of Family Governance on the Value of Chinese Family Businesses: Signal Transmission Effect of Financial Performance. Economies, 10(3), 63. https://doi.org/10.3390/economies10030063


