1. Introduction
An extreme stress period on global financial markets started in mid-2007, peaking in 2008, and ending in early 2009, negatively impacted worldwide banking (
Bosworth and Flaeen 2009). This phenomenon is known as the Global Financial Crisis (GFC). The shock began when the investment bank Lehman Brothers suffered drastic losses in its stock. Investors were pulling their investments out of banks due to uncertain conditions. The global financial market was stressed as worldwide investors tried to sell simultaneously, while banks were having trouble finding other financing sources. Banks’ liquidity problems, spread over the whole system, triggered the world financial market panic. The continuous failures spread in a short time, proving that the entities incorporated in the financial system are highly interdependent to each other (
Roszkowska and Prorokowski 2013). Therefore, financial stability evaluation through a system-wide network becomes a more advisable approach than a bank as an individual. In the system-wide network approach, individual banks and their transaction activities are modeled into a transaction network.
Network science has been popularly used to explain the relationship between entities in a complex system (
Dehmer and Basak 2012). The network approach is suitable to represent complex interactions to gain knowledge in various real-world domains. A network is built on a set of nodes connected by edges. The network is built upon individual banks as nodes and the inter-bank transaction activities as edges in a transaction network. The continuous transaction between banks forms a highly interdependent network. An economist could analyze transaction patterns in macro and micro views by modeling the network. The macro view observes the transaction behavior by measuring the dynamics of network properties during the observable time, while the micro view sees the change on the network microscopic structure named motif. Network motifs are discovered by breaking down the whole complex network into specific small-connected nodes patterns. Each motif reveals unique characteristics. The fluctuation of these motifs’ occurrence in a particular time range emphasizes a better understanding of the underlying transaction pattern change due to a financial symptom.
Economic crises happen when the whole ecosystem state experiences a sudden downturn and the stakeholder accumulated action in the financial network perform less than expected. A deterioration in an economic condition is marked by the following phenomena: significant production decline, enterprise bankruptcy, an explosion of unemployment, and a decrease in gross national product. The nature of economic crises is far from an isolated event. There is a buildup precursor to the main event; thus, eventually, we would have the opportunity to measure the characteristics of a pre-economic crises event. One attribute is financial instability which significantly reduces commodity trading volume, e.g., profit, personal income, and income tax. It is consequently interrupting the welfare of human life in almost every sector (
Haldane and May 2011). From the view of an inter-bank transaction network, a failure in a critical node could potentially trigger the entire network to face constant collapse risk. The rapid shock, spread within the highly interconnected financial system, significantly impacted human wellbeing, and has attracted many researchers to contribute through a network approach (
Longstaff 2010).
Financial crises prediction might strengthen the opportunities to minimize financial turmoil risks and prevent the economic system collapse. Then, the question is how to determine the crisis predictor? This study looks for the most correlating motif pattern as an early predictor of Indonesia’s financial crisis. A network motifs exploration study for early warning of financial crisis was conducted by Squartini (
Squartini et al. 2013); however, this study focuses on the financial crisis in Indonesia. In its role as the Central Bank, Bank Indonesia regulates and maintains the stability of the national payment systems in Indonesia. One of Indonesia’s most critical financial systems is the Bank Indonesia Real Time Gross Settlement (BI-RTGS) system. The BI-RTGS is an infrastructure used for electronic fund transfer where the settlement is instantaneous per individual transaction. Since being operated on 17 November 2000, the BI-RTGS System has played an essential role in processing enormous value urgent transactions above 7000 USD or High-Value Payment System (HVPS) transactions (
Bank Indonesia 2017). The HVPS transactions currently account for 90% of all payment transactions in Indonesia. Undoubtedly, the BI-RTGS system is categorized as a systemically important payment system. The construction of a transaction network on the BI-RTGS system provides an opportunity to study the structure and dynamics of most Indonesia-wide payment transactions.
In general, financial crises are marked by an asset price and credit boom, and then a sudden bust. They appear in different forms and magnitude, evolve over time into different shapes, and rapidly spread across borders. They require immediate and comprehensive policy responses. Crises at a certain level manifest the interactions between the financial sector and the real economy; they need an understanding of macroeconomic linkages, which is a complex challenge in itself (
Reinhart and Rogoff 2009). In short, there are several indications, including an institutional weakness; for example, regulation, supervision, and market discipline are slow to catch up with tight competition and innovation (
Dell’Ariccia et al. 2012). Depending on the theory used, mechanism, and root cause analysis, the survey study shows crises could be classified into four groups: currency, sudden stops, foreign and domestic debts, and banking crises (
Claessens and Kose 2013). Most financial crises left fingerprints or symptoms such as a structural change in the financial network that could be used as a crisis predictor (
Marsili et al. 2011;
Upper 2011).
This research presents an empirical analysis of the transaction network structural shift under crisis: macro and micro perspectives by observing the Indonesian HVPS transaction network during the 2008 crisis period. We aim to explore the macro and micro behavioral changes in the banking transaction activities responding to the 2008 GFC. The exploration is focused on the macro and micro changes in the transaction network during the pre-crisis, crisis, and post-crisis periods (October 2007 to March 2009). For the micro view, we focus on the three-node motif: the triadic motif (
Stone et al. 2019). We explore each of the 13 network triadic motif appearances and discover a motif with significant changes as the underlying financial crisis predictor. This study contributes to developing a crisis prediction model through Indonesia’s macro and micro perspectives and supports preventing financial system instability.
2. Theoretical Background
2.1. Predicting Economic Crises
Modern society’s “connectedness” has many incarnations, such as social interactions, large-scale conversations, and trade between entities, constituting economic activity. Society’s complex relationship between its entities is easily modeled in a network (
Easley and Kleinberg 2010). News and information propagate at lighting speed as the mass communications network delivers real-time feed to society. The phenomenon impacts the decision-making process and overall human social behavior (
Jackson 2008). The speed at which activities can switch money in and out of currencies and countries has grown exponentially recently because of the efficiency of modern communications, which in the end, shortens the time for the policymaker to respond to emerging crises. In macroeconomics, we usually view an entity’s economic performance, such as a country, intending to predict the entity’s future performance. Its focus is on aggregating economic indicators, for example, purchase managers index, consumer price index, unemployment rate, gross domestic product, money supply, and interest rate.
In terms of predicting economic crises, financial markets perform poorly at spotting crisis coming; it is evident in the case of Mexico in 1994 and Thailand in 1997 (
Berg and Pattillo 2000) and also the global crisis in 2008 (
Spange 2010). The 2008 crisis suggests the significant role of banks and financial institutions in creating risky products, encouraging massive borrowing, and engaging in high-risk behavior (
Greenwood et al. 2021). Payment data pattern could be used as indicator to nowcast and forecast economic activity (
Aprigliano et al. 2019), so it is good idea to look at the direction of exploring transaction data as well. Looking at how hard it is to predict the economic crises since numerous reasons could possibly cause them, we look at fundamental changes in the shift of the transaction network. This research proposes to look to alternative measurements of the pattern of banking transactions, where we hope to find micro-network motifs that distinguish them as a predictor leading to financial crises.
2.2. Network Model
A network is defined as a set of interconnected points connected by lines. In scientific language, points are referred to as nodes, while lines are referred to as edges. The network edge might serve many of real-world interactions, such as directed or undirected and weighted or unweighted. Edge direction represents the connection flow from the source node to the target node, while edge weight represents the interaction importance level. The network model is robust in representing the entities’ interconnections and the structural feature of a complex system (
Barabasi 2016). The network perspectives or topological features have been widely adopted in many fields such as biology, computer science, sociology, chemistry, and economics. This approach is employed to represent the complexity and to resolve the combinatorial problem. When we face the network model, there are several questions to answer: who the most influential node is, how dense the network is, how big the diameter is, and how many groups are in the network. Network models provide metrics to answer these measurements (
Alamsyah et al. 2013).
It is possible to enhance the network model to accommodate the time-based dynamic exploration; this method is known as Dynamic Network Analysis (DNA) (
Alamsyah et al. 2018). The DNA captures time-dependent network properties; thus, we could observe the changeover of network metrics during the observation time. This approach provides richer information compared to the single network view at any given time. The granularity information from each measured time could be used as a trend analysis of macro and micro structural changes.
2.3. Network Topological Properties
The goal of studying networks is to understand better system behavior through their topological configuration. The topological network properties measure the node relations within a network to reveal the network structure. Some of the network topologies used in this paper are explained in
Table 1 (
Barabasi 2016).
2.4. Network Motifs
The nodes within a complex network are interconnected in various patterns. Network motifs are one of the most potent ways to explore microscopic structures in a complex network. Motifs are defined as small-connected sub-graph within a directed network (
Milo et al. 2002). There are several motifs’ categories based on the number of nodes involved. The two-nodes sub-graph is named dyadic motif, while the three-nodes sub-graph is named triadic motif. The triadic motif contains richer microscopic structure types than the dyadic one (
Vladimir and Selena 2016). It consists of 13 subgraph motif combinations which are shown in
Figure 1.
Three round shapes represent three nodes in each of the sub-graph. Two or three arrows connect the three nodes in 13 combinations. Each of the sub-graphs owns different meanings. For example, in motif 2, the connections between nodes are reciprocal, while in motif 13, all connections are not reciprocal; it is cyclic connections. There is no general meaning for these motif patterns, instead defined based on the application domain. We explore the triadic motif 13 sub-graph appearance within the transaction network to discover the financial crisis predictor.
2.5. Transaction Network
The transaction network is built upon credits and debits transaction activities. A bank’s transaction flow is modeled into a directed and weighted network. We model the edge direction to indicate the transaction flow, while the edge weight indicates the transaction amount (
Becher et al. 2008). The real-world networks behavior reveals that most banks have low connectivity and only a few are highly connected to most other banks (
Alamsyah et al. 2019). Based on these facts, all banks do not contribute equally to a financial system. Transaction networks are susceptible to both endogenous and exogenous disruptions. Since having high interconnectivity, the entire system faces the collapse risk from a single bank failure through the defaults cascade (
Reserver Bank of Australia 2019). Traditionally, apart from using the extensive granularity of network science such as network motifs, the identification of bank importance uses the core–periphery structure to identify the extent of banks (
In’t Veld et al. 2020). The core–periphery structure aligns with the common finding in the network science discipline that most natural networks have power-law of node degree distributions (
Newman 2011).
3. Research Methodology
We designed the research workflow in several steps: data acquisition; data preparation; network construction; which were then divided into two substeps: first to measure the macro perspective as network topology measurement, and second, to measure the micro perspective as network motifs measurement; followed by finding a pattern as a crisis detector; and at last, research conclusions. We illustrate the research workflow in
Figure 2.
In data acquisition, we collected all transaction data among Indonesian banks from October 2007 to March 2009. Those data were from the government financial agency, which oversees and regulates Indonesian banking operations. We did not sample the data, meaning all the transaction between the observation duration (October 2007 to March 2009) were selected. Briefly, there were 433 banks at that time; however, the number which made transactions fluctuated between 135 to 147 banks. The transaction data belonged to government agencies, and were not for public consumption. To extract knowledge without raising privacy issues, we masked the data to protect sensitive information while retaining the data distribution. Masked data allowed us to obtain knowledge without violating privacy concerns. Maintaining connectivity distribution was the most critical point to preserve the natural properties of transaction activity. We received 1,576,910 rows of transaction data and simplified them into four essential features: the transaction time, the sender bank, the receiver bank, and the transaction value. The transaction duration was divided into the pre-crisis, crisis, and post-crisis periods of the GFC.
We normalized transaction values to protect the actual value information, and simplified the computation process in data preparation. Overall, there were 504 active days in 18 months data during the period. We divided data into monthly units for the time series analysis in this research. Thus, we had a total of 18 monthly data. The structure of the normalized dataset is shown in
Table 2. In the network construction step, the masked and anonymized transaction data were used as the primary fuel for the transaction network formation. We established a transaction network by modeling the sender and receiver banks as the nodes and credit debit activity between them as the edges. The transaction network was formed as a directed and weighted network. The direction in this network represented the flow of money credited from the sender bank to the receiver bank, while weight indicates the value flowed in this credit debit activity.
We constructed the transaction network model on a monthly basis. We measured the transaction network structure behavior every month based on the model obtained. We used the network topology measurement to provide macro perspective knowledge and the network motifs exploration to provide micro perspective knowledge. We employed an algorithm based on (
Itzchak et al. 2007) to count the number of motifs monthly.
From the macro perspective, network structures were measured through the number of nodes, edges, average distance, and density. The number of nodes was used to measure the monthly transaction network size based on the number of banks involved in credit debit activities. The number of edges was measured to provide the total transaction activity between the banks for each period. Average distance measurement was carried out to determine the minimum average number of intermediary banks required to flow money from one bank to other banks. Finally, the network density indicated the density of transaction flows that occurred within these transaction networks. Each monthly measurement result was standardized to obtain a more relevant fluctuation comparison. Standardized measurement results are presented in the form of a time series plot showing the fluctuations better. We discover the macro network structural changes and their relationship to the empirical conditions during the crisis period through this plot.
The micro perspective measures network structures through the triadic motifs’ exploration. Each of the monthly networks was broken down into a small sub-graph consisting of three nodes. There are 13 motif combinations in the three nodes subgraph. These thirteen motifs reflect the microscopic network structure as discussed in
Section 2. Some changes that may occur include two-way transactions to one-way transactions or one-way transactions that no longer appear. This situation prompts a shift in the number of occurrences of each motif combination. The monthly 13 motif combinations’ occurrence was mapped in a time series plot. This plot shows and compares the fluctuations of each motif combination existence. We trace motifs that underwent significant changes towards the peak of the crisis. The most correlating motif pattern to the financial crisis is then identified as the early crisis predictor. Finally, we summarize the findings and suggestions for future works.
4. Result and Discussions
The research examines the transaction network structural changes for 18 months during the pre-crisis (October 2007 to December 2007), crisis (January 2008 to December 2008), and the post-crisis phase (January 2009 to March 2009). The overall 18 months transaction network is found to be a scale-free network. These findings align with those disclosed in
Section 2, which shows that only a small part of nodes become highly influential actors. The real-world transaction networks consist of many less-connected banks, while only a small proportion of banks are connected to most other banks. This behavior is demonstrated with a power-law degree distribution, as visualized in
Figure 3. We summarize that the bank’s contribution within the transaction network is not normally distributed but is distributed with a long tail. This reveals that each bank does not have the same contribution to the transaction network. Most of the transactions are contributed by only a few majority banks. The transaction network is visualized in
Figure 4; the more well-connected or well-contributed banks are visualized in a darker and bigger circle.
Based on the transaction data, we modeled and measured the transaction network structural behavior on a monthly basis during the pre-crisis, crisis, and post-crisis periods. The macro perspective knowledge was obtained through the network topological measurement, while the micro perspective knowledge was obtained through the network motifs exploration. The GFC is peaked out in the middle of September 2008. We highlight the macro and micro network structural shift several months before the crisis explosion. Measurement results are outlined as follows.
4.1. Macro Measurement from Network Topological Measurement
The network topology is represented by nodes, edges, average distance, and density measurement. Over time, the standardized measurement result is presented in two different time series plots. The first plot is in the
Figure 5 presents the number of nodes and edges dynamically over the observation time, while the second plot presents the average distance and density dynamically over the observation time shown in the
Figure 6.
The number of nodes represents the number of banks involved in the transaction activities within the network. In contrast, the number of edges represents the number of transactions during the period. The number of nodes and edges fluctuate simultaneously. It has similarities in up and down trends during the pre-crisis and post-crisis periods. The measurement results underline that the number of nodes and edges fluctuate below the mean line (the average number of banks and transactions for any given day) consistently five months before the crisis explodes. This pattern is uncommon in the previous and the following periods. However, this pattern proves that the banks were abnormal five months before the crisis exploded. Since March 2008, the number of banks involved in transactions has dropped under the average value. Banks become less involved and tend to hold the transactions. Banks tend to avoid transaction activities in uncertain conditions. However, this situation persisted for a while; the number of banks involved and transaction activities within the transaction network gradually normalized after the crisis peaked.
The average distance states the sparsity of banks within the transaction network, while the network density states the intensiveness of transaction activities among banks. The average distance and density fluctuate in opposite ways. Both usually fluctuate without forming a specific trend during the pre-crisis and post-crisis periods. We underline the consistent result in the previous finding that shows average distance and density slightly change pattern during the abnormal situation that began five months before the crisis exploded. Both measurements are signs that the bank is experiencing a decrease in transaction intensity. The average distance fluctuates consistently above the mean line. The banks face a more extended groove with flowing the money to all other banks within the network since more and more banks tend to avoid transaction activities during uncertain conditions. This pattern moves along with the decrease in the network density. The network density fluctuates consistently below the mean line, indicating that transaction activity between all banks has decreased; many are no longer transacting with several banks. This condition increases the network breakage risk since the network is less tolerant to the contagion impact of a single bank failure. The network was at the peak of breakage risk when the crisis is peaked out. Transaction activity gradually returned to its normal state after the crisis exploded.
4.2. Micro Measurement from Network Motif Exploration
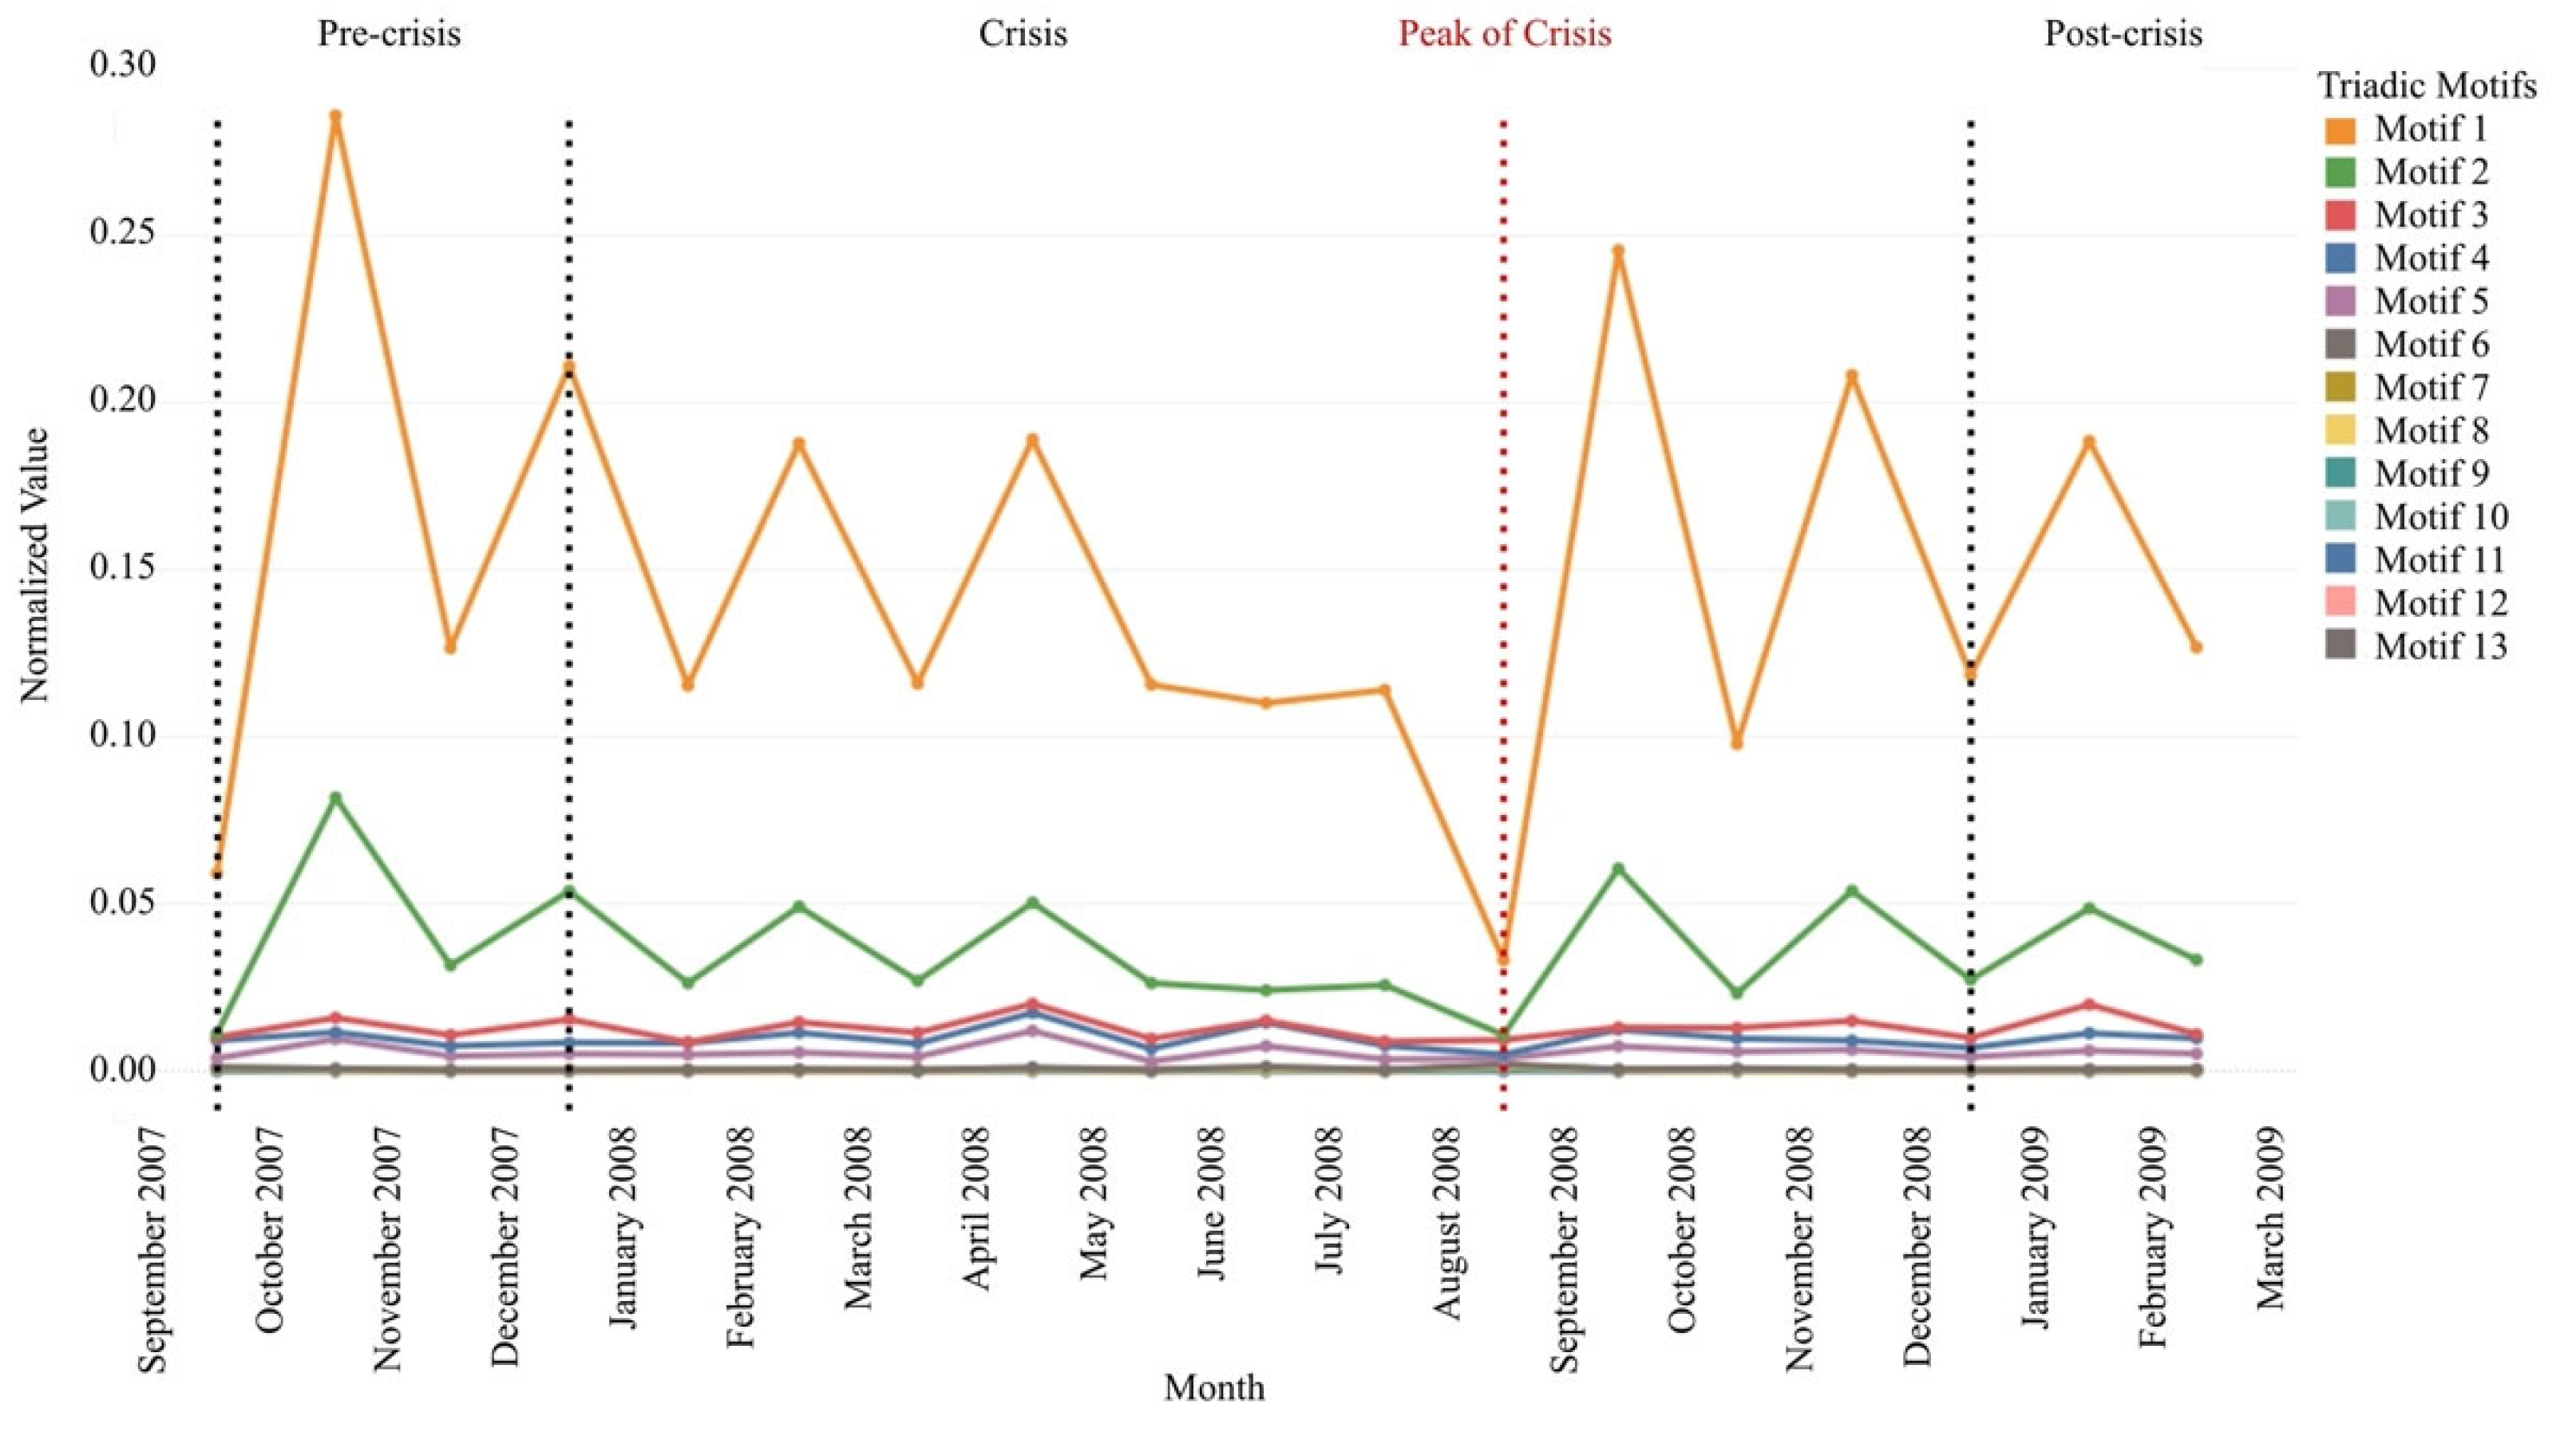
The network microscopic structural shift is explored by measuring the occurrence of each 13 triadic motifs. The normalized measurements result in a time-series plot, as shown in
Figure 7. The measurement results underline that motif 1 and motif 2 dominate the microscopic structure of the transaction network. Motif 1 represents the structure of two reciprocal transactions between three banks, while motif 2 represents three reciprocal transactions between three banks. Or in other words, these two triadic motifs are formed by reciprocal relationships.
Motif 1 and motif 2 form a relatively similar trend. Both normally fluctuate without forming a specific trend during the pre-crisis and post-crisis periods. The micro network structural shift began two months before the crisis exploded. These motifs’ occurrence decreased successively and were at their lowest when the crisis exploded. We imply that a crisis disrupts the continuity of reciprocal transactions between banks. The reciprocal transaction activities gradually return to normal along with the post-crisis period.
Based on measurement results, motif 1 is considered as the major crisis determinator since facing the most relevant structural shift to the financial crisis phase, followed by motif 2. However, other patterns are not providing significant relevancy due to the crisis phase. Therefore, motif 1 and motif 2 are the most capable determinators to detect a crisis and the most relevant motif to assess financial stability in a macro view.
5. Conclusions and Future Works
This study explores transaction network structural changes in relation to the 2008 GFC in Indonesia through macro and micro perspectives. We successfully underline the transaction behavioral changes under pre-crisis, crisis, and post-crisis phases. The transaction network encounters major overall- and microscopic structural changes under crisis conditions. The network undergoes the global structural shift before the crisis, followed by the microscopic structural shift. Our findings are:
- (1)
The transaction network was in an abnormal state 5 months before the peak of the crisis based on the macro perspective;
- (2)
Based on the micro perspective, the transaction network was abnormal 2 months before the crisis peak;
- (3)
Motif 1 and motif 2 are the most suitable triadic motifs to indicate the early crisis warning.
The macro measurement gives us insight into how the network behaves during the financial crisis phase. Understandably, the sudden decrease in the number of nodes and edges shows that only a few banks remain active (the core banks in the power-law node degree distribution). In contrast, the decreasing average distance and density metric show a similar interpretation: fewer transactions happen. The micro measurement shows that motif 1 is considered the major crisis determinator since facing the most relevant structural shift to the financial crisis phase, followed by motif 2. However, other patterns are not providing significant relevancy due to the crisis phase. Therefore, motifs 1 and 2 are the most capable determinators to detect a crisis and the most relevant motifs to assess financial stability in a micro view.
This result shows that we could use the transaction data to forecast or nowcast the economic condition. The economic contraction is evident from the number of banks involved in the transaction and the number of transactions that happen. This macro-perspective could easily verify from the original data. However, the micro perspective through network motif measurement reveals deeper patterns that become a powerful indicator of the economic contraction.
Our findings contribute to supporting financial system stability supervision. Understanding transaction network behavior helps us discover the structural shift of complex transaction activities between banks under financial symptoms. We suggest incorporating this knowledge to generate governmental policies regarding the crisis. For future work, we recommend incorporating the transaction value as edge weight in the network to mimic the phenomenon’s complexity.
Author Contributions
Conceptualization, A.A. and D.P.R.; methodology, A.A.; software, A.A. and D.P.R.; validation, F.T.K., and K.K.; formal analysis, A.A.; investigation, D.P.R. and F.T.K.; resources, A.A.; data curation, D.P.R.; writing—original draft preparation, A.A. and D.P.R.; writing—review and editing, A.A.; visualization, D.P.R.; supervision, F.T.K.; project administration, K.K.; funding acquisition, A.A. and F.T.K. All authors have read and agreed to the published version of the manuscript.
Funding
This research was funded by Directorate of Research and Community Service. Ministry of Research, Technology and Higher Education, Indonesia grant number 050/PNLT2/PPM/2019.
Institutional Review Board Statement
Not applicable.
Informed Consent Statement
Not applicable.
Data Availability Statement
Not Applicable.
Conflicts of Interest
The authors declare no conflict of interest.
References
- Alamsyah, Andry, Budi Rahardjo, and Kuspriyanto Kuspriyanto. 2013. Social Network Analysis Taxonomy Based on Graph Representation. Paper presented at the 5th Indonesian International Conference on Innovation, Entrepreneurship, and Small Business, Bandung, Indonesia, June 24–29. [Google Scholar]
- Alamsyah, Andry, Dian Puteri Ramadhani, and Farida Titik Kristanti. 2019. Event-based Dynamic Banking Network Exploration for Economic Anomaly Detection. Journal of Theoretical and Applied Information Technology 98: 1089–100. [Google Scholar]
- Alamsyah, Andry, Made Kevin Bratawisnu, and Puput H. Sanjani. 2018. Finding Pattern in Dynamic Network Analysis. Paper presented at the 6th International Conference on Information and Communication Technology (ICoICT), Bandung, Indonesia, May 3–4. [Google Scholar]
- Aprigliano, Valentina, Guerino Ardizzi, and Libero Monteforte. 2019. Using Payment System Data to Forecast Economic Activity. Internasional Journal of Central Bank 15: 55–60. [Google Scholar]
- Bank Indonesia. 2017. Kajian Stabilitas Keuangan No. 29, September. Available online: https://www.bi.go.id/id/publikasi/kajian/Pages/KSK_0917.aspx (accessed on 1 December 2021).
- Barabasi, Albert-Laszlo. 2016. Network Science. Cambridge: Cambridge University Press. [Google Scholar]
- Becher, Christopher, Stephen Millad, and Kimmo Soramaki. 2008. The Network Topology of CHAPS Sterling. SSRN Electronic Journal. [Google Scholar] [CrossRef]
- Berg, Andrew, and Catherine Pattillo. 2000. The Challanges of Predicting Economic Crises. IMF Economic Issues No 22. Available online: https://www.imf.org/external/pubs/ft/issues/issues22/ (accessed on 10 February 2022).
- Bosworth, Barry, and Aaron Flaeen. 2009. America’s Financial Crisis: The End of an Era. In Asian Development Bank Institute. Available online: https://hdl.handle.net/11540/3730 (accessed on 1 December 2021).
- Claessens, Stijn, and Ayhan Kose. 2013. Financial Crises Explanations, Types, and Implications. In International Monetary Fund Working Paper No 13/28. Washington, DC: International Monetary Fund. ISBN 9781475561005. ISSN 1018-5941. [Google Scholar]
- Dehmer, Matthias, and Subhash C. Basak. 2012. Statistical and Machine Learning Approaches for Network Analysis. Hoboken: John Wiley & Sons Publication. [Google Scholar]
- Dell’Ariccia, Giovanni, Deniz Igan, Luc Laeven, and Hui Tong. 2012. Policies for Macrofinancial Stability: How to Deal with Credit Booms. Washington, DC: International Monetary Fund, vol. 2012. [Google Scholar] [CrossRef]
- Easley, David, and Jon Kleinberg. 2010. Network, Crowd, and Markets: Reasoning about a Highly Connected World. Cambridge: Cambridge University Press. [Google Scholar]
- Greenwood, Robin, Samuel G. Hanson, Andrei Shleifer, and Jacob Ahm Sorensen. 2021. Predictable Financial Crises. In Harvard Business School Working Paper 20-130. Boston: Harvard Business School Publishing. [Google Scholar]
- Haldane, Andrew G., and Robert M. May. 2011. Systematic Risk in Banking Ecosystem. Nature 469: 351–55. [Google Scholar] [CrossRef] [PubMed]
- Int’ Veld, Daan, Marco Van der Leij, and Cars Hommers. 2020. The Formation of a Core-Periphery Structure in Heterogeneous Financial Networks. Journal of Economic Dynamics and Control 119: 103972. [Google Scholar] [CrossRef]
- Itzchak, Royi, Yelena Mogilevski, and Yoram Louzoun. 2007. An optimal algorithm for counting network motifs. Physica A: Statistical Mechanics and Its Applications 381: 482–49. [Google Scholar]
- Jackson, Matthew O. 2008. Social and Economic Networks. Princeton: Princeton University Press. [Google Scholar]
- Longstaff, Francis. A. 2010. The Subprime Credit Crisis and Contagion in Financial Markets. Journal of Financial Economics 97: 436–50. [Google Scholar] [CrossRef]
- Marsili, Matteo, Iacopo Mastromatteo, and Elia Zarinelli. 2011. Reconstruction of Financial Networks for Robust Estimation of Systematic Risk. Available online: https://ssrn.com/abstract=1934766 (accessed on 11 February 2022).
- Milo, Ron, Shai S. Shen-Orr, Shalev Itzkovitz, Nadav Kashtan, Dmitri Chklovskii, and Uri Alon. 2002. Network motifs: Simple building blocks of complex networks. Science 298: 824–27. [Google Scholar] [CrossRef] [PubMed]
- Newman, Mark E. J. 2011. Network: An Introduction. New York: University Michigan and Santa Fe Institute. Oxford University Press. [Google Scholar]
- Reinhart, Carmen M., and Kenneth S. Rogoff. 2009. The Aftermath of Financial Crises. American Economic Review 99: 466–72. [Google Scholar] [CrossRef]
- Reserver Bank of Australia. 2019. The Global Financial Crisis. Melbourne: Australia. [Google Scholar]
- Roszkowska, Paulina, and Lukasz Prorokowski. 2013. Model of Financial Crisis Contagion: A Survey Based Simulation by Means of The Modified Kaplan Meier Survival Plots. Folia Oeconomica Stetinensia 13: 22–55. [Google Scholar] [CrossRef]
- Spange, Morten. 2010. Can Crises Be Predicted. Available online: https://www.nationalbanken.dk/en/publications/Pages/2010/07/Can-Crises-be-Predicted.aspx (accessed on 10 February 2022).
- Squartini, Tiziano, Iman Van Lelyverld, and Diego Garlaschelli. 2013. Early-Warning Signals of Topological Collapse in Interbank Networks. Scientific Reports 3: 3357. [Google Scholar] [CrossRef] [PubMed]
- Stone, Lewi, Daniel Simberloft, and Yael Artzy Randrup. 2019. Network Motifs and Their Origins. PLoS Computational Biology 15: e1006749. [Google Scholar] [CrossRef] [PubMed]
- Upper, Christian. 2011. Simulation Methods to Assess the Danger of Contagion in Interbank Markets. Journal of Financial Stability 7: 111–25. [Google Scholar] [CrossRef]
- Vladimir, Batagelj, and Praptronik Selena. 2016. An algebraic approach to temporal network analysis based on temporal quantities. Social Network Analysis and Mining 6: 1–22. [Google Scholar]
| Publisher’s Note: MDPI stays neutral with regard to jurisdictional claims in published maps and institutional affiliations. |
© 2022 by the authors. Licensee MDPI, Basel, Switzerland. This article is an open access article distributed under the terms and conditions of the Creative Commons Attribution (CC BY) license (https://creativecommons.org/licenses/by/4.0/).


