1. Introduction
The relevance of Fintech in the financial landscape has increased significantly within the last decade (
Davradakis and Santos 2019). This development can be seen in the steady growth in the total amount of FinTech related funding, which amounted to USD72.94 bn globally in 2018 (
FinTech Global 2019). The term FinTech itself is a combination of the terms finance and technology and refers to “a new financial industry that applies technology to improve financial activities.” (
Schueffel 2016). Financial technology (Fintech) is used to describe new tech that seeks to improve and automate the delivery and use of financial services. At its core, fintech is utilized to help companies, business owners, and consumers better manage their financial operations, processes, and lives by utilizing specialized software and algorithms that are used on computers and, increasingly, smartphones (
Kagan 2020). While this definition does not specify the organizational background of the active entities, within this paper, we lay a distinct focus on equity investments into finance and technology-related start-up companies. We do so to examine the development of somewhat disruptive initiatives that aim to provide new value to the market, emerging as self-standing business models. FinTech start-ups often try to attract a young and digitally native customer base by offering financial services digitally and at less cost, achieved through leaner internal processes and technology (
Berg et al. 2020). The disruptive nature of the business models and the younger customer base often create distrust in existing financial institutions, to which the FinTechs provide alternatives (
Orlov 2019). The trust in established financial institutions varies significantly between Germany and Russia. While 46% of German respondents expressed trust in financial institutions, only 30% of the Russian respondents did so (
Edelman 2020).
It is commonly accepted in the scientific community that, in recent years, advances in information technology due to the digital transformation observable in our modern world have gained importance and have been increasingly used in the financial sector (
Arner et al. 2015;
Ingham 2004;
Slomka 2014). FinTech emerged as a major change in the sector. As this evolution progressed faster and faster, focus shifted from FinTech processes towards FinTech companies that provided more innovation and focused their resources on the development of information technologies (
Arner et al. 2015).
Figure 1 presents the composition of the different sectors comprising FinTech (
Chemmanur et al. 2020).
In these sectors, the technology of FinTech companies provides higher convenience, efficiency, and reduced (transaction) costs, as it most often does not require intermediaries such as banks to perform financial services (
Chemmanur et al. 2020;
Kalmykova and Ryabova 2016). This advantage of FinTech over traditional financial service providers only increases as the digitalization of finance continues, which can be proved by the rapid increase in investments in FinTech between 2010 and 2019, from 9 billion US Dollars to about 215 billion USD (
KPMG 2021). According to Kalmykova and Ryabova, Europe was the fastest growing FinTech region globally in 2016, a year in which the “growth of the investments share into financial technologies amounted to 215%” (
Kalmykova and Ryabova 2016).
The reasons for choosing the Russian and German markets for analysis are extensively justified as follows. First of all, both economies are quite large and have a significant impact on the world markets. Germany is one of the key players in Europe and forms the core of the European economy. The country is consistently ranked as one of the most attractive investment destinations based on its stable legal environment, reliable infrastructure, highly skilled workforce, positive social climate, and world-class research and development (
Doing Business 2020). With 82 million inhabitants, Germany is the European Union’s most populous country and therefore also the largest market within the EU (
Germany Trade and Invest 2021). To further justify the choice of Germany, it is worth noting that Germany has become a major FinTech market within Europe, as it is very attractive to both native startups and international companies (
Germany Trade and Invest 2021;
Baba et al. 2020). As Germany finds itself among the top 20 global leaders in innovation and has special tax incentives for small and medium sized entities (
Baba et al. 2020), it is highly appealing to innovative FinTech companies. In addition, Germany stands out from other European countries in that it is currently the fourth largest FinTech market worldwide (
Germany Trade and Invest 2021) and, in 2017, had the 3rd highest volume of finance in Europe after the UK and France (
Baba et al. 2020).
An additional advantage of the German FinTech market (especially over the UK market) is that, due to the EU’s passporting regulations, Germany can act as a base from which to expand services to other member states of the European Union (
Germany Trade and Invest 2021). As a result of the Brexit vote, a lot of FinTech companies shifted from London, which had been the major European city for FinTech, to Germany in order to maintain their access to the large European market (
Dorfleitner et al. 2017). According to the German Fintech Report, there are currently 639 active FinTechs in Germany (
Germany Trade and Invest 2021). Between 2018 and 2020, the study identifies 243 Fintech startups—around ten percent of all the startups in Germany. This makes Fintech the second strongest sector in terms of startup activity in the German startup ecosystem today (
Germany Trade and Invest 2021). Furthermore, FinTech’s companies are then taking off in Germany (
Kahl 2021). For example, after neo-broker Trade Republic raised
$900 million last May, its N26 turned to close a round of financing for the same amount. The Berlin-based fintech is now valued at
$9 billion, slightly more than Commerzbank. (
Kahl 2021). The German market is also becoming increasingly attractive to international FinTech companies who are establishing branches in Germany in order to serve the large domestic market (
Germany Trade and Invest 2021).
The Russian FinTech market originated only a few years after the European and US market and is still behind those now more established markets (
Kalmykova and Ryabova 2016). Nevertheless, it grows actively, and we see that as a sign of high levels of potential growth and expect it to reach new peaks in the future. Russia is a very attractive country to FinTech startups as it gives “tax credit for R&D expenditure or for innovative enterprises” (
Baba et al. 2020). Additionally, the Russian government provides so called ‘regulatory sandboxes’ that allow companies to avoid many regulatory restrictions for a few months while still being able to test their business model in the real market (
Kalmykova and Ryabova 2016;
Dorfleitner et al. 2017). These regulatory sandboxes are especially beneficial to FinTech startups, as they can test their newly developed business model under eased conditions in the real market. With its abundance of natural resources, the largest territory globally, and ample highly skilled human resources, Russia is one of the fastest growing developing countries. Russia holds Germany as its most important European partner, and both countries collaborate very actively in different areas: from essential goods to IT, to name a few. In fact, as of 2017, Russia is one of the leading FinTech-friendly jurisdictions (
Reuters 2017). With that, we conclude that the Russian FinTech market can provide a nourishing landscape for FinTech startups to prosper and this is why we have also chosen this market for analysis. Research examining the recognition of FinTech services in Germany suggests that German consumers are not particularly good at recognizing FinTech products. An experiment conducted by Stewart and Jürjens indicates that only 10% of German respondents acknowledged FinTech services. In total, not even a percent of these respondents stated that they had used FinTech services before (
Stewart and Jürjens 2018). A similar picture is drawn from research relating to Russian consumers (
Drobot 2021). Research suggests that the problems around the development of “FinTech in the Russian banking system are related to specifics of the banking system and the main consumers of banking services,” which financial literacy being being described as low, with a specific reference to the geographical periphery (
Matveevskii 2019).
The inherent challenge for regulators emerging from this situation is twofold. On the one hand, regulators must not increase regulation to the degree that the regulation acts as a significant market entry barrier. On the other hand, they must be careful not to favor new market entrants by significantly reducing their regulation (
Darolles 2016). The actions of regulators are described as cautious and skeptical regarding the regulation of FinTechs, and
Anagnostopoulos (
2018) associates this with underlying problems. He states, for example, that, first of all, there are cultural, knowledge, and incentivization gaps between FinTech and regulatory agencies. Second, there is some degree of uncertainty for the regulators concerning the market’s further development. Furthermore,
Anagnostopoulos (
2018) claims that, by their very nature, regulatory initiatives cannot match the fast pace of highly technological industries.
Little research explicitly analyzes the inherent differences between the investment situations for FinTech companies within Germany and Russia for the purpose of understanding the pace and extent of Fintech investments. Furthermore, investment opportunities and international competitive advantages could be derived from such research.
The purpose of this paper is to assess the size, growth, and development of equity funding in FinTech companies in both countries. To do so, the presence of non-linear growth for the investment stages is investigated, the maturity of both markets is assessed, and the individual developments within Germany and Russia are put into relation with each other. By shining light on these aspects, this research aims to contribute to a better understanding of newly emerging environments such as FinTech.
Therefore, we will empirically analyze the availability and development of equity investments in Russian and German Fintech start-ups. Additionally, the current situation and the expected development for the sector in both countries will be derived. An exponential growth model will be tested as a hypothesis through various regression analyses to test what kind of growth model can be assumed for FinTech’s funding development. It is through this that a better understanding of the underlying investment market dynamic shall be generated.
While this paper explicitly focuses on the emergence and the financing of new start-ups in the FinTech sector, it is still noteworthy to reference the connection between the existing players and the emerging companies. Keeping in mind Clayton Christensen’s “The Innovator’s Dilemma”, existent businesses with established products and without a will to adapt get pushed aside by new market entrants (
Christensen 1997). With this in mind, the cooperation of an existent player with an emerging fintech can be understood as motivated by a desire to adapt and explore the disruptive development. Research conducted for the German ministry of finance suggests that, in Germany, 14 out of 16 (87%) responding banks actively cooperate with FinTech start-ups and are planning to continue to do so in the future (
Dorfleitner et al. 2017). A trait of this relationship can be so-called “shadow banking” (
Plotnikov et al. 2020). Shadow banking refers to a situation in which a FinTech start-up appears to be an insurer, banking operator, or credit lender without having the appropriate licenses for these actions. It achieves this by using the infrastructure of established players, which are non-visible to the end consumer. The start-up itself is only a distributor of these offerings (
Buchak et al. 2017).
The manuscript is structured as follows.
Section 2 introduces the applied methodology of the empirical analysis.
Section 3 introduces the data and includes the descriptive statistics. The test for the exponential growth model is performed in
Section 4. Finally,
Section 5 provides the conclusion, while
Section 6 points out the limitations and the directions of future research.
2. Methodology
The concept of start-up financing can be very versatile and includes various investment rounds. In order to fulfill the value proposition of the project and sustainably revolutionize the financial industry, funding is required depending on the project and size of the company.
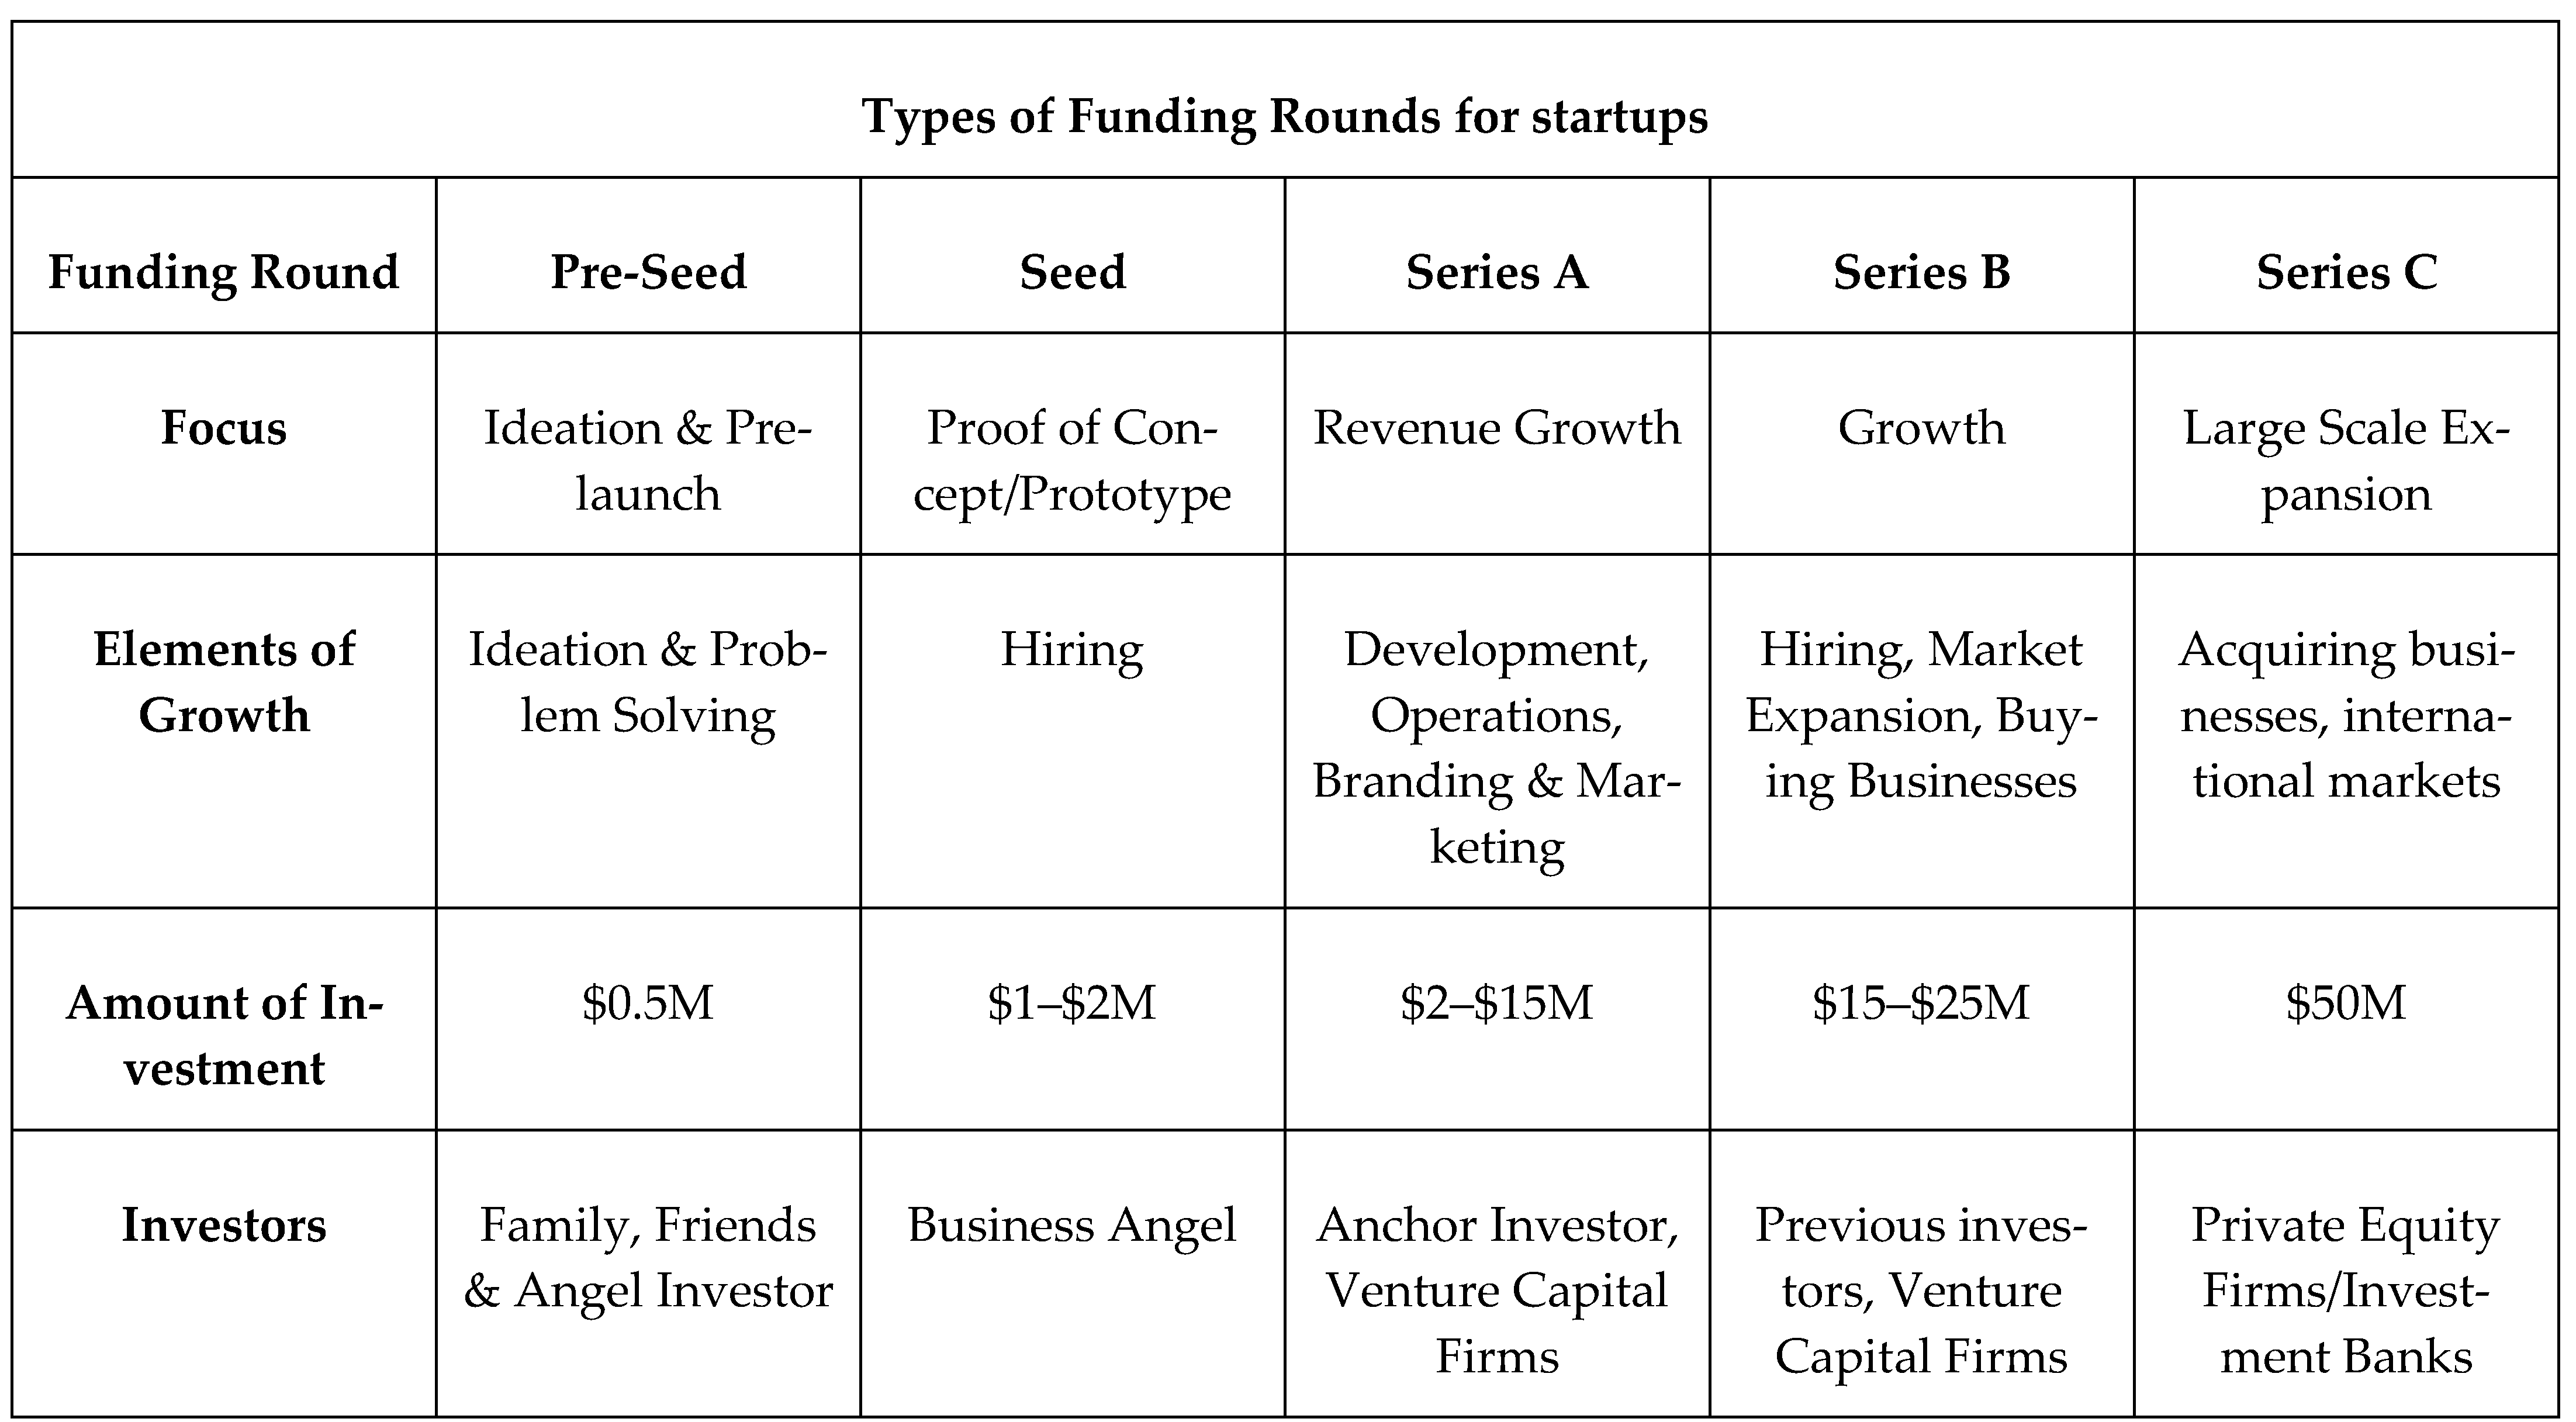
Figure 2 displays the relevant types of funding rounds for startups.
In the first stage of Pre-Seed funding, the start-up is at its beginning, having a prototype, expanding the team, and only requiring up to
$1 M. Seed funding is where everything begins. It is the riskiest funding round because the probability of failure is very high. Investments in this round can be done by angel investors. These funds are essential for testing the product/service that the start-up seeks to implement in the market. A very well-known strategy for reducing the risk is the “spray and pray type of model”, in which investment funds are invested in several business ideas to see which one is likely to be successful. Up to
$10 M can be collected during Series A funding for the purpose of growing revenue through marketing and branding. In the Series B funding, the core business is always quite stable and grows to the point that market expansions and investments amount to a sum of up to
$25 M. Series C funding ensures the further expansion and enlargement of the business with funding of up to
$60 M (
Angerer et al. 2017). According to Fundsquire and their extensive analysis of startups in the UK that were dissolved between 2018 and 2021, 26% percent of such companies are dissolved in the first year (
Kepka 2020). The means by which startups grow are different, and the time in which they manage their funding rounds is also different. For instance, some companies take months or even years looking for funding, while others find them quite quickly, possibly by skipping some of the funding rounds in order to reach capital faster (
Zahair and Grewcock 2021).
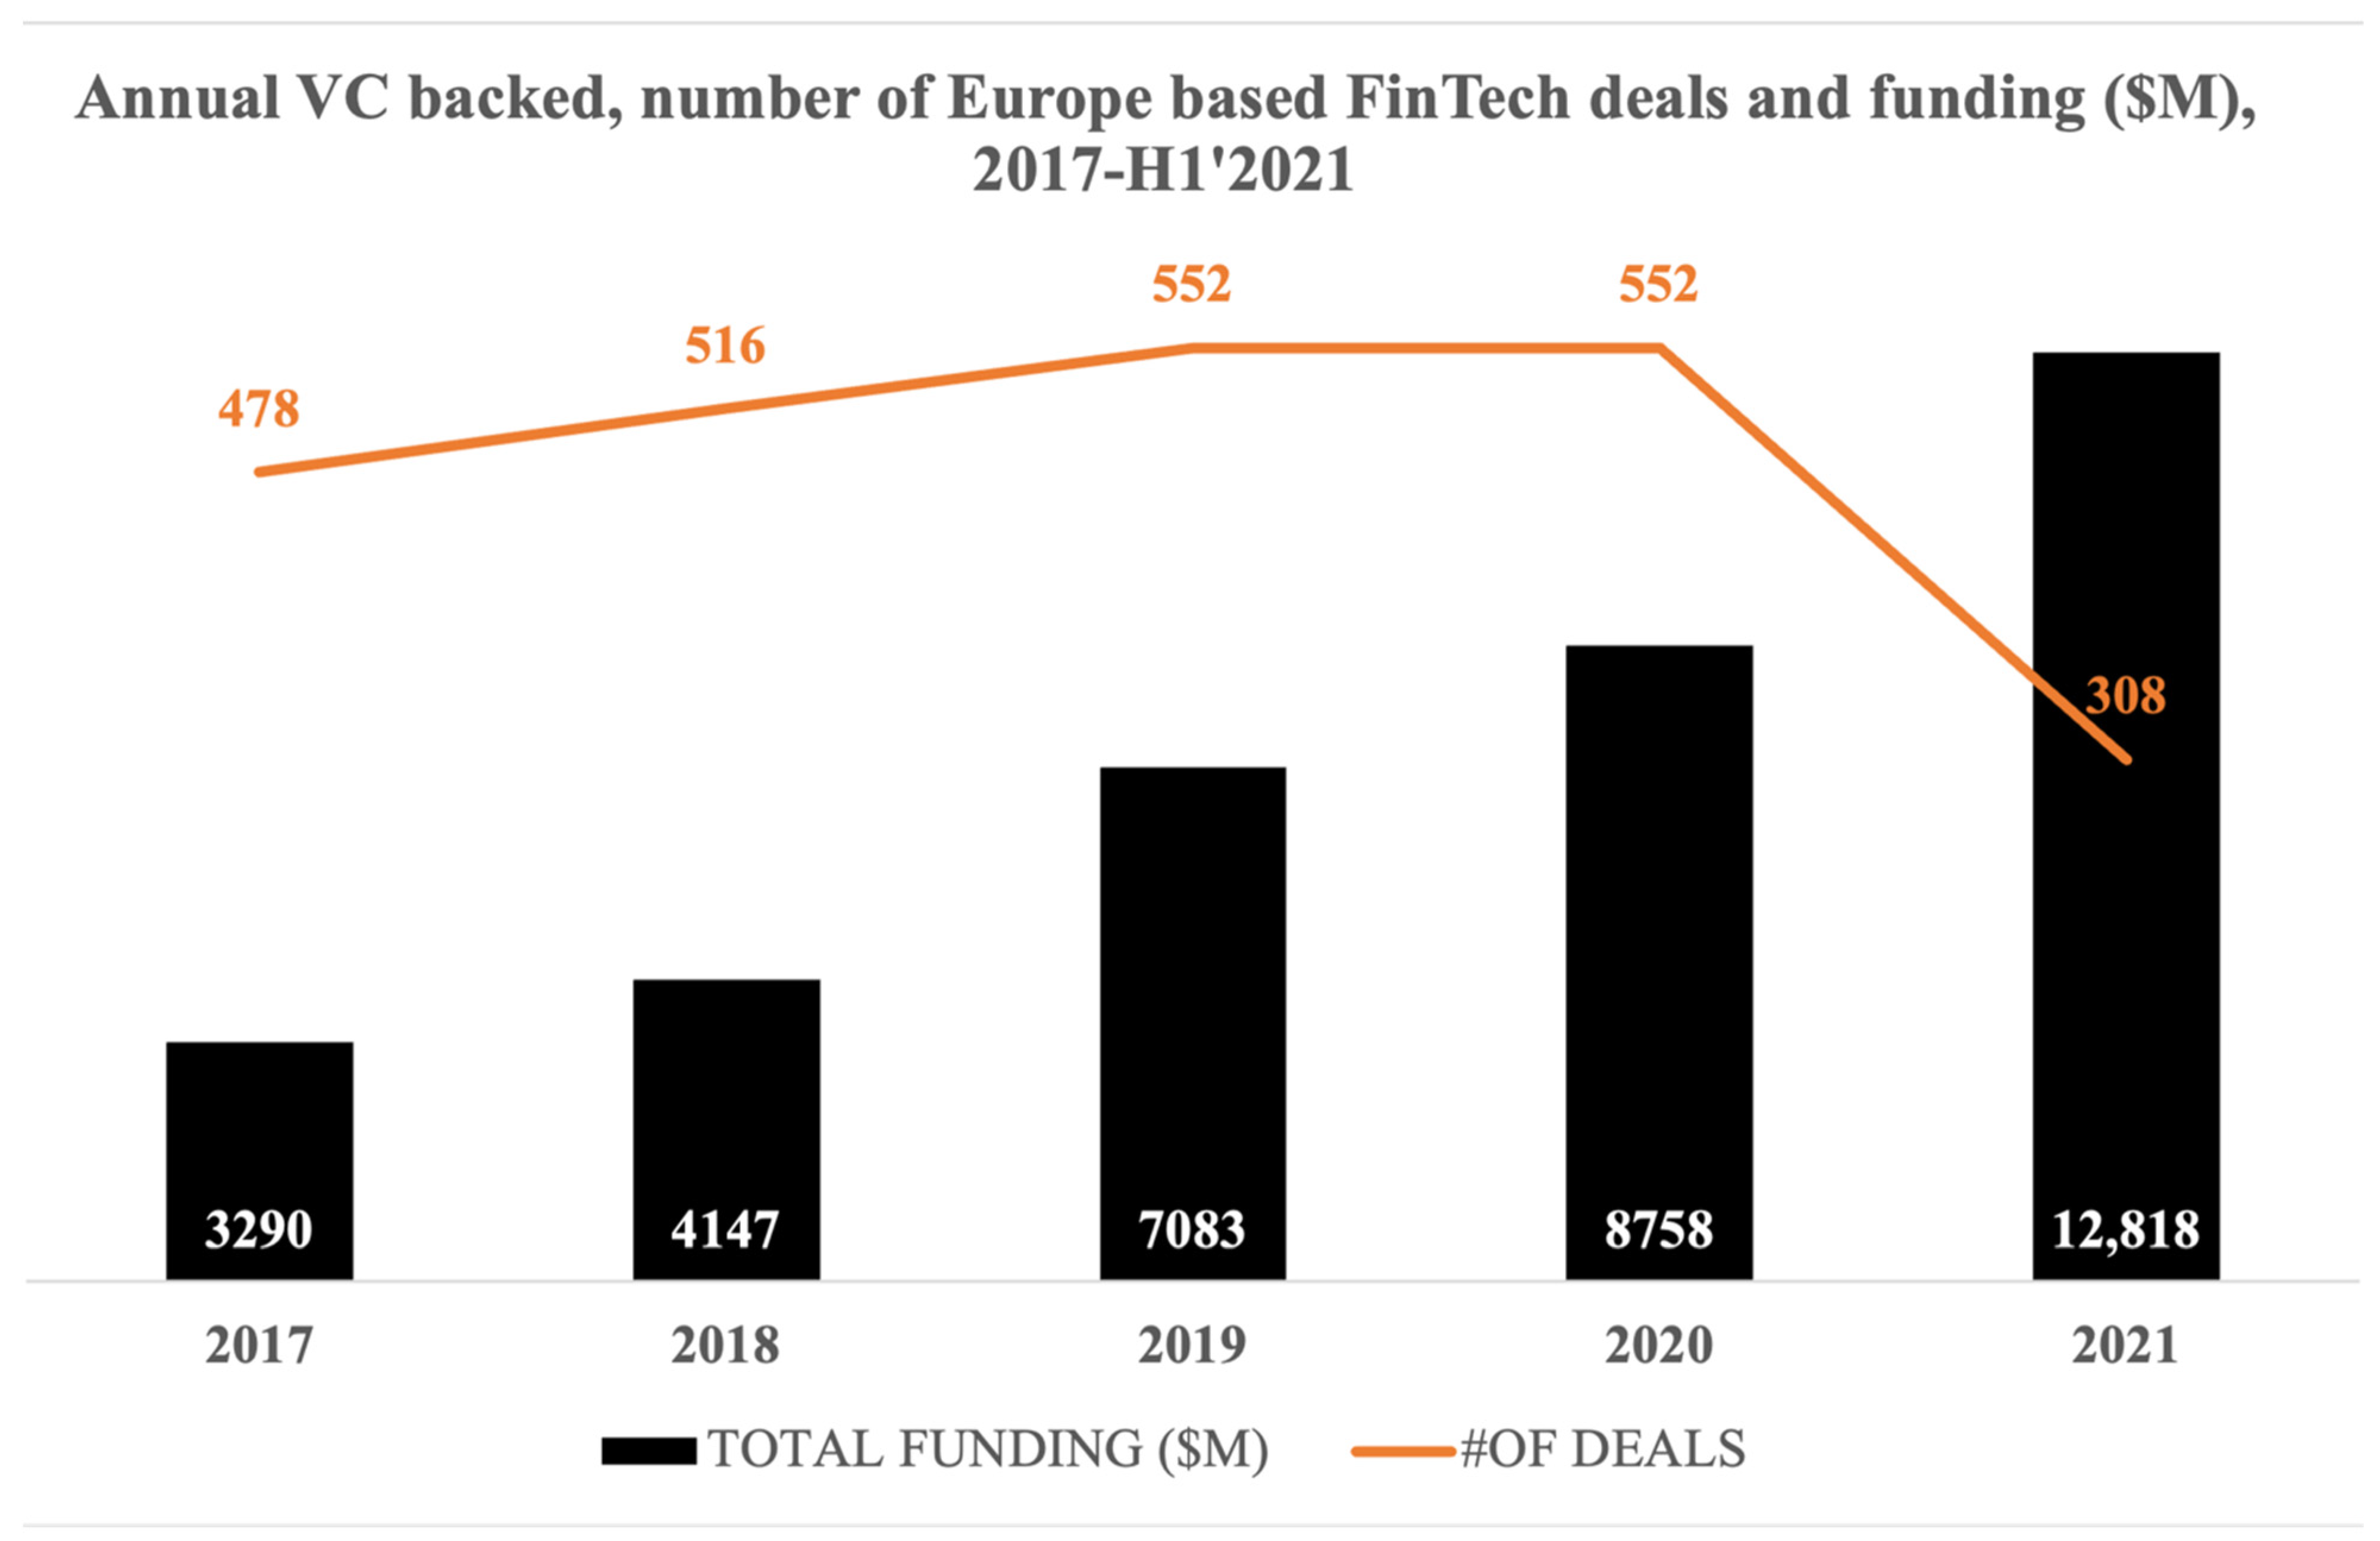
Figure 3 shows the growth and funding trends for FinTechs in Europe. It is indicative of clear growth patterns after performing the retrospective analysis of FinTech funding.
The quantitative analysis used in this paper is based on publicly disclosed funding rounds of Russian and German companies available on crunchbase.com. Crunchbase.com is a service run by Crunchbase Inc., a database provider from San Francisco, CA, USA. Crunchbase.com offers business information relating to public and private companies. Data surrounding private companies is gathered through partnerships with 3700 investment firms that share relevant data from their portfolios (
Crunchbase Inc. 2021). Founded in 2007, Crunchbase has a comparatively long track record of operation. Investments into private companies in particular can go unnoticed as there are oftentimes no obligations to disclose such funding rounds. Crunchbase and its partners are generating more transparency through their services, which are accessible via paid subscriptions. Alternative data sources, such as Pitchbook.com from Pitchbook Data Inc., operate under similar conditions and also offer subscription models (
Pitchbook Data Inc. 2021).
To exclusively include investments related to start-ups, only equity investments made during typical investment stages of start-ups up to Series D investments were considered. This includes Pre-Seed, Seed, Series A, Series B, Series C, and Series D investments. Quantitative analysis was then conducted for both countries individually, with analysis of investment size and level of development. As the basis for the analysis, a funnel view of the six investment stages was chosen. This means that a funnel from Pre-Seed to Series D was modeled and analyzed for different criteria.
Relevant companies were found by setting the filters for funding rounds on the following settings or keywords.
- (i)
Investment type:
Pre-Seed, Seed, Series A, Series B, Series C, Series D
- (ii)
Funded company information:
Headquarters location: Russian Federation, Germany
- (iii)
Industry:
Accounting, Angel Investment, Asset Management, Auto Insurance, Banking, Bitcoin, Commercial Insurance, Commercial lending, Consumer Lending, Credit, Credit bureau, Credit Cards, Crowdfunding, Cryptocurrency, Debit Cards, Debt Collections, Finance, Financial Exchanges, Financial Services, FinTech, Fraud Detection, Funding Platform, Gift Card, Health Insurance, Hedge Funds, Impact Investing, Incubators, Insurance, InsurTech, Leasing, Lending, Life Insurance, Micro Lending, Mobile Payments, Payments, Personal Finance, Prediction Markets, Property Insurance, Real Estate Investment, Stock Exchanges, Trading Platform, Transaction Processing, Venture Capital, Virtual Currency.
The dataset for analysis embraced 303 companies, of which 98 have their headquarters in the Russian Federation, and 205 have their headquarters in Germany. These 303 companies have in total completed 443 investment rounds. 334 of them are accounted for by the German companies and 109 are for those based in the Russian Federation. An overview of the distribution over the different financing stages can be seen in
Table 1 (with further information available below in
Section 3). It is important to note, here, that companies can raise funds multiple times within a particular stage. This is not frequently the case and only concerns 51 cases in Germany and 11 in Russia. In order to increase data sanity, this paper combines the respective rounds and sums up the raised funds. These multiple occurrences are already calculated into the above-mentioned unique funding rounds. The raised amounts are in prices based on the date of their respective announcement.
Before deriving the analytical results, it is important to mention why funding rounds, and especially the development of those rounds, helps to determine an ecosystem’s situation and maturity. In funding rounds, start-ups raise capital to grow their business. The raised capital might be spent on product development, hiring new talent, increasing the marketing expenses, bridging financial crises, engaging in M&A activity, or further investments. The investors expect to get a pay-off for their invested capital through dividends or a valuation increase in an exit scenario at a later point in time. Since not all start-ups become profitable, there is an inherent risk of losing the invested equity. Therefore, the investment itself and the invested amount indicate the investors’ confidence in the business model and the company’s team. To take this further, as a start-up matures, uncertainty in the business model should decrease, and therefore the invested sums should start to increase the value of the business. In any additional funding round, one would then expect the collected sums of the start-up to increase. This assumption is twofold. On the one hand, the value of equity does rise when the start-up is active in business, bringing in revenues or creating a brand value. On the other hand, the operational expenses from the start-up grow, and more capital is required to either kickstart the idea, keep the business running, or invest in further growth. This increase is subject to the subsequent analysis of deducting the state of maturity for the whole ecosystem.
The assumption of exponential growth in funding is based on the idea that start-ups in a disruptive environment emerge with a non-linear growth pattern aggregated across the respective industry. This means that revenues, costs, headcount, etc. grow exponentially and therefore there is also the need for capital. The model tries to assess the overall development of FinTech along with the need of its individual players to raise capital.
3. Data and Descriptive Statistics
3.1. Number of Disclosed Funding Rounds from Pre-Seed to Series D
When it comes to the funnel of conducted investment rounds, it is apparent that German companies completed more financing rounds in absolute terms. This is a given seeing as there are about twice as many German start-ups in the data set. These firms are also leveraging the possibility of equity financing more often.
A good measure of comparison, based on the number of funding rounds undertaken per stage, per country, is the assessment of drop-off quotes, which determine the relationship between two funding stages within an ecosystem. This is interesting when thinking about the two extremes this point of view can show. A 100% relation would mean that the same number of companies who completed Stage 1 also completed Stage 2, while 0% would mean that no funding round was registered in a later stage. As already described, there is no obligation for each company to stick to the presented track. However, for simplicity and the fact that this such cases are somewhat unusual, we assumed that companies move within this funnel step by step or drop out at some point.
The drop-off rates between Seed and Series A and from Series A to Series D can be considered as the ones with the highest relevance for this paper. This is because of the importance of these stages within a start-up’s lifecycle. The Seed to Series A drop-off rate signals the survival rate of companies exceeding initial (seed) financing and entering the growth phase. The drop-off from Series A to Series D distinguishes between companies that entered the growth phase and those with a proven business model that want to expand even further. Also, Series D stage start-ups can be considered as potential IPO (Initial Public Offering) candidates.
The drop-off rate from Seed to Series A is 34.3% for Germany and 68.1% for Russia. This suggests that fewer companies in Russia move towards the growth phase by fueling it through equity investments (
Musatova 2020). This significant drop-off is the reason for further imbalances between the two countries further down in the funnel. While Germany registers twice as many seed financings as Russia, it registers four times as much Series A funding within the given data set. The reasons for that are various and can rest on an individual level as well as be subject to certain circumstances within the ecosystem. The set of data itself gives us no finite indication as to the main causes for that drop off are.
The cumulated drop-off rate from Series A to Series D funding in Russia supports the previously drawn conclusions; especially option (a) the market’s immaturity compared to the German market. Having drop-off rates of 89.8% in Germany and even 95.5% in Russia, it becomes clear that the funnel narrows drastically towards the bottom. While around 10% of the companies in Germany still progress, the funnel in Russia closes to nearly zero by Series C.
3.2. Total Invested Amounts along All Investment Rounds
Table 2 shows the total invested funds during the investment phases for the two countries. This table allows for a country-specific investigation into the funds made available to the domestic companies. To get a better understanding of those available funds, the phases are split into three categories. First is the development phase, including Pre-Seed and Seed investment, followed by the growth phase, including Series A and B, and the expansion phase, including Series C and D. This categorization works to better reflect the purpose for which the respective amounts are invested. Thereby, the comparison counters potential structural imbalances which might exist in particular investment rounds.
Germany displays an interesting picture here, as the available funding increases significantly towards one billion USD and then leveling out around that from Series A onwards. This plateau is relatively stable, even though the previously examined drop-off rate from Series A to Series D is around 90%. The growth and expansion phases display no significant difference in available funding. A completely different picture is drawn from the Russian Federation. While invested funding rises significantly towards Series A, it then bounces back down to medium eight-digit investments. This signals a significant drop in funding during later investment stages. This decrease in total funding along those stages can be explained by connecting this information with the significant drop-off in funded companies from
Table 1. Ultimately, the lack of late-stage start-ups significantly impacts the total invested amount, thereby defining a (capital) demand-side scarcity.
Comparing the overall amounts of invested capital of all the included funding stages, a significant difference can be seen. The German investments are 17.8 times the Russian investments. While Germany’s total investments are focused on both growth and expansion, Russia shows a significantly higher concentration of growth-related funding.
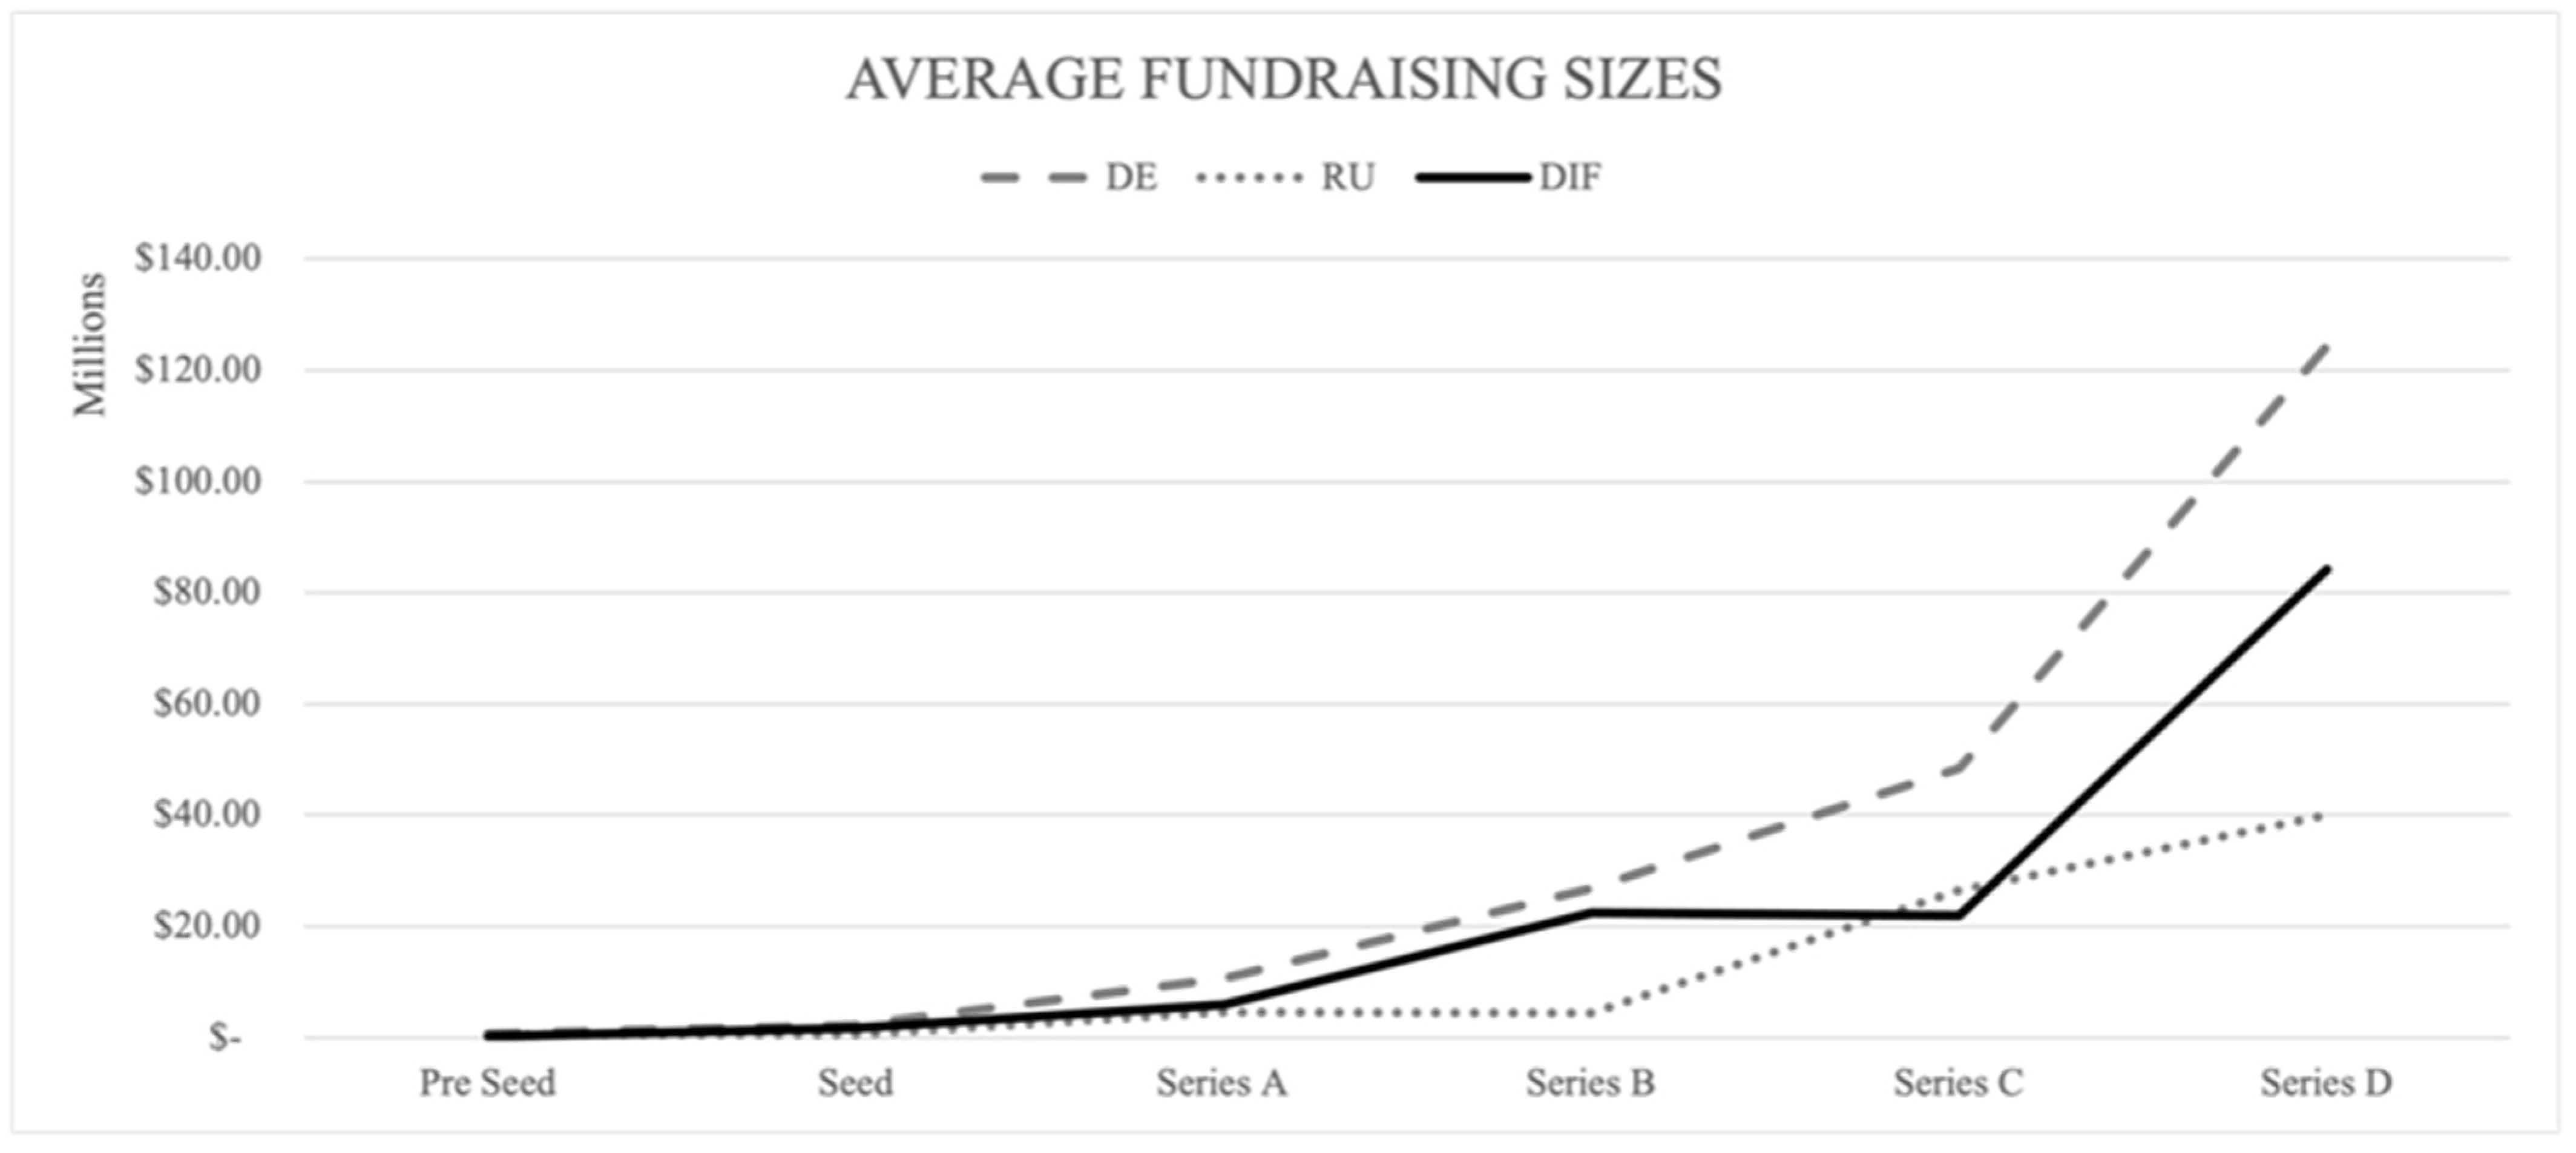
3.3. Average Fundraising Sizes along with the Different Rounds
The average amount of funding collected at each funding stage indicates the progressive growth of collected amounts within the various rounds. While no company is obliged to complete each funding round in its lifetime, and neither minimum nor maximum thresholds exist in the market, the average should indicate a clear upwards-facing trend. This signals that companies grow progressively, and the previously invested money pays off in terms of increased equity values along their lifecycles. By comparing the two investment ecosystems, the point at which investment sizes diverge from one another is revealed. The average funding sizes along the investment stages are displayed in
Figure 4.
Figure 4 shows how both ecosystems start with quite similar base conditions. Also, the development towards the Seed and the Series A rounds can be considered to be in quite a narrow corridor. As investments progress to Series B, however, the difference between the two countries increases significantly. While the average investment size stagnates in Russia from Series A to Series B, investments grow in Germany. Russia’s Series C ticket size then meets Germany’s Series B level. The averages then divide again significantly when examining the Series D funding. While this resembles a significant difference in average funding, further analysis at that level would be flawed because the subset for Russian Series D funding only includes one data point.
3.4. Investment Corridor along with Minimum and Maximum Investments
Each funding round’s maximum and minimum amount are interesting indicators given the relevant ranges of potential investments adopted in the various rounds. This is an essential corridor for founders to assess where the collected amount of funds could lie. On one side of the funnel, it is interesting to derive the minimal amount of capital which founders and investors are willing to commit for each stage. While the data does not suggest anything regarding the gained stake of the company through the equity investment, it still provides the total amount of money that represents the smallest volume founders want to collect and the minimum cap of what investors consider worthy of investing.
The other side of the spectrum marks the maximum, the historically highest collected amount. Its relative size to the total amount of collected funding during one particular investment stage represents the concentration of capital onto a single start-up. It is arguable whether a high concentration is particularly good or bad. However, theoretically speaking, a more diverse investment split would, within the portfolio theory, mean a more stable environment (
Bezdudnaya et al. 2018).
More diversity in this regard means that the market is exploring many different business models rather than just pushing one extensively. In one respect, extensive investments in one player could pay off by bringing up a globally competitive champion who happens to need such a vast amount of funding. The minimum funding sizes for each stage are presented in
Table 3.
One can see that the minimum ticket sizes are significantly closer to one another than, for example, the previously examined average funding size. This indicates a similar understanding of the very point from which equity investments are pursued as a form of financing. Especially interesting is the USD2,000,000–4,500,000 range, at which investments are leveling out for both countries from Series B onwards. By referring to the sub 100,000 USD levels of investment within the first Pre-Seed, Seed, and even Series A rounds, it is also notable that smaller financing rounds in absolute terms are not unknown for both markets. Developing a balanced investment ecosystem means being able to provide capital for both small and large investment seekers. The maximum funding sizes for each stage are presented in
Table 4.
It is not for this research to define a tipping point at which an ecosystem’s equity-financing landscape becomes imbalanced. However, the concentration within late-stage funding in Germany, but even more significantly in Russia, shows a remarkable trend. Russia has a tremendous concentration of funding within Series C and Series D. Both rounds are dominated by Tinkoff Bank, which collectively received USD90m during the Series C and Series D rounds. While the concentration in Germany stays below 20% until Series C, it also sees that share surge, with one single player accounting for more than 50% of the financing from the Series D round total. In Germany’s case, this is the digital bank N26. Earlier stages are more balanced in Russia and Germany. An exception is the 66.68% share of the USD3,000,000 investment during Pre-Seed Stage in Russia. Taking into account the minimum and average fundraising sizes at such an early level, this is a substantial investment for an early stage. For Germany, it is interesting to monitor how the funding concentration starts at 9.38% during Pre-Seed and then decreases further towards the minimum around Series A at 4.82%. Comparable situations in terms of weighting exclusively exist for the Seed and Series B rounds.
5. Conclusions
The conclusion of this research is split into two. First, by zooming in from the macroeconomic to the state level, the implications for the two examined economies are presented. The conclusion then proceeds to the findings relevant for single players within these markets.
5.1. Findings on State Level
The initial situations in both markets are not as different as one might assume. Germany, as well as Russia, has a domestically dominated financial system. In terms of regulations, they are both catching up with the latest developments, with differences in some regards. The main differentiator here proves to be the stricter investment regulations on the Russian side regarding foreign investment capital. When comparing the extent to which the state supports and subsidizes start-up development, it must be said that Russia is acting more actively. Currently, it is uses wide-reaching tax cuts and even engages in structural designs such as the Skolkovo Innovation Center. In this respect, Germany relies on giving access to capital through credit.
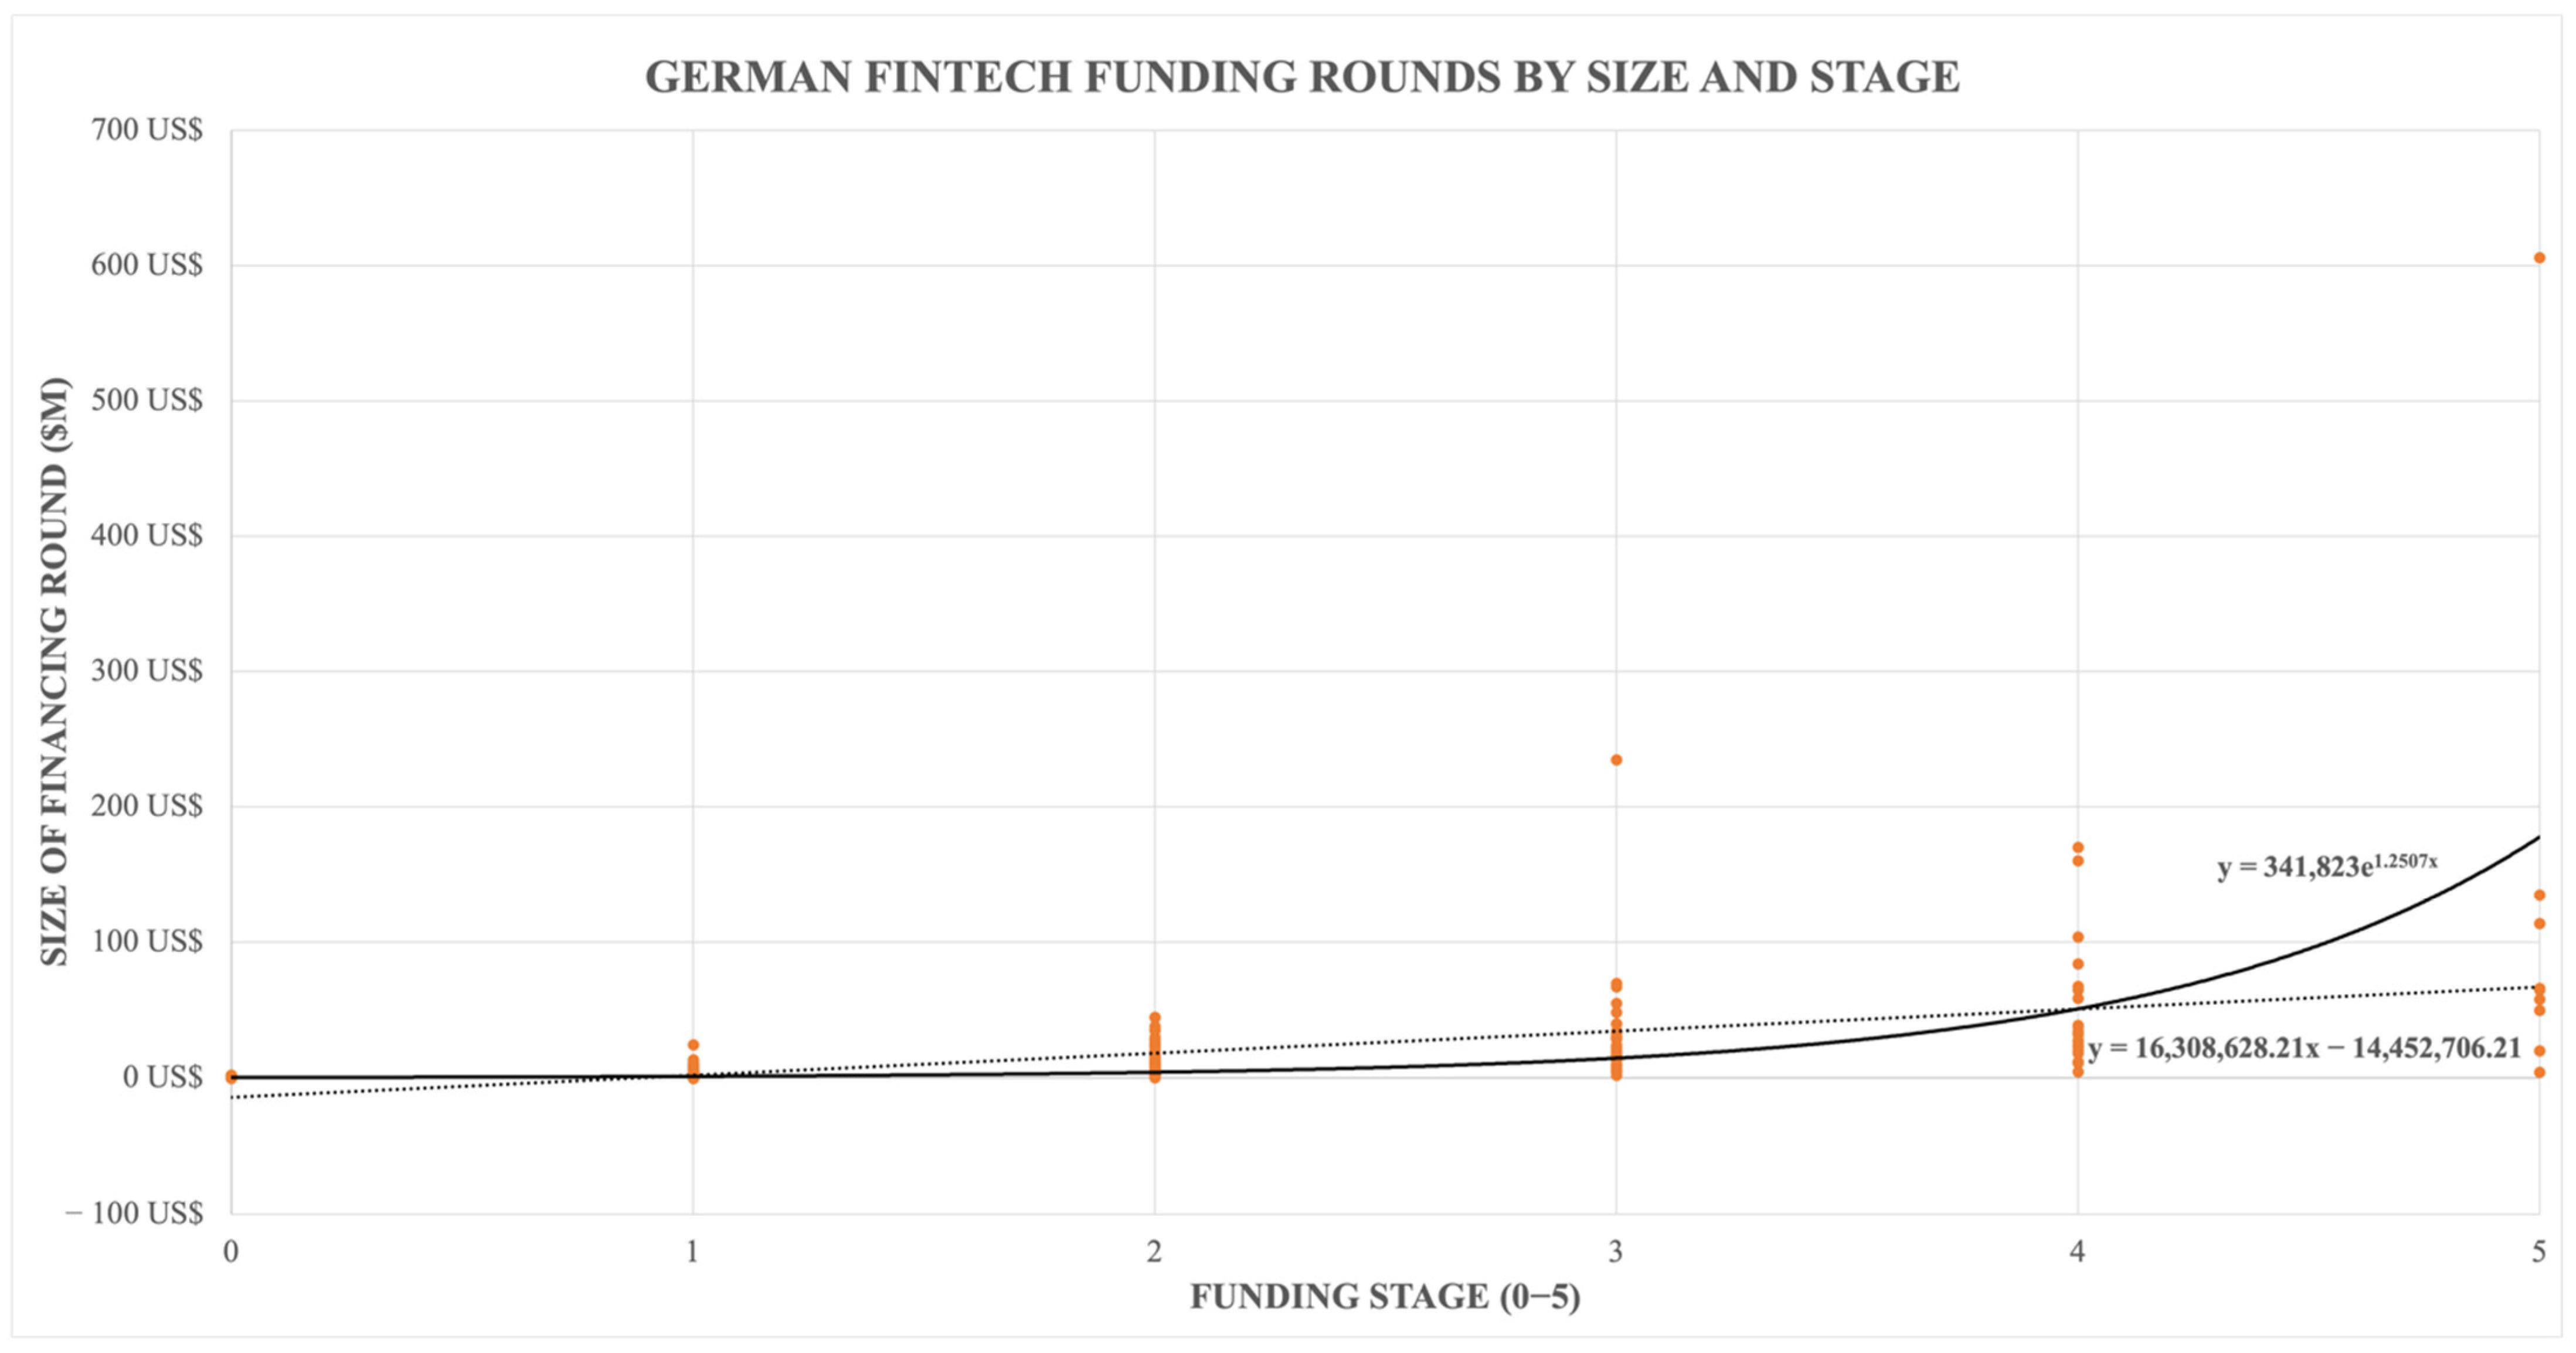
The conducted empirical research supports the hypothesis that exponential growth modelling yields a more solid applicability for invested capital inside the German FinTech equity investment market. The RMSE connected to the exponential model outperformed its linear counterpart. Finding exponential growth within that sector gives essential indications of the growth and expected funding for the respective start-ups. Germany’s investment market can therefore be considered mature in the sense that it is able to match investment supply and demand within that industry. The statement of maturity is supported by the total funding, which shows no significant drops along any investment stage.
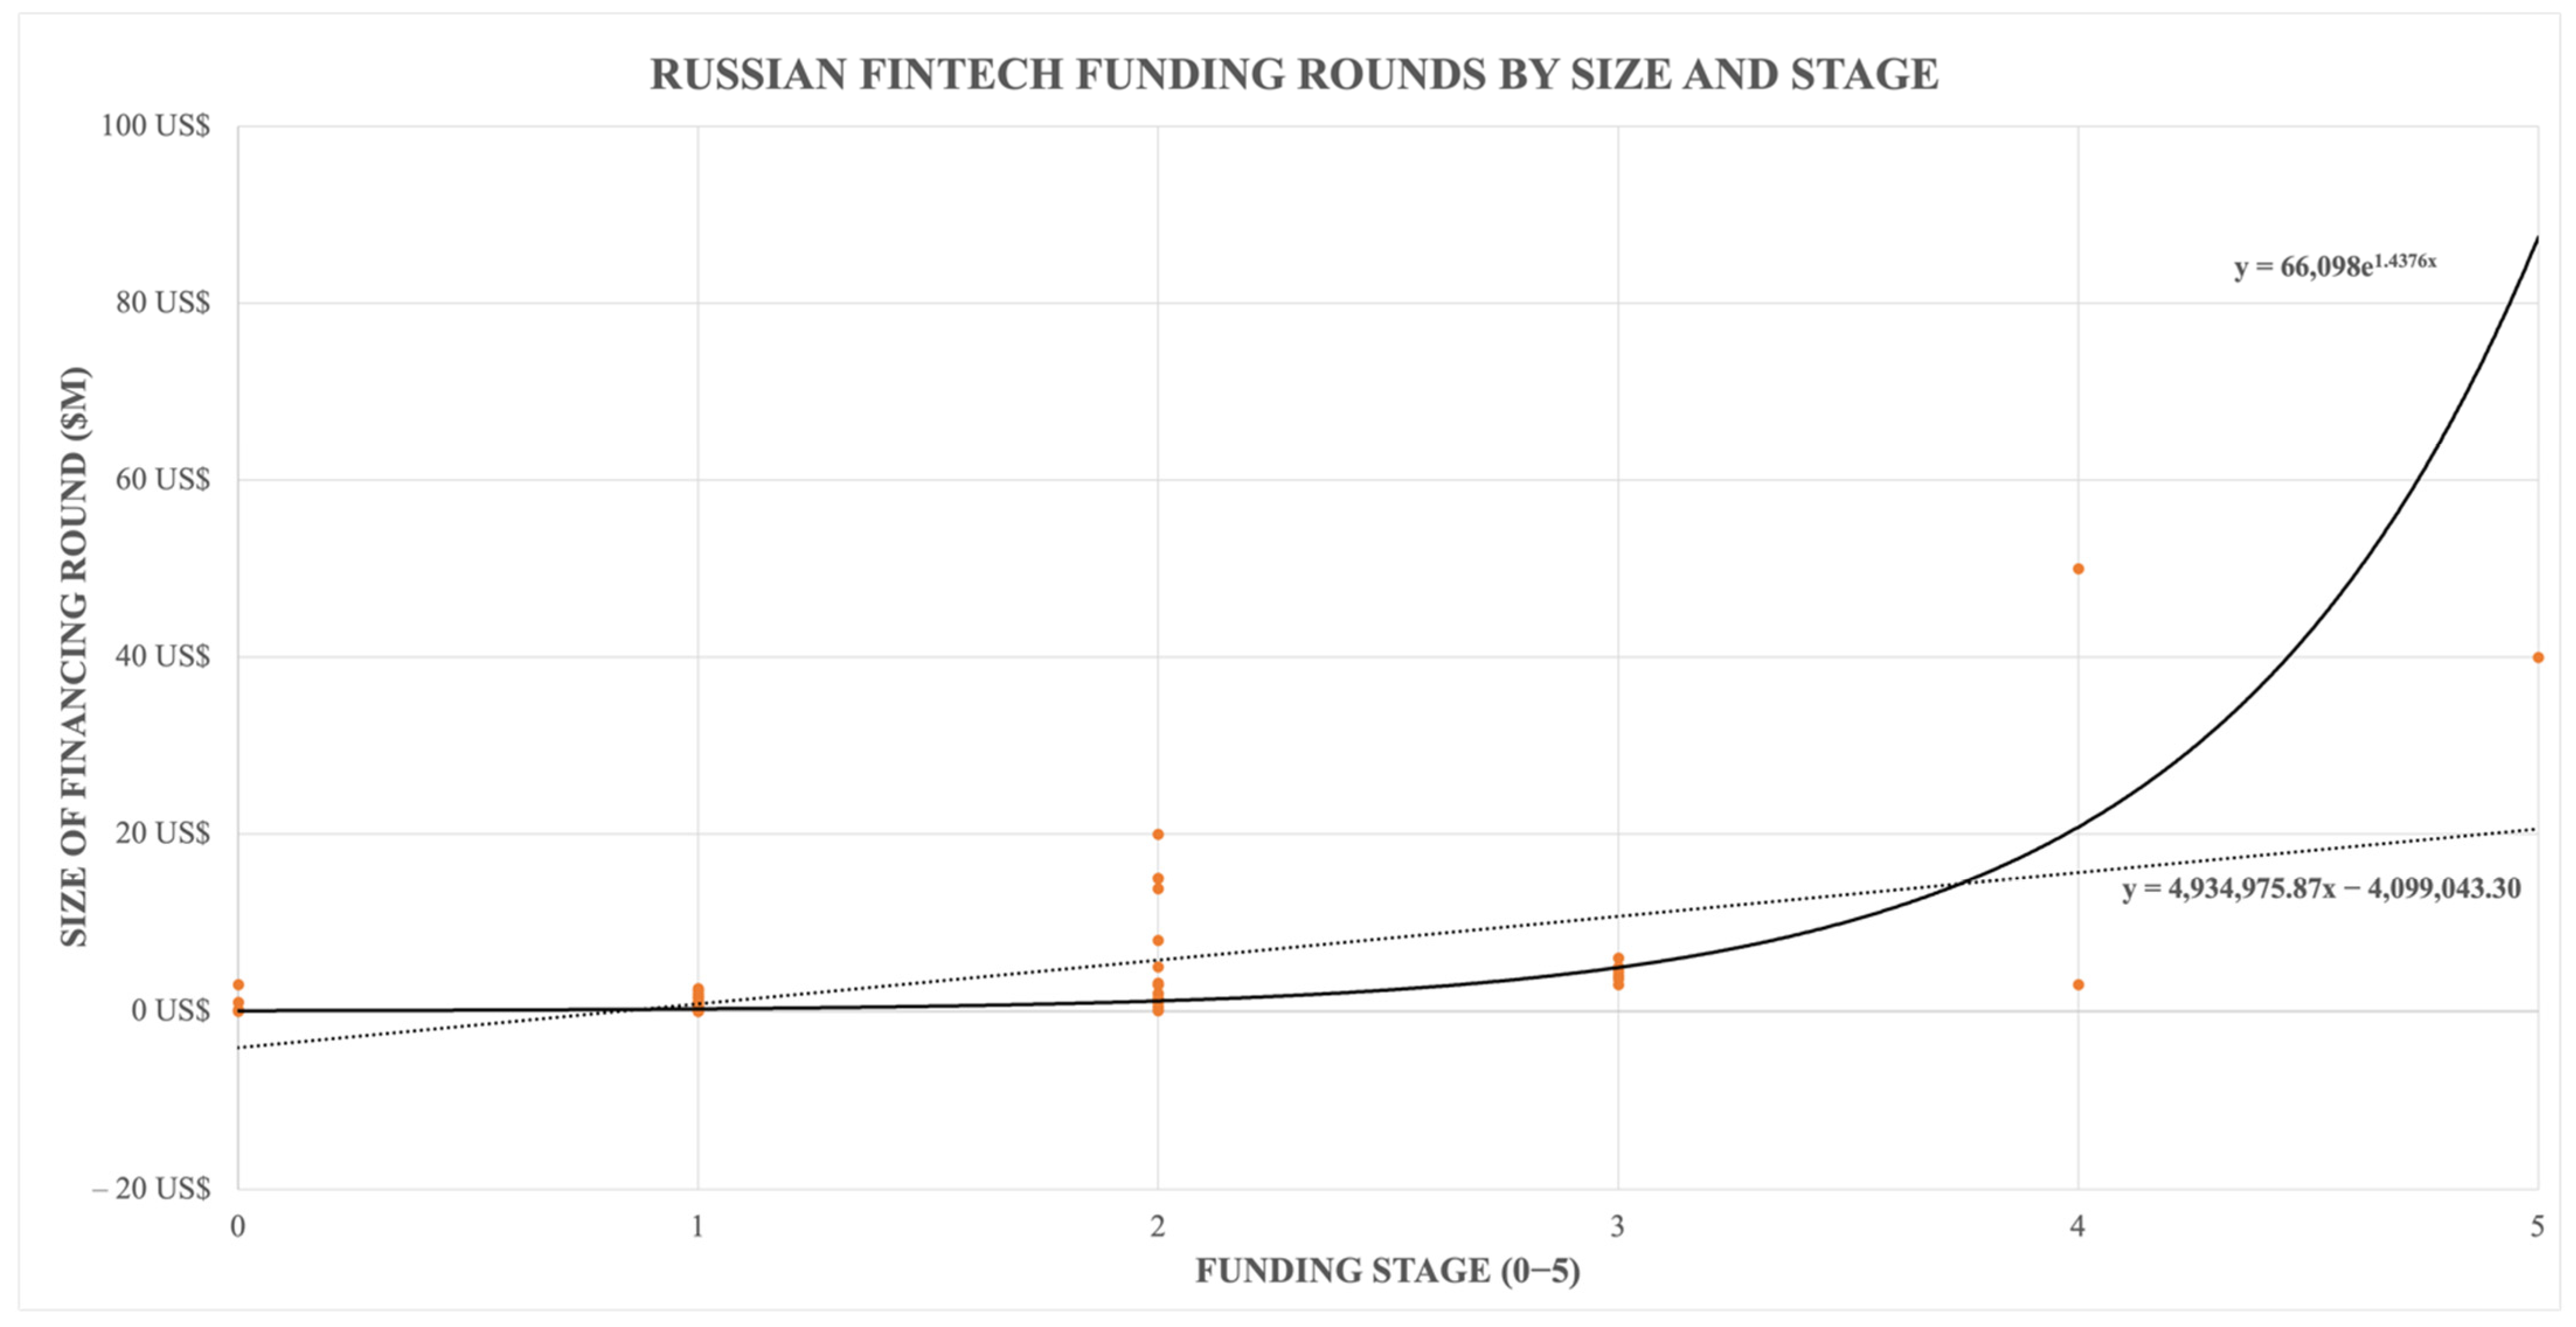
Russia’s FinTech investment market proved to be smaller and less mature than the German market. Drop-off rates within the examined Russian funnel were comparatively high. This was mainly supported by low absolute numbers of conducted late-stage investment rounds. The regression results for the Russian data set tend to show the opposite picture. The large delta between and indicate the superiority of the applied linear model, which contrasts with the observation regarding the data for the German market.
These observations again support the hypothesis of an immature FinTech investment market in Russia. Proceeding from the finding that Russia currently has a concentration of FinTech start-ups and invested capital inside the Seed stage, targeted investment to guide those companies through the growth phase into further expansion can benefit investors and relevant start-ups.
Both ecosystems must recognize that, overall, they are intensely concentrated on one dominant domestic player. This means that large parts of the invested capital are tied to one single player in terms of crisis or default.
5.2. Implications for Single Players
From a FinTech founders’ perspective, the findings of the paper can be interpreted as follows: Both markets, the Russian and the German, are capable of providing growth capital to kickstart business ideas according to their historical data. What is exciting is the higher FinTech adoption rate inside Russia, which can be seen as a clear benefit for some start-ups. In Germany, however, given the larger n of FinTech start-ups and levels of investment, one is more likely to find investors familiar with FinTech or even the exact subcategory one is active in. Also, there is a more significant proof of concept for late-stage funding in this sector. A Russian company might find it hard to attract international investors given the clear investment regulations, thereby limiting the sources of capital.
6. Limitations and Future Research
The limitations of this data are inherent in the data and its analysis. The data set exclusively consists of disclosed funding rounds. This leaves out any significant funding or investments that are not disclosed but could impact the concluded results. This paper’s investigation also does not touch the dates on which investments were made. At the same time, this paper focuses on a cumulative view. It therefore neglects the specific economic situation of given periods and this potentially results in differences in conductible outcomes. Another limitation arises from the exclusive examination of start-up companies and their funding. FinTech initiatives can also be undertaken inside established organizations. Those initiatives and the respective investments are not recognized by this paper.
A mathematical blur exists on the data side, given the smaller subset of Russian companies and the reduced data points for later investment stages, which inevitably influence the accuracy of the conducted analysis. Limitations must also be observed with respect to the lack of case-by-case comparisons between the two ecosystems. While this paper aims to indicate the different situations within ecosystems, case-by-case analyses might reveal contradictory results for certain companies. Concerning the investment side, it is important to flag that the paper does not analyze the pre- or post-money evaluation of the examined companies. While the invested sums give a solid scientific sense of direction, those metrics could provide either contradictory or supportive trends.
The research can be seen as a snapshot of investment developments that will grow beyond their current status under stable or improving circumstances. An investigation such as this one on how the funding rounds develop over time in both markets would be fascinating to monitor. Also, as the funding rounds can be interpreted as a funnel, tracking the further movement of those inside this funnel makes sense. Additionally, this research could also be complemented by an exit scenario analysis on how FinTech companies in both countries behave when reaching maturity and apply for an IPO. Further research could be concerned with the following three steps: First, the presence of capital, i.e., are there investors willing to bet on any given idea or market? Second, the access to capital and how it is being deployed? Third, the efficiency of capital, also taking into account socio-economic factors. How successful are the investments and entrepreneurs in their acting? Understanding relevant key drivers in the development of this funding for digital ecosystems could help governments adapting regulations, investors finding investment targets, and enable entrepreneurs to create value.
While this paper exclusively targets equity financing, it does so without further analysis of the origin of that funding. A deeper analysis of who is committing to the funding and the incremental differences and similarities of the countries would be interesting. Having a particular view on the geographical origin of the funding and, structurally, what kind of entity is providing the investment would be of interest. Complementing this research regarding the full spectrum of FinTech, an analysis of the initiatives undertaken by prominent established players inside the financial and technological sector might reveal further interesting details.
Generally spoken, the analysis presented in this paper can be applied for other FinTechs in other continents, such as the major ones in North America and APAC.


