Abstract
This article proposes a neoclassical stock market portfolio based on the principles of dynamic response and constant adaptation to the market. The construction of a neoclassical investment portfolio begins with the conceptual development of an adaptive investment strategy. We suggest an algorithm for creating an adaptive investment portfolio. The conceptual model of the investment strategy is presented including the following mandatory components: evaluation, forecasting, investment, and adaptation. This model has the ability to adapt both in normal and in crisis periods of the market. As a description of the forecasting component, an additive mathematical model of the predictive ensemble is used, including seasonal, regression, and shock elements as well as a neural network.
1. Introduction
Open strategic investment markets play an important role in the economies of developed countries. Their turnover, which usually makes up to a third of the national budget, is so significant that it affects the overall state of the country’s economy. It is evident that severe losses in this sector can lead to actual problems as significant as nationwide economic crises.
The risk of losses in strategic investment is very significant.
The main reason for the unprofitability of financial market entities is the use of low-quality, inflexible, outdated investment strategies that do not consider the highly crisis-driven dynamics of modern equity markets.
In connection with the above, the main purpose of this study is to develop a methodology for the formation of a long-term investment strategy resistant to market changes, including economic crises, which could be recommended to investors as a basic model for constructing their investment strategies.
For more than 70 years, economists have been concerned with the in-depth study of the methods for developing an optimal investment strategy in a free market. The key ideas behind strategic investment were introduced in the middle of the last century by the founders of modern portfolio theory (MPT) (Black and Scholes 1973; Markowitz 1952, 1959; Mossin 1966; Tobin 1969; Sharpe 1964).
The main achievement of these authors was the creation of a universal model of a strategic investment portfolio, while the main drawback lies in excessive idealization and generalization of economic models, as well as isolation from the real conditions of a changing free market.
In the 1970s, when many economists began to apply the strategic investment portfolio models of Markowitz–Tobin–Sharpe in practice, it became obvious that it was necessary to concretize several parameters of classical portfolio theory and to bring the models more in line with reality. This served as the starting point for the creation of neoclassical portfolio theory (post-modern portfolio theory, PMPT). Significant contributions to its development were made by (Merton 1973; Pollard 2008; Roll and Ross 1980; Rom and Ferguson 1994; Sortino and Price 1994).
The neoclassical portfolio theory is more specific than the classical theory and allows effective application of investment portfolio models in practice in the conditions of changing markets (Ivanyuk 2021a, 2021b, 2022).
Despite the higher efficiency of neoclassical models, they are rarely used in their pure form, because since their appearance, market conditions have undergone certain changes: the range in quality of investment instruments has significantly expanded, the information exchange rate and the dynamics of changes in the conjuncture have increased, and the speculative component has grown substantially while investment markets have become more accessible.
Due to changes in market conditions, it became obvious that it was necessary either to refine classical and neoclassical theories or to create conceptually new approaches to strategic investment that not only consider the real state of the market but also allow for comprehensive assessment of the situation from a systemic point of view, considering the risk of crisis development. We develop an algorithm for creating an adaptive investment strategy. This algorithm consists of three large units. Each unit is addressed within the corresponding section of the article. So, in the section named Evaluation Unit of the Adaptive Investment Portfolio Construction, the aggregate estimate of the market dynamics is described. In the section named Forecasting Unit of the Adaptive Investment Portfolio Construction, the aggregate forecast of asset efficiency is developed. The section of the article named Strategic Unit of the Adaptive Investment Portfolio Construction describes the strategy optimization.
2. Literature Review
For the purpose of searching for optimal models and methods to develop a dynamic adaptive model, alongside classical works, we have analysed contemporary papers on forecasting methods, optimization, and risk evaluation in economics.
This section compiles scientific papers of contemporaries devoted to forecasting methods (Chuang 2013; de Oliveira et al. 2021). The authors Chen and Yang (2019) suggested combining three factors into the aggregate risk: longevity risks, market risks, and consumption growth rates. Longevity risk is presumably reduced if there is a spike in short-run risk. The authors proposed an additive model of aggregate risk. Based on the empirical model of forecasts of the pharmaceutical market, the authors Kaczmarek-Majer and Hryniewicz (2019) suggested using information and linguistic analysis of mass media for forecasting, considering the degree of reliability of the information. This technique improved the standard regression forecast by at least 3.5%. The author Taylor (2019) offered a statistically significant and experimentally confirmed model for forecasting stock indices based on the use of the global volatility index VIX. The authors Nystrup et al. (2020) suggested using the levels of seasonality decomposition corresponding to the real temporal hierarchy when predicting the seasonal component in autoregressive models, and the quality of forecasting was enhanced. This was confirmed by a real statistical study of power consumption levels in Northern Europe. The authors Zhang et al. (2017) proposed to abandon the use of autoregressive models and apply multiple wavelet decomposition to predict seasonal time series. In this regard, they provide empirical confirmation using the case of the seasonal component of stock indices.
Based on an empirical case study of cryptocurrencies, the author Trucios (2019) demonstrated that highly robust risk management models are more efficient in long-term forecasting. In this context, the more robust a model, the more preferred it is. The article Makridakis et al. (2020) examined S. Makridakis’ international forecasting competition of 2019 (M4 Competition). In this competition, the hybrid and combined forecasting methods ranked the best. Then, the forecasting error of the best submissions did not exceed 12%.
This section compiles contemporary literature devoted to optimization methods. In contrast to traditional optimization methods that use criteria of the financial value of assets such as return or liquidity, the authors Chang and Shi (2011) suggested using a demand-based investment satisfaction index as an optimization criterion. In this case, the optimal portfolio will be less profitable, but more psychologically satisfying for the investor. In contrast to the traditional optimization criteria, the authors Yang et al. (2018) suggested using criteria based on the level of compliance of the actual data with the formed regression models. That is, they suggested that for the optimization, the assets with a value that is more easily predictable should be preferred. A real-world data-based empirical study showed the advantage of this optimization approach over traditional optimization by return. The authors Wu et al. (2019) conducted an empirical analysis of various portfolio efficiency factors used in typical convex optimization. In this regard, they demonstrated that risk parities help to achieve a better portfolio balance compared to the benchmark portfolio models.
As an optimization measure, the authors Vo et al. (2019) proposed the Bayesian likelihood of the Pareto portfolio: the optimum between the return and the degree of the social significance of investments. They also offered a calculation method similar to the algorithm for calculating social utility used in the People’s Republic of China. Although today the economic significance of this work is unique to China, where social utility is expressed in state economic preferences to individuals and companies, its relevance will grow as digitalization and digital control of society increase.
The authors Post et al. (2018) suggested using the Bayesian likelihood of the mathematical GARCH model with stochastically generated coefficients as an optimization criterion. In fact, this method forms a preferred portfolio based on the principle of the dominance of a simpler modelling method over a more complex one. In their paper, the authors Ranković et al. (2016) proposed using a combined method of VAR estimation, GARCH prediction, and genetic sorting algorithm. Using empirical evidence, they demonstrated that even the employment of classical and outdated methods, with the right approach, can guarantee a return that exceeds inflation. In contrast to the traditional principles of portfolio optimization in terms of increasing the securities yield, the authors Bordag and Yamshchikov (2017) proposed an unconventional, actually inverse method of optimization that uses the degree of illiquidity of the portfolio as the main characteristic and suggested in this case applying the multidimensional illiquidity criterion to exclude the lowest-liquid assets from the portfolio. The authors Li et al. (2019) proposed an optimization method based on the criterion of the uncertainty of the asset risk. In fact, they introduced both the measure of the magnitude of the uncertain risk and the measure of its uncertainty level, while optimization is assumed in the form of the classical method of finding a Pareto-optimal solution. Regardless of the optimization method used, the authors Daryani et al. (2020) suggested using the following method to speed up the process of finding the optimum: initially, the optimization function should be described as a simple linear-piecewise dependence, after which, having determined the boundaries of the most optimal linear segment, an explanatory optimization algorithm with a continuous rational argument and a full-fledged dependence of the optimizing function should be used. The authors Mohebbi and Najafi (2018) proposed a method of combined sequential optimization, for which it is necessary to use a typical VaR optimization with simultaneous consideration and evaluation over the entire depth of the tree of possible idiosyncratic scenarios. In this case, the portfolio that demonstrates the best results under the worst-case scenario will be considered optimal. The authors Yang et al. (2019) suggested using a typical optimization method based on H. Markowitz’s model that requires performing a cross-correlation analysis of empirical data before the portfolio diversification, which allows clustering the diversification components according to the degree of their actual connectivity. In this case, a portfolio with lower connectivity of assets located in the most mutually distant clusters will be preferred. The authors Aboussalah and Lee (2020) proposed a portfolio optimization based on the typical Sharpe ratio using a self-organizing ensemble of recurrent deep learning neural networks. By means of an experiment with empirical data, they demonstrated significant superiority of this approach in comparison with the existing standard models of the optimization strategy: “buy and hold”, “VaR-optimal rebalancing”, and “minimal risk”. In an empirical study, the author Zakamulin (2017) considered 17 typical models of investment portfolio optimization, while, importantly, demonstrating statistically significant results of the superiority of any of the considered standard models over the method of naive diversification.
The authors Cheong et al. (2017) proposed using the method of sequential optimization, which includes k-means diversifying correlation clustering followed by asset optimization using a genetic algorithm based on the Sharpe ratio criterion. An empirical experiment demonstrated the superiority of this optimization method over classical methods Christopoulos et al. (2014).
Analysing and classifying the works devoted to classical and modern methods of investment, the author of this work has concluded that there is a gap in the research on specific issues of strategic portfolio investment. Most notably, the following facts of interest about the literature should be considered:
- Different treatment of generally accepted economic terms, use of various systems of mathematical and statistical designations, and a concurrent lack of formalization.
- Excessive concretization and restriction of research areas and a departure from the system-wide analysis towards the examination of narrow issues and situations that are not characteristic of the real-world modern economy.
- The lack of scientific papers dealing with the processes of globalization and acceleration of the economy, analysing its relationship with external, non-economic, information, and technological factors.
- The works dedicated to the dynamics of development and behaviour characteristics of crises in the economy are few.
- The works dedicated to the analysis of market strategies leave both the specification of the strategy and methods of quantitative strategy performance scoring unaddressed. To date, the only traditionally used method of scoring a strategy’s performance is simulation modelling.
From the above, the author defines the scope of the in-depth scientific study as follows:
- Formalization of the investment strategy methodology;
- Selection of methods for building an adaptive investment strategy;
- Observation of the methods of system analysis;
- Formalization of the construction and evaluation of investment strategies.
3. The Concept of Adaptive Investment Strategy
The paper proposes a neoclassical model of an adaptive stock market portfolio.
The main purpose of creating this portfolio is the idea of combining two neoclassical principles of portfolio investment:
- Portfolio optimization based on the market conditions;
- Maintenance of the adapted portfolio.
The mathematical expression of the optimal portfolio concept is the value of the calculated share of the i-th asset in the portfolio, depending on the superposition of functions, as shown in Equation (1):
where is an optimization function to optimally allocate the assets in the portfolio, is a function for selecting the optimal portfolio strategy, is the forecasting function to predict the market state, is the estimating function for evaluating the asset market state.
Let us present the basic concept of an adaptive portfolio strategy in the form of a diagram shown in Figure 1.
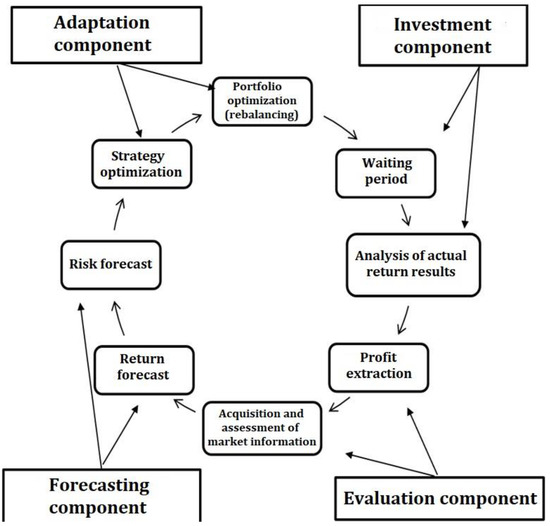
Figure 1.
The concept of adaptive investment strategy.
The concept includes the following mandatory, minimum required components.
Based on the concept, a mathematical model has been created that includes the following mandatory, minimum required components:
- Valuation—to objectively assess the current market situation and investment performance;
- Forecasting—to objectively express market expectations and trends;
- Investment—to lock in and gain profits and to upscale the portfolio and continue investing;
- Adaptation—to maintain the portfolio in the optimal condition in relation to the market.
The continuous, cyclical process of adapting the portfolio to the market allows the investor to keep the whole set of assets up to date and rebalance in time.
The cyclical nature of the process allows it to be repeated throughout the entire investment period, including in the case of long-term placement of funds on the strategic investment market.
4. Methodology
4.1. Evaluation Unit of the Adaptive Investment Portfolio Construction
Asset Return Estimation
The estimated return of an asset, reduced to the range , is calculated based on the absolute return and standard deviation, as follows in Equation (2):
where is an indicator of the reduced return on the asset, , H is Heaviside function, is the absolute return of the i-th asset in the period , is the maximum return of the i-th asset in achieved over the entire historical period, is the standard deviation of the price of the i-th asset in the period , is the accumulated standard deviation of the i-th asset,
Figure 2 shows the economic rationale of the asset estimation.
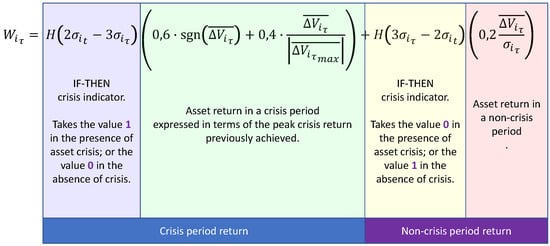
Figure 2.
Asset estimation: economic rationale.
The estimated return of the portfolio asset market is calculated according to Equation (3).
where is the portfolio indicator of the reduced return , n is the number of assets in the portfolio, is the portfolio share of the i-th asset, is an indicator of the reduced return on the i-th asset, and a is the bias: , .
The estimate of the overall market dynamics is calculated according to Equation (4)
where is a market indicator of the reduced return , n is the number of indices related to portfolio assets, is the portfolio share of the i-th index assets, is an indicator of the reduced return on the i-th index, and a is the bias: , .
The estimated investment performance is calculated according to Equation (5)
where is the relative portfolio return in the period , is the absolute portfolio return in the period , and is the average portfolio value in the previous analytical period .
The decision to rebalance the portfolio is made by the investor based on the results of expert analysis according to Equation (6)
where is the reduced market-average return, is the reduced portfolio return, is the transaction costs of rebalancing, is the relative investment return.
Figure 3 shows the economic rationale for rebalancing. If the portfolio’s return is worse than the market and it covers transaction costs, then rebalancing is necessary.

Figure 3.
Rebalancing: economic rationale.
4.2. Forecasting Unit of the Adaptive Investment Portfolio Construction
Predictive Elements of the Mathematical Model
As a description of the predictive component of the model, we use an additive mathematical model of the predictive ensemble similar to the SARIMAX models, which includes seasonal, regression, and shock elements, supplemented with bounding components and a neural network.
In general, the ensemble (aggregate) forecast model can be represented as the sum of the results of various forecasting methods, considering the individual degree of significance of each method (confidence coefficient) and the unexplained white noise that forms a random walk, according to Equation (7)
where F is the ensemble forecast of the value, m is the number of forecasting methods, is the confidence coefficient of the i-th method, is the forecast of the value according to the i-th method, and is the deviation resulting from white noise.
Let us define the main predictive trends:
- A general trend of growth or decline: linear trend;
- Outward bound trend: indicative trend;
- Inward bound trend: asymptotically linear trend;
- Periodic seasonal trends: wavelet set trends;
- Correlation trends: neural network trend.
Thus, the aggregate ensemble forecast corresponds to Figure 4 below.
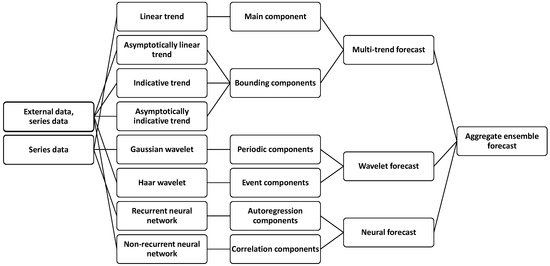
Figure 4.
Structure of the aggregate (ensemble) forecast.
Based on the financial time series of the LVMH.PA ISIN:FR0000121014 asset, we will represent a combined forecast. At the first stage, we will evaluate linear and asymptotic linear forecast.
The linear forecast is formed by the standard geometric diagonal method, using standard equations of the form (8).
where is the linear forecast of the value, a and b are the coefficients of the linear equation, t is the time in scale units, n is the number of observations, and V is the predicted value.
An asymptotic linear forecast is formed as gradually approaching a linear one. In this case, the negative coefficient of the indicative function is set so that the deviation from the linear trend at the point of the 85% prediction interval does not exceed 1%, and at the level of 100%, it is no higher than 0.5%, which corresponds to the value . The values of the linear forecast are used as upper or lower bounds. The asymptotic linear forecast of the asset value is formed according to Equation (9) and is presented in Figure 5.
where is the asymptotic linear forecast of the value, is the linear forecast of the value, is the value of the linear trend at the beginning of the forecast, is the value of the predicted variable at the beginning of the forecast, a is the smoothing coefficient of the asymptote, t is the time in scale units, and is the forecast lead time.
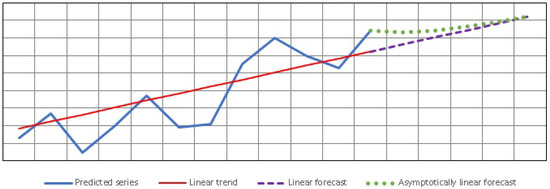
Figure 5.
Asymptotically linear forecast.
An indicative forecast is generated using LSM to compute the coefficient c of the indicative function based on the natural upper or lower bounds of the asset value, where the upper bound is taken as the limit corresponding to the maximum asset value achieved during the entire historical period adjusting for the inflation component, and the lower bound is the level of the trading halt, defined by the rules of the exchange on which the asset is traded. If the lower bound is not determined by the rules, then the minimum level of the asset price achieved over the historical period adjusted for inflation is used. Then, Equation (10) is true for the rising trend:
and Equation (11) is true for the declining trend.
Combining these formulas, we get a formula of the form (12)
where is the indicative forecast of the asset value, H is the Heaviside function, a is the slope coefficient of the linear equation, is the upper bound on the value, is the lower bound on the value, t is time, and c is the smoothness coefficient of the exponential function.
The asymptotic indicative forecast is formed in the same way as the asymptotic linear forecast, but the upper or lower bounds are given by the values of the indicative forecast, as shown in Equation (13) and is presented in Figure 6.
where is the asymptotically indicative forecast of the value, is the indicative forecast of the value, is the value of the indicative trend at the beginning of the forecast, is the value of the predicted variable at the beginning of the forecast, a is the smoothing coefficient of the asymptote, t is time in scale units, and is the forecast lead time.
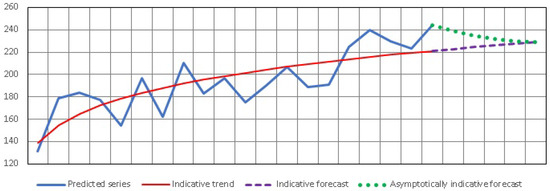
Figure 6.
The asymptotic indicative forecast.
A multi-trend forecast is formed as an additive set of the above-mentioned forecasting methods, considering their significance weights (confidence coefficients), determined empirically for each forecasting method and for each time series. According to the additivity rules, the multi-trend forecast will correspond with Equation (14).
where is the multi-trend forecast of the asset value, is the linear forecast of the asset value, is the asymptotic linear forecast of the asset value, is the indicative forecast of the asset value, is the asymptotic indicative forecast of the asset value, and is the confidence coefficients of the corresponding forecasting methods.
Bootstrap-Optimization of Forecast Parameters
Bootstrap optimization of forecast parameters is performed by calculating the optimal coefficients of predictive functions corresponding to the smallest sum of the root-mean-square error (RMSE) and the geometric test of normality of residuals for multiple predictions based on training historical data.
In the process, the following parameters are calculated:
- Coefficients of the linear equation: a, b;
- Smoothness coefficient of the exponential function: c;
- Smoothing coefficients of asymptotic forecasts: a;
- Optimal values of Turing, Durbin–Watson and Shapiro–Wilk tests;
- Coefficients of the significance gradient of forecasts ;
- Optimal confidence coefficients of forecasting methods .
Bootstrap optimization of forecast parameters is calculated using:
- Newton’s gradient optimization method (gradient descent).
Stochastic Monte Carlo optimization method (random selection).
Figure 7 shows the optimization of forecast parameters.
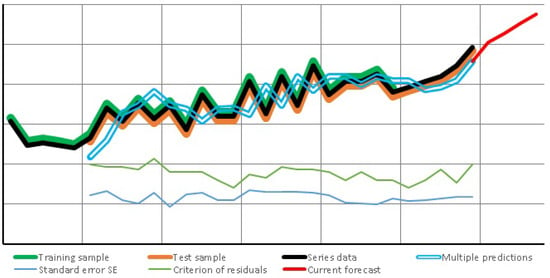
Figure 7.
Optimization of forecast parameters.
The standard root-mean-square error of the forecast is determined according to Equation (15).
where is the standard error of the asset value forecast according to the i-th method, is the forecast of the asset value according to the i-th method at the time t, is the asset value at the time t, and n is the test sample size.
The confidence interval of the neural and wavelet forecasts is calculated according to the standard method based on the assumption that the population distribution corresponds to the Student’s t-distribution, as shown in Equation (16).
where is the confidence interval of the wavelet forecast, is the table value of the Student’s t-distribution for the selected level , is the standard error of the wavelet forecast, and n is the number of observations.
Figure 8 shows a multi-trend forecast.
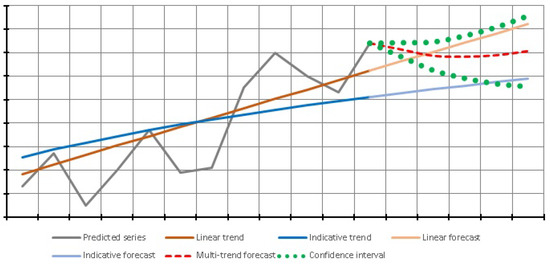
Figure 8.
The multi-trend forecast.
Correlation forecasts. In addition to the general upward or downward trends in the asset price expressed by a multi-trend forecast, it is necessary to consider the correlation characteristics of the time series, for which purpose the following forecasting techniques may be used:
- Lack of correlation in outliers: Haar wavelets;
- Seasonal correlation: Gaussian wavelets;
- Autocorrelation of a series: recurrent neural networks;
- Correlation with external data: non-recurrent neural networks.
The correlation components of the forecast are shown in Figure 9.
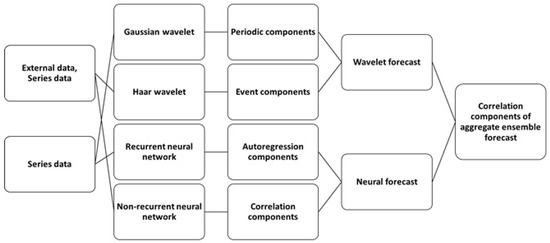
Figure 9.
Correlation components of the forecast.
A recurrent neural network generates a forecast reflecting autocorrelation processes of the time series (3) due to the presence of feedback (recurrent) connections. It is calculated by selecting input coefficients, association coefficients, and recursion coefficients for an artificial neural network. It is trained by the principle of a configurable “black box”, based on historical data using a combination of optimization methods: error backpropagation and Hopfield’s stochastic selection of coefficients.
Let us present a formula for calculating the forecast using a two-layer recurrent neural network (17):
where is the price forecast by the recurrent network at time t, is the depth of historical data for the forecast, is the asset price at time t, is the Verhulst function, m is the number of input neurons, n is the number of inputs of each neuron of the first layer, i is the order of the neuron, j is the order of the neural network input, is the coefficients of the input weights of the neuron calculated during training, and is the neuron recursion coefficients calculated during training.
Figure 10 shows the result of forecasting based on a neural network.
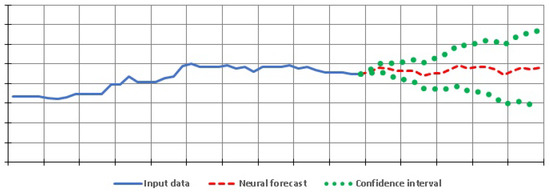
Figure 10.
The neural network forecast.
The wavelet forecast is formed by the method of sequential decomposition of a time series of wavelet sets similar to the Gauss wavelet, as shown in Equation (18).
where is the value of the i-th wavelet at time t, a is the wavelet amplitude, b is the wavelet compression coefficient, c is the wavelet decay coefficient, d is the wavelet shift coefficient, and t is the time.
The aggregate forecast of the asset value is formed as an additive set of results of each of the forecasting methods with the corresponding confidence coefficients, as shown Equation (19)
where is the aggregate forecast, is the multi-trend forecast, is the neural forecast, is the wavelet forecast, and is the corresponding confidence coefficient.
The confidence coefficients Figure 11 are calculated based on the previously obtained values of the confidence intervals of each of the forecasting methods, as the inverses of the fractions of the confidence intervals, as shown in Equation (20)
where is the corresponding confidence coefficients and is the confidence intervals of the corresponding methods.
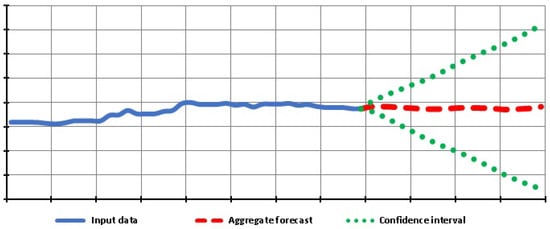
Figure 11.
The aggregate forecast.
4.3. Strategic Unit of the Investment Portfolio Construction
4.3.1. Formalization of the Concept of Adaptive Portfolio Strategy
Because there is no consistent, formalized definition of the concept of portfolio strategy in the economic literature, we propose the following definition: “A portfolio strategy is a set of rules and methods for investing assets (elements of the strategy) which determines both the difference between the risk and return parameters of the portfolio (investment corridor), and the ratio of return to risk (economic efficiency)”.
We formalize the strategy as a set of strategic rules, expressed as the sum of individual elements according to Equation (21):
where S is the aggregate estimate of the portfolio strategy, m is the number of strategy elements, is the weight of the portfolio strategy element.
Let us determine the most common elements of investment strategies, namely: the profit-taking threshold, the aggregate risk of the portfolio, the type of asset diversification, the degree of diversification, and the degree of portfolio dynamism (rebalancing frequency).
Then, the estimate of portfolio strategy can be represented according to Equation (22):
where is the weight of the portfolio strategy element, is the upper profit-taking threshold, is the type of diversification, is the degree of diversification, is the degree of portfolio dynamism, and is the aggregate risk of the portfolio.
Depending on the scope of application, a formal strategy may have certain elements, including those not described above, or have a single parameter such as the aggregate risk in the “buy and hold” strategy. For guaranteed profit maximization, the strategy must be aligned with the current market state; hence, the more aggressive high-risk elements of the strategy will be optimal for growth periods, while the more cautious elements will be optimal for decline periods. In Table 1, following the market state, the components of the strategy are ranked according to the degree of risk, and in Table 2, the weights of the strategy elements are shown in correspondence with the current market situation.

Table 1.
The ranked nominal scale of strategy elements.

Table 2.
Weights of the strategy elements with regard to the market state.
Because different levels of market risk allow ordering the strategy elements according to their degree of compliance with the current market situation, it is obviously necessary to bring them to a normalized scale of weights, where the weights of the corresponding nominal values of elements are calculated based on the total number of state ranks, the number of elements in the strategy, and the assumption of their equilibrium, as shown in Equation (23):
where is the minimum weight of elements for the lowest risk rank, is the maximum value of the individual estimate of the portfolio strategy, m is the number of strategy elements, and n is the number of market state ranks.
Accordingly, the optimal value of the individual estimate of the portfolio strategy is determined according to Equation (24).
where is the optimal value of the individual estimate of the portfolio strategy, m is the number of strategy elements, is the current rank of the market state, and is the minimum weight of elements for the lowest risk rank.
This approach allows for the assessment of the compliance of the actual strategy applied with the current state of the portfolio asset market. In this case, the estimate Q expresses the degree of compliance of the current strategy with the possible optimum, as shown in Equation (25).
where Q is the estimate of the strategy quality, is the optimal value of the individual estimate of the portfolio strategy, and is the value of the individual estimate of the portfolio strategy actually applied.
4.3.2. Formalization of the Dynamic Optimization Concept
Let us imagine the optimal asset allocation in a dynamic investment portfolio based on a superposition of functions:
- Optimizing portfolio performance;
- Selecting the optimal portfolio strategy;
- Forecasting portfolio performance;
- Determining the market state.
As shown in Equation (26):
where O is the function for optimizing the asset shares depending on the chosen strategy, S is the function for selecting an investment strategy depending on the forecast, F is the function for forecasting the performance depending on the market state, and is the condition indicator of the portfolio asset market.
The optimal portfolio, accordingly, can be represented as a set of assets with optimal portfolio shares, according to Equation (27).
It should be taken into account that the process of bringing the portfolio to an optimal asset allocation, which is portfolio rebalancing, has both natural prerequisites and natural limitations. The main prerequisite for optimization is a change in the state of the portfolio asset market or the forecast of portfolio performance. There are also limitations, determined by rebalancing costs. Thus, portfolio optimization should be performed only in cases where the expected long-term guaranteed return will cover the costs associated with changing the portfolio structure.
Thus, the formalized optimization process (Equation (28)) has the following meaning: the maximization of the projected portfolio efficiency is carried out with restrictions on the degree of risk and monopolization of the portfolio determined by the current state of the portfolio asset market.
where is the projected efficiency of the investment portfolio, is the actual total portfolio risk, is the recommended maximum allowable portfolio risk, is the portfolio share of the i-th asset, and is the diversification restriction of the portfolio share of the i-th asset.
Figure 12 displays the algorithmic model of the dynamic adaptive investment portfolio. The dynamic portfolio management algorithm, being a continuous cyclical sequence of repeated operations, ensures the maintenance of the optimal ratio of assets in the portfolio to obtain the maximum return for the forecast analytical period.
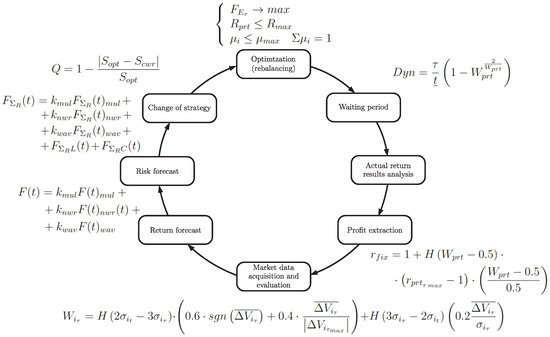
Figure 12.
Methodology of adaptive investment strategy.
5. Results
5.1. Statistical Verification of the Hypothesis on the Advantages of the Developed Adaptive Investment Strategy in Comparison with the Strategy of H. Markowitz
The purpose of the experiment is to test the hypothesis of the economic advantage of a dynamic portfolio over a strategic, classically optimal portfolio of H. Markowitz for the Moscow Exchange assets.
To simulate the market behaviour, we used weekly historical data from 1 January 2000 to 15 September 2014 for assets with the following tickers:
- US1 BAC—Bank of America stock (stocks);
- SNGS—Surgutneftegaz stock (stocks);
- LKOH—Lukoil stock (stocks);
- USD RUB—US dollar (currency);
- EUR RUB—Euro (currency);
- ICE BRN—Brent crude oil (contracts);
- Comex GC—physical gold (contracts);
- LME Alum—physical aluminium (contracts).
The sample test is the asset lifetime of at least 10 years.
- Sample units are conceived of as the earning power of assets in the portfolio;
- —dynamic portfolio is more efficient than the portfolio of H. Markowitz;
- —dynamic portfolio is not more efficient than the portfolio of H. Markowitz;
- —dynamic portfolio is less efficient than the portfolio of H. Markowitz;
- ; ; ; ; ;
- : ;
- : ;
- .
Let us perform a binomial grouping for . Consider the histogram in Figure 13.
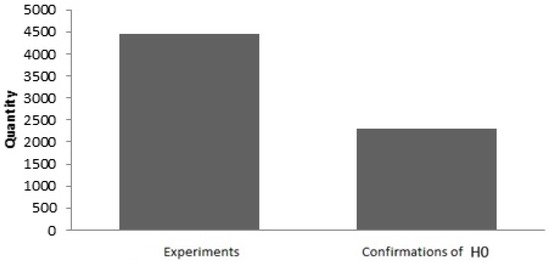
Figure 13.
Binomial histogram for .
When considering the histogram, the assumed tendencies are identified. Intuitive acceptance of did not happen.
Let us perform the evaluation using the exact binomial test:
The rejection of is obtained; thus, we accept .
Let us perform a binomial grouping for . Consider the histogram in Figure 14.
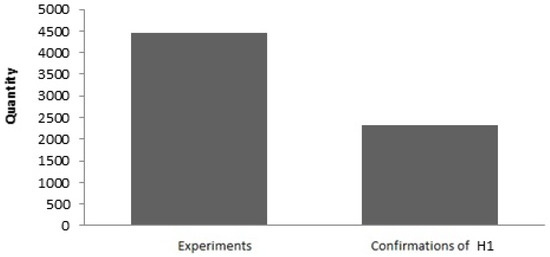
Figure 14.
Binomial histogram for .
When considering the histogram, the assumed tendencies are identified. Intuitive acceptance of did not happen.
Let us perform the evaluation using the exact binomial test:
The rejection of and is obtained; thus, we accept .
Conclusion: the dynamic portfolio of the Moscow Exchange assets is more efficient for strategic investment than the static, classically optimal Markowitz portfolio of the same assets.
5.2. Statistical Verification of the Hypothesis on the Advantages of the Developed Adaptive Investment Strategy in Comparison with the Strategy of R. Roll
The purpose of the experiment is to test the hypothesis on the economic advantage of adaptive investment strategy over the strategy of the rebalanceable Roll’s portfolio.
- Representativeness—covers the same set of assets that was used in the previous experiment;
- The sample test is the asset lifetime of at least 10 years.
- Sample units are conceived of as the earning power of assets in the portfolio;
- —dynamic portfolio is more efficient than Roll’s portfolio;
- —dynamic portfolio is not more efficient than Roll’s portfolio;
- —dynamic portfolio is less efficient than Roll’s portfolio.
The rejection test is the exact binomial test.
- ; ; ; ; ;
- : ;
- : ;
- .
Results of the experiment: ; ; .
Let us perform a binomial grouping for . Consider the histogram in Figure 15.
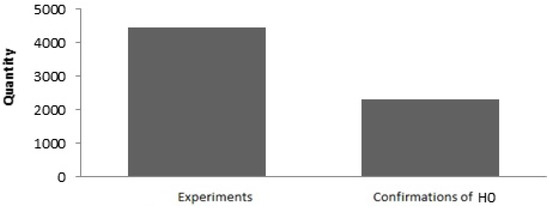
Figure 15.
Binomial histogram for .
When considering the histogram, the assumed tendencies are identified. Intuitive acceptance of did not happen.
Let us perform the evaluation using the exact binomial test as Equation (29).
The rejection of is obtained; thus, we accept .
Let us perform a binomial grouping for . Consider the histogram in Figure 16.
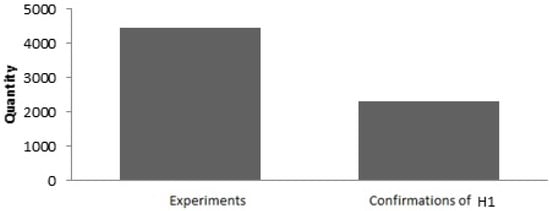
Figure 16.
Binomial histogram.
When considering the histogram, the assumed tendencies are identified. Intuitive acceptance of did not happen.
Let us perform the evaluation using the exact binomial test as Equation (30).
Rejection of and is obtained; thus, we accept .
Conclusion: a dynamic portfolio of MICEX assets is more efficient for strategic investment than the classically optimal rebalanceable Roll’s portfolio for the same assets.
The analysis of the results showed a comparative advantage of the dynamic adaptive strategy over models based on classical concepts.
6. Discussion and Conclusions
Thus, a comprehensive methodology has been developed for building adaptive, market-resistant strategic investment portfolios. This methodology includes the basic concepts of predictive market assessment, strategic adaptability and dynamic optimization, as well as mathematical tools necessary for the formation of long-term dynamic strategies in the financial market.
The following tasks are solved in the article:
- The concept of adaptive strategic portfolio investment adjustable to changing market conditions, and specifically non-standard conditions, is developed and formalized;
- The components of the aggregate return are specified. Generalized economic and mathematical models of the return are developed, based on the strategy adaptation to market conditions and considering the specifics of the dynamic processes of the modern financial market;
- An efficient tool for long-term forecasting of return is selected or developed based on a qualitative assessment of forecasting methods, rather than a rather than a quantitative assessment, which allows a strategic investor to detect the early moments of the onset of specific market conditions that require investment strategy adjustments.
- A statistically justified, fully formalized, and easily applicable simulation model of a strategic investment portfolio is developed, based on the concept of adapting the strategy to market conditions and modern mathematical tools used in the analysis and strategy optimization in the modern financial market;
- An empirical assessment of the created portfolio strategy model is carried out based on actual data, and a basic portfolio return comparison is performed on the resulting model with real-world and theoretical analogues available within the framework of MPT and PMPT.
Funding
This research received no external funding.
Institutional Review Board Statement
Not applicable.
Informed Consent Statement
Not applicable.
Data Availability Statement
Not applicable.
Conflicts of Interest
The author declares no conflict of interest.
References
- Aboussalah, Amine Mohamed, and Chi-Guhn Lee. 2020. Continuous control with stacked deep dynamic recurrent reinforcement learning for portfolio optimization. Expert Systems with Applications 140: 112891. [Google Scholar] [CrossRef]
- Black, Fischer, and Myron Scholes. 1973. The pricing of options and corporate liabilities. Journal of Political Economy 81: 637–54. [Google Scholar] [CrossRef]
- Bordag, Ljudmila A., and Ivan P. Yamshchikov. 2017. Optimization problem for a portfolio with an illiquid asset: Lie group analysis. Journal of Mathematical Analysis and Applications 453: 668–99. [Google Scholar] [CrossRef]
- Chang, Jui-Fang, and Peng Shi. 2011. Using investment satisfaction capability index based particle swarm optimization to construct a stock portfolio. Information Sciences 181: 2989–99. [Google Scholar] [CrossRef]
- Chen, Zhanhui, and Bowen Yang. 2019. In search of preference shock risks: Evidence from longevity risks and momentum profits. Journal of Financial Economics 133: 225–49. [Google Scholar] [CrossRef]
- Cheong, Donghyun, Young Min Kim, Hyun Woo Byun, Kyong Joo Oh, and Tae Yoon Kim. 2017. Using genetic algorithm to support clustering-based portfolio optimization by investor information. Applied Soft Computing 61: 593–602. [Google Scholar] [CrossRef]
- Christopoulos, Apostolos G., Spyros Papathanasiou, Petros Kalantonis, Andreas Chouliaras, and Savvas Katsikidis. 2014. An investigation of cointegration and casualty relationships between the piigs’ stock markets. European Research Studies Journal 17: 109–23. [Google Scholar]
- Chuang, Chun-Ling. 2013. Application of hybrid case-based reasoning for enhanced performance in bankruptcy prediction. Information Sciences 236: 174–85. [Google Scholar] [CrossRef]
- Daryani, Amin Mohammadnejad, Mohammad Mohammadpour Omran, and Ahmad Makui. 2020. A novel heuristic, based on a new robustness concept, for multi-objective project portfolio optimization. Computers & Industrial Engineering 139: 106187. [Google Scholar]
- de Oliveira, Joao F. L., Eraylson G. Silva, and Paulo S. G. de Mattos Neto. 2021. A hybrid system based on dynamic selection for time series forecasting. IEEE Transactions on Neural Networks and Learning Systems 33: 3251–63. [Google Scholar] [CrossRef]
- Ivanyuk, Vera. 2021a. Formulating the concept of an investment strategy adaptable to changes in the market situation. Economies 9: 95. [Google Scholar] [CrossRef]
- Ivanyuk, Vera. 2021b. Modeling of crisis processes in the financial market. Economies 9: 144. [Google Scholar] [CrossRef]
- Ivanyuk, Vera. 2022. Developing a crisis model based on higher-order moments. Heliyon 8: e08896. [Google Scholar] [CrossRef] [PubMed]
- Kaczmarek-Majer, Katarzyna, and Olgierd Hryniewicz. 2019. Application of linguistic summarization methods in time series forecasting. Information Sciences 478: 580–94. [Google Scholar] [CrossRef]
- Li, Bo, Yufei Sun, Grace Aw, and Kok Lay Teo. 2019. Uncertain portfolio optimization problem under a minimax risk measure. Applied Mathematical Modelling 76: 274–81. [Google Scholar] [CrossRef]
- Makridakis, Spyros, Evangelos Spiliotis, and Vassilios Assimakopoulos. 2020. The m4 competition: 100,000 time series and 61 forecasting methods. International Journal of Forecasting 36: 54–74. [Google Scholar] [CrossRef]
- Markowitz, Harry. 1952. Portfolio selection. The Journal of Finance 7: 77–91. [Google Scholar]
- Markowitz, Harry. 1959. Portfolio Selection: Efficient Diversification of Investments. New York: John Wiley, vol. 16. [Google Scholar]
- Merton, Robert C. 1973. Theory of rational option pricing. The Bell Journal of Economics and Management Science 4: 141–83. [Google Scholar] [CrossRef]
- Mohebbi, Negin, and Amir Abbas Najafi. 2018. Credibilistic multi-period portfolio optimization based on scenario tree. Physica A: Statistical Mechanics and Its Applications 492: 1302–16. [Google Scholar] [CrossRef]
- Mossin, Jan. 1966. Equilibrium in a capital asset market. Econometrica 34: 768–83. [Google Scholar] [CrossRef]
- Nystrup, Peter, Erik Lindström, Pierre Pinson, and Henrik Madsen. 2020. Temporal hierarchies with autocorrelation for load forecasting. European Journal of Operational Research 280: 876–88. [Google Scholar] [CrossRef]
- Pollard, Matthew. 2008. Mean-Variance Efficiency and the Capital Assets Pricing Model. Available online: https://www.coursehero.com/file/5875917/Proof-of-Mean-Variance-Tautology/ (accessed on 24 November 2022).
- Post, Thierry, Selçuk Karabatı, and Stelios Arvanitis. 2018. Portfolio optimization based on stochastic dominance and empirical likelihood. Journal of Econometrics 206: 167–86. [Google Scholar] [CrossRef]
- Ranković, Vladimir, Mikica Drenovak, Branko Urosevic, and Ranko Jelic. 2016. Mean-univariate garch var portfolio optimization: Actual portfolio approach. Computers & Operations Research 72: 83–92. [Google Scholar]
- Roll, Richard, and Stephen A. Ross. 1980. An empirical investigation of the arbitrage pricing theory. The Journal of Finance 35: 1073–103. [Google Scholar] [CrossRef]
- Rom, Brian M., and Kathleen W. Ferguson. 1994. Post-modern portfolio theory comes of age. Journal of Investing 3: 11–17. [Google Scholar] [CrossRef]
- Sharpe, William F. 1964. Capital asset prices: A theory of market equilibrium under conditions of risk. The Journal of Finance 19: 425–42. [Google Scholar]
- Sortino, Frank A., and Lee N. Price. 1994. Performance measurement in a downside risk framework. The Journal of Investing 3: 59–64. [Google Scholar] [CrossRef]
- Taylor, Nick. 2019. Forecasting returns in the vix futures market. International Journal of Forecasting 35: 1193–210. [Google Scholar] [CrossRef]
- Tobin, James. 1969. A general equilibrium approach to monetary theory. Journal of Money, Credit and Banking 1: 15–29. [Google Scholar] [CrossRef]
- Trucios, Carlos. 2019. Forecasting bitcoin risk measures: A robust approach. International Journal of Forecasting 35: 836–47. [Google Scholar] [CrossRef]
- Vo, Nhi N. Y., Xuezhong He, Shaowu Liu, and Guandong Xu. 2019. Deep learning for decision making and the optimization of socially responsible investments and portfolio. Decision Support Systems 124: 113097. [Google Scholar] [CrossRef]
- Wu, Linlong, Yiyong Feng, and Daniel P. Palomar. 2019. General sparse risk parity portfolio design via successive convex optimization. Signal Processing 170: 107433. [Google Scholar] [CrossRef]
- Yang, Li, Longfeng Zhao, and Chao Wang. 2019. Portfolio optimization based on empirical mode decomposition. Physica A: Statistical Mechanics and Its Applications 531: 121813. [Google Scholar] [CrossRef]
- Yang, Pei-Yi, Zhao-Rong Lai, Xiaotian Wu, and Liangda Fang. 2018. Trend representation based log-density regularization system for portfolio optimization. Pattern Recognition 76: 14–24. [Google Scholar] [CrossRef]
- Zakamulin, Valeriy. 2017. Superiority of optimized portfolios to naive diversification: Fact or fiction? Finance Research Letter 22: 122–28. [Google Scholar] [CrossRef]
- Zhang, Keyi, Ramazan Gençay, and M. Ege Yazgan. 2017. Application of wavelet decomposition in time-series forecasting. Economics Letters 158: 41–46. [Google Scholar] [CrossRef]
Publisher’s Note: MDPI stays neutral with regard to jurisdictional claims in published maps and institutional affiliations. |
© 2022 by the author. Licensee MDPI, Basel, Switzerland. This article is an open access article distributed under the terms and conditions of the Creative Commons Attribution (CC BY) license (https://creativecommons.org/licenses/by/4.0/).