Article

An Examination of Ticket Pricing in a Multidisciplinary Sports Mega-Event

by
Francesc Solanellas
1,2,*,
Joshua Muñoz
1,2,* and
Josep Petchamé
3
1
National Institute of Physical Education of Catalonia (INEFC), University of Barcelona (UB), 08038 Barcelona, Spain
2
Grup d’Investigació Social i Educativa de l’Activitat Física i de l’Esport (GISEAFE), INEFC, University of Barcelona (UB), 08038 Barcelona, Spain
3
Department of Engineering, Universitat Ramon Llull (URL), 08022 Barcelona, Spain
*
Authors to whom correspondence should be addressed.
Economies 2022, 10(12), 322; https://doi.org/10.3390/economies10120322
Submission received: 19 October 2022 / Revised: 2 December 2022 / Accepted: 7 December 2022 / Published: 14 December 2022

Abstract

:
Some studies have examined ticket sales in the context of a sporting event. However, only a few have investigated the determinants of ticket prices, and, to date, none have done so in the context of a multidisciplinary sports mega-event. This study examines this complex paradigm through the case of the World Swimming Championships held in Barcelona, Spain. The particular focus of this study was whether, in such a framework, the same model of analysis of price determinants could be applied equally to all the disciplines that comprise the sporting mega-event. The applied model was significant, explaining the ranges of variation of the ticket prices in the different sport disciplines. The main hypothesis was rejected, which suggests that when examining price determinants in multidisciplinary sport mega-events, it will be convenient to implement a different model for each sporting discipline (aquatic, in the case at hand). These results can help professionals better understand consumer fluctuations throughout the ticket sales process in such an environment, in order to appropriately price tickets. This, in turn, will lead to maximizing revenue, as well as attendance, at sporting events.

1. Introduction

It is well known that spectators play a fundamental role in sporting events since, on the one hand, they co-create value with the athletes, and on the other hand, they can provide important income to the organisers (Chappelet 2013; Howard and Crompton 2004). This makes it clear how important spectator attendance is to the success of an event, and since tickets cannot be sold after completion, it is imperative that sports organisations constantly maximise sales opportunities (Patel 2018). Although the literature on revenue management is extensive, historically there has been relatively little specific research in the field of sporting events (Balseiro et al. 2011), and in particular, ticket sales as a source of income (Hoye et al. 2018). A source of revenue that is particularly relevant in this environment according to diverse research works, e.g., Bradbury (2020) or Smith (2013), is ticket sales, since between 80 and 90% of MLS teams’ income is produced on match day. In this line, Bradbury (2020) stated that “despite its growth in popularity remains more dependent on spectator revenue than other US sports leagues”. Similarly, ticket sales are still a crucial source of income for sports organisations such as European football clubs. In fact, ticket sales revenues accounted for 15–19% of the total income of four of the highest earning European football teams (F.C. Barcelona, Real Madrid C.F., Manchester United F.C., and Liverpool) in 2019/2020 season (Deloitte 2021). These figures are a similar percentage to the case that concerns us in the present investigation, since according to the Report to the General Congress on the verification of the four years 2013–2016 financial statements of the Fédération Internationale de Natation (International Swimming Federation, FINA), the income generated by the host cities of the World Swimming Championship (which was mostly derived from ticket sales) represented 16% for the mentioned period. Thus, although broadcasting, sponsorship, and commercial revenues may reduce the relative contribution of ticketing revenue, the latter remains of paramount importance to the event’s financial success (Smith 2017). Authors such as Chappelet (2013) and Shapiro and Drayer (2014) have pointed out in their research that ticket sales and stadium attendance can help sports organisations generate more sponsorship or ancillary revenues (e.g., parking, concessions, etc.).
Over the years, the significant importance of ticket sales in sports has attracted the interest of researchers and practitioners. As will be discussed in the next section, several authors, such as Drayer et al. (2012), have pointed out that previous studies that aimed to examine ticket sales in the context of a sporting event did so through different approaches. In this sense, it should be noted that although there are some studies that approached the problem through the analysis of the possible determinants of ticket prices (Rishe and Mondello 2003, 2004; Shapiro and Drayer 2014; Kemper and Breuer 2016), the vast majority of research has focused its analysis on the factors that can affect variations in consumer demand (Boyd and Boyd 1998; Falter and Perignon 2000; Forrest and Simmons 2002; Lemke et al. 2010). In turn, it was found that most of the research was addressed through the analysis of samples such as a particular sports organisation (Shapiro et al. 2016; Kemper and Breuer 2016) or some teams that compete in a league (Rishe and Mondello 2003; Xu et al. 2019), but none of the previous works proposed the analysis of ticket sales in sports mega-event environments, perhaps due to the difficulty of obtaining complete and comprehensive databases with specific information on an event with these characteristics (Kemper and Breuer 2016).
This research aims to contribute its grain of sand to the literature, analysing for the first time some price determinants in a multidisciplinary sports mega-event context; and to explore if the same model could be applied within this framework for an analysis of the determinants of the ticket price for all the disciplines comprising the sporting mega-event. Therefore, the sale of tickets for the World Swimming Championship (WSC) was examined, which, due to the multidisciplinary nature of the event, comprises six sports disciplines. It is also worth highlighting the theoretical and practical contribution of the study, as it is the first to shed light on the purchasing behaviour of consumers, in the process of selling tickets for a sporting event of these characteristics, due to the analysis of variables such as purchase time in advance, the purchase channel, or the types of sessions that customers attend, among others.
Finally, by fostering measures that allow an empirical analysis of a multidisciplinary sports mega-event, the authors wish to catalyse further research in this area and improve understanding of the factors that may be key to decision-making and the successful implementation of pricing policies (Sheth et al. 2004; Solanellas and Muñoz 2021); for as Zsigmond et al. (2020) pointed out, “addressing the price-sensitive customer and motivate them to buy requires a thoughtful and considered marketing strategy in the field of sport” (12).

2. Literature Review

2.1. Ticket Sales, a Concern for Years

From a historical perspective, the pioneering investigations of Rothstein (1971) and Littlewood (1972) on overbooking in airlines and hotels marked the starting point of general interest in the field of revenue management. However, according to Bitran and Caldentey (2003), it was after the works of Beloba (1987) and Smith et al. (1992) that the field of study took off. Research on sales in the cruise line industry (Ladany and Arbel 1991), the hotel industry (Bitran and Gilbert 1996), and for internet providers (Nair and Bapna 2001) are some examples of research on income management, and that, in some way, set a precedent for researchers from various areas to show their interest in this field of study.
Ticket sales at sporting events has been extensively studied in recent decades (Drayer et al. 2012). Among other aspects, this has been due to the need for academics and practitioners to expand their knowshledge in this field to improve the implementation of optimal strategies for setting ticket prices, to lead to the maximisation of income and greater attendance of spectators to events (Shapiro and Drayer 2014).
Drayer et al. (2012) and Shapiro and Drayer (2014) identified how, over time, research that focused on the primary market was approached from many different perspectives, such as the research carried out by Scully (1994) and Noll (1974) with the intention of estimating the elasticity of demand for professional baseball and basketball; the outstanding research carried out decades later by Reese and Mittelstaedt (2001), where they explored, for the first time, the criteria used to establish the price of tickets in the NFL; or Rishe and Mondello (2004), who analysed various determinants of the price of the four major sports leagues in North America. However, there have also been recent approaches such as those carried out by Drayer and Martin (2010) and Shapiro and Drayer (2014), who showed interest in the ticket resale market; or the perspective of studies by Kaiser et al. (2019), Nalbantis et al. (2017), and Popp et al. (2018), who set out to examine the preferences of spectators of sporting events for tickets, and their willingness to pay.
In short, in the study of ticket sales for sporting events, two main approaches were identified: an examination of the determinants that influence variations in consumer demand, trying to explain them through an analysis of different factors such as the advantage of playing at home (Boyd and Boyd 1998), the uncertainty of the results (Falter and Perignon 2000; Forrest and Simmons 2002), or the performance of the team and the player (Lemke et al. 2010), among others; or secondly, analysis focused on the determinants of ticket prices through various variables such as the team’s performance during the previous season, the income needs of the organisation, the time of the season or the day of the game, seat, or ticket availability, etc. (see Rishe and Mondello (2004), Shapiro and Drayer (2014), and Kemper and Breuer (2016), as reference studies regarding price determinants, for a better understanding of the different approaches).

2.2. Ticket Pricing Strategies

Examining the literature in question, it can be seen how the analysis of ticket sales in sporting events depended to a certain extent on the implemented strategies themselves, regarding the pricing of tickets for the events analysed. Strategies that, in general, have evolved considerably in the last three decades from a fixed cost-plus approach (considering several aspects such as profit or market competition), to variable ticket pricing (VTP) based on different aspects (quality of the rival, seat location, day of the week, etc.), which led to the widespread adoption of dynamic ticket pricing (DTP), where ticket prices change over time based on fluctuating demand conditions (Dwyer et al. 2013; Patel 2018), allowing organisations to assess consumer demand and market factors to price their event more effectively (Moe et al. 2011). It could also be said that these three general strategies offer a wide range of combinations and possibilities, with their pros and cons, that organisations can use as they see fit to maximise revenue (and extract consumer surplus) from ticket sales. Thus, with the aim of providing an overview to the reader, some of the most popular practices are outlined below.

2.2.1. Two-Part Pricing

This strategy involves a fixed upfront payment, such as a membership fee, plus a unit price charged as a usage fee for the service purchased (Oi 1971; Varian 1989). The implementation of such a strategy can be recognised in different sports organisations such as, for instance, those dedicated to fitness services or clubs, such as tennis, paddle tennis, golf, etc., where the membership fee does not include all the services provided and the consumer has to pay a unit price for, say, playing a tennis match or attending a special class. Such practices can also be identified even in sporting events, where recently one can find cases where, despite paying a membership fee for a season’s seat, there are certain events (e.g., special matches, such as finals, etc.) that show two-part pricing. However, this type of strategy is rarely used in “one-off sporting events”, as what organisations seek by using a membership fee is primarily to increase customer loyalty (Dick 1995; Butscher 1999), and sporting events such as WSC are of fleeting duration, which makes it more complicated to operationalise such a strategy. However, it could be highlighted as something interesting to explore in the near future by sports organisations that, even if they organise one-off events, to organise them over a certain period of time.

2.2.2. Price Discrimination

Broadly speaking, this model seeks to sell two “similar” products at different prices (Armstrong 2006). This strategy, in turn, can occur in a multitude of combinations such as anonymous discrimination (selling at a different price to two consumers), quantity discounts (the greater the quantity of a product purchased, the greater the discount), bundling discounts, etc. However, while it might initially appear to be a strategy that is certain to lead to revenue maximisation, for example, by allowing firms to offset the benefits of setting a low price in a competitive market against a high price in a captive market (Armstrong 2006), the reality is that without sufficient information about the market or consumer preferences (such as information about each consumer’s willingness to pay for the products or services provided) (Kaiser et al. 2019), or without a compelling reason behind it, such as, for example, social pricing sometimes implemented by governments or organisations offering essential goods and services, it is very difficult to implement. A poor implementation of such a strategy could generate a good breeding ground for the creation of a secondary market. Setting different prices in different regions, for different groups, or according to purchasing channels, etc., could lead to organisations or individuals reselling goods purchased at low prices. This could occur not only due to the implementation of price discrimination strategies, but also because technological advances would allow it. Organisations have recently been concerned to address this issue, with the development of systems to prevent resale and to have greater control over the secondary market. For example, some leisure events have been found that sell tickets electronically with personal identification, or even establish a single mandatory resale channel (such as the official website of the event).
At the same time, in an environment such as sporting events, another adverse effect that could occur from such discrimination is that it could damage the organisation’s image by undermining consumer confidence, by selling the same ticket at different prices to different groups; something that, if realised by consumers, could even have a negative impact in long-term business relationships (Morgan and Hunt 1994).

2.2.3. Peak Load Pricing

This is a strategy that deals with situations where demand varies, but supply cannot adjust in real time to respond to changes in demand (Courty 2000). When demand varies in a predictable way, peak-load pricing predicts that prices should increase in periods of high demand, and decrease in periods of low demand. However, such a strategy requires prior information on consumer behaviour patterns that allows peak-load pricing to stand out. Nonetheless, while it can be helpful for price prefixing for some sporting events—for example, for a club season, or for an event that is repeated several times in a short period of time such as a play—there are some adverse effects when demand may vary unpredictably. In these situations, managers may find themselves with little room for manoeuvre, leading to under- or over-estimated ticket pricing, which can work against the organisation’s objectives to maximise revenue and attendance at the event.
Ultimately, while we could find different combinations of pricing systems to implement, while fixed and VTP strategies are based on setting prices in advance of sport events (Rascher and Schwarz 2012), the implementation of a DTP strategy helps organisations to adjust prices in real time (Drayer et al. 2012; Paul and Weinbach 2013), proving to be a valuable tool to ensure that tickets are sold at an appropriate price based on supply and demand factors (Sweeting 2012). In fact, authors such as Rishe (2012) highlight how the application of a DTP framework can help sports organisations increase their revenue from ticket sales by 5–30%. It is also important to note that DTP allows organisations to overcome some of the limitations of other types of strategies, such as the ability to influence the secondary market by adjusting ticket prices (Drayer et al. 2012; Paul and Weinbach 2013), placing the emphasis on demand and being able to take action on the price sensitivity of consumers. However, the research on price determinants in a demand-based pricing environment (Shapiro and Drayer 2014) and real-time pricing research within spectator sport is limited, since the initial implementation occurred in 2009 (Drayer et al. 2012).

2.3. The World Swimming Championship Case

The recent approaches of Shapiro and Drayer (2014) and Kemper and Breuer (2016) were to conduct their studies on determinants of the dynamic price of tickets (in the MLS, and in an English soccer club, respectively) by analysing a multitude of variables in explanatory models that resulted in quite high R2 values (>70%) on the variance in the price of the ticket. The theoretical foundation of this article is also based on the dynamic pricing theory. Therefore, the present study extends the existing literature by focusing on a context such as the 2013 World Swimming Championships organised in Barcelona, thus, being the first study to contribute to the body of knowledge on the analysis of DTP sales in a multidisciplinary sports event, while also hoping that it will serve sports management professionals when making decisions in setting pricing policies (Drayer et al. 2012) for a sporting event of such magnitude.

3. Methods

3.1. Contextualisation

The FINA World Championship is the major sporting event of the International Swimming Federation and the World Championships for Aquatic Sports. In addition, it is worth mentioning that, in the case in point, the BCN WSC could be considered the second most important sporting event organised in the city of Barcelona in recent decades, only behind the 1992 Olympic Games (Solanellas and Camps 2017). In this respect, the authors would like to highlight the originality of the present study, since the magnitude of such a sporting event, which has never been analysed before, together with the possibility of analysing the entire database (46,181 price points) of the event for which the data were very difficult to obtain (as can be understood from the scarce literature in the field, and the year for which the data were available; as organising committees are sometimes not very open to sharing this data for research purposes), make this research a unique study in the field.
In the WSC, six aquatic sport competitions are held over approximately two weeks: swimming, synchronised swimming, men’s and women’s water polo, diving, high diving, and open water swimming. However, for research purposes, and because of the ticketing selling process itself, in this study, water polo disciplines were treated separately, and the opening ceremony event was also analysed as a subevent, resulting in a total of 8 subevents that composed the multidisciplinary sports mega-event.
It is also important to note that looking into the schedule of the BCN WSC for the two weeks in which the event occurred, some of the competitions began when others had finished, while others overlapped during those days. The opening ceremony was held on the 19th of July 2013, and the closing ceremony on the 4th of August 2013. Competitions were held during these 17 days in several sports installations: the Sant Jordi Arena swimming pool, the Barcelona City Council pool, the Bernat Picornell swimming pools, and Barcelona Harbour.

3.2. Variables

The studies noted in the literature review section constituted a very good reference point for this research by virtue of their classification of independent variables (e.g., Rishe and Mondello 2004; Shapiro and Drayer 2014; Kemper and Breuer 2016). Therefore, the variables were chosen based on those that best fit the competition format to be analysed, as well as the use of the data available in the database that the organising committee provided to the researchers.
The dependent variable was the ticket price (of each single ticket, in EUR), and the independent variables were:
-
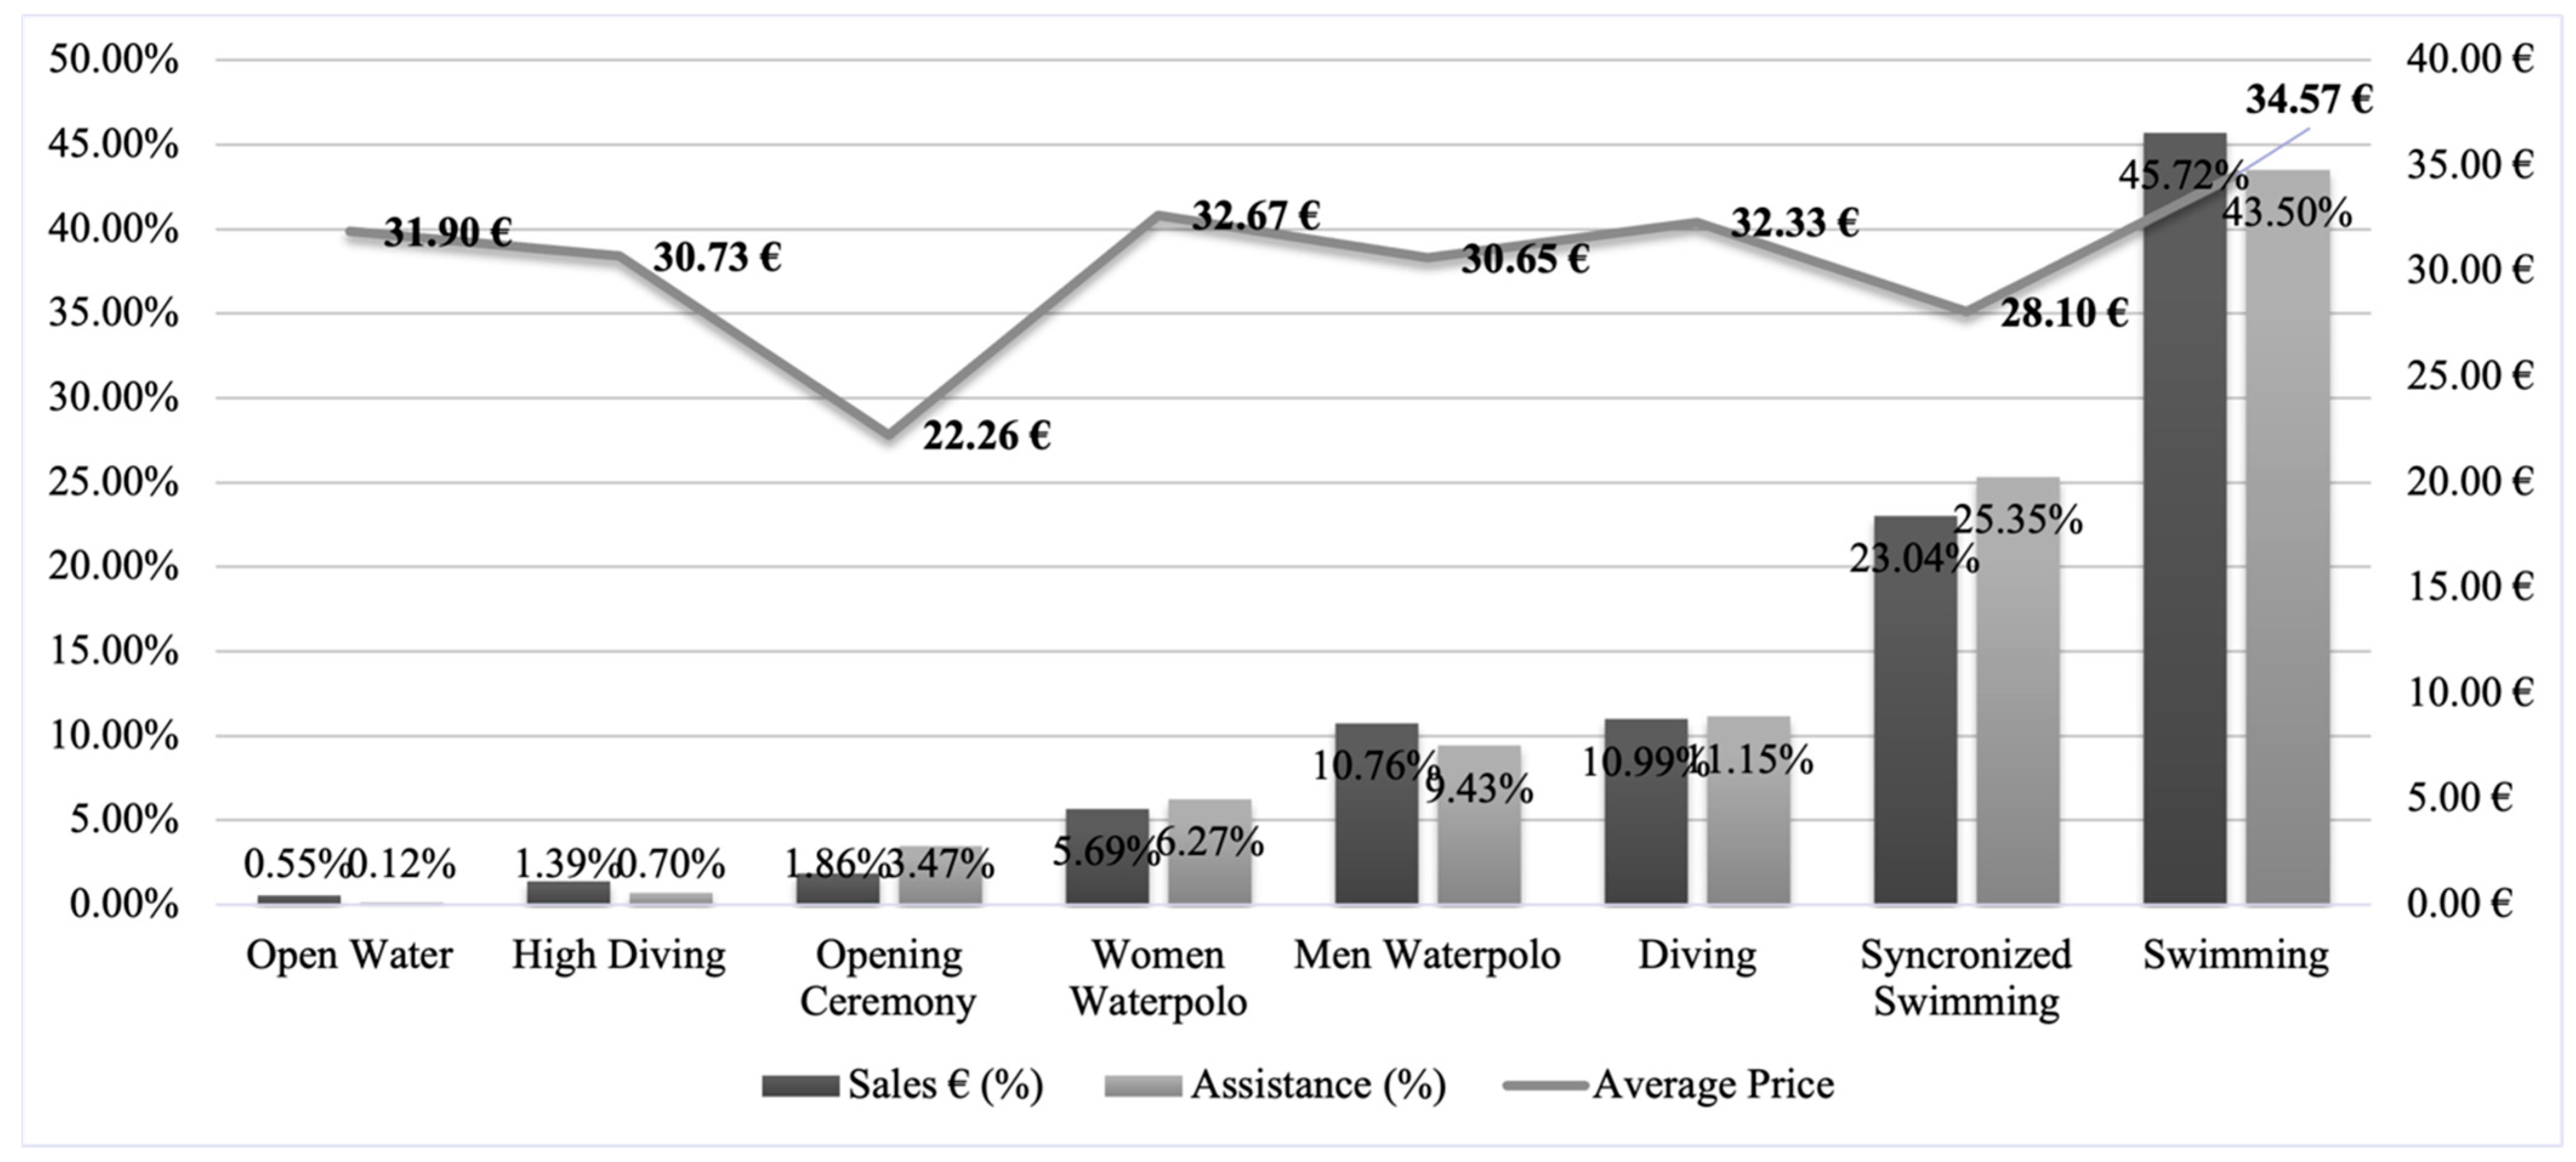
The sports discipline: open water, men’s water polo, swimming, opening ceremony, diving, high diving, synchronised swimming, women’s water polo;
-
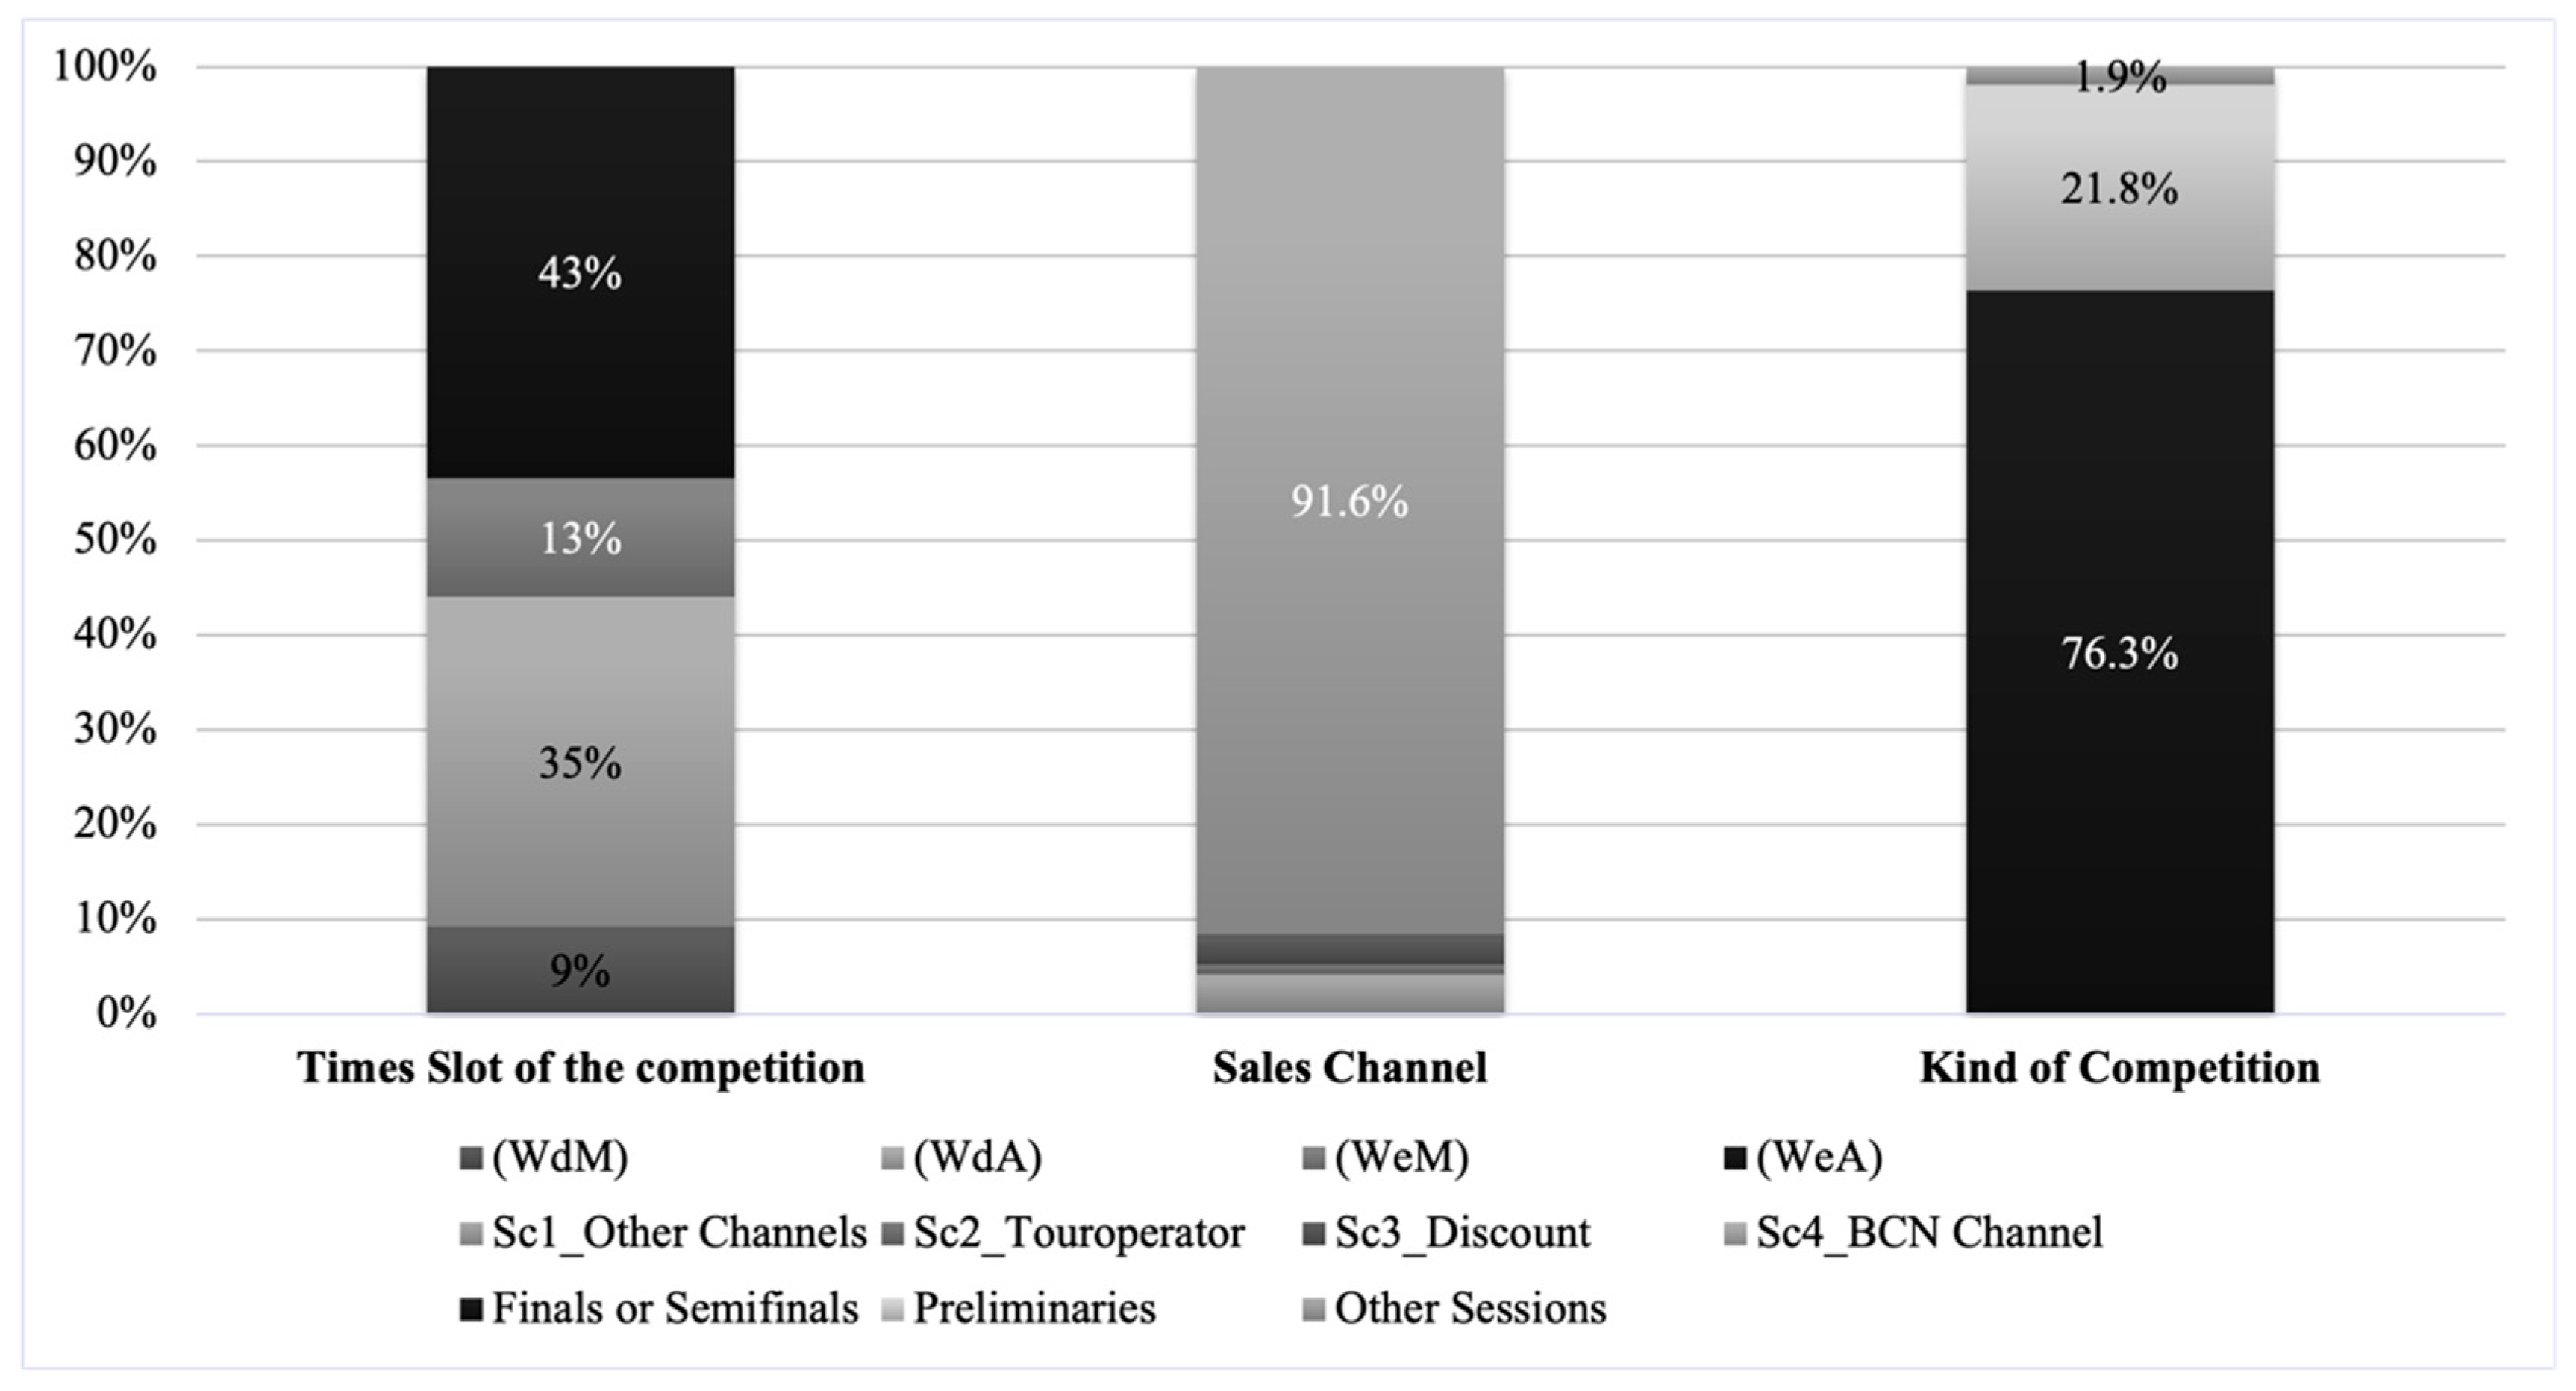
The type of competition: finals or semi-finals, preliminaries, other sessions;
-
The time difference of the purchase:
Time in advance: days between the purchase and the beginning of the competition;
Filter competition: variable introduced by the researchers, referring to the binary transformation of whether the purchase occurred before the competition started (0), or after the competition had started (1) (at any moment after the competition started);
-
The time slot of the competition: weekday morning, weekday afternoon, weekend morning, weekend afternoon;
-
The online sales channel: tour operator, discount channels, BCN channel (official website), and other channels.

3.3. Sample and Data Collection

The local organising committee provided ticket sales data for all competitions and games during the BCN WSC. Therefore, the original database was obtained from the official platform supplier and was retrieved from an Excel file. The authors managed some variables and created some additional ones by performing simple calculations.
After cleaning up the database, a pre-analysis of data was launched, which identified two kinds of cases to be eliminated from the database: price values of EUR 0 (complimentary tickets for sponsors, federations etc.), and sale packs for a specific aquatic discipline. The latter were regarded as a very different product, and some mistakes were accumulated. Therefore, the original database of 59,000 cases was reduced to 46,181 transactions (78.3%) corresponding to ticket purchases.

3.4. Data Analysis

Firstly, a descriptive analysis of the main variables was carried out. In addition, charts of the sales evolution during the whole purchase process were prepared, from the general point of view of the entire event, as well as depending on the sport discipline, to better understand the sales process experienced in such an event.
Secondly, given that with sufficient data on sporting events and ticket sales, logistic regression techniques can be implemented to identify the characteristics that could help understand the determinants of price (Patel 2018), the following approach was undertaken.
A correlational design was used to assess the relationship between various ticket price determinants factors for all aquatic disciplines. Then, an ordinary least squares (OLS) multiple linear regression model was developed to examine the impact of these factors on ticket price. Multiple linear regression assumptions were examined (linearity, independence, normality, and equality of the variances/heteroscedasticity). As two variables had a non-normal distribution (ticket price and ticket numbers to be purchased), in an effort to remedy this issue, log transformations were conducted on each of these variables (Sprinthall 2012) (Ln_Price and Ln_Tickets). Therefore, the log transformations limited both the skewness and kurtosis, and provided a normal distribution for each of these variables. Variance inflation factors (VIF) and tolerance statistics were then reviewed, which indicated no multicollinearity issues among the independent variables (Neter et al. 1989; Schroeder 1990). A scatterplot analysis of residuals in comparison with predicted values and statistical tests for equality of variances showed that no other assumptions were violated in either regression equation.
Finally, to verify the hypothesis, the Chow test was implemented to determine whether a model of price determinants was needed for each sport discipline, or not.

4. Results

The results are presented in two steps. First, general descriptive results are shown, then the results of the correlation and regression price determinant model are presented.

4.1. Descriptive Results

Table 1 displays descriptive data for the most important continuous variables included in this research.
The results showed that the mean for dynamically priced tickets was EUR 33.84 (SD = EUR 44.46), and that consumers bought 4.22 tickets on average in each transaction (SD = 11.46). Although standard deviations were high for both the number of tickets and ticket price variables relative to the mean, these formed a normal distribution, and log transformations were conducted (Ln_Tickets and Ln_Price). The high standard deviations were due to a large quantity of tickets (particularly in some disciplines) being sold at lower prices (min price = EUR 5), and because some tickets were bought in packs (max = 100).
Regarding the time in advance of the purchase, it was noted that the buyers purchased tickets a large amount of time before the competition began (Xdays = 46.64, SD = 71.24; Xweek = 6.36, SD = 10.1).
Figure 1, Figure 2 and Figure 3 provide a summary of percentages for categorical variables examined in the current study. Figure 1 describes which types of competitions were the most “bought” depending on the time slot (during the week or weekends: WeA = 43%; WdA = 35%) and the type of the competition (finals or semi-finals = 76.3%, preliminaries = 21.8%, or others = 1.9%). It also shows by which of the online channels the largest number of purchase transactions took place (BCN Channel = 91.6%).
Figure 2 presents an overview of the sales distribution by discipline (related to the total sales in EUR), the relative assistance (%), and the average price for each sport discipline. Swimming, as the main competition occurring during the second week of the event, accumulated 45.72% of the total sales and 43.5% of the total assistance, followed by synchronised swimming with 23.04% and 25.35%, respectively. It can be also seen how four events out of the eight analysed (swimming, synchronised swimming, diving, and men’s water polo) accumulated up to 90.51% of the total sales and up to 93.7% of the total assistance to the event.
Figure 3 shows the sales and average price evolution for the weeks prior to the competition (from week 33 to week 1). It can be seen that as the date of the competition drew closer, more tickets were bought; however, it is important to note that just one day before the event started, only 53.1% of the total sales had been reached. On the other hand, it can be observed that, in general, prices dropped from the beginning until the last week of competition, with some pricing peaks (ups and downs) during the selling process.
However, as the purpose of this research is beyond the analysis of the data of the whole event in general, but rather for each discipline, if one looks in detail at the comparison between the aquatic disciplines, one can see how apparently each one reported different selling behaviours (pricing and tickets sold). Due to the lack of room in this paper to show all the information, Figure 4 shows, as an example, the differences in the sales evolution for swimming and men’s water polo disciplines. While men’s water polo experienced a slight increase in sales and ticket price from week 10, swimming purchases and ticket prices were more regular during the 33 weeks. This was the reason for the difference between swimming reaching 46.9% of its total sales the day before the competition started, but men’s water polo only reaching 27%. Therefore, when interpreting these results in comparison with the global model shown in Figure 3, it is worth mentioning that each discipline has its own characteristics. For example, in team competitions, the fact that potential spectators will have (or will not have) their team in the following competition rounds, could be assumed to show up as a moderate pattern in anticipated sales. Consequently, given the different behaviour of sales, it could be assumed that different analysis models for analysing the price determinants in a multidisciplinary sports mega-event are needed. In fact, the concept is deeply explored in the next section of the results.

4.2. Correlation and Regression Analysis

Table 2 shows the matrix correlation of the regression variables controlled by different disciplines in a general model. Naturally, the specific matrix per discipline was also calculated, but obviously there was insufficient room to show this in the present paper.
The correlation coefficients were interpreted according to the criteria of Safrit and Wood (1995): no correlation (score of 0–0.19), low correlation (0.20–0.39), moderate correlation (0.40–0.59), moderately high correlation (0.60–0.79), and high correlation (≥0.80). Thus, under this interpretation, although low correlation among many variables was found, the highest levels of correlation were found between the pairs of variables highlighted in bold italics in Table 2. Some highlights of these could be the moderate correlations (>0.36) found between variables such as Ln_Price and time in advance (0.370), finals or semi-finals (0.470), and preliminaries (−0.458); or correlations higher than 0.6 (strong correlation). Negative correlations were found in the relationship of the following variables: preliminaries, and finals or semi-finals (−0.948); filter competition and time in advance (−0.671); WeA and WdA (−0.639), and Schannel4 and Schannel1 (−0.694). All these case results were highly significant (p = 0.00).
Table 3 and Table 4 provide the results for the DTP sport discipline regression models (eight disciplines), including the general model that embraces all the event cases. The model implemented was found to be significant, explaining only a slightly lower percentage (R2 of 0.385) of the variance in ticket price. The results changed depending on the analysed sport discipline: men’s water polo and diving, R2 > 0.40; synchronised, swimming, and women’s water polo, R2 between 0.30 and 0.40; open water and high diving, R2 between 0.17 and 0.25; and the opening ceremony, in which the goodness-of-fit was a very poor R2 of 0.565.
As can be extracted from Table 3, the significant price determinants and their correlation varied depending on the ticket sales process of the sport discipline evaluated. However, in general terms, some aspects of the results of the analysis of the DTP can be highlighted from the implemented model.
Practically all the variables showed a significant effect at a level of 0.001%, and the overall F-test for all models showed a significant effect at the 0.01% level. However, it should be considered that due to the large sample size (total population in this case), the analyses could reject most of the null hypotheses, which means that the significance of the results should be treated with caution.
It should be noted that the dynamic price gradually decreased as the competition approached for all sport disciplines, but not for the opening ceremony. The dummy variable (filter competition) related to the sales period was negative and statistically significant for most of the disciplines. However, it is important to note that percentages of variation could be identified depending on the sport discipline (e.g., ticket prices decreased by approximately 34% from one month before the start of the competition in the general model, but by 7% for men’s water polo, or by 10% for diving). At this point, it is important to mention that, due to the need to transform the dependent variable, and due to the proposed binary transformation of the independent variable (filter competition) for this model, the interpretation of the coefficients should be moderate, as these interpretations only apply to the variable after transformation (Tabachnick et al. 2007). However, the t-statistics and the overall significance of the independent variable in this model provide evidence of its influence.
On average, it was found that a 1% increase in the number of tickets purchased resulted in a 2% decrease in price (negative correlation for most of the disciplines analysed). In addition, the variables that accounted for the time slot of the competition or the type of competition showed effects that could be expected, such as the higher pricing of events taking place on weekend afternoons, or for finals and semi-finals. In the same vein, one could also understand that to some extent the variables that considered the sales channels showed expected behaviour, as for instance, it was found that a 1% increase in ticket sales through discount channels would result in a 24% reduction in price. In addition, while it is worth noting that the highest number of tickets were sold through the official website (91.6%; see Figure 1), it appeared that a 1% increase in sales through the Touroperator sales channel resulted in a 9% increase in price. This could be considered for further analysis of this case study event, and for future events.
Finally, despite the big differences found in the R2 of the model for each sport discipline, the Chow test was used to statistically verify if the model behaved differently in the analysis of the price determinants of the sport disciplines that composed the multidisciplinary sports mega-event. Therefore, a null hypothesis was established considering that the implemented model would fit all the sport disciplines in general, and an alternative hypothesis considering that a model would be needed to specifically analyse each event. The test results concluded that the null hypothesis was rejected with high statistical significance: F(33, 46131) = 25.61, p = 0.000.

5. Discussion

The presented study is the first to evaluate the price determinants in a multidisciplinary sports mega-event. While other studies about determinants of DTP, such as Shapiro and Drayer (2014), Shapiro et al. (2012), or Kemper and Breuer (2016), analysed a data set of 1316, 811, and 5862 observations, respectively, the current study extends the data basis by analysing 46,181 (the entire database) price points in a type of sport event that has never previously been analysed. Therefore, the purpose of the current study was to systematically examine whether, in a multidisciplinary sports mega-event context, different strategies, and different analysis models, should be approached for properly setting the price of tickets for the different sport disciplines that comprise the event.
As an early analysis, it was interesting to dig into the descriptive results which, with a total of 46,181 observations, gave us, in fact, a large amount of information. For instance, when comparing the different evolution sales of the disciplines (Figure 2, Figure 3 and Figure 4), it led us to expect that every sport discipline had a different behaviour profile of ticket demand. Therefore, in some manner, descriptive information supports the fact that before establishing a pricing policy, certain information must be processed: targets markets must have been typically segmented based on simple descriptors such as gender, age, geography, and frequency purchase. However, as an early reflection, it can be pointed out that price segmentation should be considered based on many other variables such as—in the case of the event that concerns this paper—aquatic discipline, type of competition, purchase schedule, time slot of the competition, etc.
As shown in Table 3, the overall fit of the model based on the adjusted R2 accounted for 0.385, which in conjunction with the diving model (R2 of 0.448) and men’s water polo model (R2 of 0.413), had the highest percentage of goodness-of-fit. Although these percentages cannot be regarded as very high values compared with other studies (Rishe and Mondello 2003, 2004; Shapiro and Drayer 2014; Kemper and Breuer 2016), this might open the way to the continuation of work in this direction—probably by including more information from the competition itself and also from consumers, to, thus, achieve better percentages and to better explain the variability of the ticket price in such context.
Finally, by implementing the multiple regression model and the Chow test, the null hypothesis of examining the price determinants by implementing the same model for all the sport disciplines was rejected.
The following paragraphs of the discussion section are orientated on the conceptual framework regarding general managerial considerations about DTP in sport as outlined by Drayer et al. (2012).

5.1. Time Variables

There is ample evidence that ticket availability and prices depend on the number of days from the game (Drayer and Shapiro 2009; Drayer et al. 2012; Kemper and Breuer 2016). In fact, the results related to time and advance purchases are essential, especially with the importance of advance sales for revenue management (Hendrickson 2012), as well as to achieve a good rate of attendance at live sport events (Chappelet 2013).
With the aim of anticipating sales, the organising committee commenced selling tickets 33 weeks before the competition started. Payers purchased their tickets on average 46.64 days in advance of the competition, and the whole event reached 53.1% of sales before the beginning of the competition.
The organising committee of the BCN WSC decided to change ticket prices daily, which, in contrast with other sectors where price updates occur more frequently, this practice was in line with other sporting organisations’ practices (Bouchet et al. 2016). Other options would have been to adapt prices in real time: by minute, hour, or other time intervals. However, it is important to consider that more frequent price adjustments may lead to customer confusion and the perception of price unfairness (Drayer et al. 2012). In fact, perceived price fairness is one important psychological factor that influences consumers’ satisfaction and subsequent behaviour (Bei and Chiao 2006; Etzioni 1988; Kahnemann et al. 1986). Therefore, it could be argued that, in this case, the organising committee followed a reasonable approach to change prices not more than once a day. With a similar strategy at hand, Shapiro and Drayer (2014) and Kemper and Breuer (2016) showed that ticket prices prior to a competition increase continuously over time with the application of a DTP system. The current study revealed the opposite behaviour for the Barcelona WSC. Shapiro and Drayer (2014) found that dynamic ticket prices at 20 days before match day were 13% lower compared with ticket prices on match day, and Kemper and Breuer (2016) showed that the difference was 17% and, therefore, slightly larger. In contrast with these results, in the current study it was found that prices dropped by 33.5% from the price 2 weeks before the competition started—findings that can be generalised from dynamic pricing models applied in the hotel industry, by which room rates first increase over time and then drop towards the day of accommodation (Kimes 1989a).
Based on these results, it is interesting to note that some studies on sports demand, understood as attendance at sporting events, find that sports demand and ticket prices are negatively correlated, which indicates that prices are set in the inelastic part of the demand (Borland and MacDonald 2003; Villar and Dello 2009). This fact suggests that ticket prices could be increased without a proportionate loss of ticket sales. Naturally, this behaviour is likely to be different depending on various parameters such as the type of event analysed, the sport, the sales strategy implemented (prices, sales channels, etc.), the customers’ own culture, etc. Dwyer et al. (2013) further analysed the impact of time on advance ticket purchase decisions, based on an online questionnaire. The authors found that as the time before the event decreased, the consumer expected more ticket availability and a lower ticket price. These were the consumer expectations about the future evolution of prices that, according to the results of this study, would be covered. Therefore, the results of the current study indicate that sport marketers may be able to segment consumers based on time, “pushing” customers, in some manner, to purchase tickets in advance of an event. However, it is a potential field for future research to explore how these expectations could be related to various aspects, such as the willingness to pay for a sporting event with certain characteristics (Mortazavi 2021). Similarly, as can be understood from Figure 3 (and by the sales channel most used by consumers, BCN Channel), it would also be interesting to explore whether the start of an event with these characteristics would be an aspect that could stimulate the purchase of tickets for the local public or those who were in the host city for any other reason.
Moreover, the time of the game was found to be significant in all disciplines analysed. As mentioned previously, mid-afternoon weekend and weekdays were priced highest in most of the disciplines. These results can be contrasted with the study carried out by Shapiro and Drayer (2014) where time-related variables played an important role, as night-time games were priced higher than mid-afternoon games. Therefore, it should be considered that this kind of attribute might also help practitioners when pricing their event, or even for the organising committee when planning the schedule of the entire sport event.

5.2. Team and Individual Performance

It is to be expected that in such an event as the WSC, swimming would have the greatest public attendance, which is very clearly shown when comparing the number of sales for this event (45.72%) with that of other disciplines (Figure 2). Due to the nature of the sport event itself, swimming would most likely be the discipline to sell more tickets in any host city, and a further issue would be to determine which other disciplines might be important in the eyes of the host country. For instance, in considering Barcelona’s case, the country’s culture, together with the fact that the national synchronised swimming team had positive results in previous years, might explain the high percentage of sales shown in Figure 1. In fact, the nature of sporting events themselves affects the attendance decisions of sports fans (Lim and Pedersen 2022); and home team performance measurements have been found, within the literature, to be significant in influencing the ticket price as well as the consumer demand (Moe et al. 2011; Rishe and Mondello 2003; Shapiro and Drayer 2014). Although in the WSC it was truly difficult to isolate field variables such as opponents and result based on previous performance, as was determined for other sports in studies such as Shapiro and Drayer (2014), it might be interesting to consider the participation of celebrities (for example, Michael Phelps) as a factor of individual performance which could also influence ticket sales (Shapiro and Drayer 2014).
It was only to be expected that the finals were the best-selling type of competition, accounting for 76.3%. Indeed, competitions in which opponents of similar quality face off, that is, events that provide spectators with some uncertainty, have been identified as a key driver of attendance at games (Borland and MacDonald 2003; Drayer and Shapiro 2009; Noll 1974; Reese and Mittelstaedt 2001; Rishe and Mondello 2003; Scelles et al. 2011). In addition, these data can be contrasted with the study carried out by Drayer and Shapiro (2009) when they identified that fans of the NFL were willing to pay higher prices for games further into the playoffs. Nevertheless, in an event such as the one analysed here, it should be considered that while there may be many fans who will be eager to attend the final game no matter who plays, other fans will only be interested in attending if their favoured team will be playing in the final. This is a fact that should be also considered when pricing the event, and is supported by previous research which has already established the importance of team identification in association with consumption and event attendance (Trail et al. 2003; Wakefield 1995).

5.3. Sales Channel

An event attendee’s preferences for different distribution channels are influenced by convenience, availability, membership relationships, personal service, and their location (Smith 2006). Therefore, it can be understood that the selling strategy and the channels elected for offering tickets could also influence the customer decision. In the case of the Barcelona WSC, it was found that a high percentage of sales were conducted through the official website of the event. Thus, although this could open the door to reflect on whether establishing different prices depending on the sales channel could be a good strategy or not (such as price discrimination), it is important to note that the Barcelona WSC was an event that took place in 2013, and that more research will be required to verify if this trend is different depending on the sporting event, the present time, the culture of the clients of the host city, or even cultural factors and habits of the individuals, the sales strategy itself and the channels used by the organising committee, or multiple other aspects that could be considered. For instance, it is likely that, due to new tendencies in technology and data processing, the future of establishing the right pricing strategies calls for the analysis of big data and on-time data based on the purchase channels themselves, since they can provide the opportunity to obtain customers’ data easily (e.g., Gorodetskaya et al. 2021).

5.4. Consumer’s Perception

According to Zeithaml et al. (1988), a low price can devalue the product in the eyes of the customer. Therefore, it seems reasonable to implement minimum prices to prevent ticket prices from being too low (Kemper and Breuer 2016). Although the data analyses suggest that the organising committee implemented price floors, it was not possible to detect a single case in which prices declined at all. Therefore, the lack of falling prices could suggest that the organising committee of the Barcelona WSC controlled the price of the tickets to a large extent, and that these results could not be indicative of what would happen in other markets where tickets have dynamic pricing. Conversely, it would be worth reflecting on whether the absence of maximum prices should guarantee a higher optimal price and, consequently, an increase in income. However, only future research can answer this question.
On the other hand, as stated by Shapiro and Drayer (2014), it may be likely that ticket prices in previous years had a similar impact on consumers’ perceptions. Thus, it would be interesting to delve into this line of research through the analysis of a sporting event longitudinally over time, since although some spectators (heavy users) might repeat their purchasing behaviour over the years, usually nobody controls this due to the autonomous ticketing management policy adopted by each local organising committee. Even with the possibility of unravelling all the details, it would be interesting to check the behaviour of those spectators who buy tickets during the mega event itself for the satisfaction of attending a particular competition, compared with those customers who are encouraged to buy more tickets for other competitions of the same sporting mega-event while it is in progress. This is something that can occur in this type of sporting event but needs to be explored further. The possibility of obtaining more information than in this research study for repeated events over a series of years, or just comparing events, would open the door to another perspective from which to better understand spectators, to see what occurs behind the scenes, and consequently, to better adapt ticket prices (e.g., even to consider implementing two-part pricing strategies).

5.5. Practical Implications

As can be understood from what was exposed in the results and discussion sections, there are many marketing implications that can be derived from these findings that could allow practitioners and organisations to price their event more effectively (Drayer et al. 2012). With this information at hand, practitioners can use the main outputs of this research to their advantage, as it provides complementary data that has never before been empirically analysed. However, it is important to highlight that there are many other variables that can influence the price, which could be considered in future analysis to achieve better determinant models with higher R2 values.
The authors believe that the development and analysis of an initial model is a critical step in the process of understanding ticket value in a multi-sport mega-event framework, as, to date, this type of event has not been studied by researchers in the field.

6. Conclusions

To the authors’ knowledge, this is the first time that price determinants for a professional multidisciplinary sport mega-event of these characteristics has been analysed, a fact that highlights the originality of the current study, also because it was possible to analyse the entire database of the event ticket sales process. Moreover, this study adds to the literature with respect to the analysed sport, since previous research approaching this topic focused exclusively on the analysis of Major League baseball (Paul and Weinbach 2013; Shapiro and Drayer 2014), or one football team in particular (Kemper and Breuer 2016). The study at hand extends the knowledge concerning the specification of DTP models in sports by evaluating eight subevents that comprised the whole sporting mega-event: the Barcelona World Swimming Championship.
Findings showed the sales evolution over the 33 weeks that the sales process lasted. Sales reached 53.1% three weeks before the beginning of the competition. Swimming accounted for most of the ticket sales, at 45.72% (note that this discipline was the one which had most spectators, and accounted for most of the tickets sold in advance), while synchronised swimming was the second most popular at 23.04%. In addition, it was shown that prices decreased over the whole selling period. Hence, this finding could be contrasted with those of Shapiro and Drayer (2014) and Kemper and Breuer (2016) who found the opposite behaviour in the Derby Country (an English soccer club) and the MLB, respectively. The goodness-of-fit of the models implemented (general and for specific sports disciplines) reached a maximum R2 of 0.448 with the diving competition. However, the main hypothesis was rejected by the Chow test, and consequently, it was concluded that different price determinant analysis models should be implemented for each aquatic discipline, and not a general one for the entire event. One of the most important takeaways of these findings is the need to seriously take these conclusions into account when devising the pricing policy. Even for the WSC, it is highly advisable for marketers to use different pricing strategies for each sport discipline. This might affect not only the pricing values but also the sales start date, the packages to be sold, the maximum number of tickets to be purchased per person, the discount policy, the sales channel, and so on. In addition, as has already been stated in the discussion section, the authors believe that, based on the income management criteria of DTP policy established by Kimes (1989a, 1989b), and the current tendencies in technology and data analysis, it seems that these kind of sporting events are also an appropriate environment to implement a real-time pricing system.

Limitations and Future Directions

Of course, the current study is not free of limitations. First, due to the database at hand, and the difficulties encountered in establishing the criteria (as team or individual performance) only a selection of variables were included in the analysis model. Hence, other factors that might influence ticket prices could be considered for further analysis.
Second, although it was possible to prove that the capacity of the facilities never was a limitation, it should be noted that the level of inventory was not possible to be considered as a control variable to be analysed. Consequently, when interpreting the results, it must be contemplated that there might be problems of simultaneity that might lead us to a different interpretation. Thus, it would be interesting to add to the model control variables as the percentage of the sold stadium capacity, since the restriction in supply of the number of seats could help control this issue (which of course will depend on the different venues of each sport discipline, the host city, etc.). Hence, a potential field for future research could be to incorporate daily sales volumes in the analysis with respect to the total capacity of the venue itself. However, the authors are aware that relevant data might be difficult to obtain.
Third, additional studies should evaluate if the price determinants might be different in other host countries and in other multidisciplinary sports mega-events, even making comparisons and searching for correlations by incorporating some socioeconomic variables such as the level of income of the population (Hansen and Gauthier 1989) or the population of the host country (Rivers and Deschriver 2002), etc.—a fact that the authors believe will be possible in a near future when the applications of DTP systems are extended through the sport industry (Nufer and Fischer 2013).

Author Contributions

Conceptualization, F.S.; methodology, F.S.; validation, F.S., J.M. and J.P.; formal analysis, F.S., J.M. and J.P.; investigation, F.S., J.M. and J.P.; resources, F.S.; data curation, F.S. and J.M.; writing—original draft preparation, F.S., J.M. and J.P.; writing—review and editing, F.S., J.M. and J.P.; visualization, F.S., J.M. and J.P.; supervision, F.S., J.M. and J.P.; project administration, F.S.; funding acquisition, F.S. All authors have read and agreed to the published version of the manuscript.

Funding

This work was supported by the National Institute of Physical Education of Catalonia.

Informed Consent Statement

Not applicable.

Data Availability Statement

Data available on request from the authors.

Conflicts of Interest

The authors declare no conflict of interest.

References

  1. Armstrong, Mark. 2006. Price Discrimination. Dictionary of Marketing Communications, 1–38. [Google Scholar] [CrossRef] [Green Version]
  2. Balseiro, Santiago R., Guillermo Gallego, Caner Gocmen, and Robert Phillips. 2011. Revenue Management of Consumer Options for Sporting Events. Working Paper. New York: Columbia University. [Google Scholar]
  3. Bei, Lien-Ti, and Yu-Ching Chiao. 2006. The Determinants of Customer Loyalty: An Analysis of Intangible Factors in Three Service Industries. International Journal of Commerce and Management 16: 162. [Google Scholar] [CrossRef]
  4. Beloba, Peter P. 1987. Survey Paper—Airline Yield Management an Overview of Seat Inventory Control. Transportation Science 21: 63–73. [Google Scholar] [CrossRef] [Green Version]
  5. Bitran, Gabriel, and René Caldentey. 2003. An Overview of Pricing Models for Revenue Management. Manufacturing and Service Operations Management 5: 203–29. [Google Scholar] [CrossRef]
  6. Bitran, Gabriel R., and Stephen M. Gilbert. 1996. Managing Hotel Reservations with Uncertain Arrivals. Operations Research 44: 35–49. [Google Scholar] [CrossRef]
  7. Borland, Jeffery, and Robert MacDonald. 2003. Demand for Sport. Oxford Review of Economic Policy 19: 478–502. [Google Scholar] [CrossRef]
  8. Bouchet, Adrien, Michael Troilo, and Brian R. Walkup. 2016. Dynamic Pricing Usage in Sports for Revenue Management. Managerial Finance 42: 913–21. [Google Scholar] [CrossRef]
  9. Boyd, David W., and Laura A. Boyd. 1998. The Home Field Advantage: Implications for the Pricing of Tickets to Professional Team Sporting Events. Journal of Economics and Finance 22: 169–79. [Google Scholar] [CrossRef]
  10. Bradbury, John Charles. 2020. Determinants of Attendance in Major League Soccer. Journal of Sport Management 34: 53–63. [Google Scholar] [CrossRef]
  11. Butscher, Stephan A. 1999. Using pricing to increase customer loyalty. The Journal of Professional Pricing 8: 29–32. [Google Scholar]
  12. Chappelet, Jean-Loup. 2013. Managing Sport Business: An Introduction. European Sport Management Quarterly 13: 602–4. [Google Scholar] [CrossRef]
  13. Courty, Pascal. 2000. An Economic Guide to Ticket Pricing in the Entertainment Industry. Recherches Économiques de Louvain/Louvain Economic Review 66: 167–92. [Google Scholar] [CrossRef]
  14. Deloitte. 2021. Testing Times-Football Money League. Manchester: Deloitte Sports Business Group, pp. 26–27. [Google Scholar]
  15. Dick, Alan S. 1995. Using Membership Fees to Increase Customer Loyalty. Journal of Product & Brand Management 4: 65–68. [Google Scholar] [CrossRef]
  16. Drayer, Joris, and Nathan T Martin. 2010. Establishing Legitimacy in the Secondary Ticket Market: A Case Study of an NFL Market. Sport Management Review 13: 39–49. [Google Scholar] [CrossRef]
  17. Drayer, Joris, and Stephen L. Shapiro. 2009. Value Determination in the Secondary Ticket Market: A Quantitive Analysis of the NFL Playoffs. Sport Marketing Quarterly 18: 5–13. Available online: https://ssrn.com/abstract=2457173 (accessed on 10 July 2022).
  18. Drayer, Joris, Stephen L. Shapiro, and Seoki Lee. 2012. Dynamic Ticket Pricing in Sport: An Agenda for Research and Practice. Sport Marketing Quarterly 21: 184–94. Available online: https://ssrn.com/abstract=2457101 (accessed on 10 July 2022).
  19. Dwyer, Brendan, Joris Drayer, and Stephen L. Shapiro. 2013. Proceed to Checkout? The Impact of Time in Advanced Ticket Purchase Decisions. Sport Marketing Quarterly 22: 166–80. Available online: https://ssrn.com/abstract=2457132 (accessed on 11 July 2022).
  20. Etzioni, Amitai. 1988. The Moral Dimension: Toward a New Economics. New York: The Free Press. [Google Scholar]
  21. Falter, Jean-Marc, and Christophe Perignon. 2000. Demand for Football and Intramatch Winning Probability: An Essay on the Glorious Uncertainty of Sports. Applied Economics 32: 1757–65. [Google Scholar] [CrossRef]
  22. Forrest, David, and Robert Simmons. 2002. Outcome Uncertainty and Attendance Demand in Sport: The Case of English Soccer. Journal of the Royal Statistical Society Series D: The Statistician 51: 229–41. [Google Scholar] [CrossRef]
  23. Gorodetskaya, Olga, Yana Gobareva, and Mikhail Koroteev. 2021. A Machine Learning Pipeline for Forecasting Time Series in the Banking Sector. Economies 9: 205. [Google Scholar] [CrossRef]
  24. Hansen, Hal, and Roger Gauthier. 1989. Factors Affecting Attendance at Professional Sporting Events. Journal of Sport Management 3: 115–32. [Google Scholar] [CrossRef] [Green Version]
  25. Hendrickson, Haynes. 2012. View from the Field: Business Intelligence in the Sports World. Sport Marketing Quarterly 21: 136–37. Available online: https://static1.squarespace.com/static/54358491e4b0e09faedc4a1b/t/543d34e5e4b0fd6411fcec30/1413297381527/FROM+THE+FIELD+-+HENDRICKSON.pdf (accessed on 12 July 2022).
  26. Howard, Dennis R., and John L. Crompton. 2004. Tactics Used by Sports Organizations in the United States to Increase Ticket Sales. Managing Leisure 95: 87–95. [Google Scholar] [CrossRef]
  27. Hoye, Russell, Aaron C. T. Smith, Matthew Nicholson, and Bob Stewart. 2018. Sport Management: Principles and Applications, 5th ed. London: Routledge. [Google Scholar] [CrossRef]
  28. Kahnemann, Daniel, Jack L. Knetsch, and Richard Thaler. 1986. Fairness as a Constraint on Profit Seeking: Entitlements in the Market. The American Economic Review 76: 728–41. Available online: https://www.jstor.org/stable/1806070 (accessed on 15 September 2022).
  29. Kaiser, Mario, Tim Ströbel, Herbert Woratschek, and Christian Durchholz. 2019. How Well Do You Know Your Spectators? A Study on Spectator Segmentation Based on Preference Analysis and Willingness to Pay for Tickets. European Sport Management Quarterly 19: 178–200. [Google Scholar] [CrossRef]
  30. Kemper, Christoph, and Christoph Breuer. 2016. Dynamic Ticket Pricing and the Impact of Time—An Analysis of Price Paths of the English Soccer Club Derby County. European Sport Management Quarterly 16: 233–53. [Google Scholar] [CrossRef]
  31. Kimes, Sheryl E. 1989a. The Basics of Yield Management. Cornell Hotel and Restaurant Administration Quarterly 30: 14–19. [Google Scholar] [CrossRef] [Green Version]
  32. Kimes, Sheryl E. 1989b. Yield Management: A Tool for Capacity Constrained Service Firms. Journal of Operations Management 8: 348–63. [Google Scholar] [CrossRef]
  33. Ladany, Shaul P., and Avner Arbel. 1991. Optimal Cruise-Liner Passenger Cabin Pricing Policy. European Journal of Operational Research 55: 136–47. [Google Scholar] [CrossRef]
  34. Lemke, Robert J., Matthew Leonard, and Kelebogile Tlhokwane. 2010. Estimating Attendance at Major League Baseball Games for the 2007 Season. Journal of Sports Economics 11: 316–48. [Google Scholar] [CrossRef]
  35. Lim, Namhun, and Paul M. Pedersen. 2022. Examining Determinants of Sport Event Attendance: A Multilevel Analysis of a Major League Baseball Season. Journal of Global Sport Management 7: 181–98. [Google Scholar] [CrossRef]
  36. Littlewood, Kenneth. 1972. Forecasting and Control of Passenger Bookings. Airline Group International Federation of Operational Research Societies Proceedings 12: 95–117. [Google Scholar]
  37. Moe, Wendy W., Peter S. Fader, and Barry Kahn. 2011. Buying Tickets: Capturing the Dynamic Factors That Drive Consumer Purchase Decision for Sporting Events. Paper presented at the MIT Sloan Sports Analytics Conference. 4 and 5 March 2011 at the Boston Convention and Exhibition Center. Available online: https://www.slideshare.net/sloansportsconf/buying-tickets-capturing-the-dynamic-factors-that-drive-consumer-purchase-decisions-for-sporting-events (accessed on 10 July 2022).
  38. Morgan, Robert M., and Shelby D. Hunt. 1994. The Commitment-Trust Theory of Relationship Marketing. Journal of Marketing 58: 20. [Google Scholar] [CrossRef]
  39. Mortazavi, Reza. 2021. The Relationship between Visitor Satisfaction, Expectation and Spending in a Sport Event. European Research on Management and Business Economics 27: 100132. [Google Scholar] [CrossRef]
  40. Nair, Suresh K., and Ravi Bapna. 2001. An Application of Yield Management for Internet Service Providers. Naval Research Logistics (NRL) 48: 348–62. [Google Scholar] [CrossRef]
  41. Nalbantis, Georgios, Tim Pawlowski, and Dennis Coates. 2017. The Fans Perception of Competitive Balance and Its Impact on Willingness-to-Pay for a Single Game. Journal of Sports Economics 18: 479–505. [Google Scholar] [CrossRef]
  42. Neter, John, William Wasserman, and Michael Kutner. 1989. Applied Linear Regression Models. Homewood: Irwin. [Google Scholar]
  43. Noll, Roger. 1974. Attendance and Price Setting. In Government and the Sports Business. Washington, DC: Brookings Institution. [Google Scholar]
  44. Nufer, Gerd, and Jan Fischer. 2013. Ticket Pricing in European Football—Analysis and Implications. Sport and Art 1: 49–60. [Google Scholar] [CrossRef]
  45. Oi, Walter Y. 1971. A Disneyland Dilemma: Two-Part Tariffs for a Mickey Mouse Monopoly. Quarterly Journal of Economics 85: 77–96. [Google Scholar] [CrossRef] [Green Version]
  46. Patel, Rohit. 2018. Indices for Dynamic Pricing in the Event Ticketing Industry. SSRN Electronic Journal, 1–12. [Google Scholar] [CrossRef]
  47. Paul, Rodney J., and Andrew Weinbach. 2013. Determinants of Dynamic Pricing Premiums in Major League Baseball. Sport Marketing Quarterly 22: 152–65. [Google Scholar]
  48. Popp, Nels, Stephen Shapiro, Patrick Walsh, Chad McEvoy, Jason Simmons, and Stephen Howell. 2018. Factors Impacting Ticket Price Paid by Consumers on the Secondary Market for a Major Sporting Event. Journal of Applied Sport Management 10: 7. [Google Scholar] [CrossRef]
  49. Rascher, Daniel A., and Andrew D. Schwarz. 2012. Illustrations of Price Discrimination in Baseball. Available online: https://mpra.ub.uni-muenchen.de/25807/ (accessed on 12 July 2022).
  50. Reese, James T., and Robin D. Mittelstaedt. 2001. An Exploratory Study of the Criteria Used to Establish NFL Ticket Prices. Sport Marketing Quarterly 10: 223–30. [Google Scholar]
  51. Rishe. 2012. Dynamic Pricing: The Future of Ticket Pricing in Sports. Available online: http://www.forbes.com/sites/prishe/2012/01/06/dynamic-pricing-the-future-of-ticket-pricing-in-sports/2/ (accessed on 10 July 2022).
  52. Rishe, Patrick, and Michael Mondello. 2004. Ticket Price Determination in Professional Sports: An Empirical Analysis of the NBA, NFL, NHL, and Major League Baseball. Sport Marketing Quarterly 13: 104–12. [Google Scholar]
  53. Rishe, Patrick James, and Michael J. Mondello. 2003. Ticket Price Determination in the National Football League: A Quantitative Approach. Sport Marketing Quarterly 12: 72–79. [Google Scholar]
  54. Rivers, Dominic H., and Timothy D. Deschriver. 2002. Star Players, Payroll Distribution, and Major League Baseball Attendance. Sport Marketing Quarterly 11: 164–173. Available online: https://search.ebscohost.com/login.aspx?direct=true&db=s3h&AN=7460615&site=ehost-live (accessed on 15 September 2022).
  55. Rothstein, Marvin. 1971. An Airline Overbooking Model. Transportation Science 5: 180–92. [Google Scholar] [CrossRef]
  56. Safrit, Margaret J., and Terry M. Wood. 1995. Introduction to Measurement in Physical Education and Exercise Science, 3rd ed. St. Louis: Times Mirrow/Mosby. [Google Scholar]
  57. Scelles, Nicolas, Michel Desbordes, and Christophe Durand. 2011. Marketing in Sport Leagues: Optimising the Product Design. Intra-Championship Competitive Intensity in French Football Ligue 1 and Basketball Pro A. International Journal of Sport Management and Marketing 9: 13–28. [Google Scholar] [CrossRef]
  58. Schroeder, Mary Ann. 1990. Diagnosing and Dealing with Multicollinearity. Western Journal of Nursing Research 12: 175–87. [Google Scholar] [CrossRef]
  59. Scully, Gerald W. 1994. Managerial Efficiency and Survivability in Professional Team Sports. Managerial and Decision Economics 15: 403–11. [Google Scholar] [CrossRef]
  60. Shapiro, Stephen L., and Joris Drayer. 2014. An Examination of Dynamic Ticket Pricing and Secondary Market Price Determinants in Major League Baseball. Sport Management Review 17: 145–59. [Google Scholar] [CrossRef]
  61. Shapiro, Stephen, Brendan Dwyer, and Joris Drayer. 2016. Examining the Role of Price Fairness in Sport Consumer Ticket Purchase Decisions. Sport Marketing Quarterly 25: 227–40. Available online: https://digitalcommons.odu.edu/hms_fac_pubs/27 (accessed on 15 July 2022).
  62. Shapiro, Stephen, Tim De Schriver, and Daniel A. Rascher. 2012. Factors Affecting the Price of Luxury Suites in Major North American Sports Facilities. Journal of Sport Management 26: 249–57. [Google Scholar] [CrossRef]
  63. Sheth, Jagdish N., Banwari Mittal, Bruce I. Newman, and Jagdesh N. Sheth. 2004. Customer Behavior: A Managerial Perspective. Mason: Thomson/South-Western. [Google Scholar]
  64. Smith. 2017. Major League Soccer’s Most Valuable Teams. Forbes. Available online: https://www.forbes.com/sites/chrissmith/2017/08/16/major-league-soccers-most-valuable-teams-2/#2d59ca49b815 (accessed on 10 July 2022).
  65. Smith, Barry C., John F. Leimkuhler, and Ross M. Samuels. 1992. Yield Management at American Airlines. Interfaces 22: 8–31. [Google Scholar] [CrossRef]
  66. Smith, Chris. 2013. Major League Soccer’s Most Valuable Teams. Forbes. Available online: https://www.forbes.com/sites/chrissmith/2013/11/20/major-league-soccers-most-valuable-teams/#4ec5990f19a6 (accessed on 10 July 2022).
  67. Smith, Karen A. 2006. The Distribution of Event Tickets. Event Management 10: 185–96. [Google Scholar] [CrossRef]
  68. Solanellas, Francesc, and Andreu Camps. 2017. The Barcelona Olympic Games: Looking Back 25 Years On (1). Apunts. Educación Física y Deportes 127: 7–26. [Google Scholar] [CrossRef]
  69. Solanellas, Francesc, and Joshua Muñoz. 2021. Análisis de La Venta de Entradas de Un Mega Evento Deportivo: El Caso Del Mundial de Natación. Revista Brasileira de Ciências Do Esporte 43. [Google Scholar] [CrossRef]
  70. Sprinthall, Richard. 2012. Basic Statistical Analysis, 9th ed. Boston: Allyn & Bacon. [Google Scholar]
  71. Sweeting, Andrew. 2012. Dynamic Pricing Behavior in Perishable Goods Markets: Evidence from Secondary Markets for Major League Baseball Tickets. Journal of Political Economy 120: 1133–72. [Google Scholar] [CrossRef] [Green Version]
  72. Tabachnick, Barbara, Linda Fidell, and Jodie Ullman. 2007. Using Multivariate Statistics, 5th ed. Boston: Pearson Education. [Google Scholar]
  73. Trail, Galen T., Janet S. Fink, and Dean F. Anderson. 2003. Sport Spectator Consumption Behavior. Sport Marketing Quarterly 12: 8–17. [Google Scholar]
  74. Varian, Hal. 1989. Price Discrimination. In Handbook of Industrial Organization. Edited by Richard Schmalensee and Robert Willig. Amsterdam: Elsevier, vol. 1, cha. 10. pp. 597–654. [Google Scholar]
  75. Villar, Jaume García, and Plácido Rodríguez Guerrero Dello. 2009. Sports Attendance: A Survey of the Literature 1973–2007. Rivista Di Diritto e Di Economia Dello Sport 5: 112–51. Available online: https://www.researchgate.net/profile/Placido-Rodriguez/publication/46508178_Sports_Attendance_A_Survey_of_the_Literature_19732007/links/562d08e008ae518e3482476d/Sports-Attendance-A-Survey-of-the-Literature-19732007.pdf (accessed on 15 September 2022).
  76. Wakefield, Kirk L. 1995. The Pervasive Effects of Social Influence on Sporting Event Attendance. Journal of Sport and Social Issues 19: 335–51. [Google Scholar] [CrossRef]
  77. Xu, Joseph Jiaqi, Peter S. Fader, and Senthil Veeraraghavan. 2019. Designing and Evaluating Dynamic Pricing Policies for Major League Baseball Tickets. Manufacturing and Service Operations Management 21: 121–38. [Google Scholar] [CrossRef]
  78. Zeithaml, Valarie A., P. Rajan Varadarajan, and Carl P. Zeithaml. 1988. The Contingency Approach: Its Foundations and Relevance to Theory Building and Research in Marketing. European Journal of Marketing 22: 37–64. [Google Scholar] [CrossRef]
  79. Zsigmond, Tibor, Enikő Korcsmáros, Renáta Machová, and Zoltán Šeben. 2020. Interconnection of Consumer Behaviour of Different Generations and Marketing Strategy of a Football Club—Experience in Slovakia. Marketing and Management of Innovations 6718: 221–34. [Google Scholar] [CrossRef]
Figure 1. Percentage for categorical variables.
Economies 10 00322 g001
Figure 2. Percentage of sales, assistance, and average price for each sport discipline.
Economies 10 00322 g002
Figure 3. Sales and average price evolution per weeks.
Economies 10 00322 g003
Figure 4. Percentage of sales and price evolution of men’s water polo and swimming.
Economies 10 00322 g004
Table 1. Descriptive statistics for continuous variables.
Tickets
(n)
Ln_Tickets
(Ln)
Ticket Price
(EUR)
Ln_Price
(Ln)
Transaction Price
(EUR)
Days Difference
(Days)
Week Difference
(Week)
Valid cases46,18146,18146,18146,18146,18146,18146,181
Mean4.220.85EUR 33.843.33EUR 87.4146.646.36
SD11.460.74EUR 44.460.62EUR 178.8971.2410.1
Min10EUR 50.06EUR 500
Max1004.61EUR 5836.37EUR 14,285.323633
Table 2. Matrix correlation of the regression variables, a general model.
Tickets and PriceTime DifferenceTime Slot of the CompetitionSales ChannelsKind of Competition
Ln_PriceLn_TicketsTime in AdvanceFilter CompetitionWdMWdAWeMWeASChannel1Schannel2Schannel3Schannel4Finals or SemifinalsPreliminariesOther Sessions
Tickets and Price
Ln_Price1
Ln_Tickets0.0051
Time difference
Time in advance0.370 **0.100 **1
Filter competition
(purchase beofre (0) or after (1) the event begun)
−0.284 **−0.113 **−0.671 **1
Time Slot of the Competition
Weekday Moorning (WdM)−0.287 **−0.024 **−0.056 **0.065 **1
Weekday Afternoon (WdA)−0.019 **−0.024 **−0.035 **0.088 **−0.233 **1
Weekend Moorning (WeM)−0.154 **0.019 **−0.035 **0.019 **−0.121 **−0.277 **1
Weekend Afternoon (WeA)0.290 **0.024 **0.090 **−0.136 **−0.279 **−0.639 **−0.332 **1
Sales channels
SChannel1 (Other Channels)−0.037 **−0.005−0.104 **0.042 **−0.015 **−0.016 **−0.0010.025 **1
Schannel2 (Touroperator)−0.011 *−0.003−0.063 **0.073 **0.0040.016 **0−0.018 **−0.021 **1
Schannel3 (Discount Channels)−0.134 **−0.012 *−0.097 **0.028 **−0.001−0.035 **0.031 **0.014 **−0.038 **−0.018 **1
Schannel4 (BCN Channel)0.115 **0.012 **0.159 **−0.075 **0.010*0.028 **−0.019 **−0.020 **−0.694 **−0.335 **−0.596 **1
Kind of Competition
Finals or Semifinals0.470 **−0.017 **0.124 **−0.028 **−0.426 **0.172 **−0.377 **0.336 **0.002−0.007−0.055 **0.036 **1
Preliminaries−0.458 **0.015 **−0.104 **0.076 **0.453 **−0.145 **0.405 **−0.397 **−0.0040.009 *0.035 **−0.023 **−0.948 **1
Other Sessions−0.079 **0.007−0.073 **−0.145 **−0.044 **−0.101 **−0.052 **0.157 **0.005−0.0060.067 **−0.044 **−0.248 **−0.073 **
* p < 0.05; ** p < 0.01 levels. Highest levels of correlations (>0.36, p = 0.00), in bold italics.
Table 3. Multiple linear regression Ln_Price.
TotalOpen
Water
Men
Waterpolo
SwimmingOpening
Ceremony
DivingHigh
Diving
Synchronyzed
Swimming
Women
Waterpolo
Time in advance0.00190.00000.00050.00190.00100.00140.00120.0027−0.0008
t- statistic47.2600 ***−1.36604.7400 **30.3700 **0.602017.7900 **8.1100 **34.0200 **−4.2100 **
Filter competition
(purchase beofre (0) or after (1) the event begun)
−0.1214−0.1398−0.1664−0.15490.5897−0.1668−0.0533−0.0778−0.2116
t- statistic−18.7600 **−5.4300 **−11.2800 **−13.6600 **10.5700 **−13.6700 **−2.8800−6.3400 **−9.3200 **
Ln_Tickets−0.02130.0370−0.0100−0.0139−0.1271−0.0190.0260−0.04910.0200
t- statistic−5.4000 **1.7910−1.4140−2.3500−3.2300 **−2.28001.6100−4.6600 **1.5690
Week day Afternoon0.1975 0.24730.6443 0.3059 0.09650.2783
t- statistic21.9300 ** 13.5600 **49.700 ** 18.5700 ** 3.8800 **8.4100 **
Weekend Morning0.19210.17080.21900.2224 0.2547 0.14210.2426
t- statistic20.1200 **7.2100 **9.1500 **13.4500 ** 16.9400 ** 5.4700 **6.5400 **
Weekend Afternoon0.3583 0.39200.7939 0.3050 0.28380.4532
t- statistic39.200 ** 20.7200 **62.3800 ** 19.8800 ** 10.300 **13.4200 **
Schannel20.0961 0.03900.08650.28150.16320.02500.07900.0340
t- statistic4.2300 ** 0.86402.64002.16004.500 **0.32701.48400.3280
Schannel3−0.2415−0.2990−0.1357−0.2891−0.3255−0.22670.0090−0.2364−0.1221
t- statistic−14.0500 **−1.3790−2.9200 *−9.4100 **−5.3900 **−7.3800 **0.1420−11.1500 **−2.3400
Schannel40.0237−0.05600.00300.0010−0.00600.0673−0.04950.0360−0.0430
t- statistic2.0700−0.50700.11600.0780−0.07203.0300 **−2.15001.9510−1.2010
Finals or Semifinals0.5940 0.3126−0.7940 0.5690 0.50980.4110
t- statistic23.6400 ** 30.0900 **−71.3030 35.100 ** 34.6600 **27.8900 **
Preliminaries0.1583
t- statistic5.9800 **
Men Waterpolo0.0558
t- statistic3.3700 **
Swimming−0.12435682
t- statistic−77100 **
Diving0.0591
t- statistic3.7800 **
High Diving−0.0886
t- statistic−4.9700 **
Synchronyzed Swimming−0.2231
t- statistic−13.4300 **
Women Waterpolo0.0607
t- statistic3.4600**
Constant2.63293.33842.97262.69383.10942.70593.35302.58442.9191
t- statistic109.5600 ***189.9500 **144.7500 ***169.6400 ***81.400 **86.0900 ***116.8100 ***102.4800 ***85.800 ***
* p < 0.01; ** p < 0.001; *** p < 0.0001 levels.
Table 4. Regression comparison between aquatic disciplines.
TotalOpen
Water
Men
Waterpolo
SwimmingOpening
Ceremony
DivingHigh
Diving
Synchronyzed
Swimming
Women
Waterpolo
N of observations46,181253496821,114861507364410,6422626
ll (log likelihood)−27,243.19865.495−1214.867−14,282.528−711.649−953.735176.361−7016.743−990.870
R20.38580.24440.41370.38260.05650.44850.17350.38450.3415
F-statistic1731.41034.279467.3741546.12635.274450.64541.2471188.561191.872
RDD8798.1008.827474.3634782.463263.300432.60121.8052329.422327.013
DF_M17278410487
AIC54,522.395−124.990242445.733928,583.0561433.29771929.4702−342.7219814,051.4861997.7403
Publisher’s Note: MDPI stays neutral with regard to jurisdictional claims in published maps and institutional affiliations.

