Article

Market-Approach-Based Policy to Achieve Rice Price Stability in Indonesia—Can It Be a Complement?

1
School of Business, IPB University, Bogor 16151, Indonesia
2
Department of Agroindustrial Technology, Faculty of Agricultural Engineering and Technology, IPB University, Bogor 16680, Indonesia
3
Department of Agribusiness, Faculty of Agriculture, University of Lampung, Bandar Lampung 35141, Indonesia
*
Author to whom correspondence should be addressed.
Economies 2022, 10(12), 296; https://doi.org/10.3390/economies10120296
Submission received: 23 September 2022 / Revised: 16 November 2022 / Accepted: 19 November 2022 / Published: 25 November 2022

Abstract

:
Food price volatility broadly impacts the country’s food security. Rice price stabilization in Indonesia is carried out by BULOG, the food state-owned enterprise (SOE) that the WTO has identified as Indonesia’s state trading enterprise (STE). This study was conducted to evaluate the price stabilization program in Indonesia by reviewing the efforts that have been made and analyzing the factors that influence the price of rice at the consumer level using Autoregressive Distributed Lag (ARDL) analysis. The analysis showed that BULOG’s market share affected consumer-level rice prices with a negative coefficient sign, which means that the larger BULOG’s market share, the lower the price of rice will be. Other variables that affect the price of rice at the consumer level are the price of rice itself at the previous time lag, the producer-level paddy price, rice production, rice consumption, and BULOG’s operational rice stock. On the basis of the results of these studies, to realize the stabilization of rice prices in Indonesia, the government can complement stock management through a public policy approach with market-approach-based policies by optimizing the role of Food SOEs as market players in the rice industry.

1. Introduction

The food price volatility that occurred in 2007–2008 and 2010–2011 prompted governments worldwide to increase their awareness of food price volatility due to its wide-ranging impact. The Food and Agriculture Organization (FAO) estimated that food price volatility in 2007–2008 increased the number of people who were malnourished to 173 million people in those two years (Abdallah et al. 2021).
Price volatility is always associated with a country’s food security. Price shocks can disrupt the stability of food availability and affordability and the entire industrial supply chain from upstream to downstream. High price volatility can hinder economic growth and poverty alleviation programs, especially in countries with low domestic incomes. Price increases reduce household income and purchasing power (Firdaus et al. 2019). Rising prices force households to allocate a larger portion of their income to food purchases. This situation can worsen the health status of households by blocking their access to adequate nutritious food and other services (Persaud and Rosen 2003).
Food price volatility has a very real impact on the poor (Patunru and Ilman 2019). Compared with the rich, the poor allocate a larger share of their budgets for food, so they will be worse off if the price of food needs increases (Son and Kakwani 2009). High price volatility, which becomes a disincentive for farmers, reduces their motivation and productivity of farmers so that it has the potential to reduce investment in cultivation activities, increase the occurrence of land conversion, and, in the long term, will further reduce production and increase dependence on imports (Girik Allo et al. 2018).
High rice prices result in zero-sum outcomes. This is because most paddy farmers are consumers of rice, so the increase in rice prices will eliminate the income of paddy farmers. The universal spike in food prices evokes a traumatic response for both producers and consumers. In the experimental and psychological literature, the basis for this behaviour is that humans prefer a stable environment over an unstable environment (Timmer 2014).
The food economy has always been linked to politics. Many facts show that political instability often occurs due to high food price fluctuations (Arezki and Bruckner 2011; Lagi et al. 2011). Governments in Asian countries define food security as a political concept by crafting various policies to maintain stable rice prices in their countries. Governments that fail to stabilize food prices are considered to have failed in realizing the basic needs of their people (Timmer 2014).
In Indonesia, rice is an important and strategic commodity, and it is estimated that it will still be the staple food of the Indonesian people until 2045 (Arifin et al. 2019). With rice farming as the main livelihood and staple food for the population, rice price stability policies in Indonesia must be able to benefit farmers and not harm consumers. The Indonesian government faces a dilemma of price expectations. On the one hand, farmers want high grain prices, and on the other hand, consumers want the opposite (Johnson 1984).
Rice price stabilization in Indonesia is assigned to BULOG as an institution established by the Indonesian government to implement food policy. BULOG has been identified by the WTO as Indonesia’s State Trading Enterprise (STE) since 2002. The price stabilization program in Indonesia, especially for rice commodities, is carried out with the main activities in the form of domestic and foreign rice procurement programs, management of government rice reserves, and market operations programs for price stabilization at the consumer level. The results of domestic and foreign procurement programs are managed in the form of public stock. The stock is then used for price stabilization, overcoming food insecurity, post-disaster food emergencies, international assistance, ASEAN reverse, and other government needs. If domestic production is insufficient, the government through BULOG will import rice. In addition to managing the government’s rice reserve, following BULOG’s form as a state-owned enterprise, BULOG also develops food-based industries.

2. Literature Review

2.1. Rice Price Stabilization Policy in Indonesia

The triumvirate of American economists, Peter Timmer of Harvard University and Scott Pearson and Walter Falcon of Stanford University, are economists who officially became the architects of economic development during the early days of President Soeharto in the early 1970s, especially in helping to design a price stabilization strategy with a government intervention model (Arifin 2020).
Despite the controversy among world economists, especially from adherents of neoclassical economic theory who oppose government interference in the process of price formation in the market, the theoretical basis for the policy of stabilizing rice prices in Indonesia used by the triumvirate has a fairly solid basis and has proven to be quite effective in Indonesia. The theoretical basis for the policy of stabilizing rice prices in Indonesia was developed using a price equilibrium approach with an intervention model of floor price and ceiling price policies.
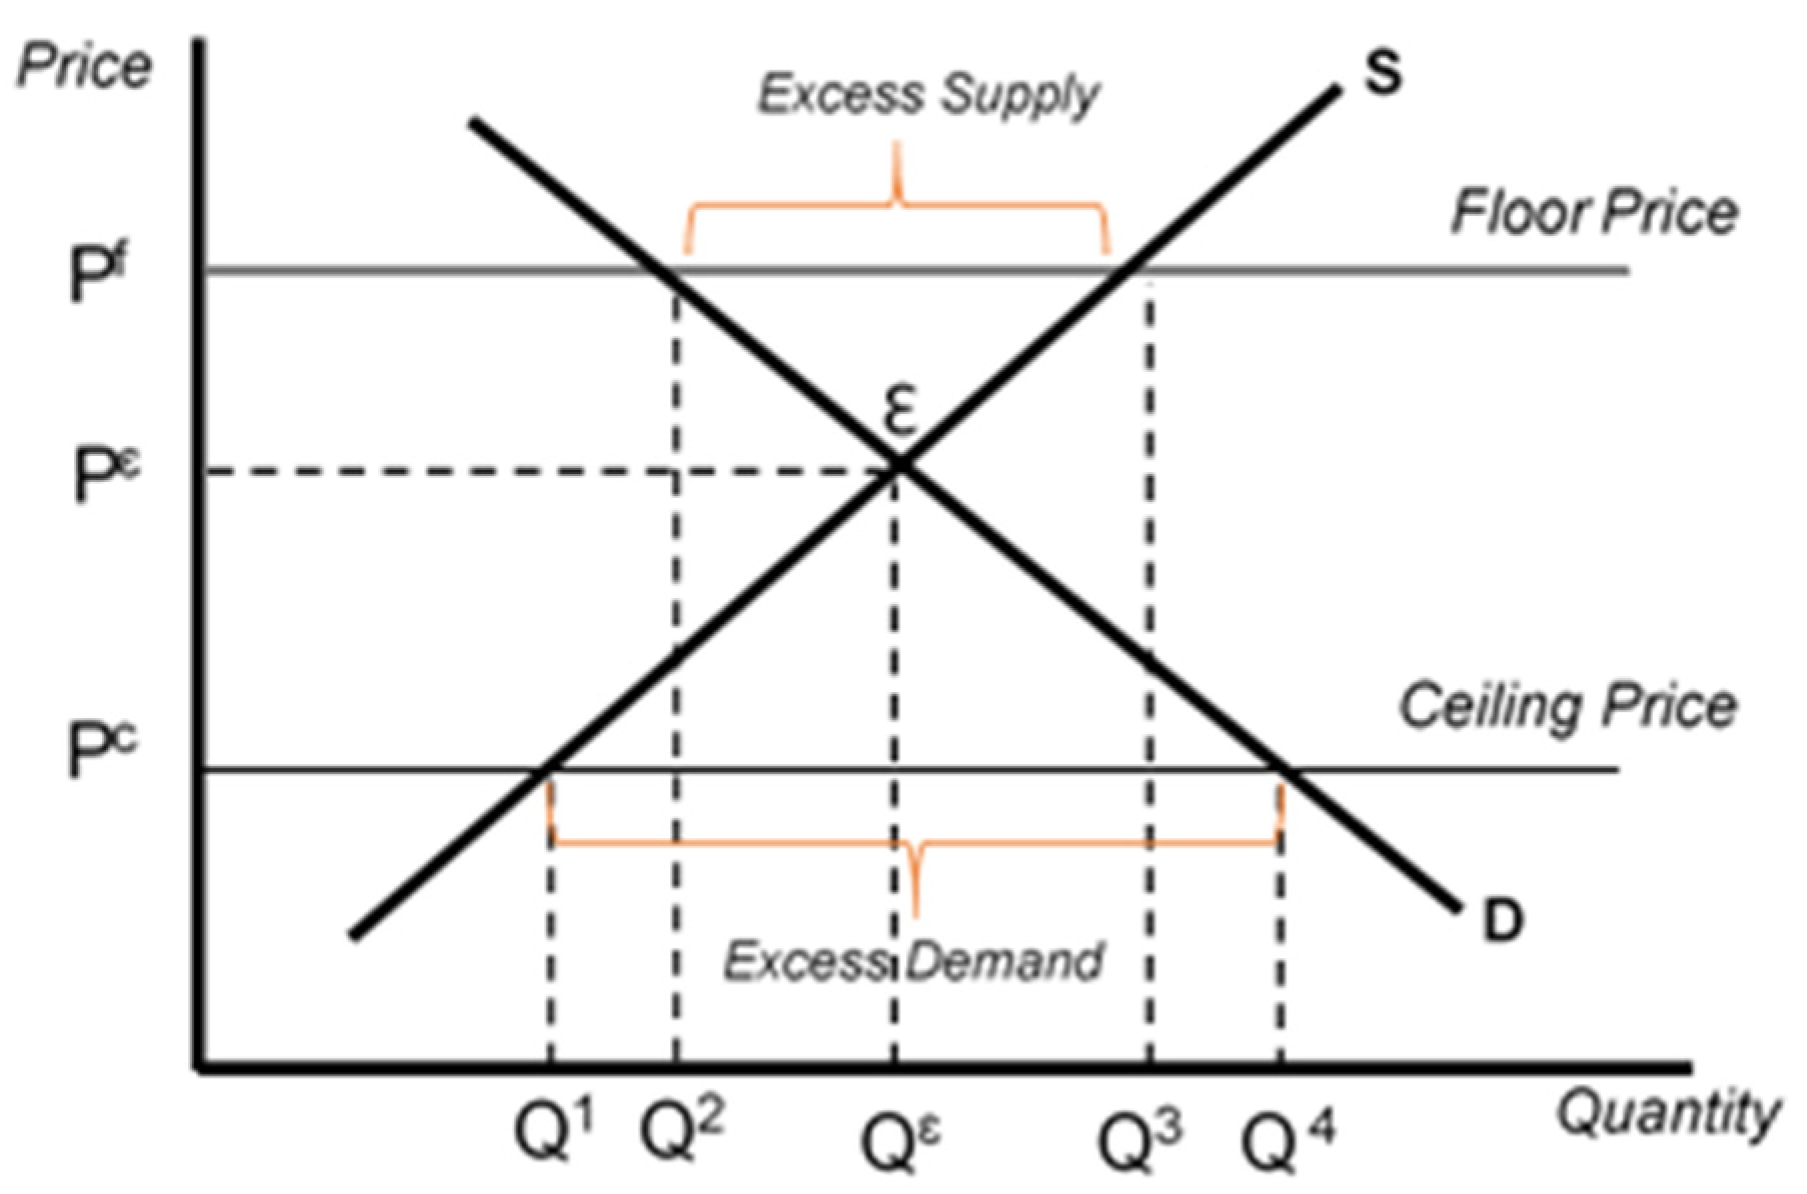
If in a rice market, a policy of floor price of paddy (Pf) is applied above the equilibrium price to protect farmers, then according to Figure 1, the price balance, which was originally at the point ε (Pε and Qε), will shift, causing the supply to increase to Qs due to providing incentives for farmers to produce, while demand will fall to Qd because consumers perceive high prices and reduce their purchasing power. In the long term, this condition will cause excess supply, which is when the market experiences excess production; thus, it requires the government’s participation to absorb the excess production so that farmers do not lose their production motivation. The floor price is usually set above the equilibrium price by considering production costs and reasonable margins.
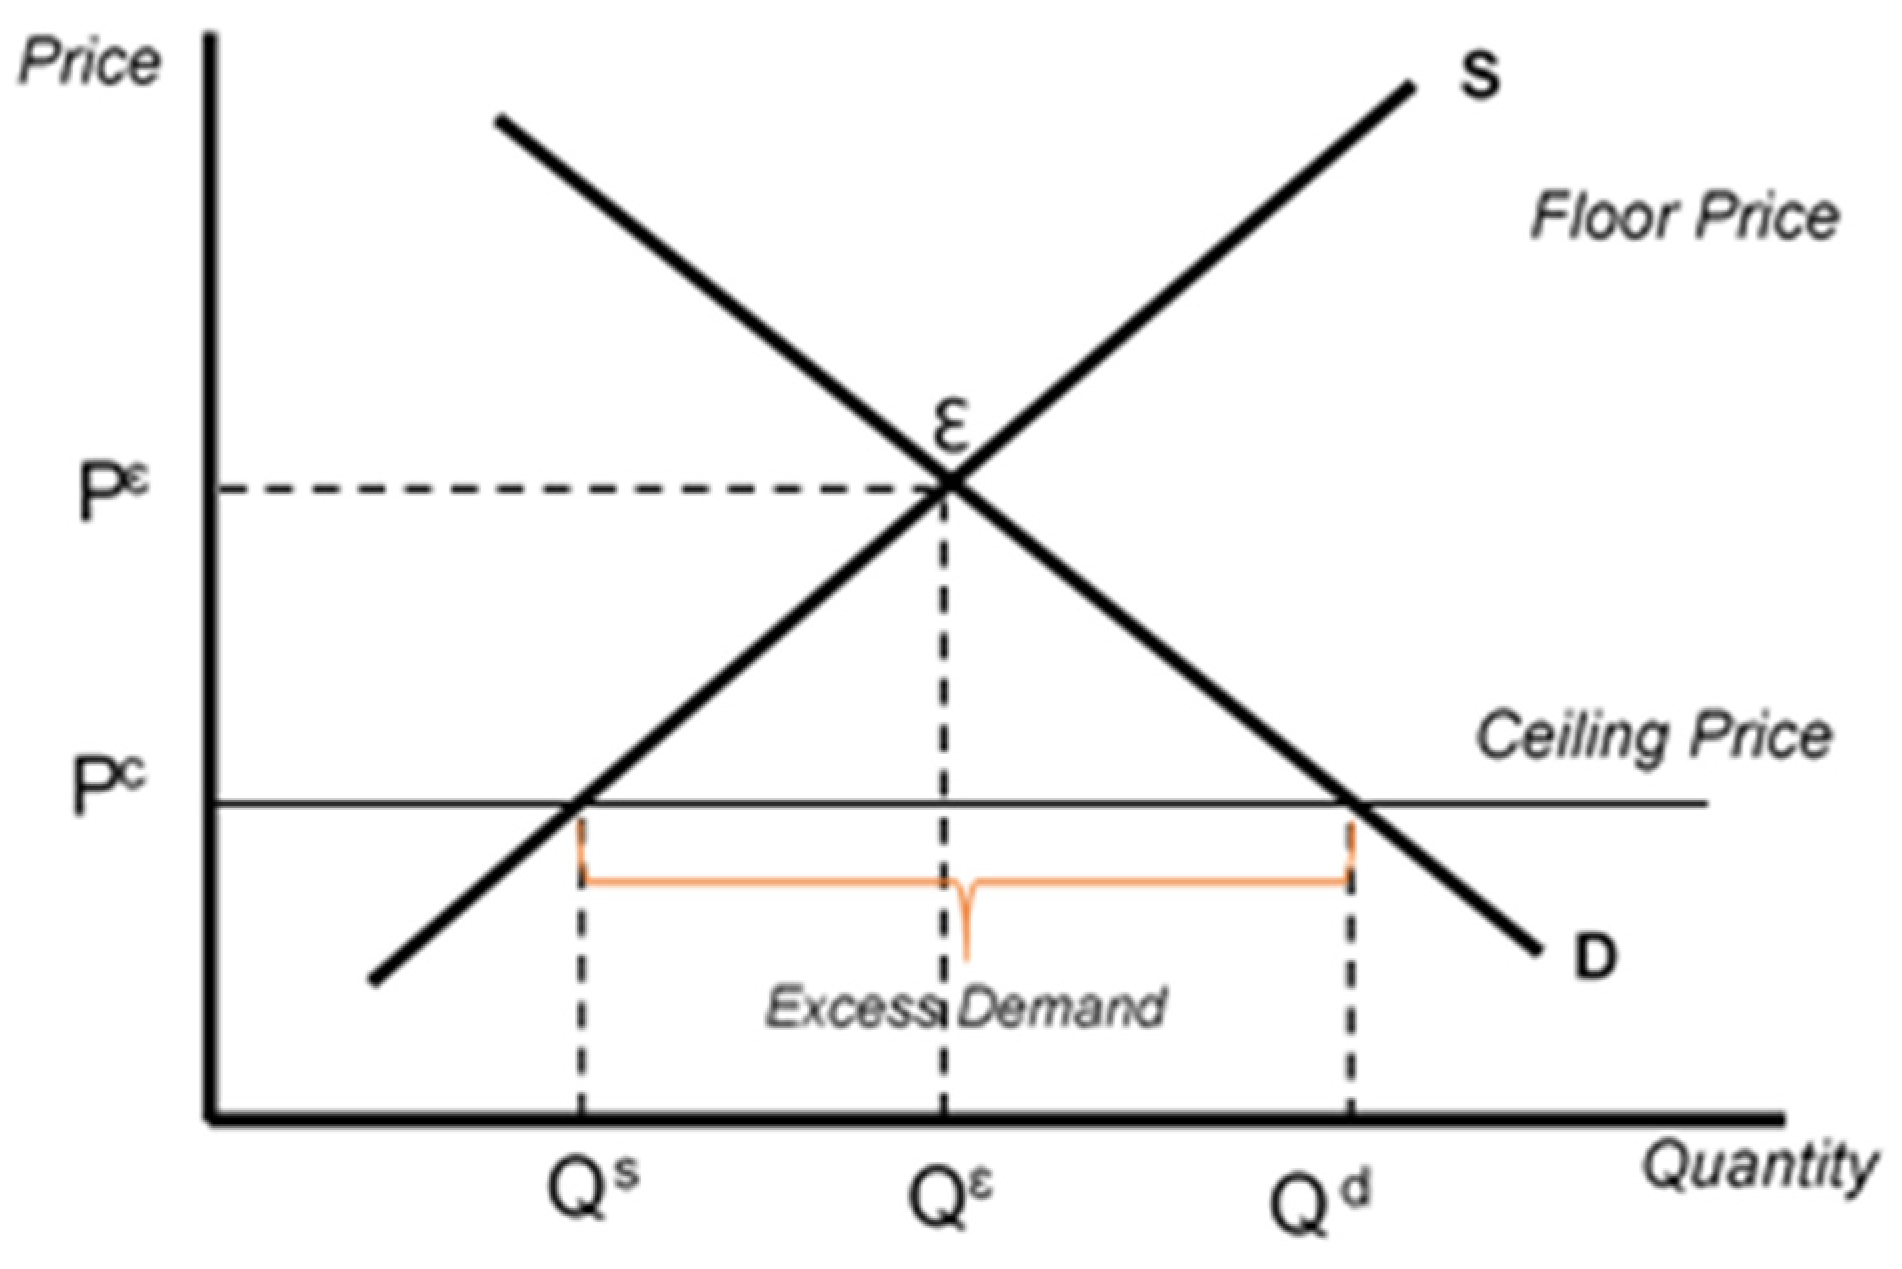
On the other hand, if a ceiling price policy (Pc) is applied below the equilibrium price to protect consumers, then according to Figure 2, the price balance, which was originally at point ε (Pε and Qε), will shift, where consumption will increase to Qd because of incentives for consumers in the form of lower rice prices, while supply will drop to Qs because producers perceive the policy as a disincentive to produce. In the long term, this condition will cause excess demand, which is a condition where the market experiences excess consumption; thus, it requires the government’s role to be able to fulfil the excess demand that occurs in the market. The ceiling price is usually set below the equilibrium price.
The two theoretical frameworks are combined into a price stabilization theoretical framework, as shown in Figure 3 below:
The price policy has been applied to paddy grain commodities to protect farmers in the form of a floor price and has been applied to rice commodities to protect consumers in the form of a ceiling price. The government absorbs excess supply in domestic procurement programs and fulfils excess demand through market operation programs. In various works in the literature, such as Dev and Zhong (2015), this stabilization concept is called stock management through a public policy approach.
In conclusion, the concept of stabilization with stock management through a public policy approach in an integrated manner includes (1) floor price policy, (2) ceiling price policy, (3) domestic procurement policy, (4) market operation policy, (5) government rice reserve policy, (6) routine distribution policy for revolving stock, and (7) stock disposal policy.
In Indonesia, the floor price policy was enforced until 2002. Then, it was changed to a government purchase price policy. This policy differs philosophically from the base price policy. The government’s purchase price policy is more administrative as a guide for BULOG to procure grain/rice (Arifin 2020). With this policy, BULOG is not obliged to buy all grain whose price is below the floor price.
The ceiling price policy is carried out by setting the highest retail price since 2017. Previously, the government set criteria for price volatility as a parameter of market operations. This was chosen because the government has a food assistance program for low-income communities, so consumer protection is considered to have been represented by the program (Gafar 2008).
The market operation program is carried out in Indonesia to prevent the impact of price instability, especially on macroeconomic parameters such as inflation (Gafar 2008). Initially, the market operation program was implemented if the increase in rice prices exceeded a certain percentage set by the government. Currently, the market operations program has changed to the “Ketersediaan Pasokan dan Stabilisasi Harga (KPSH)” program (for this research, hereinafter referred to as “Continuous Market Operations” program), which is philosophically different from the general market operation concept because it can be carried out throughout the year without waiting for price fluctuations to occur. The Indonesia price support program is costly and strains the government accounts, even if the program’s administrative costs are ignored (Robinson et al. 1997).
Previous research on rice price stabilization in Indonesia has focused on this stock management through a public policy approach. Aryani (2021) reported that market operations and rice imports affected rice prices but were ineffective in stabilizing rice prices due to the lack of time and quantity in policy implementation. Hermawan et al. (2017) and Dabukke (2000) found that domestic rice production has an effect with a negative coefficient sign on domestic rice prices. Saptana et al. (2019) concluded that the supply aspect affects the formation of grain and rice prices more than the demand aspect. The results of Sulandari’s (2008) research state that the weighted retail price of rice significantly positively affects the Consumer Price Index. Respatiadi and Nabila (2018) found that the price of rice in Indonesia deviates from and is more expensive than the international market.

2.2. Market-Approach-Based Policy

Starting from 2000, after the monetary crisis, although not openly acknowledged, Indonesia has adopted the concept of liberalism with a controlled open market policy. This economic model was marked by the change in the institutional model of BULOG as a state-owned enterprise (SOE) in 2003. BULOG has also been recognized by the World Trade Organization (WTO) as a state trading enterprise (STE) in the food sector.
Indonesia views food, especially rice, as a strategic industry not only economically but also politically and culturally. Therefore, state control in this industry is a constitutional mandate. The role of SOEs is needed maximally for industries with at least three categories: important industries, industries that control the livelihood of many people, and industries that exploit natural resources (Dwijowijoto 2021).
In facing the era of globalization and capitalism 4.0, where SOEs are representatives of the state in the economy and have the goodwill to create a fair market for the greatest benefit of the people, the role of food SOEs is needed to create food price stability both through public stock holding management and its role as market players in the food industry.
Bremmer (2010) showed that the control of SOEs in the country’s economy, especially in strategic sectors, is increasing in trend almost all over the world. Since the 2008 capital market crisis that rocked the American economy and the whole world, a new economic system has been born by making SOEs the backbone of the country’s economy (Kaletsky 2010). Currently, the government is involved in the economy through fiscal and monetary policies. The government is also directly involved in the micro-economy through its state-owned enterprises (Dwijowijoto 2021).
Another perspective that illustrates the important role of a company in price stabilization was shown by Kotler and Armstrong (2013). From the perspective of market competition, a company can be a price maker and influence and direct the market when it can take a position as a market leader. A market leader is a company with the characteristics of having a certain amount of market share and a competitive advantage compared with other market traders in the same industry. This concept shows that apart from managing the government’s rice reserves and market operations, the government has another alternative by increasing the role of food SOEs as market leaders in the rice industry to create a stable rice market.
In China, with the slogan “Grasp the large, let go of the small”, the government ensures that state-owned enterprises dominate strategic sectors. On the basis of the David–Goliath symbiosis, small discoveries and breakthroughs are encouraged to be produced by new small companies in the high-tech industrial sector. The best, most promising innovations are then purchased or licensed by large state-owned companies (Schweinberger 2014). Currently, China’s main source of power is state ownership of large companies in strategic industries (Naughton 2008).
China has a much more open trade regime than many other populous countries, even for the strategic food industry. Compared with India, which now still relies on price stabilization with an expensive stock management approach, China can maintain its food security by using a more market-based approach than India (Dev and Zhong 2015).
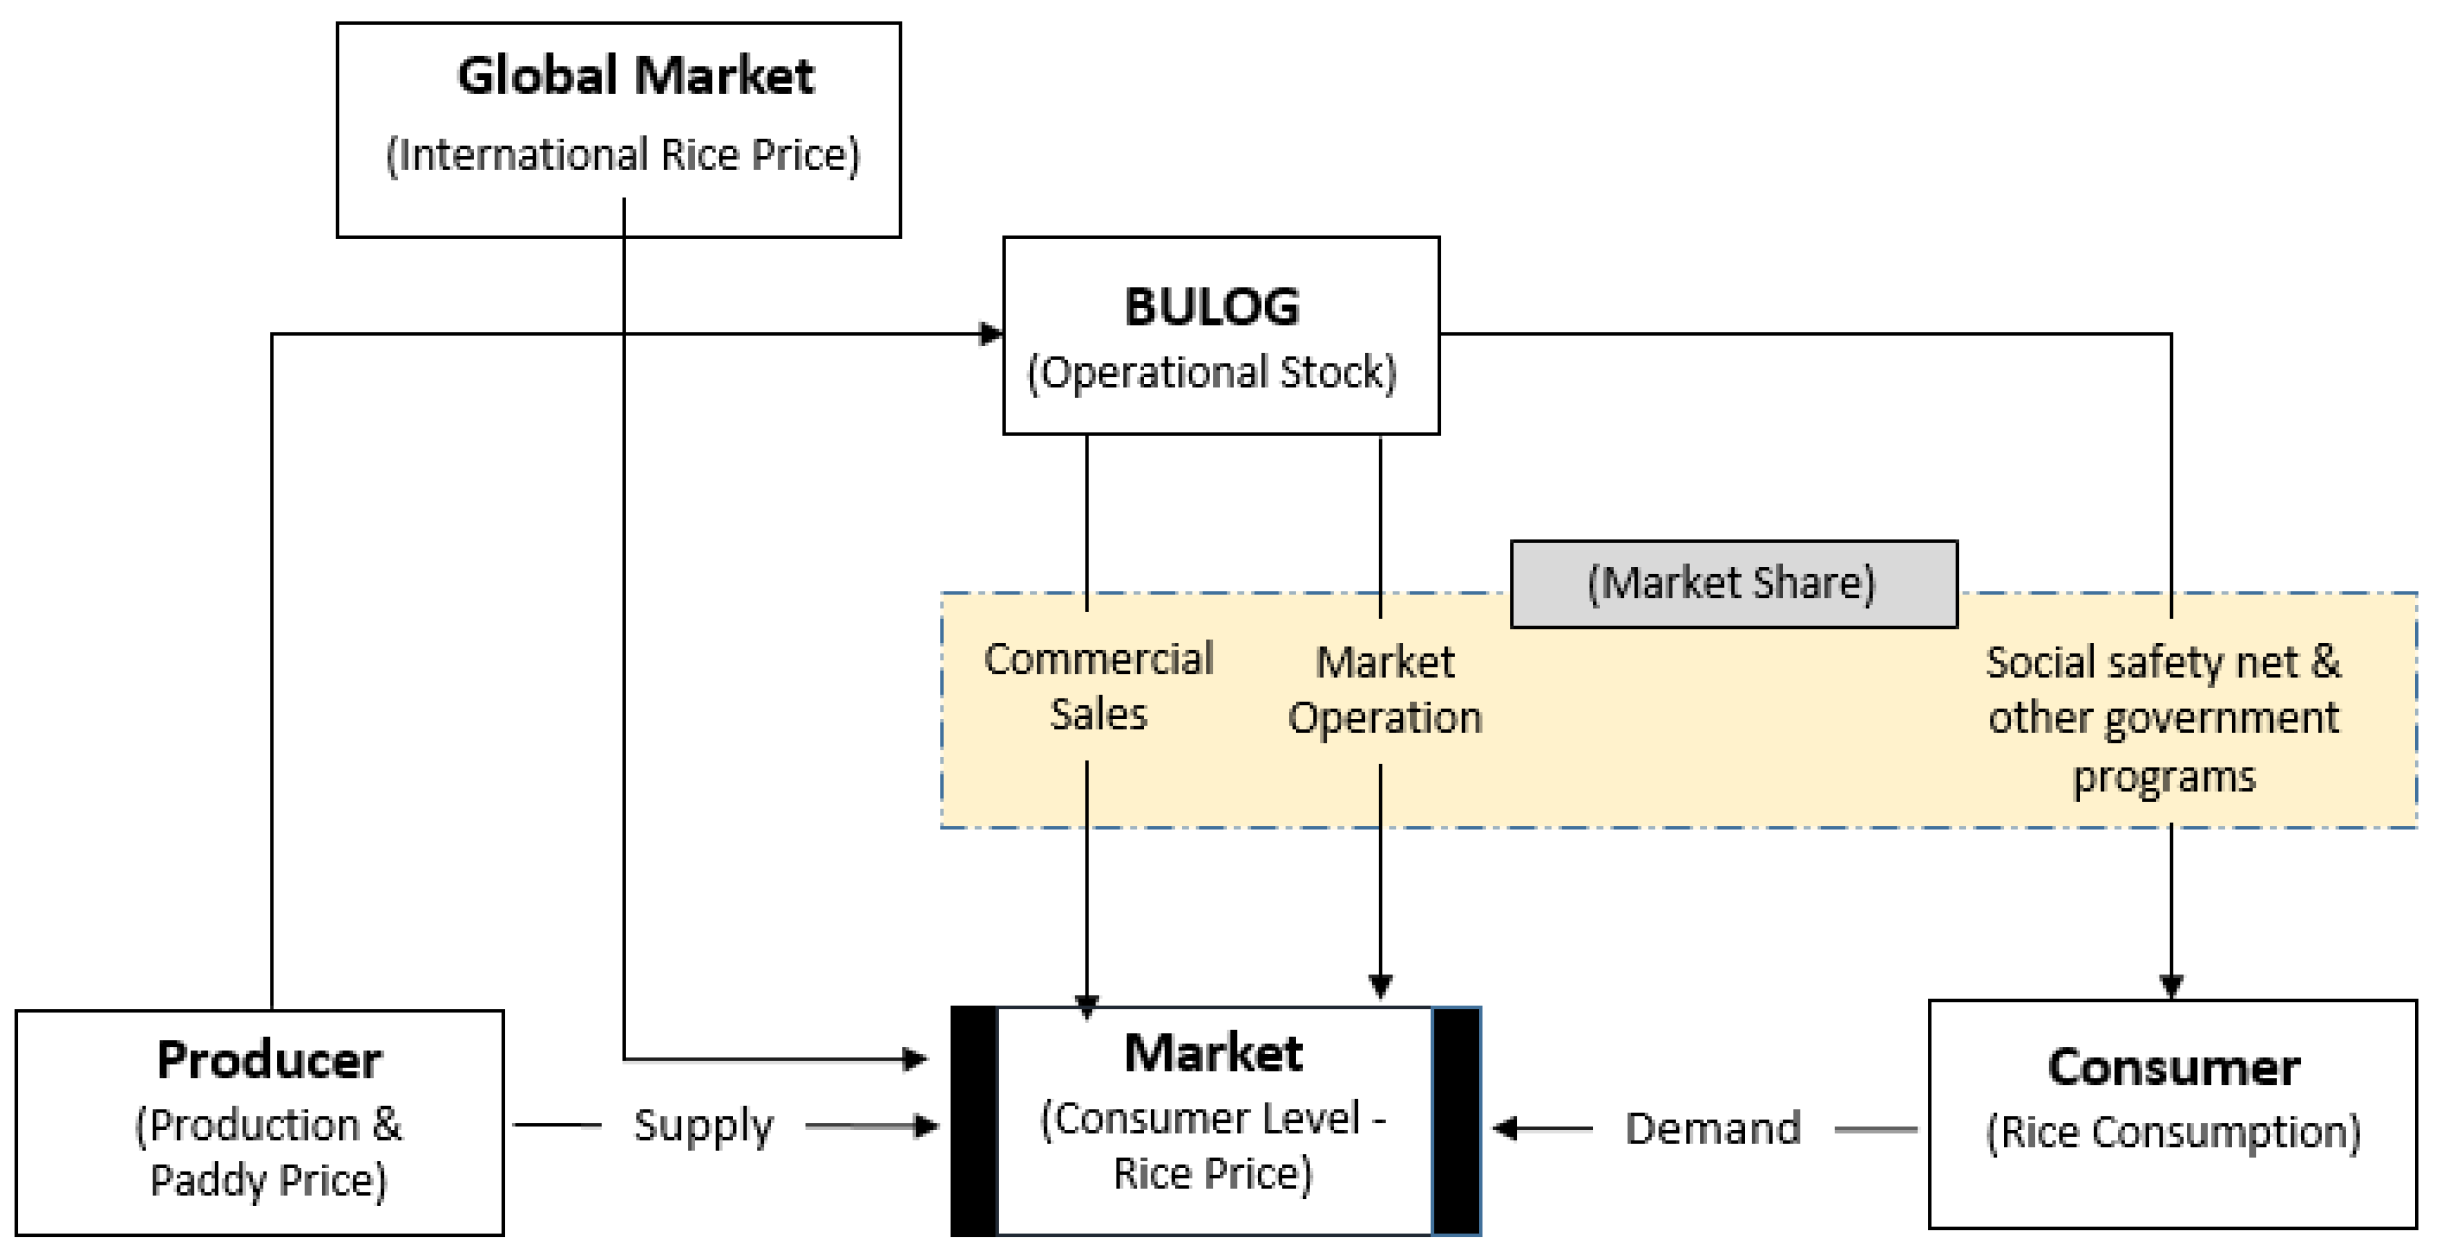
This study aims to illustrate another perspective on efforts to stabilize rice prices by looking at the effect of BULOG’s overall market share on consumer-level rice prices in Indonesia, along with other variables, as shown in Figure 4, that is, grain prices, foreign rice prices, production, consumption, and rice stocks controlled by BULOG. This study also uses the dummy variable to see the difference between the effect of the ceiling price policy and the period before the policy as well as the difference between the effect of the modified market operation policy and the period before the policy.

3. Data and Methodology

3.1. Data

The data used in this study are monthly time series data for 20 years from January 2001 to December 2020. The data period used in this analysis started in 2001 with the consideration that, in that year, the condition of the rice market was quite stable after previously experiencing a shock due to the economic crisis conditions in Indonesia in 1998/1999. The list of data with definitions, sources, and writing in the research variables is shown in Table 1.
The level of quality of rice studied in this research is medium-quality rice, according to the quality of rice that is most produced and consumed by Indonesian people (Arifin 2020). Consumer-level rice rrice is the price of medium-quality rice paid by the end consumer in the market. BULOG’s market share is the total of BULOG’s business volume divided by the amount of rice consumed in Indonesia. Producer-level paddy price is the price of dry paddy grain received by farmers in mills. International rice price is the price of medium-quality Thailand rice with 25% broken grains. In the data analysis process, present value data transformation has been implemented to eliminate the effect of inflation on price variables.
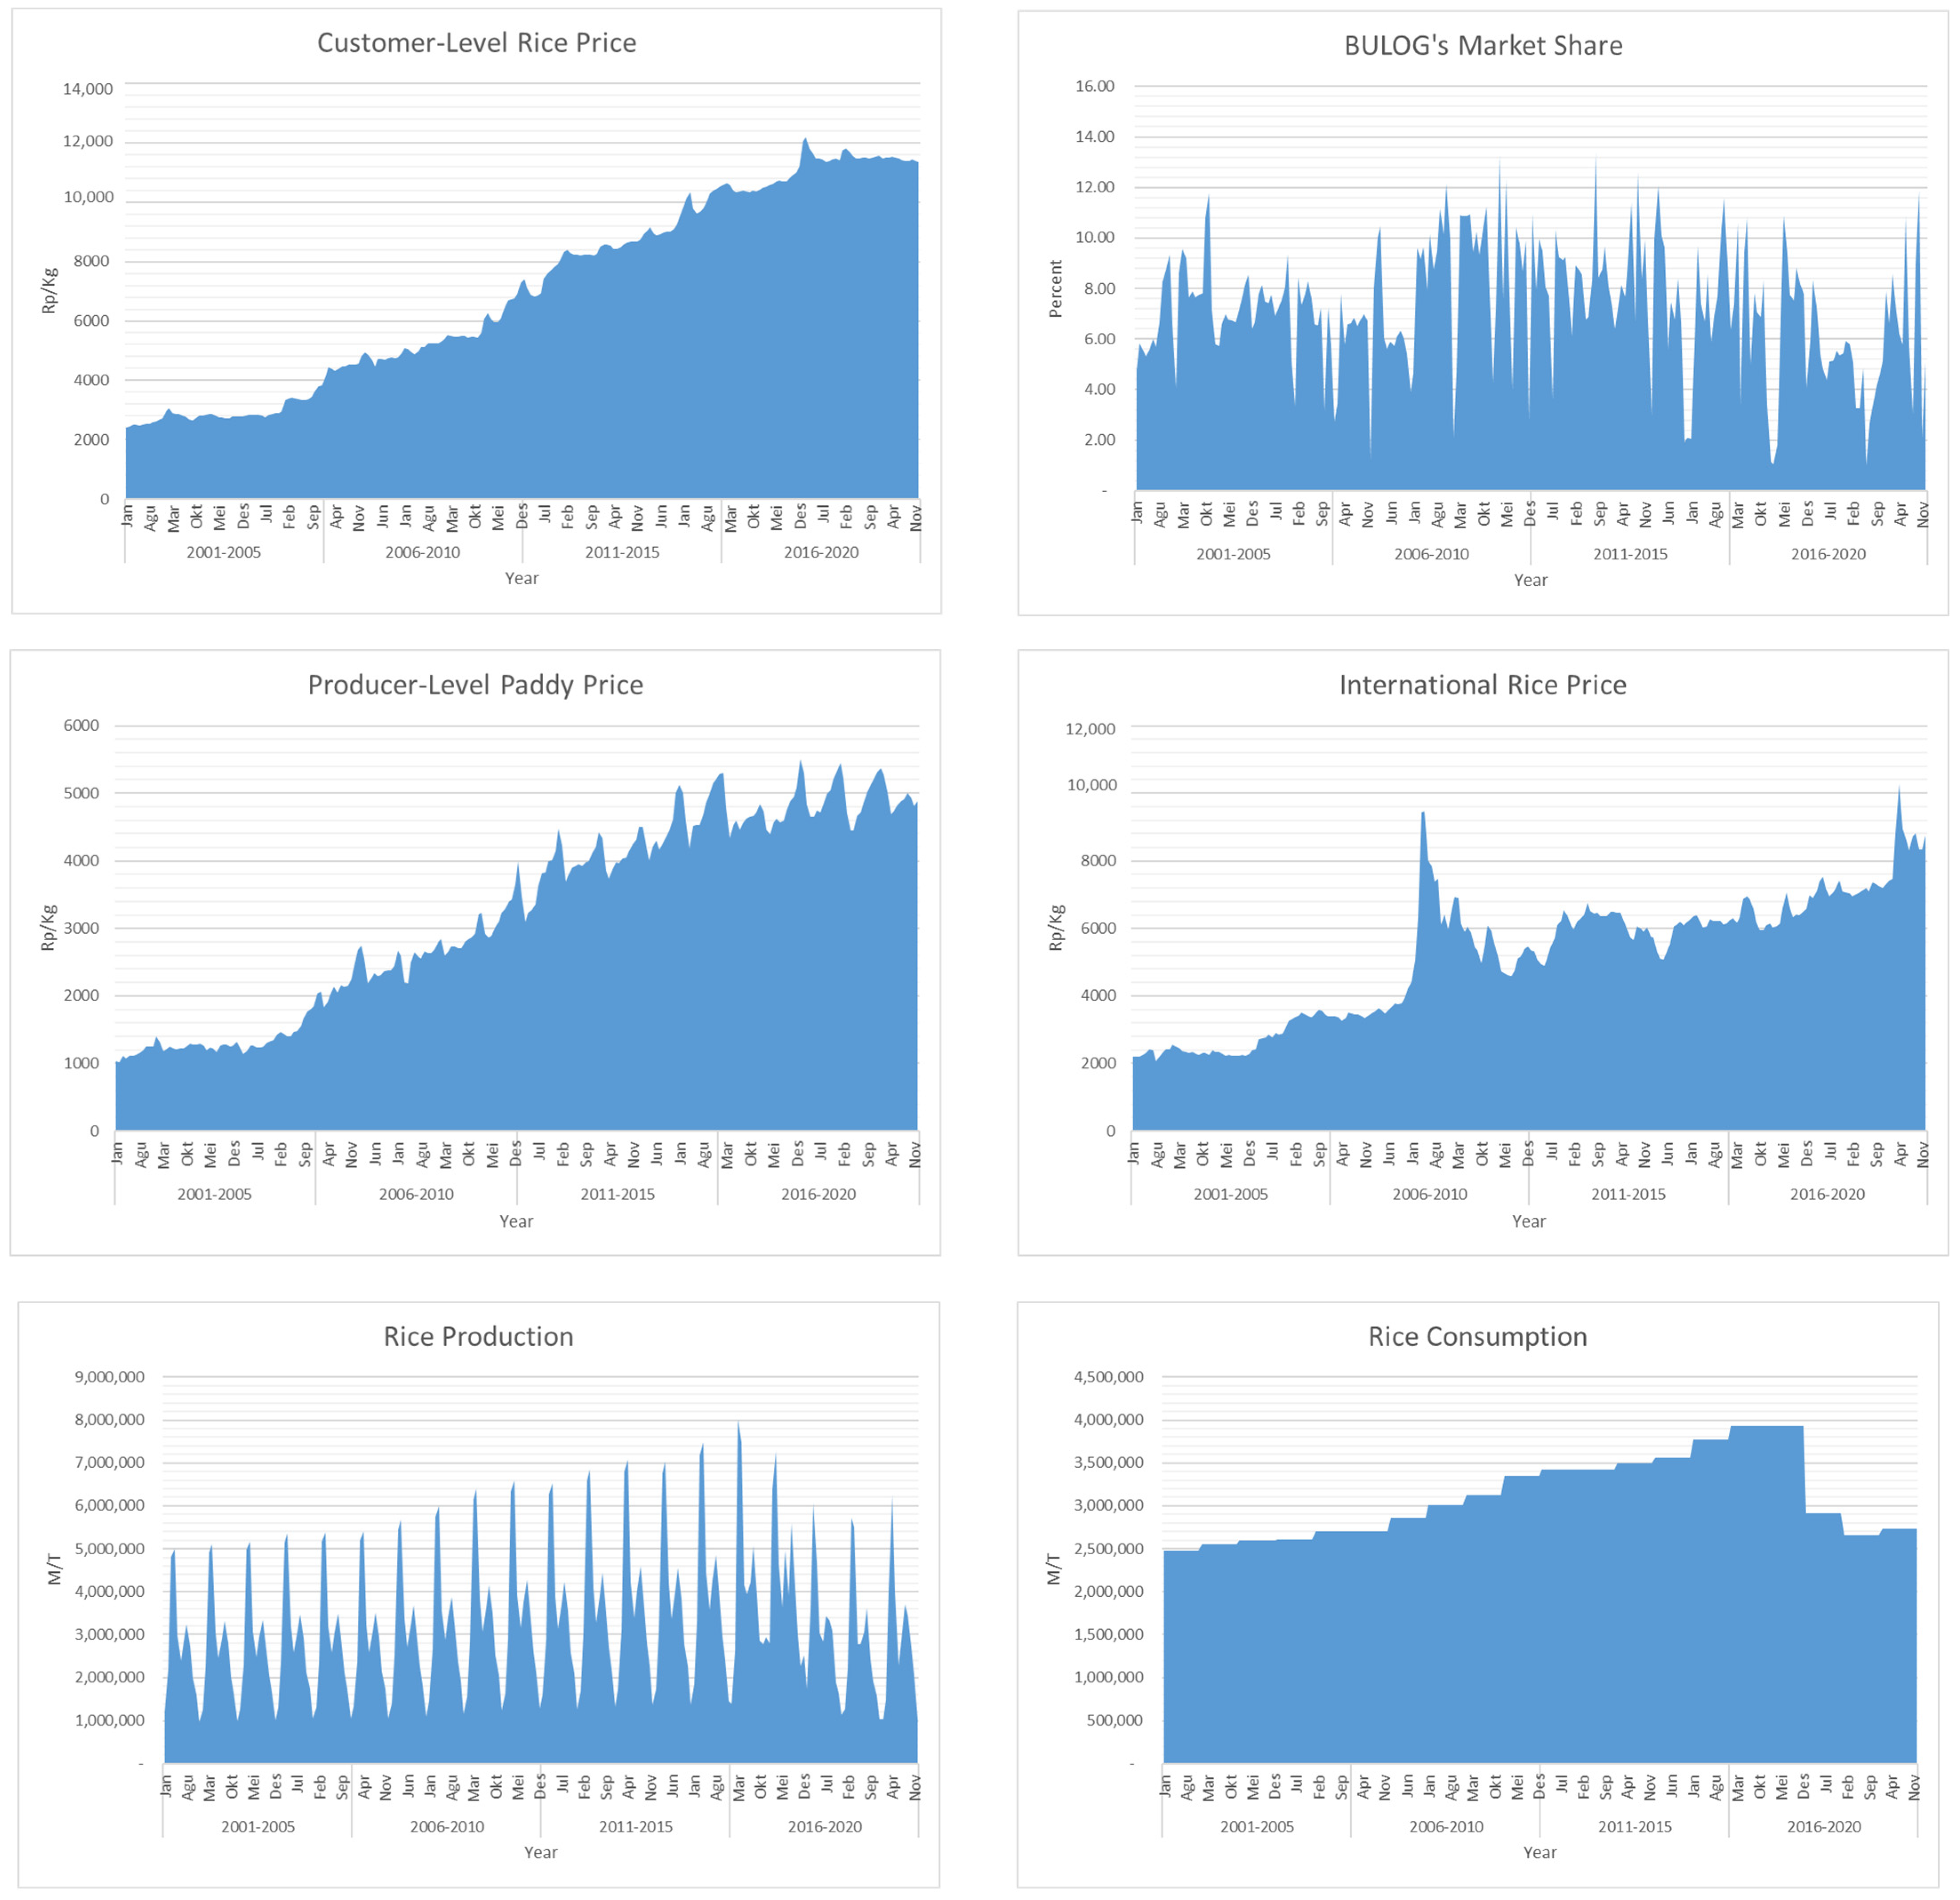
Rice consumption is obtained from data on rice consumption per capita multiplied by the Indonesian population, and rice production is the amount of dry grain production multiplied by the standard amount of grain processing yields of the rice. BULOG’s operational rice stock is BULOG’s rice inventory for both public service obligations and business operations. The highest retail price is the policy on the upper limit of consumer-level rice prices set by the Indonesian government from April 2017 until now (The policy for the highest rice price has been set only once and has not changed until now). Continuous market operation is a market operation program policy that is carried out continuously throughout the year to maintain the supply of rice in the market. In this study, the last two variables were analyzed as dummy variables. Data analysis in this research uses Eviews v.12 software. An overview of data trends in time frames is depicted in the following Figure 5:

3.2. Methodology

This research is conducted to analyze the effect of BULOG’s market share on consumer-level rice prices in Indonesia, along with other variables, using the empirical method of econometric statistical analysis to classify time series models. The regression model using time series data is used to analyze the effect of the independent variable (x) on the dependent variable (y) in the same and previous periods. The time required for the independent variable (t) to affect the dependent variable (y) is called the time difference or lag (Gujarati and Porter 2006). The regression model which includes the present value and past value of the independent variable (x) and the lag of the dependent variable (y) is called autoregressive distributed lag (ARDL).
The ARDL method was introduced by Pesaran and Shin (2012) by testing the Cointegration Bound Test. This method estimates the linear regression model and analyzes the long-term relationship involving the cointegration test between time series variables. The cointegration test can be performed by comparing the value of the F-statistic with the F-table prepared by Pesaran and Pesaran (1997).
The hypotheses in the Cointegration Bound Test are as follows:
H0 = α1 = α2 = αn = 0; there is no long-term relationship.
H1α1α2αn ≠ 0; there is a long-term relationship.
If the F-statistic value obtained from the results of the Bound Test is greater than the upper critical value I(1), then reject H0, and it is concluded that there is a long-term relationship or there is cointegration. If the F-statistic value is below the lower critical value I(0), then it does not reject H0, and it is concluded that there is no long-term relationship or there is no cointegration in the model. If the F-statistic value is between the upper and lower critical values, the results cannot be concluded. In general, the ARDL model in the long-term equation can be written as follows:
Y t = a 0 + a 1 t + i = 1 p β 1 Y t i + i = 0 q β 2 X 1 t i + i = 0 r β 3 X 2 t i + + i = 0 q a n X n t i + ε t
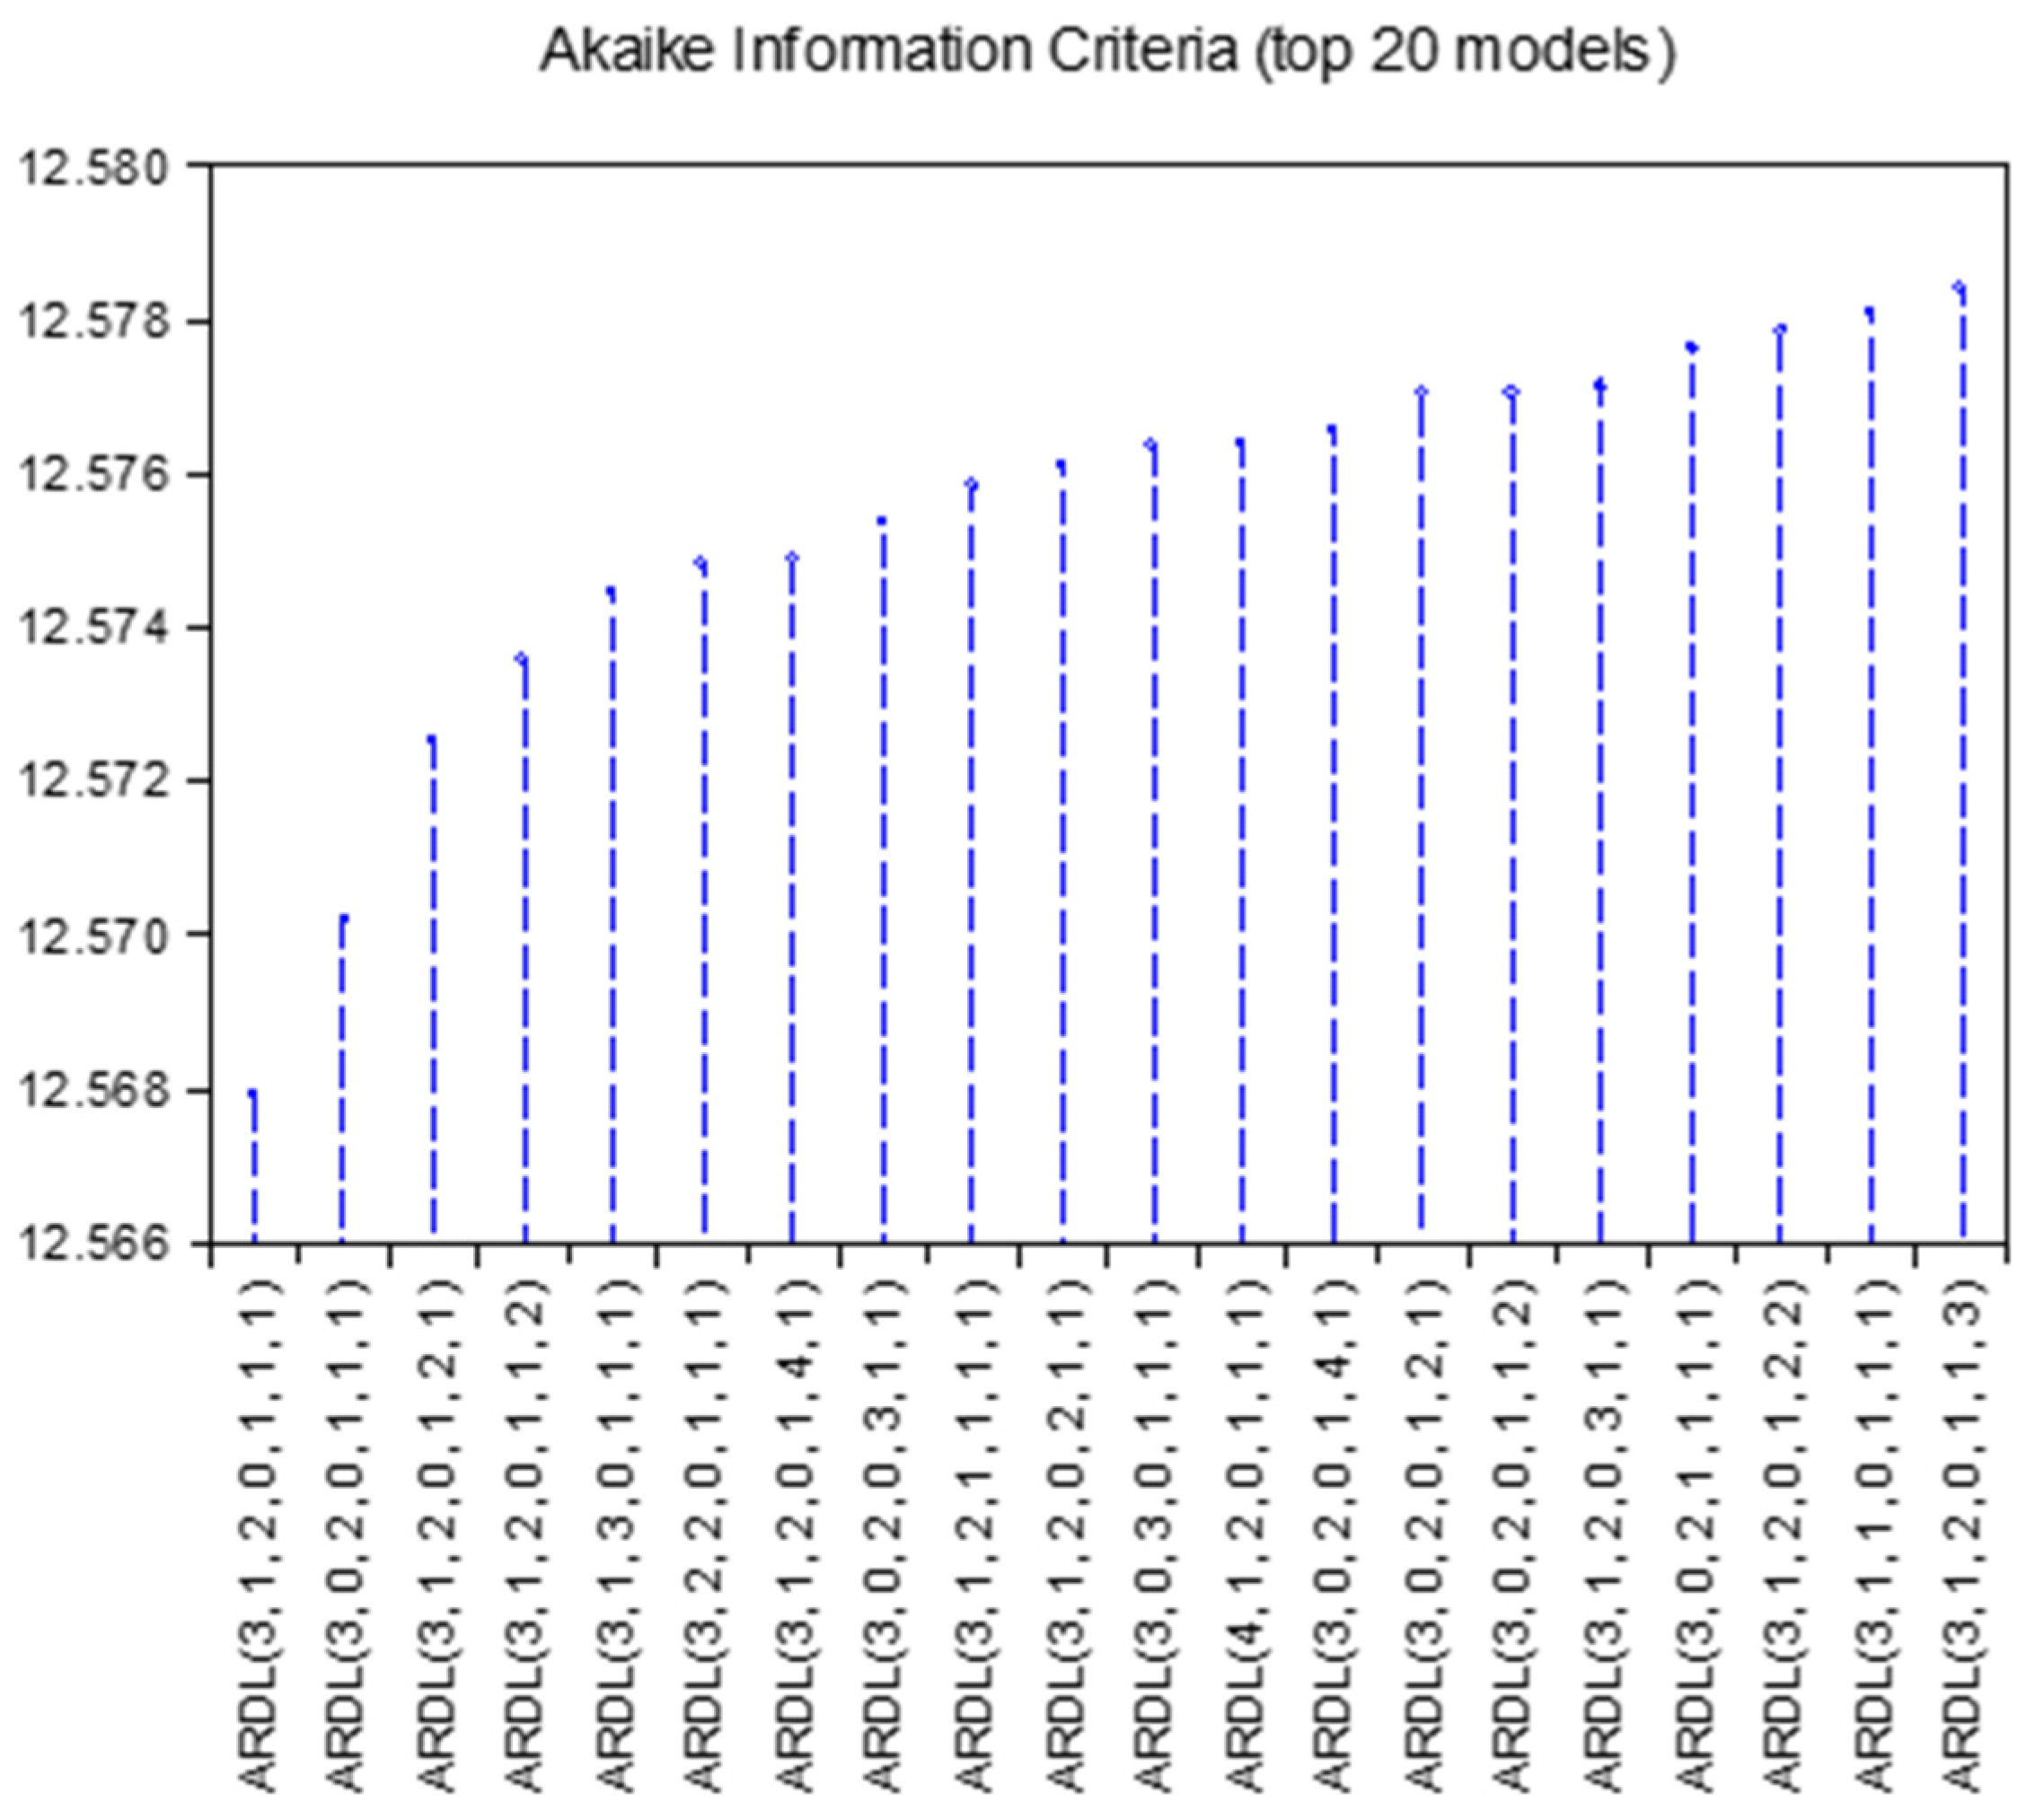
The ARDL model approach requires a lag, as in the equation above. The selection of the right lag for the model in this study uses the Akaike Information Criteria (AIC) method. The next step in the ARDL method is to estimate the model with the Error Correction Model (ECM). Estimates using the Error Correction Model based on the long-term equation above are as follows:
Δ Y t = a 0 + a 1 t + i = 1 p β 1 Δ Y t i + i = 0 q β 2 Δ X 1 t i + i = 0 r β 3 Δ X 2 t i + + i = 0 q β n Δ X n t i + β E C T t 1 + ε t
ECTt is an error correction term that can be written as follows:
E C T t = Y a 0 a 1 t + i = 1 p β 1 Δ Y t i + i = 0 q β 2 Δ X 1 t i + i = 0 r β 3 Δ X 2 t i + + i = 0 q β n Δ X n t i
Time series data modelling requires pre-estimated testing in the form of stationarity testing because, generally, time series economic data is stochastic or has a trend that is not stationary/contains unit roots. The unit root test in this study used the Augmented Dickey–Fuller (ADF) method. Suppose there is a time series equation model as follows:
Y t = a 0 + ρ y t 1 + ε t
In this model, ρ is the estimated parameter. If | ρ | ≥ 1, then it is not stationary. On the other hand, if the value of | ρ | ˂ 1, then yt is stationary.
Statistical   Test = ρ 1 S ρ
If the test results state that the data are not stationary, then the next step is to subtract both sides of the equation yt = α + ρ yt−1 + εt by yt−1; hence, it can be represented as:
Δ Y t = a + ρ * y t 1 + ε t   with   ρ * = ρ 1
In the above test, the hypotheses used are H0: ρ * = 1 and H1: ρ * ˂ 0. If the ADF t-statistic value is smaller than the MacKinnon critical t-statistic, then the test result is rejected H0, which states the data are stationary at level difference one known as the first difference.
Determination of the optimum lag in the model is carried out to determine the combination of lag in the ARDL model. Optimal lag is selected on the basis of the Akaike Information Criterion (AIC) basis value which, according to Pesaran and Shin (2012), shows better reliability.
A cointegration test is carried out by testing whether the non-stationary variables are cointegrated between one variable and another. This cointegration is formed when the combination of non-stationary variables produces a stationary variable. Consider the equation as follows:
Y t = β 0 + β 1 x 1 + β 2 x 2 + ε t
Then, the variance of the equation can be written as:
ε t = Y t β 0 β 1 x 1 β 2 x 2
Note that εt is a linear combination of x1 and x2.
The cointegration concept introduced by Engle and Granger (2015) requires that εt must be stationary at I(0) to be able to produce an equilibrium in the long run. In this study, researchers have used the Bound Test Cointegration method with the ARDL approach introduced by Pesaran et al. (2001).
The data variables used in this study are secondary monthly time series data for 20 years, that is consumer-level rice price (CRP), BULOG’s market share (BMS), producer-level paddy price (PPP), price of rice import (IRP), rice production (PROD), rice consumption (CONS), BULOG’s rice stock (STOCK), highest retail price (HRP), and continuous market operation (CMO). The DHRP dummy variable was created to examine the effect of the highest retail price policy on consumer-level prices compared with a period when there was no regulation regarding the policy. Meanwhile, the DCMO dummy variable was created to examine the effect of the continuous market operation policy on consumer-level prices compared with the period before the policy was implemented.
The mathematical model to investigate the effect of the independent variable on the dependent variable by taking into account the time-lapse (lag) is as follows:
H B K t = α 0 + t = 1 n β 1 CRP t i + t = 1 n β 2 BMS t i + t = 1 n β 3 PPP t i + t = 1 n β 4 IRP t i + t = 1 n β 5 PROD t i + t = 1 n β 6 CONS t i + t = 1 n β 7 STOCK t i + β 8 DHRP + β 9 DCMO + ε t
VariablesDescription
CRPConsumer-Level Rice Price
BMSBULOG’s Market Share
PPPProducer-Level Paddy Price
IRPInternational Rice Price
PRODRice Production
CONSRice Consumption
STOCKBULOG’s Operational Rice Stock
DHRPHighest Retail Price Policy Dummy Variable
DCMOContinuous Market Operation Policy Dummy Variable
εConfounding Variable
α Constant
β Regression Coefficient
tTime period
iTime Period before Period t
The hypotheses for this study are:
  • The consumer-level rice price at time t has an effect on consumer-level rice prices.
  • BULOG’s market share at time t has a negative effect on consumer-level rice prices.
  • The producer-level paddy price at time t has a positive effect on consumer-level rice prices.
  • International rice prices at time t have a positive effect on consumer-level rice prices.
  • Rice production at time t has a negative effect on consumer-level rice prices.
  • Rice consumption at time t has a positive effect on consumer-level rice prices.
  • BULOG’s operational rice stock at time t has a negative effect on consumer-level rice prices.
  • There is a difference in the effect before and after the implementation of the highest retail price (HET) policy on the consume-level rice price.
  • There is a difference in the effect before and after the implementation of the continuous market operation policy on the consume-level rice price.
Based on the research hypothesis above, the expected signs of the regression coefficient for each of the variables in this study are as follows:
VariablesExpectation Coefficient Sign
CRPPositive/Negative
BMSNegative
PPPPositive
IRPPositive
PRODNegative
CONSPositive
STOCKNegative
DHRPPositive/Negative
DCMOPositive/Negative

4. Results and Discussion

4.1. The Influence of BULOG’s Market Share on Consumer-Level Rice Prices

On the basis of the results of the stationarity test (unit root test) in Table 2, it can be concluded that the data on consumer-level rice price (CRP), BULOG’s market share (BMS), producer-level paddy price (PPP), international rice price (IRP), rice production (PROD), rice consumption (CONS), BULOG’s operational rice stock (STOCK), dummy highest retail price (DHRP), and dummy continuous market operation (DCMO) are stationary at level, but all variables are not stationary on first difference because the probability value of unit root test on first difference < 0.05, so the data are eligible to use ARDL analysis (Pesaran and Shin 2012).
The ARDL analysis results in Table 3 show that the R-squared model is 99.49%, with the F-test showing a Prob value of 0.0000 < 0.05 so that together the research variables are proven to significantly affect the consumer-level rice price (CRP).
The t-test to examine the effect of the variable on the consumer-level rice price (CRP) shows that the influential variables with the coefficient signs following the hypothesis are the consumer-level rice price (CRP) itself at lags 1, 2, and 3; BULOG’s market share (BMS) at lag 0; producer-level paddy price (PPP) at lags 0 and 1; rice production (PROD) at lag 1; rice consumption (CONS) at lags 0 and 1; and BULOG stock at lags 0 and 1. While international rice price (IRP) does not affect consumer-level rice prices, the highest retail price (DHRP) policy has no effect on the formation of consumer-level rice prices (compared with when there is no highest retail price policy). Likewise, the continuous market operation (DCMO) policy has no effect on the formation of consumer-level rice prices (compared with the non-continuous market operation policy). The ARDL model formed is ARDL (3, 1, 2, 0, 1, 1, 1) according to the optimal lag selected on the basis of the Akaike Information Criteria in Figure 6.
Furthermore, the Cointegration Test is conducted to see if there is a long-term relationship between research variables using the Bound Test. On the basis of the test results in Table 4, it is concluded that there is a long-term relationship between research variables because the value of the obtained F statistic (7.8811) is greater than the upper bound.
Furthermore, the results of the analysis of the long-term effect in Table 5 show that the independent variables that affect the consumer-level rice prices (CRP) in the long run are BULOG’s market share (BMS), producer-level paddy price (PPP), and rice consumption (CONS), while the variables of international rice prices (IRP), rice production (PROD), BULOG’s operational stock (STOCK), continuous market operation (compared with the non-continuous market operation policy), and highest retail price (compared with when there is no highest retail price policy), have no effect on consumer-level rice prices in the long-term.
The results of the Breusch–Godfrey Autocorrelation Test in Table 6 show that the Prob.F value is 0.7064 > 0.05, which means that the H0 hypothesis test is accepted; thus, there is no autocorrelation among research variables.
The results of the ARCH Heteroscedasticity Test in Table 7 show that the Prob.F value is 0.1397 > 0.05, which means that the H0 hypothesis test indicates that there is no heteroscedasticity among research variables.
The Ramsey RESET Stability Test results in Table 8 show that the Prob t-Statistic value is 0.1390 > 0.05 and the Prob F-statistic value is 0.1390 > 0.05, which means that the hypothesis test H0 is accepted, namely that the model formed is stable to be used.
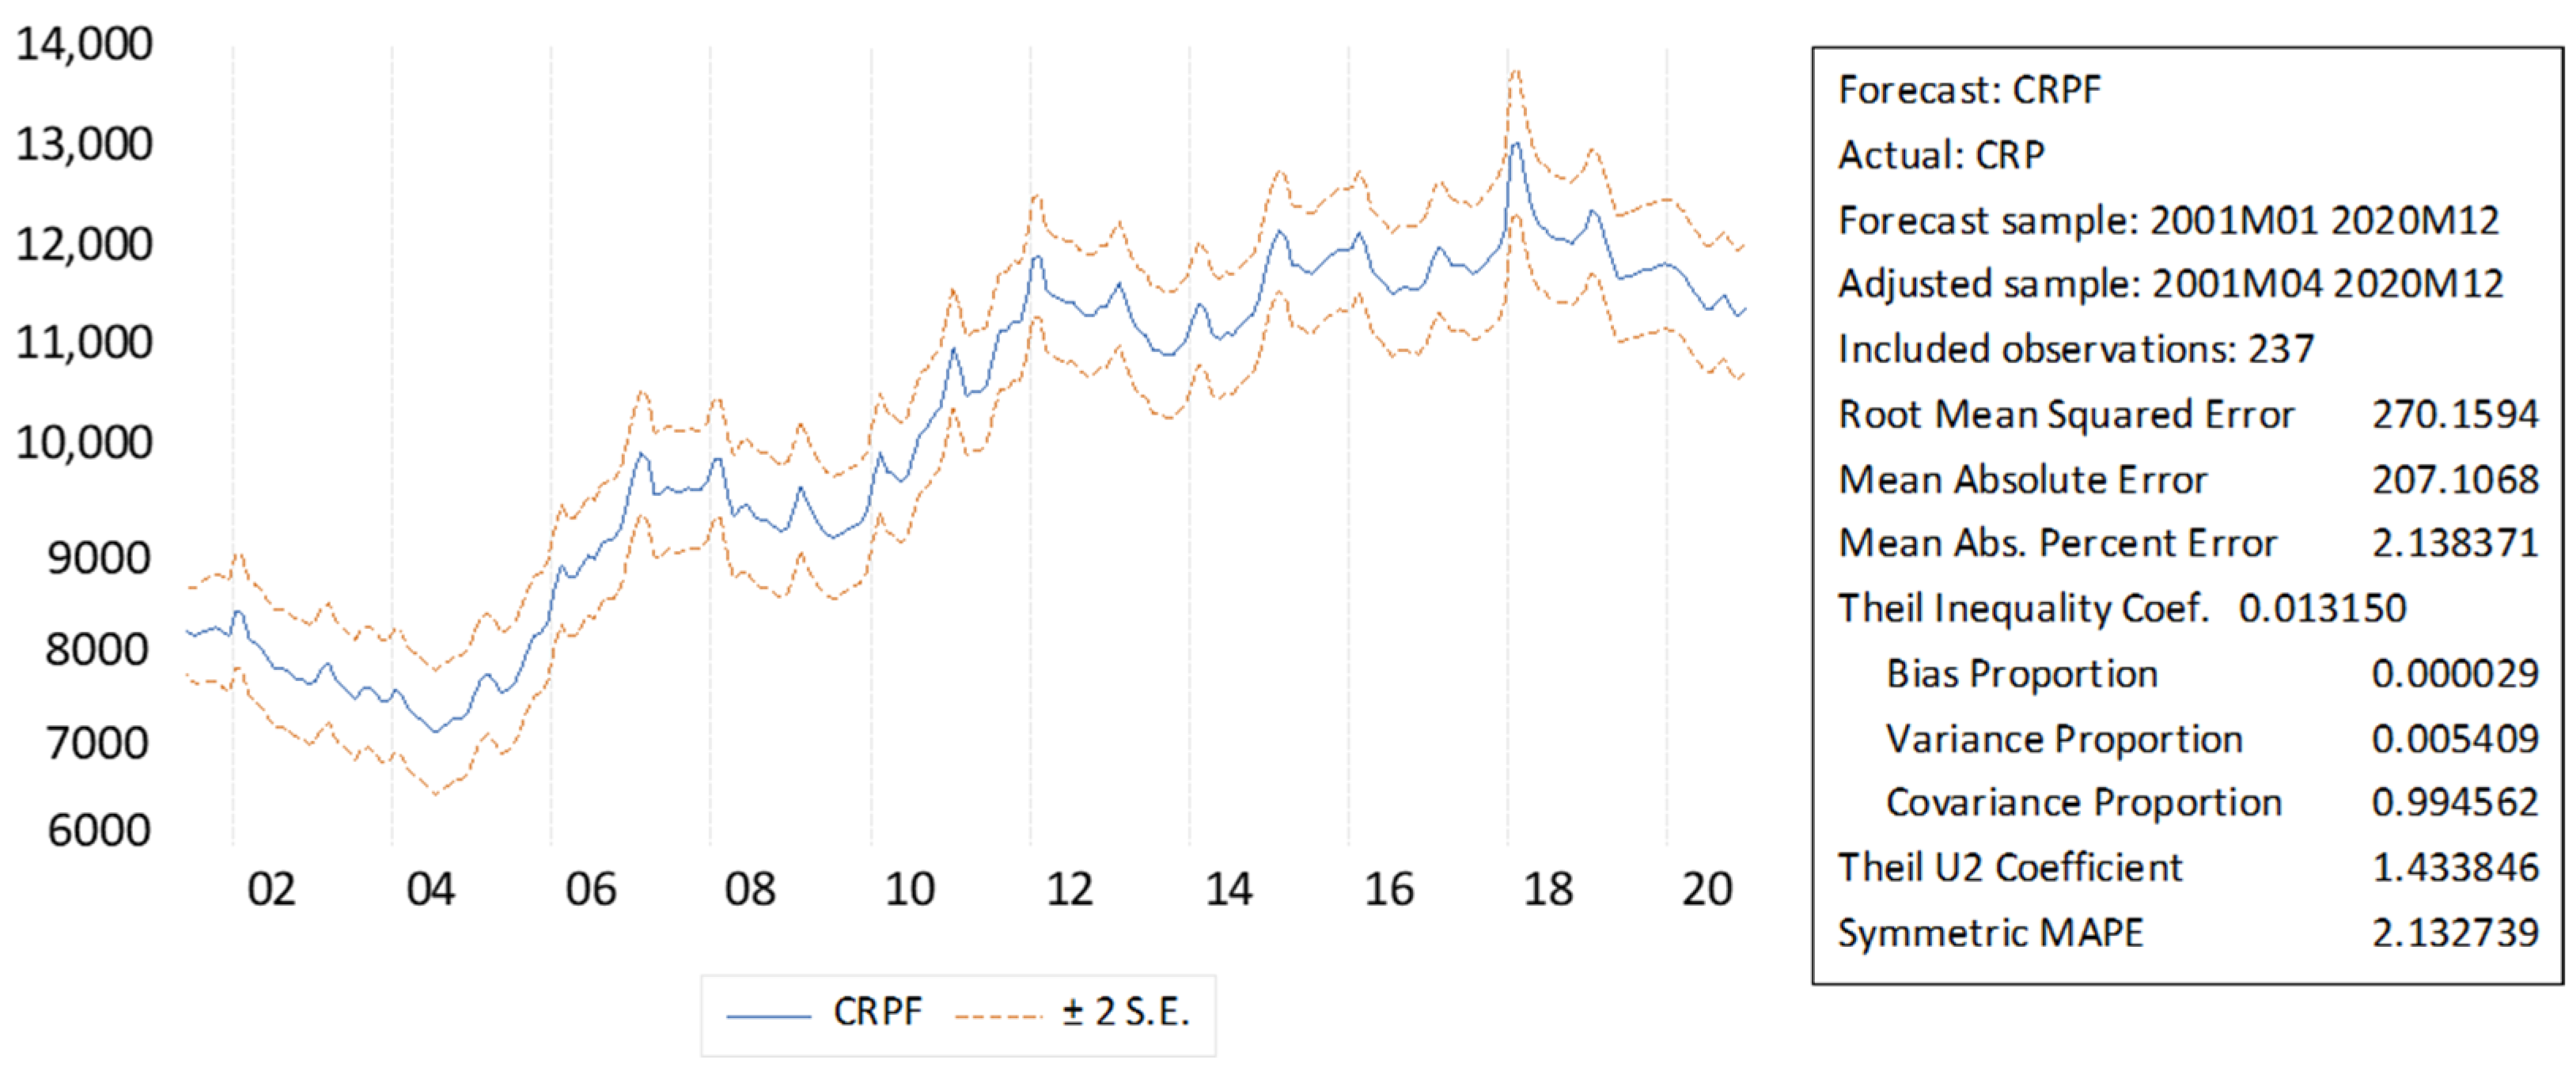
The results of the calculation of Mean Square Error (MSE), Mean Absolute Error (MAE), and Mean Absolute Percentage Error (MAPE) to examine the level of deviation of the forecast results in the model are shown in Figure 7. The value of MSE = 270.15; MAE = 207.11; and MAPE = 2.14%. Because the MAPE value is less than 10%, the forecasting model category is very good.
On the basis of the analysis results, it is shown that the consumer-level rice price is influenced by the consumer-level rice price itself until the third time lag or the price of the previous three months. This result is in accordance with research from Marjuki (2009). The consumer-level rice price is also influenced by the amount of rice production and has a negative coefficient sign, meaning that the greater the production, the more the price will tend to fall. The same conclusion is reached by Setiawati et al. (2018), who analyzed the effect of production on rice prices along with the rupiah exchange rate variable.
The consumer-level rice price is also influenced by the amount of rice consumption and has a positive coefficient sign, meaning that the greater the consumption, the higher the price. On the contrary causality, according to Bashir and Yuliana (2019), the price of rice also affects rice consumption, along with the variables of labour, wages, wetland, and urban population.
BULOG’s operational stock, which consists of government rice reserves (CBP) and commercial stocks, proved to have an effect in the same month and one month earlier on the formation of consumer-level rice prices and has a negative coefficient sign, meaning that the larger the stock controlled by BULOG, the lower the price. This confirms that the market still sees BULOG’s control of the rice stock as a sign of the market’s balance of supply and demand (2019). The larger the BULOG’s operational rice stock, the larger the excess supply in the market. The BULOG’s operational rice stock is also considered a measure of the government’s ability to intervene in the market, although in the long term, data analysis shows that BULOG’s operational rice stock does not affect consumer-level rice prices. Based on other research, such as that conducted by Setyoaji et al. (2014) on data in the East Java region, which is the largest rice-producing region in Indonesia, the impact of BULOG’s rice stock on rice prices is significant in both the short and long term.
The analysis results show that international rice prices do not affect consumer-level rice prices in Indonesia, both in the short and long term. Although Indonesia still imports rice from other countries several times, there are several reasons why international rice prices do not have a significant effect. First, rice import and export permits are only granted to BULOG and cannot be carried out freely by private companies, except for special rice such as aromatic rice, diabetics rice, etc. Second, imported rice is stored in BULOG warehouses as a buffer for the national stock and is issued only for certain special purposes so that the purchase price of imported rice does not directly affect the equilibrium of rice prices in the Indonesian market. Additionally, the third reason is that Indonesia is a country that received an award for self-sufficiency in rice from the International Rice Research Institute (IRRI) several times, so most of the public’s consumption can be met through domestic production.
On the basis of the data from the last 20 years, it can be seen that rice imports in Indonesia in 2011 were as much as 2.2 million metric tons, or approximately 5.4% of the national rice demand. Meanwhile, in other years, the average import of rice was just under 100,000 metric tons (less than 0.25% of consumption needs). The imported rice is stored in BULOG warehouses throughout Indonesia as a national food reserve and released gradually up to 2–3 years later through food assistance programs and market operations so that it does not directly affect rice supply in the domestic market. From 2019 until now, Indonesia has never again imported medium-quality rice from abroad and can meet its needs from domestic production. Even during the COVID-19 pandemic in 2020, rice production in Indonesia was quite high, and there were no significant supply and demand shocks.
According to the research of Sugiyanto and Hadiwigeno (2012), the international rice market is integrated with the Indonesian rice market, which means that changes in rice prices abroad still affect rice prices in Indonesia. However, the effect of international rice prices is not significant when compared with the larger influence of other variables in this study. There is no significant difference between before and after the implementation of the highest retail price (HET) policy on the consumer-level of rice prices. However, according to Fatimah (2018), the highest retail price policy positively affects farmers’ exchange rates. Likewise, there is no significant difference in influence between the continuous market operation policy and the market operation model that was carried out previously. In many previous studies, the BULOG market operation program has had a significant effect on rice prices and inflation in Indonesia (Proborini et al. 2018; Rahmasuciana et al. 2016; Resnia and Wirastuti 2009; Sulandari 2008).
BULOG’s market share has been shown to have a negative effect on consumer-level rice prices in the same month and has a negative effect on consumer-level rice prices in the long run. This shows that BULOG’s operational activities, which are business and public assignments, have a negative effect on consumer-level rice prices, meaning that the larger BULOG’s market share, the more prices will tend to fall.
BULOG’s market share in this study is calculated from BULOG’s business volume, which consists of commercial sales and the realization of distribution of public assignments divided by the number of rice consumed. Distribution of public assignments consists of the realization of continuous market operation, distribution of food aid, and other government programs, whose sales prices contain government subsidies so that they are cheaper than market prices. Meanwhile, BULOG commercial rice is sold for a maximum price of the highest retail price (HET) set by the government.
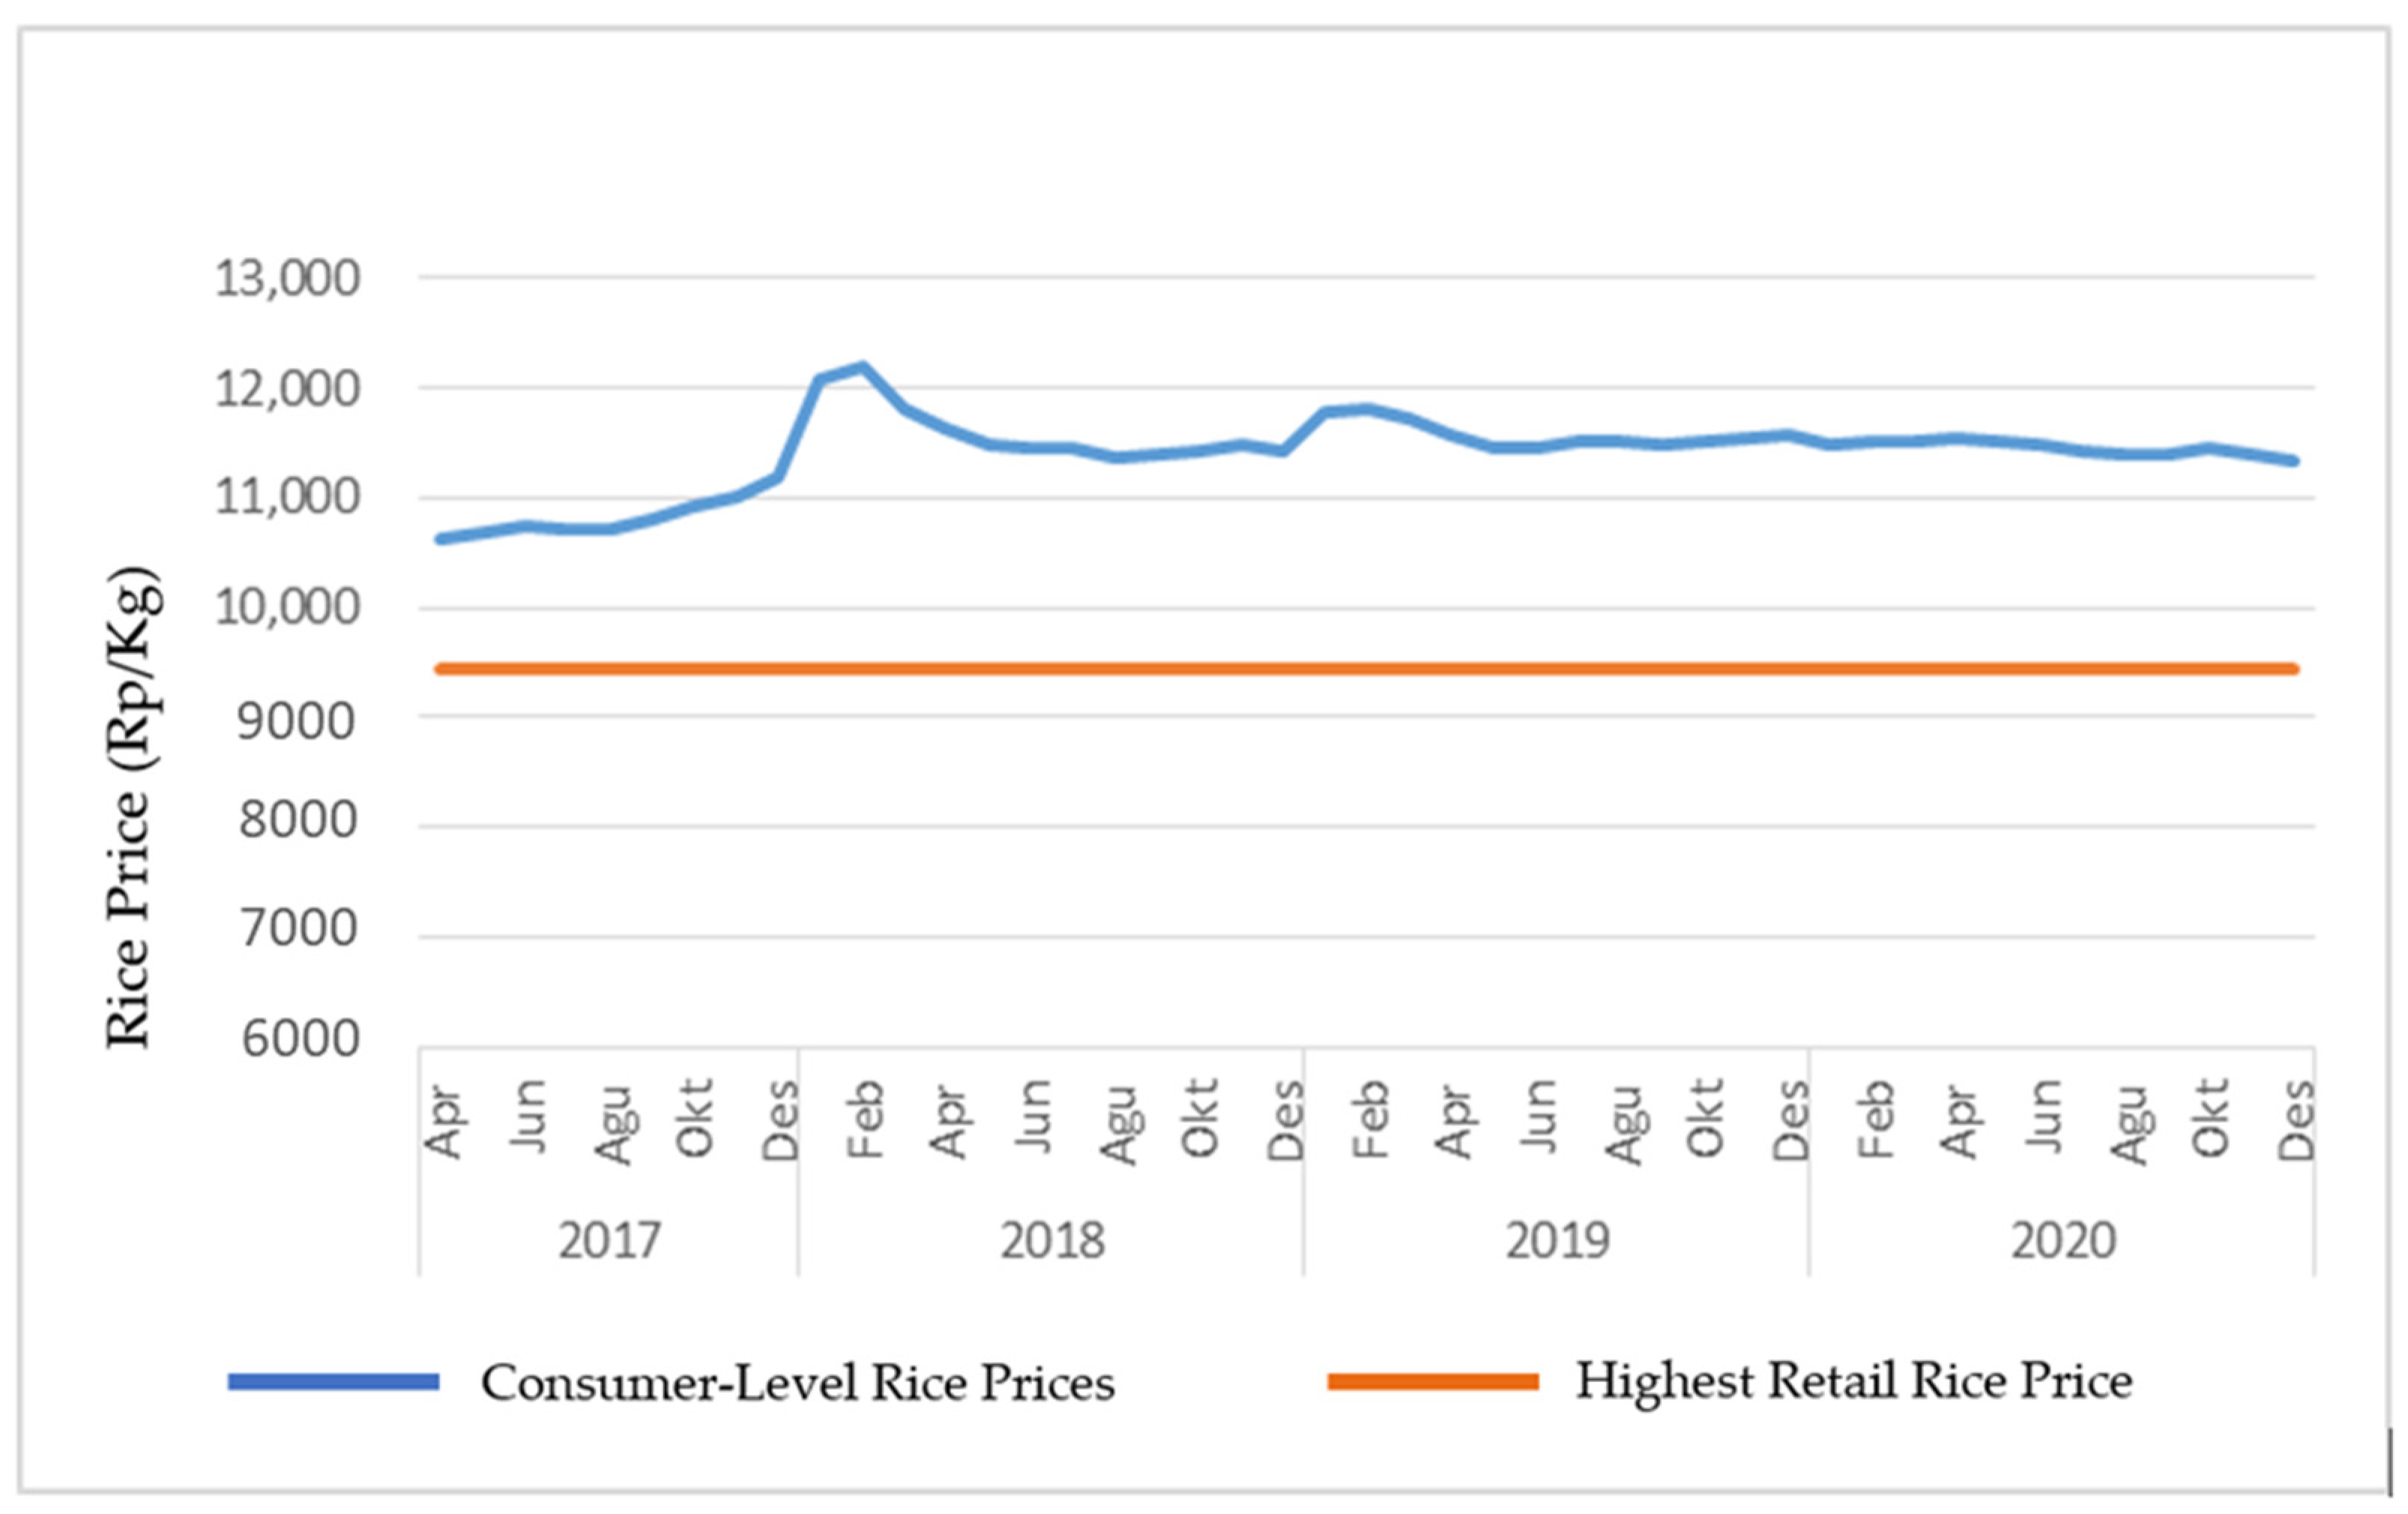
This is predicted to be the cause of the negative influence of the BULOG market share variable on consumer rice prices (the bigger the market share, the lower the rice price). This is relevant because, according to the data in Figure 8, the average consumer price of rice in Indonesia is still above the highest retail price, so large market penetration by BULOG at a price below or equal to highest retail price will be able to lower prices.
Based on this, it seems that efforts to control prices by increasing market share and making BUMN the market leader of the national strategic industry are relevant to be carried out as a complement to the price stabilization policy model through a stock management approach. The government can encourage BULOG to increase its market share by being more involved in the commercial rice industry so that at a certain point, with an adequate market share, BULOG can become the market leader. A business entity can be a price maker and influence and direct the market with its position as a market leader (Kotler and Armstrong 2013).

4.2. Combination of Price Stabilization Policy

Stock management through a public policy approach still needs to be maintained following the mandate of the Indonesian Food Law. Given that Indonesia has the form of an archipelagic country and a high variation of nutrients, food production can only be carried out well in some areas, such as the islands of Java and NTB, as well as some areas on the islands of Sulawesi and Sumatra. The pattern of rice harvests, which are concentrated in certain months, and the limited storage infrastructure and capital strength of private business actors making efforts to maintain food availability over time, cannot be left entirely to the market mechanism. The government also needs to mitigate the risk of natural and non-natural disasters, as well as other important and urgent needs. Based on this, food policy in the form of stock management—keeping a certain number of stocks by the government, along with its derivative programs—is still very much needed (Jamaludin 2022; Saragih 2016; Utomo 2020).
However, according to Timmer (2014), this stock management policy model requires a large budget and is often inefficient. Market operation policies as part of stock management are often considered less effective and distort the market. The results of research by Firdaus et al. (2019), Aryani (2021) concluded that market operation policies have a significant but not impactful effect because the coefficient of the analysis result does not follow the expected sign, whereas the coefficient of the analysis results shows a positive value, which means that the greater the market operation, the higher the price.
Government-purchasing price management policies often cannot be implemented properly because government purchasing prices are often lower than market prices, so BULOG cannot absorb farmers’ rice harvests, lacks stock, and would be ultimately forced to import. Thus, there is an assumption that BULOG has “lost competition” with private rice traders (Arifin 2020). BULOG’s ability to manage rice stocks can influence market psychology and the actions of market traders.
Therefore, as a complement to the stock management through a public policy approach model and its derivative programs that still exist with all their current limitations, the government can facilitate and encourage BULOG to take a bigger share of the food industry market as a national strategic industry. This is following the constitution, which mandates state control in the national strategic sector, and is in accordance with the government’s mandate that BULOG is able to develop its role in the food industry, especially rice, to realize the ideals of national food security, including the realization of a stable rice market.
BULOG as a business entity in the food sector, can be facilitated and encouraged to continue to develop its business programs such as cultivation/on-farm, revitalizing rice processing infrastructure, modernizing storage warehouses, increasing transportation modes for distribution efficiency, developing retail networks, and implementing information technology on the basis of enterprise resource planning (ERP). With efficient industrial practices, SOEs can realize economies of scale and deliver quality products at competitive prices.
BULOG as a state-owned business entity, with its goodwill, can balance and prevent the speculative behaviour of market traders so that they can provide a fair price in the market. The strategy of branding and downstream agricultural products can increase added value, thereby increasing farmers’ standard of living. BULOG can foster agricultural corporatization, create rice estates/industrial-scale rice cultivation, foster farmers and farmer cooperatives on a business basis to maintain productivity and production quality, build product differentiation and value, produce quality rice for various market segments, and provide other value-added programs so that farmers get better economic benefits.
BULOG can encourage data digitization programs at the supply chain nodes of the rice industry, from cultivation, processing, storage, and distribution to retail trade (Alfazah et al. 2019), so that in the future, rice stock data as a food policy consideration will no longer be limited to stocks owned by BULOG but also applies to all public stocks recorded in the system at all supply chain nodes controlled by BULOG.
Market intervention activities in the future will be much easier without opening an outlet in the market, which often brings crowds and is unsafe. Market operations can be carried out by changing the price tag in the point of sale (POS) system of BULOG retailers by including subsidies provided by the government in the form of discounts. This model is much more transparent and can be accounted for because it already uses an integrated IT system.
SOEs can also become the foundation of the state to access sources of food availability abroad, increase export opportunities, invest in cultivation with high-tech processing abroad, as well as other forms of control of global assets for the benefit of the state. SOEs can also offset the expansion of foreign business entities, which are currently very aggressive in financing business sectors in the food sector, by taking over shares of Indonesian food start-up companies.

5. Conclusions

Rice price stabilization in Indonesia is carried out by stock management through a public policy approach with the main programs in the form of a floor price policy, ceiling price policy, domestic and foreign rice procurement policy, market operation policy, government rice reserve policy, routine distribution policy for revolving stock, and stock disposal policy. However, although not openly acknowledged, Indonesia has adopted the concept of liberalism with a controlled open market policy, which was marked by a change in the status of BULOG as a state-owned enterprise (SOE). As an SOE, BULOG performs government rice reserve management operations and is directly involved in the rice industry as a market player.
Based on the analysis, it can be seen that BULOG’s market share has an effect on consumer-level rice prices in Indonesia and has a negative coefficient sign, which means that the larger BULOG’s market share, the lower the price of rice. The effect of BULOG’s market share on consumer-level rice prices also occurs in the long term. Other variables that affect consumer-level rice prices are the price of rice itself at the previous time lag, the producer-level paddy price, rice production, rice consumption, and BULOG’s operational rice stock. Meanwhile, international rice prices have no effect on consumer-level rice prices. The highest retail price policy has no effect on the formation of consumer-level rice prices (compared with when there was no highest retail price policy); in addition, the continuous market operation policy has no effect on the formation of consumer-level rice prices (compared with the non-continuous market operation policy).
On the basis of this, in order to realize rice price stabilization, the government can complement public stock management policies with market-approach-based policies. The government can facilitate and encourage food SOEs to increase their market share so that at a certain point, with adequate market share, food SOEs can become price determinants to influence and direct the market.
In the future, it is necessary to develop a competitive advantage for food SOEs to become market leaders in the rice industry so that the role of the government can be more optimal and proactive, not only by providing stabilization after price fluctuations but also by creating a stable market.

Author Contributions

Methodology, T.R., T.B., B.A. and I.F.; Validation, T.B., B.A. and I.F.; Formal analysis, T.R.; Resources, T.R. and T.B.; Data curation, T.R.; Writing—original draft, T.R.; Writing—review & editing, T.B., B.A. and I.F.; Visualization, T.B., B.A. and I.F.; Supervision, T.B., B.A. and I.F. All authors have read and agreed to the published version of the manuscript.

Funding

This research received no external funding.

Institutional Review Board Statement

Not applicable.

Informed Consent Statement

Not applicable.

Data Availability Statement

Data is available upon request.

Conflicts of Interest

The authors declare no conflict of interest.

References

  1. Abdallah, Marwa Ben, Maria Fekete-Farkas, and Zoltan Lakner. 2021. Exploring the Link Between Food Security and Food Price Dynamics: A Bibliometric Analysis. Agriculture 11: 263. [Google Scholar] [CrossRef]
  2. Alfazah, Detha Aulia, Ari Yanuar Ridwan, Femi Yulianti, and Putu Giri Artha Kusuma. 2019. Designing Procurement Process Monitoring Dashboard for Supporting Food Security Supply Chain Risk Management System in Indonesian Bureau of Logistics. Paper Presented at the TSSA 2019—13th International Conference on Telecommunication Systems, Services, and Applications, South Kuta, Bali, October 3–4; pp. 255–60. [Google Scholar] [CrossRef]
  3. Arezki, Rabah, and Markus Bruckner. 2011. Food Prices and Political Instability. IMF Working Papers. Washington, DC: International Monetary Fund, vol. 11. [Google Scholar] [CrossRef] [Green Version]
  4. Arifin, Bustanul. 2020. Ekonomi Beras Kontemporer. Jakarta: Gramedia Pustaka Utama. [Google Scholar]
  5. Arifin, Bustanul, Noer Azam Achsani, Drajat Martianto, Linda Karlina Sari, and Ahmad Heri Firdaus. 2019. The Future of Indonesian Food Consumption. Jurnal Ekonomi Indonesia 8: 71–102. [Google Scholar] [CrossRef]
  6. Aryani, Desi. 2021. Instrumen Pengendalian Harga Beras Di Indonesia: Waktu Efektif Yang Dibutuhkan. Pangan 30: 75–86. [Google Scholar] [CrossRef]
  7. Bashir, Abdul, and Saadah Yuliana. 2019. Identifying Factors Influencing Rice Production and Consumption in Indonesia. Jurnal Ekonomi Pembangunan: Kajian Masalah Ekonomi Dan Pembangunan 19: 172–85. [Google Scholar] [CrossRef]
  8. Bremmer, Ian. 2010. The End of the Free Market: Who Wins the War between States and Corporations? European View 9. Brentford: Portfolio Books Ltd. [Google Scholar] [CrossRef]
  9. Dabukke, Frans B. M. 2000. Dampak Kebijakan Makroekonomi Terhadap Kinerja Pasar Komoditas Pangan Utama Indonesia. Ph.D. thesis, Institut Pertanian Bogor, Bogor Regency, Indonesia. [Google Scholar]
  10. Dev, Mahendra, and Funing Zhong. 2015. Trade and Stock Management to Achieve National Food Security in India and China. China Agricultural Economic Review 7: 641–54. [Google Scholar] [CrossRef]
  11. Dwijowijoto, Riant Nugroho. 2021. Korporasi Konstitusional: Sejarah Dan Masa Depan BUMN Indonesia. Balai Pustaka (PN). Available online: https://books.google.com/books/about/Korporasi_konstitusional.html?hl=id&id=uK5wzgEACAAJ (accessed on 19 September 2022).
  12. Engle, Robert F., and Clive W. J. Granger. 2015. Co-Integration and Error Correction: Representation, Estimation, and Testing. Applied Econometrics 39: 107–35. [Google Scholar] [CrossRef]
  13. Fatimah, Atika. 2018. Analisis Pengaruh Kebijakan Perberasan Terhadap Kesejahteraan Petani Di Indonesia. Available online: http://publikasiilmiah.ums.ac.id/handle/11617/9983 (accessed on 19 September 2022).
  14. Firdaus, Muhammad, Lukman M Baga, and Purdiyanti Pratiwi. 2019. Swasembada Beras Dari Masa Ke Masa. Bogor: PT Penerbit IPB Press. [Google Scholar]
  15. Gafar, Sapuan. 2008. Quo Vadis Manajemen Kebutuhan Pokok? Jurnal Pangan 17: 33–41. [Google Scholar] [CrossRef]
  16. Girik Allo, Albertus, Elan Satriawan, and Lincolin Arsyad. 2018. The Impact of Rising Food Prices on Farmers’ Welfare in Indonesia. Journal of Indonesian Economy and Business 33: 193–215. [Google Scholar] [CrossRef] [Green Version]
  17. Gujarati, Damodar N., and Dawn C. Porter. 2006. Essentials of Econometrics. New York: McGraw-Hill Education. [Google Scholar]
  18. Hermawan, Wawan, Fitrawaty Fitrawaty, and Indra Maipita. 2017. Factors Affecting the Domestic Price of Rice in Indonesia. JEJAK 10: 155–71. [Google Scholar] [CrossRef]
  19. Jamaludin, Maun. 2022. Indonesia’s Food Security Challenges: How Food SOE Optimizes Its Role? Research Horizon 2: 394–401. [Google Scholar] [CrossRef]
  20. Johnson, D. Gale. 1984. Food Policy Analysis: By C. Peter Timmer, Walter D. Falcon and Scott R. Pearson World Bank/Johns Hopkins University Press, Baltimore, MD, 1983, 301 pp, $12.95. Food Policy 9: 264–5. [Google Scholar] [CrossRef]
  21. Kaletsky, Anatole. 2010. Capitalism 4.0. OECD Observer, No. 279. Available online: http://digamo.free.fr/kaletsky10.pdf (accessed on 19 September 2022).
  22. Kotler, Philip, and Gary Armstrong. 2013. Principles of Marketing. State College: Prentice Hall, Pennsylvania State University. [Google Scholar]
  23. Lagi, Marco, Karla Z. Bertrand, and Yaneer Bar-Yam. 2011. The Food Crises and Political Instability in North Africa and the Middle East. arXiv arXiv:1108.2455. [Google Scholar] [CrossRef] [Green Version]
  24. Marjuki, Fajar Andi. 2009. Analisis Faktor-Faktor Yang Mempengaruhi Harga Beras Di Indonesia Tahun 1981–2006. Available online: http://files.eprints.ums.ac.id/etd/2009/B300/B300010040.pdf (accessed on 19 September 2022).
  25. Naughton, Barry. 2008. A Political Economy of China’s Economic Transition. China’s Great Economic Transformation 10: 91–135. Available online: http://www.danangtimes.vn/Portals/0/Docs/2179423-China’s_Great_Economic_Transformation.pdf#page=115 (accessed on 19 September 2022).
  26. Patunru, Arianto A., and Assyifa Szami Ilman. 2019. Ekonomi Politik Kebijakan Beras Di Indonesia PerspektifMasyarakat Ekonomi ASEAN. South Jakarta: Center for Indonesian Policy Studies. [Google Scholar]
  27. Persaud, Suresh, and Stacey Rosen. 2003. India’s Consumer and Producer Price Policies: Implications for Food Security. Ers.Usda.Gov. Available online: https://www.ers.usda.gov/webdocs/outlooks/37116/31036_gfa14-i_002.pdf?v=377.4 (accessed on 19 September 2022).
  28. Pesaran, M. Hashem, and Bahram Pesaran. 1997. Working with Microfit 4.0: An Introduction to Econometrics. Oxford: Oxford University Press. [Google Scholar]
  29. Pesaran, M. Hashem, and Yongcheol Shin. 2012. An Autoregressive Distributed-Lag Modelling Approach to Cointegration Analysis. In Econometrics and Economic Theory in the 20th Century. Cambridge: Cambridge University Press. [Google Scholar] [CrossRef] [Green Version]
  30. Pesaran, M. Hashem, Yongcheol Shin, and Richard J. Smith. 2001. Bounds Testing Approaches to the Analysis of Level Relationships. Journal of Applied Econometrics 16: 289–326. [Google Scholar] [CrossRef]
  31. Proborini, Anita, Titik Ekowati, and Djoko Sumarjono. 2018. Analisis Efektivitas Pelaksanaan Pasar Murah BULOG Dalam Menjaga Stabilitas Harga Bera s Di DKI Jakarta. BISE: Jurnal Pendidikan Bisnis Dan Ekonomi 4: 38–49. [Google Scholar] [CrossRef]
  32. Rahmasuciana, Dioni Yurinda, Dwidjono Hadi Mulyo, and Masyhuri Masy. 2016. Pengaruh Pengadaan Beras Dan Operasi Pasar Terhadap Harga Beras Dalam Negeri. Agro Ekonomi 26: 129–38. [Google Scholar] [CrossRef] [Green Version]
  33. Resnia, Ranni, and Astari Wirastuti. 2009. Kebijakan Stabilisasi Harga Beras. Buletin Ilmiah Litbang Perdagangan 3: 1–23. [Google Scholar] [CrossRef]
  34. Respatiadi, Hizkia, and Hana Nabila. 2018. Policy Options to Lower Rice Prices in Indonesia. Buletin Ilmiah Litbang Perdagangan 12: 95–116. [Google Scholar] [CrossRef] [Green Version]
  35. Robinson, Sherman, Moataz El-Said, Nu Nu San, With Achmad, Suryana Hermanto, Dewa Swastika, and Sjaiful Bahri. 1997. Rice Price Policies in Indonesia: A Computable General Equilibrium (CGE) Analysis. Washington, DC: International Food Policy Research Institute. [Google Scholar]
  36. Saptana, N. F. N., Erma Suryani, and Emmy Darmawati. 2019. Kinerja Rantai Pasok, Dinamika, Dan Pembentukan Harga Beras Di Jawa Tengah. Analisis Kebijakan Pertanian 17: 39. [Google Scholar] [CrossRef]
  37. Saragih, Juli Panglima. 2016. Kelembagaan Urusan Pangan Dari Masa Ke Masa Dan Kebijakan Ketahanan Pangan. Jurnal Ekonomi & Studi Pembangunan 26: 57–80. [Google Scholar] [CrossRef]
  38. Schweinberger, Albert. 2014. State Capitalism, Entrepreneurship, and Networks: China’s Rise to a Superpower. Journal of Economic Issues 48: 169–80. [Google Scholar] [CrossRef]
  39. Setiawati, Desi, Edmon Daris, and Dan Mudatsir Najamuddin. 2018. Analisis Faktor-Faktor Yang Mempengaruhi Pembentukan Harga Beras Di Indonesia. Jurnal Agribisnis 12: 1–10. [Google Scholar] [CrossRef] [Green Version]
  40. Setyoaji, Satria Bayu, Evita Soliha Hani, and Aryo Fajar Sunartomo. 2014. Faktor-Faktor Yang Mempengaruhi Fluktuasi Harga Beras IR-64. Available online: https://repository.unej.ac.id/xmlui/handle/123456789/69517 (accessed on 19 September 2022).
  41. Son, Hyun H., and Nanak Kakwani. 2009. Measuring the Impact of Price Changes on Poverty. Journal of Economic Inequality 7: 395–410. [Google Scholar] [CrossRef] [Green Version]
  42. Sugiyanto, Catur, and Soetatwo Hadiwigeno. 2012. Integrasi Pasar Beras Indonesia Dengan Pasar Beras Internasional. Jurnal Ekonomi Dan Kebijakan Pembangunan 1: 79–103. [Google Scholar] [CrossRef]
  43. Sulandari, Epi. 2008. Pengaruh Kebijakan Operasi Pasar Beras Terhadap Harga Beras Untuk Pengendalian Inflasi. Jke.Feb.Ui.Ac.Id. Available online: http://jke.feb.ui.ac.id/index.php/JKE/article/view/81 (accessed on 19 September 2022).
  44. Timmer, C. Peter. 2014. Food Security in Asia and the Pacific: The Rapidly Changing Role of Rice. Asia and the Pacific Policy Studies 1: 73–90. [Google Scholar] [CrossRef] [Green Version]
  45. Utomo, Bachtiar. 2020. Tantangan Dan Peran BULOG Di Era Industri 4.0. Jurnal Pangan 29: 71–86. [Google Scholar] [CrossRef]
Figure 1. Price equilibrium with a floor price policy.
Economies 10 00296 g001
Figure 2. Price equilibrium with a ceiling price policy.
Economies 10 00296 g002
Figure 3. Price Stabilization Policy Theory.
Economies 10 00296 g003
Figure 4. BULOG’s Market Share with Other Factors Affecting Consumer-Level Rice Prices Based on Previous Research.
Economies 10 00296 g004
Figure 5. Trends in the data of each research variables.
Economies 10 00296 g005aEconomies 10 00296 g005b
Figure 6. Akaike Information Criteria for Optimal Lag Selection.
Economies 10 00296 g006
Figure 7. Forecast Error Measurement.
Economies 10 00296 g007
Figure 8. Consumer-Level Rice Prices Compared with Highest Retail Rice Price.
Economies 10 00296 g008
Table 1. Research Variables.
Variable Unit AnalysisSource
Consumer-Level Rice PriceRp/KgIndonesian Central Statistics Agency
BULOG’s Market Share%BULOG and Indonesian Central Statistics Agency
Producer-Level Paddy PriceRp/KgIndonesian Central Statistics Agency
International Rice PriceRp/KgWorld Bank
Rice ProductionM/TIndonesian Central Statistics Agency
Rice ConsumptionM/TIndonesian Food Security Agency
BULOG’s Operational Rice StockM/TBULOG
Highest Retail Price Policy Rp/Kg Indonesian Ministry of Trade
Continuous Market Operation Policy MTBULOG
Table 2. Stationarity Test Results (Unit Root Test).
VariableProb-LevelProb-Diff1
CRP0.7270.000
BMS0.0000.000
PPP0.6930.001
IRP0.0020.000
PROD0.6460.000
CONS0.5540.000
STOCK0.0000.000
DHRP0.8920.000
DCMO0.9030.000
ADF—Fisher Chi-Square0.0000.000
Table 3. ARDL Analysis Results.
VariableCoefStd.Ert-StatProb.
CRP(−1)1.1240.06317.8990.000
CRP(−2)−0.4240.086−4.9390.000
CRP(−3)0.1720.0513.3840.000
BMS−15.3823.989−3.8560.000
BMS(−1)−6.3304.081−1.5510.122
PPP0.4990.0559.0510.000
PPP(−1)−0.4230.077−5.5200.000
PPP(−2)0.1070.0561.8860.061
IRP−0.0010.006−0.1650.869
PROD0.0000.0001.9640.051
PROD(−1)−0.0000.000−2.1110.036
CONS−0.0010.001−3.1980.002
CONS(−1)0.0010.0014.6990.000
STOCK−0.0010.000−2.9980.003
STOCK(−1)−0.0010.0002.3720.019
DHRP61.09852.4881.1640.246
DCMO87.62582.1581.0660.287
C225.71393.4712.7040.007
R-Squared 0.995
Adj. R-Sq 0.995
F-Statistic 2556.133
Prob 0.000
Selected Model ARDL (3, 1, 2, 0, 1, 1, 1)
Table 4. Cointegration Test Results—Bound Test.
Test StatisticValueK
F Statistic7.88113
Critical Value Bounds
Significance|0 Bound|1 Bound
10%2.123.23
5%2.453.61
2.5%2.753.99
1%3.154.43
Table 5. Long-Term Effect.
VariableCoefStd.Errt-StatProb.
BMS−170.18749.352−3.4480.0007
PPP1.4360.1977.3070.0000
IRP−0.0080.049−0.1670.8679
PROD−0.0000.000−0.0200.9837
CONS0.0010.0002.7260.0069
STOCK−0.0000.000−1.5320.1268
DHRP478.894397.6801.2040.2298
DCMO686.824591.7491.1610.2470
Table 6. Results of the Breusch–Godfrey. Autocorrelation Test.
F Statistics0.3481Prob. F(2, 217)0.7064
Obs R-Sq0.7581Prob. Chi-Sq(2)0.6845
Table 7. ARCH Heteroscedasticity Test Results.
F Statistics2.1959Prob. F(1, 234)0.1397
Obs R-Sq02.1941Prob. Chi-Sq(1)0.1385
Table 8. Stability Test Results—Ramsey RESET Test.
ValueDfProb.
t-Statistic1.48512180.1390
F-Statistic2.2054(1218)0.1390
Publisher’s Note: MDPI stays neutral with regard to jurisdictional claims in published maps and institutional affiliations.