
Fragmented Flying Geese (FFG) and Intra-Regional Agglomeration: Towards a Model Explaining Location Shifting of Japanese Multinational Corporations and the Electric Value Chains of ASEAN Economies


Abstract
1. Introduction
2. Background
3. Literature Review
3.1. Flying Geese Model and Its Variants
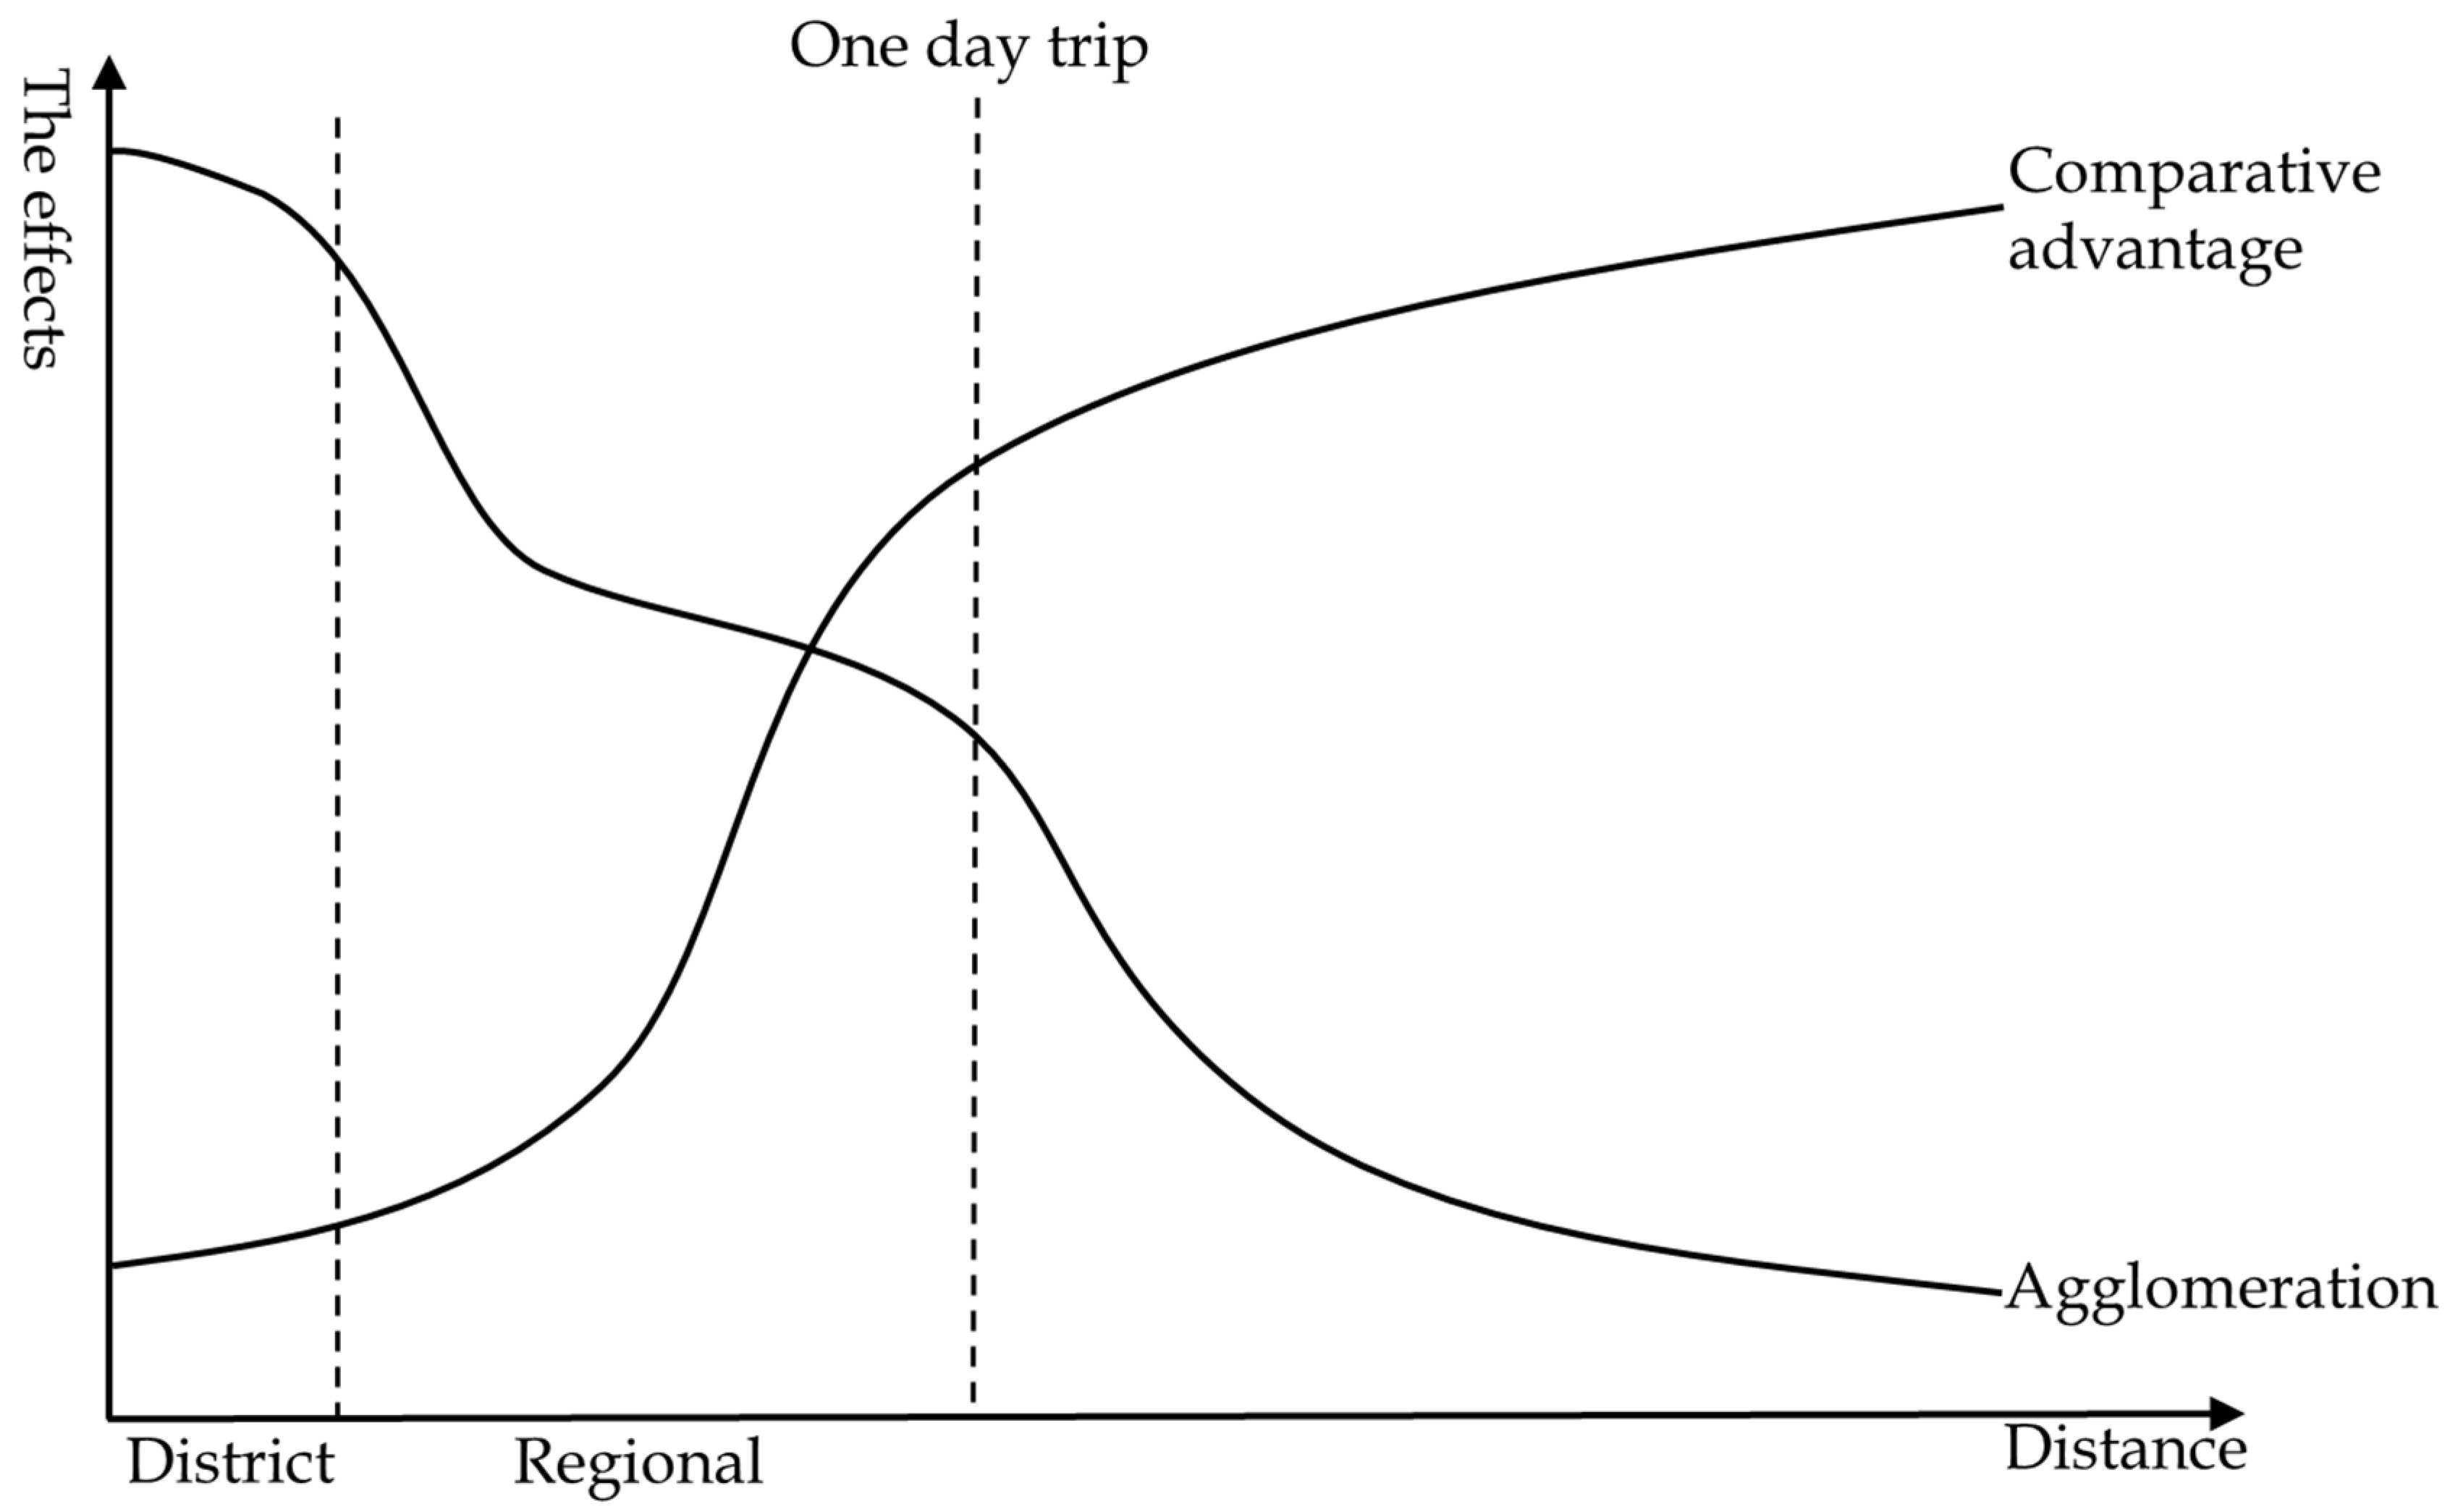
3.2. Spatial Economics
- (i).
- The formation of a spatial economic system with a core–periphery structure within a country and a regional economy, and the accompanying appearance of income inequality.
- (ii).
- The flying geese pattern of the location shifts of various industries within a country and between countries.
- (iii).
- Various types of industrial agglomerations and the formation of specialized cities8.
- (iv).
- The formation of urban systems with a hierarchical structure within a country.
- (v).
- Agglomerations of various specialized activities in an urban area.
3.3. FDI
3.4. GVC
4. Methodology
- Macro dataset from the Bank of Japan, “Direct investment assets”.
- Toyo Keizai, various issues, Kaigai Sinshutsu Kigyo Soran: Kuni Betsu Hen, (Overseas Japanese Affiliated Companies: by Country).
- Ministry of Economy, Trade, and Industry (METI) in Japan, various issues, the Survey of Overseas Business Activities of Japanese Companies.
- Trade Industry Database (2018) of The Research Institute of Economy, Trade, and Industry (RIETI-TID 2018) in Japan.
- Thailand industrial census in 2007 and 2012 from the (National Statistical Office of Thailand n.d.).
5. The Modified Model (FFG) with Intra-Regional Agglomeration
6. Empirical Evidence on Location Shifts of Japanese MNCs in the Electrical Industry
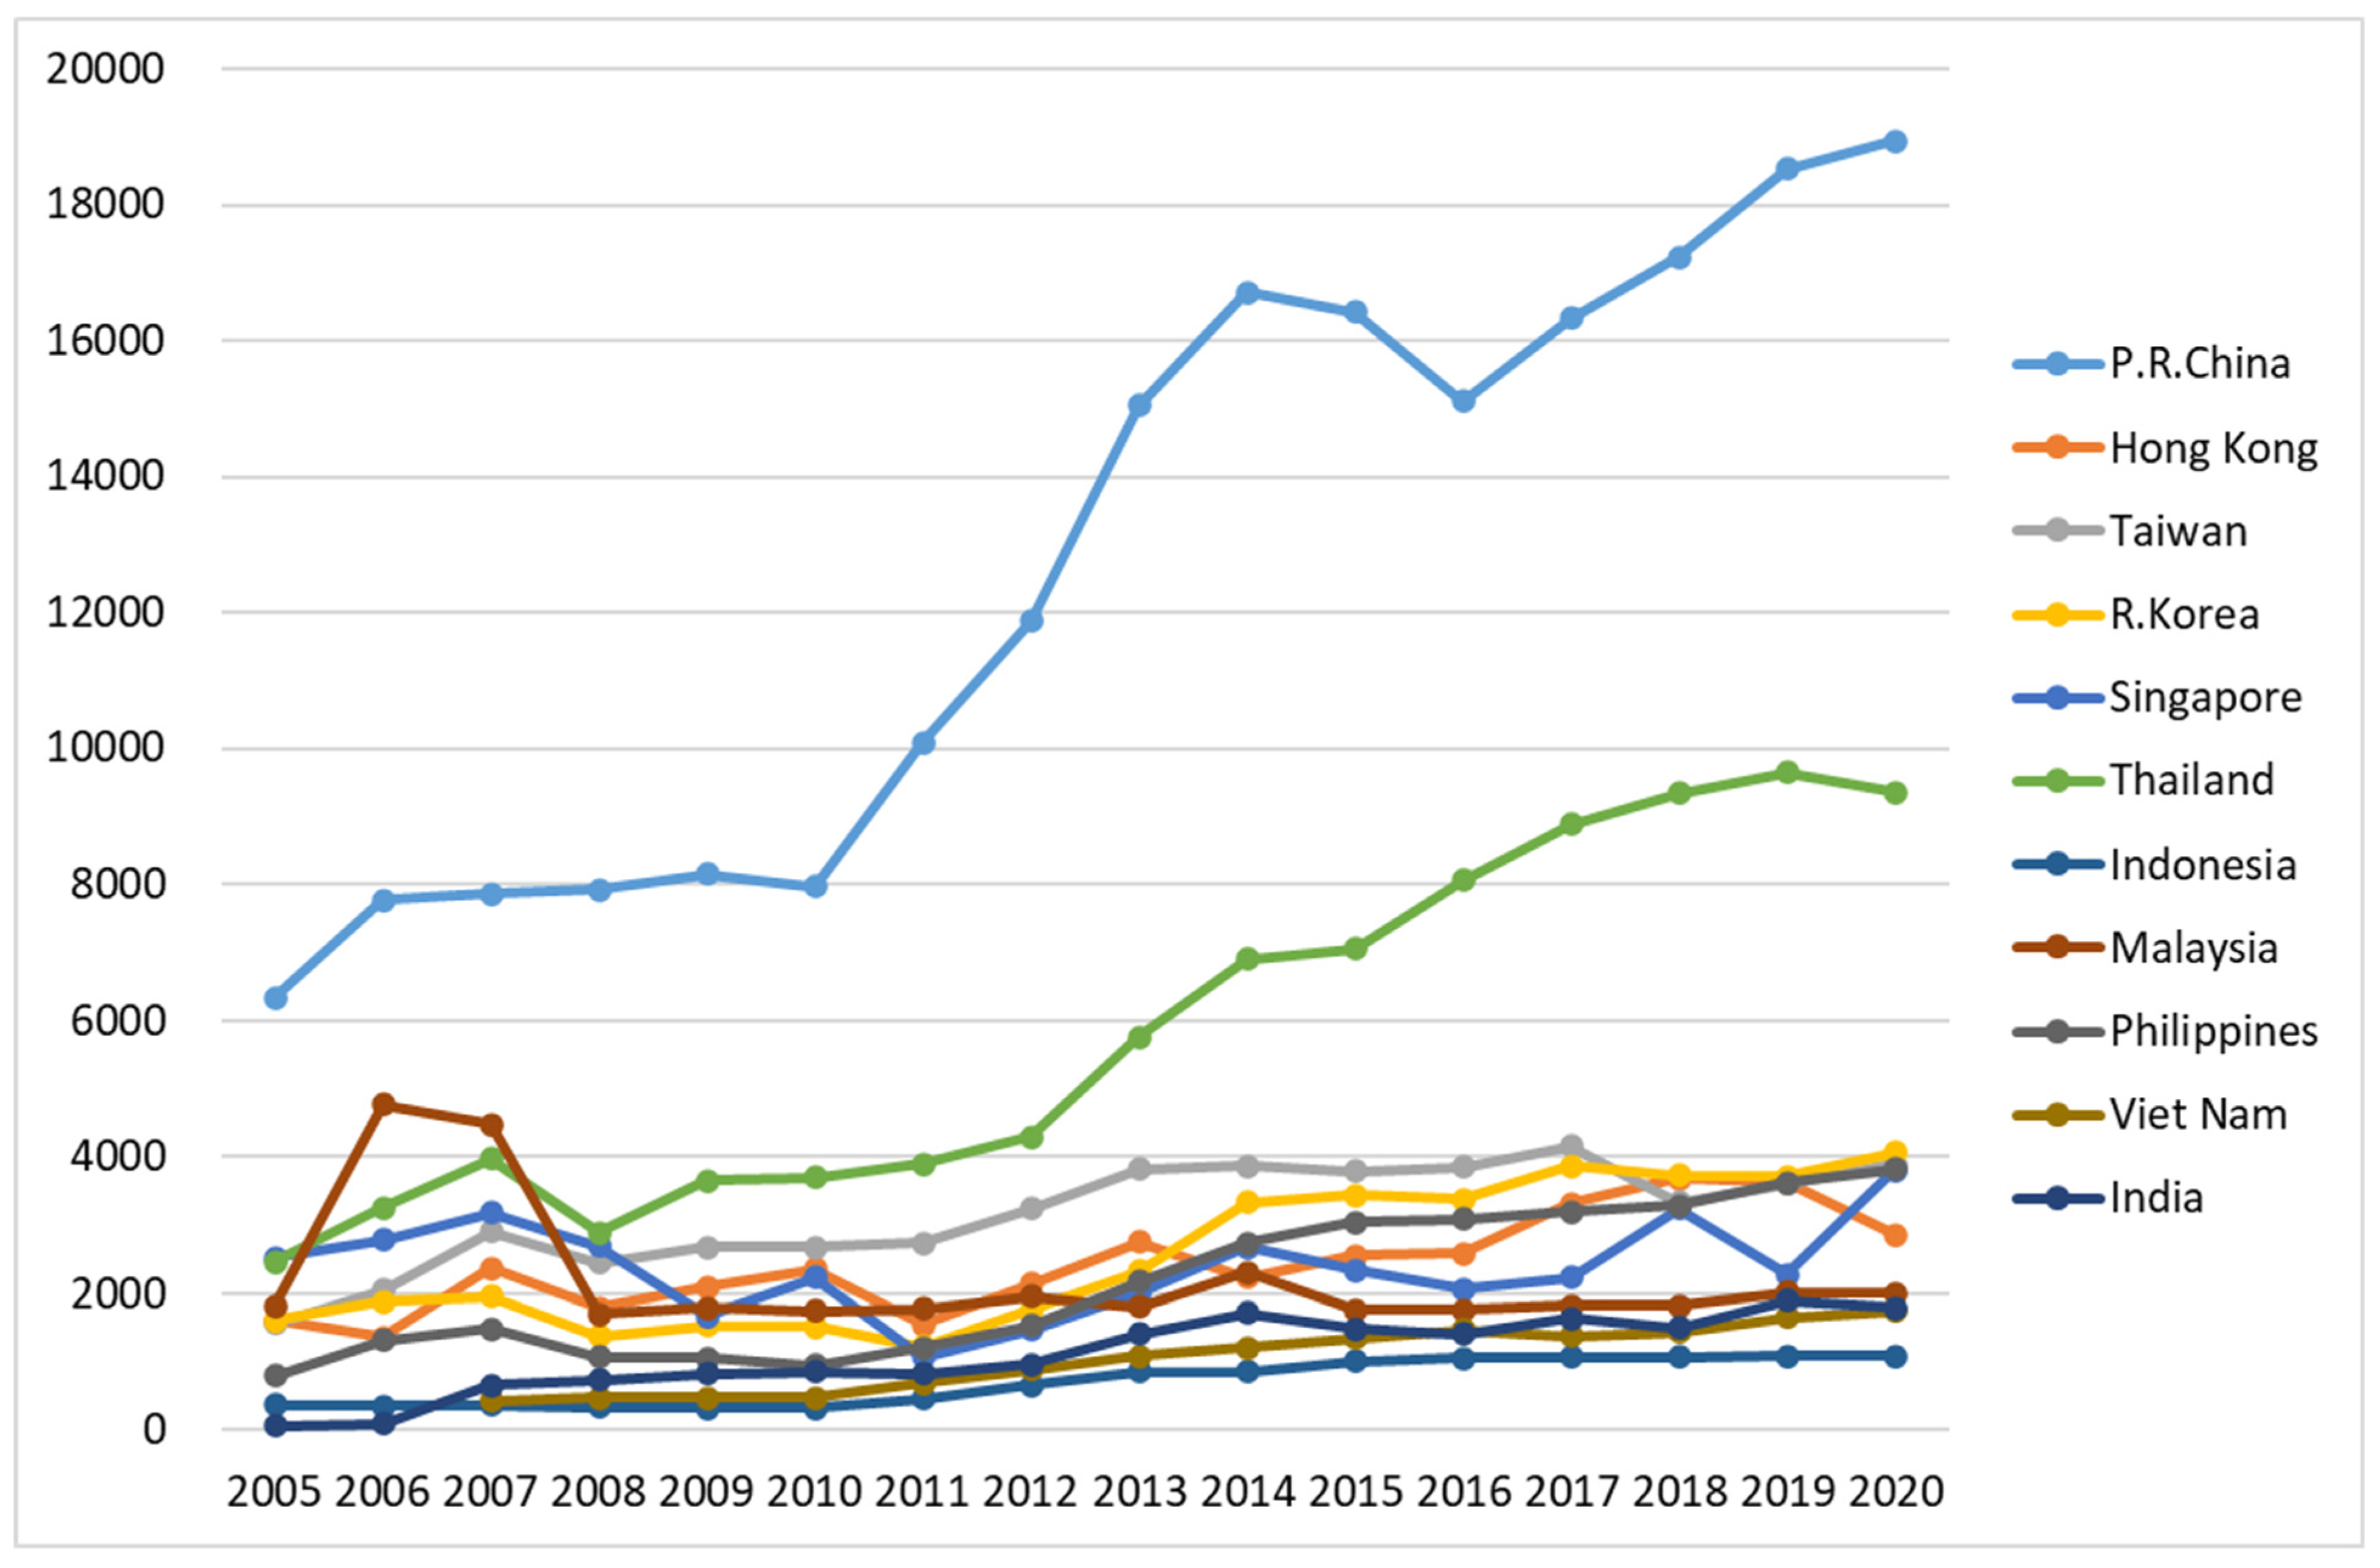
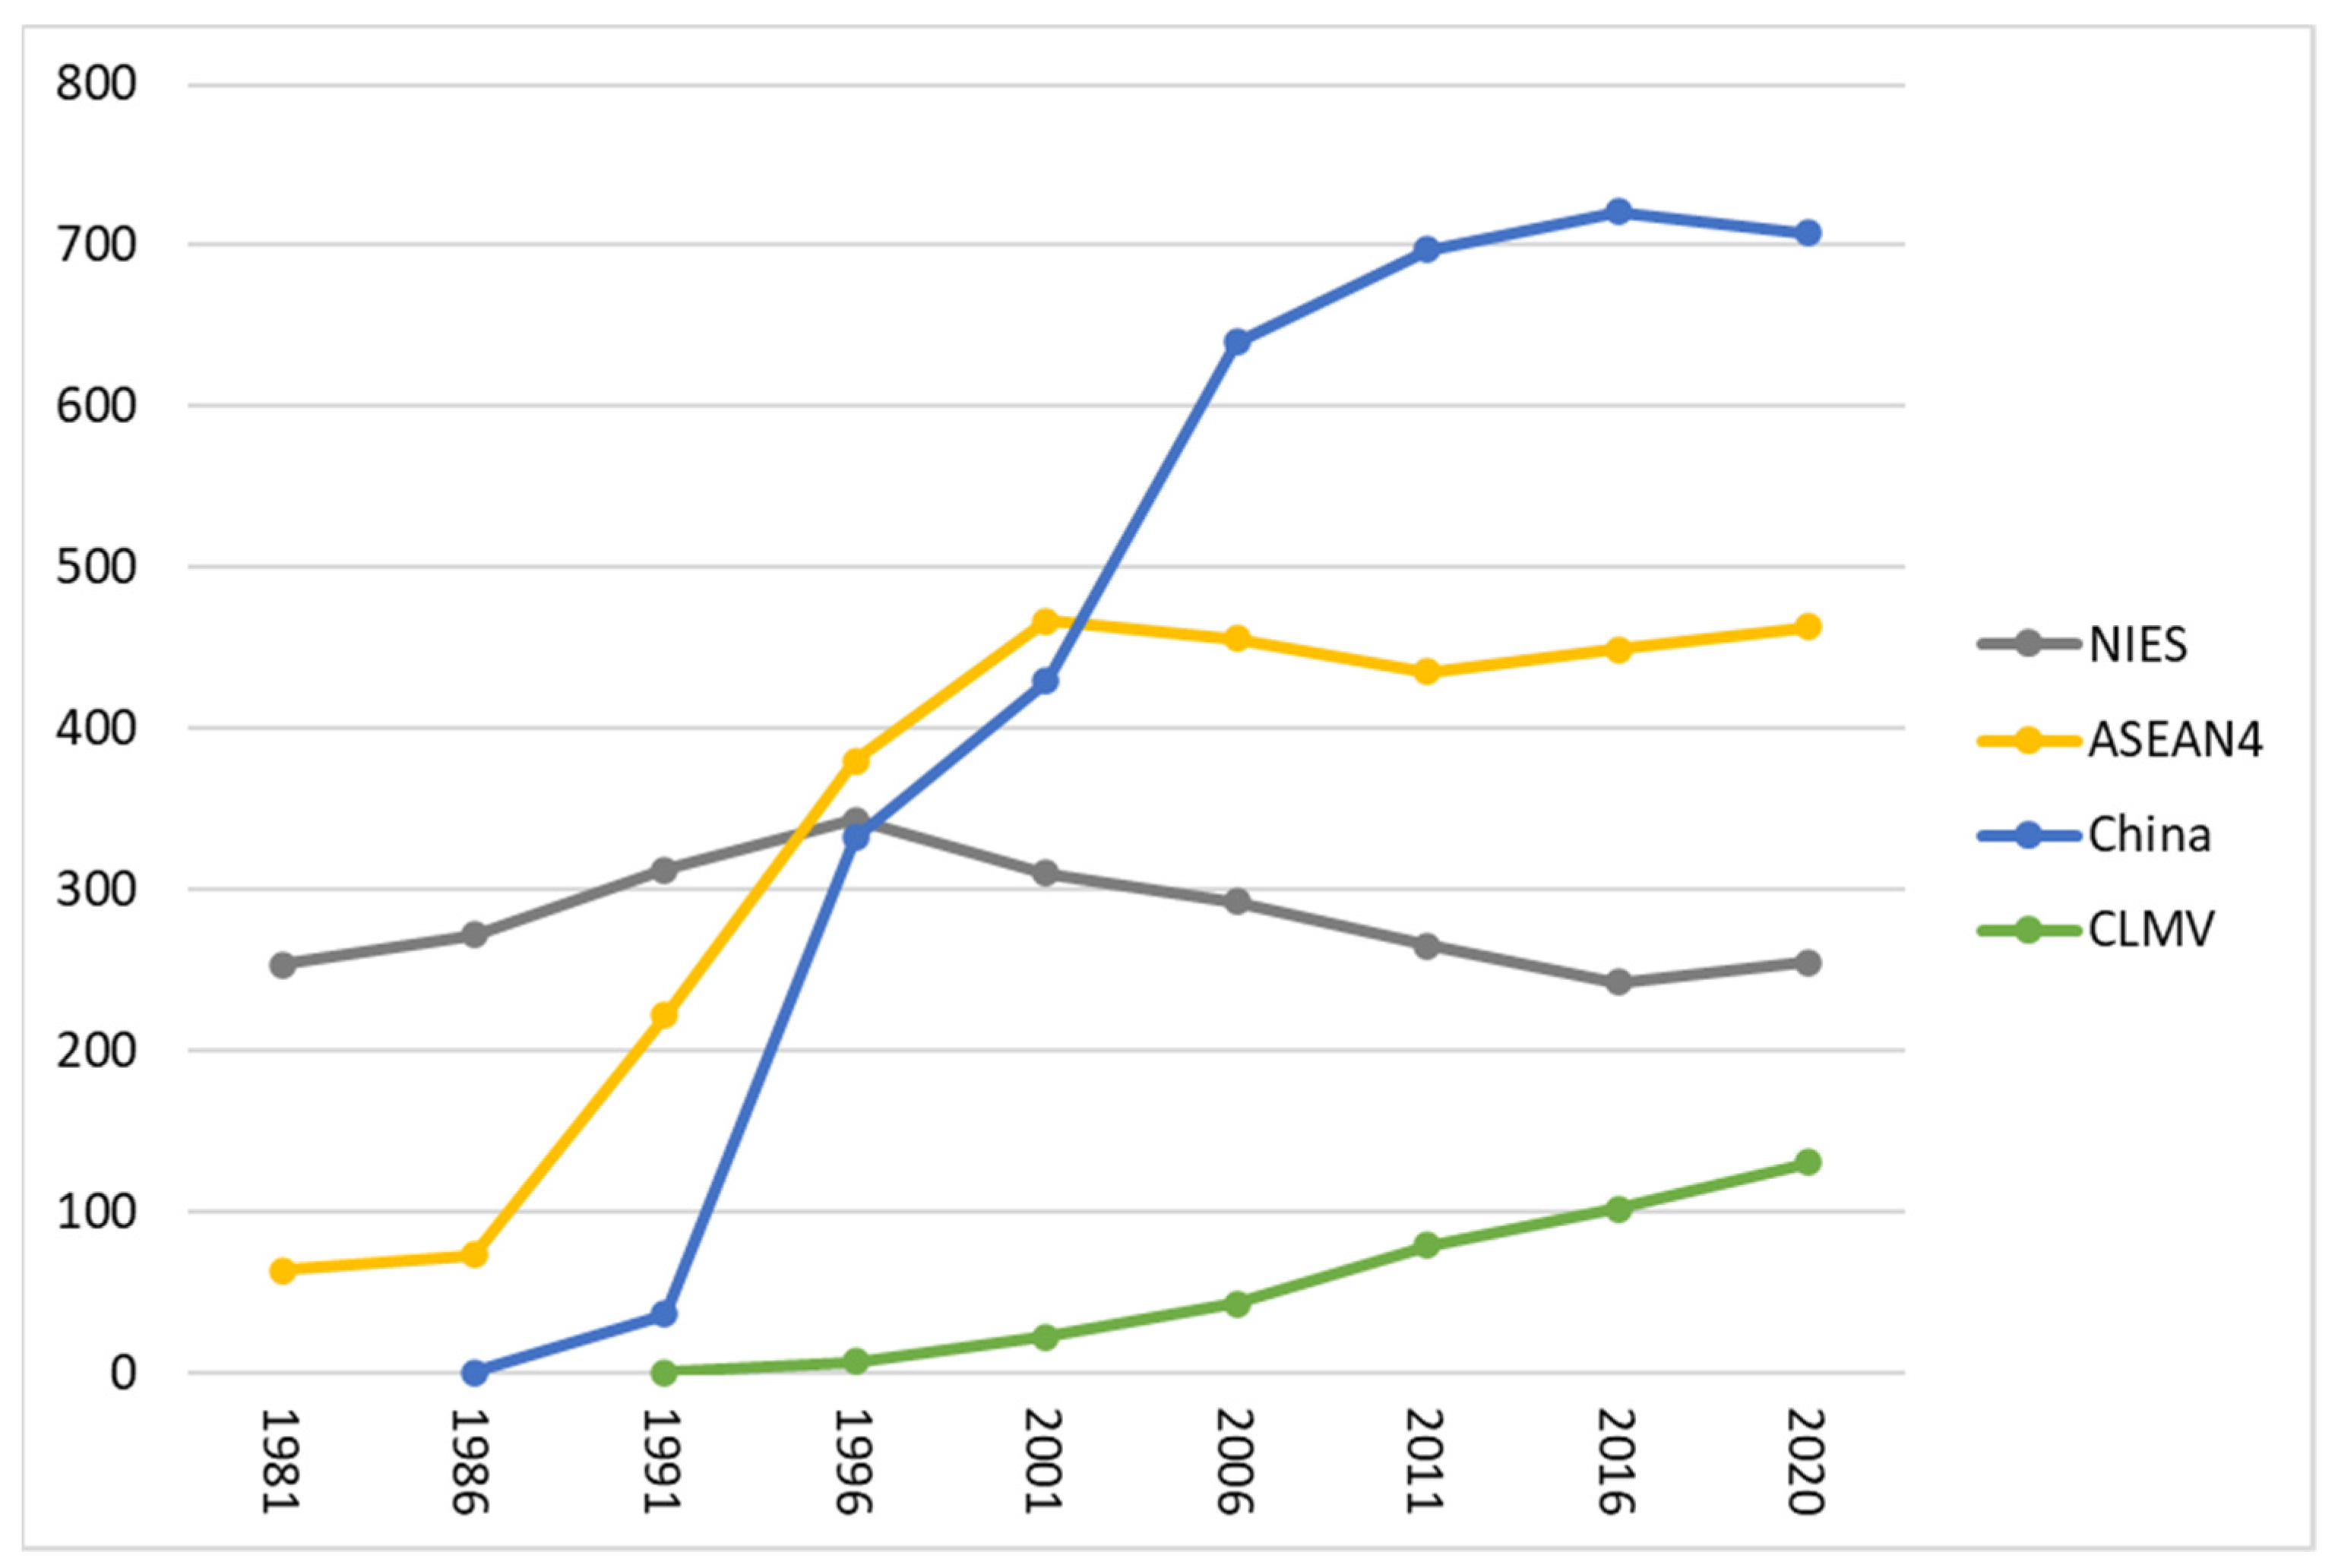
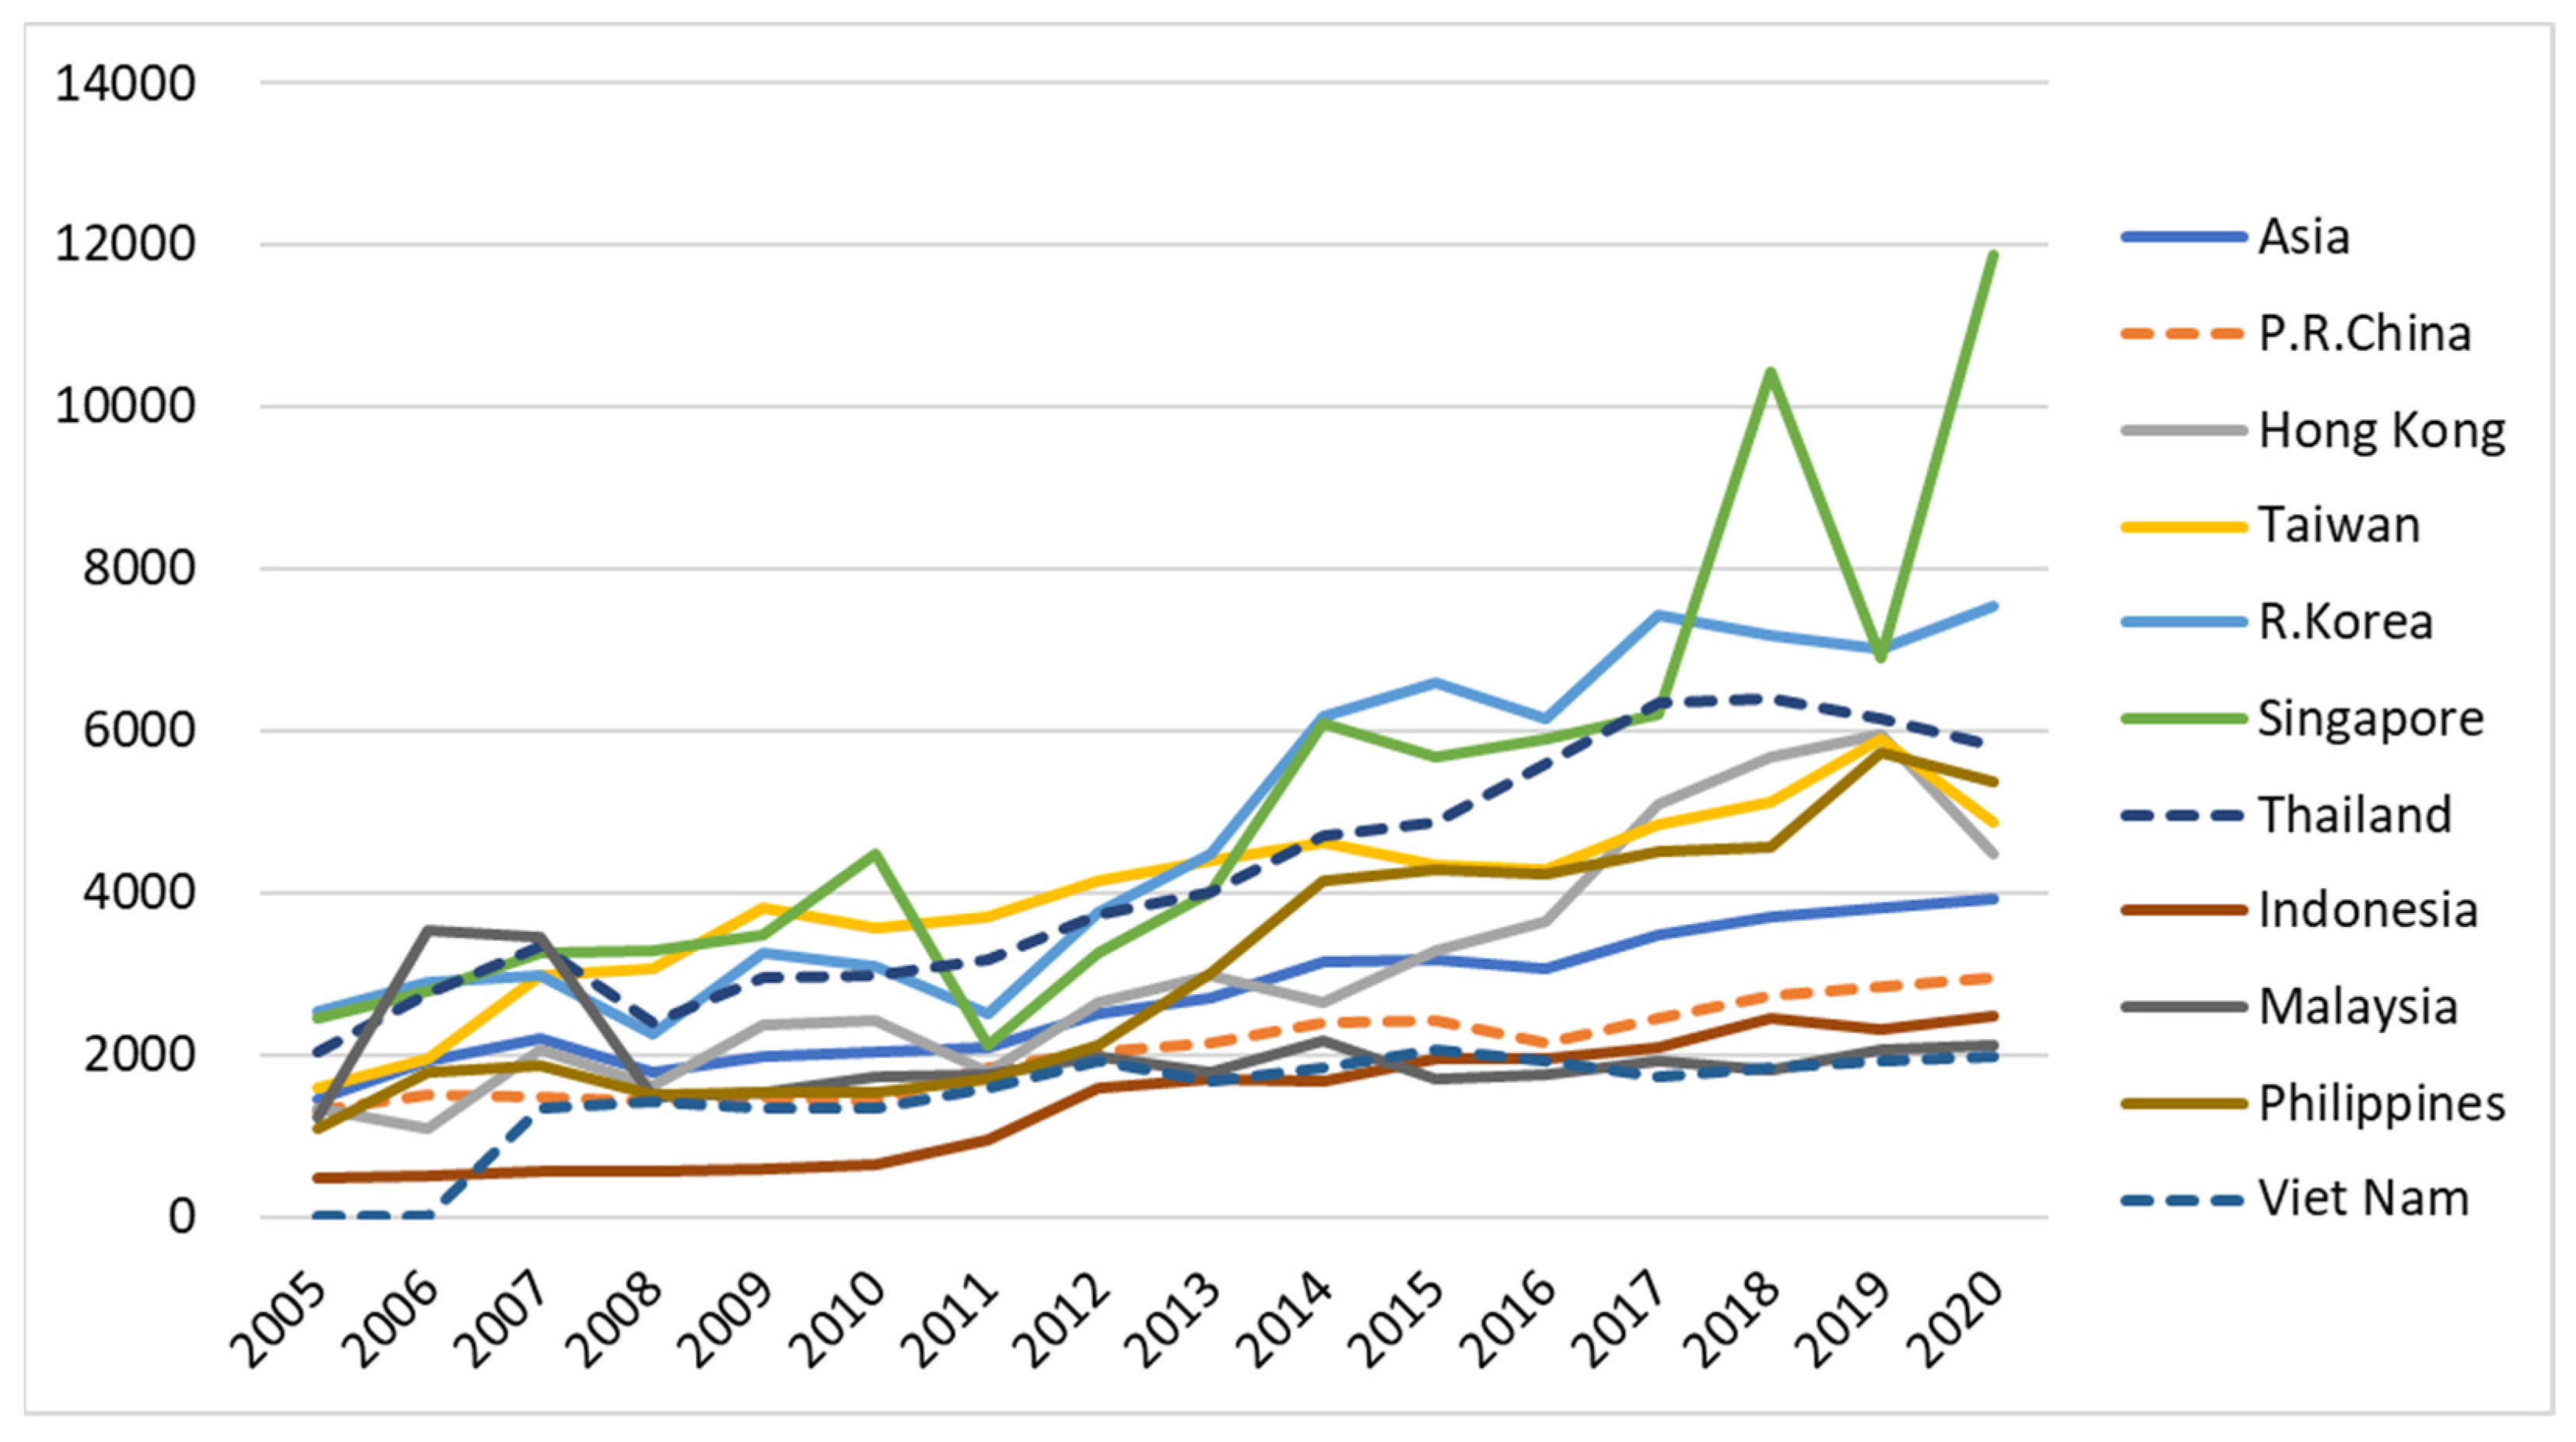
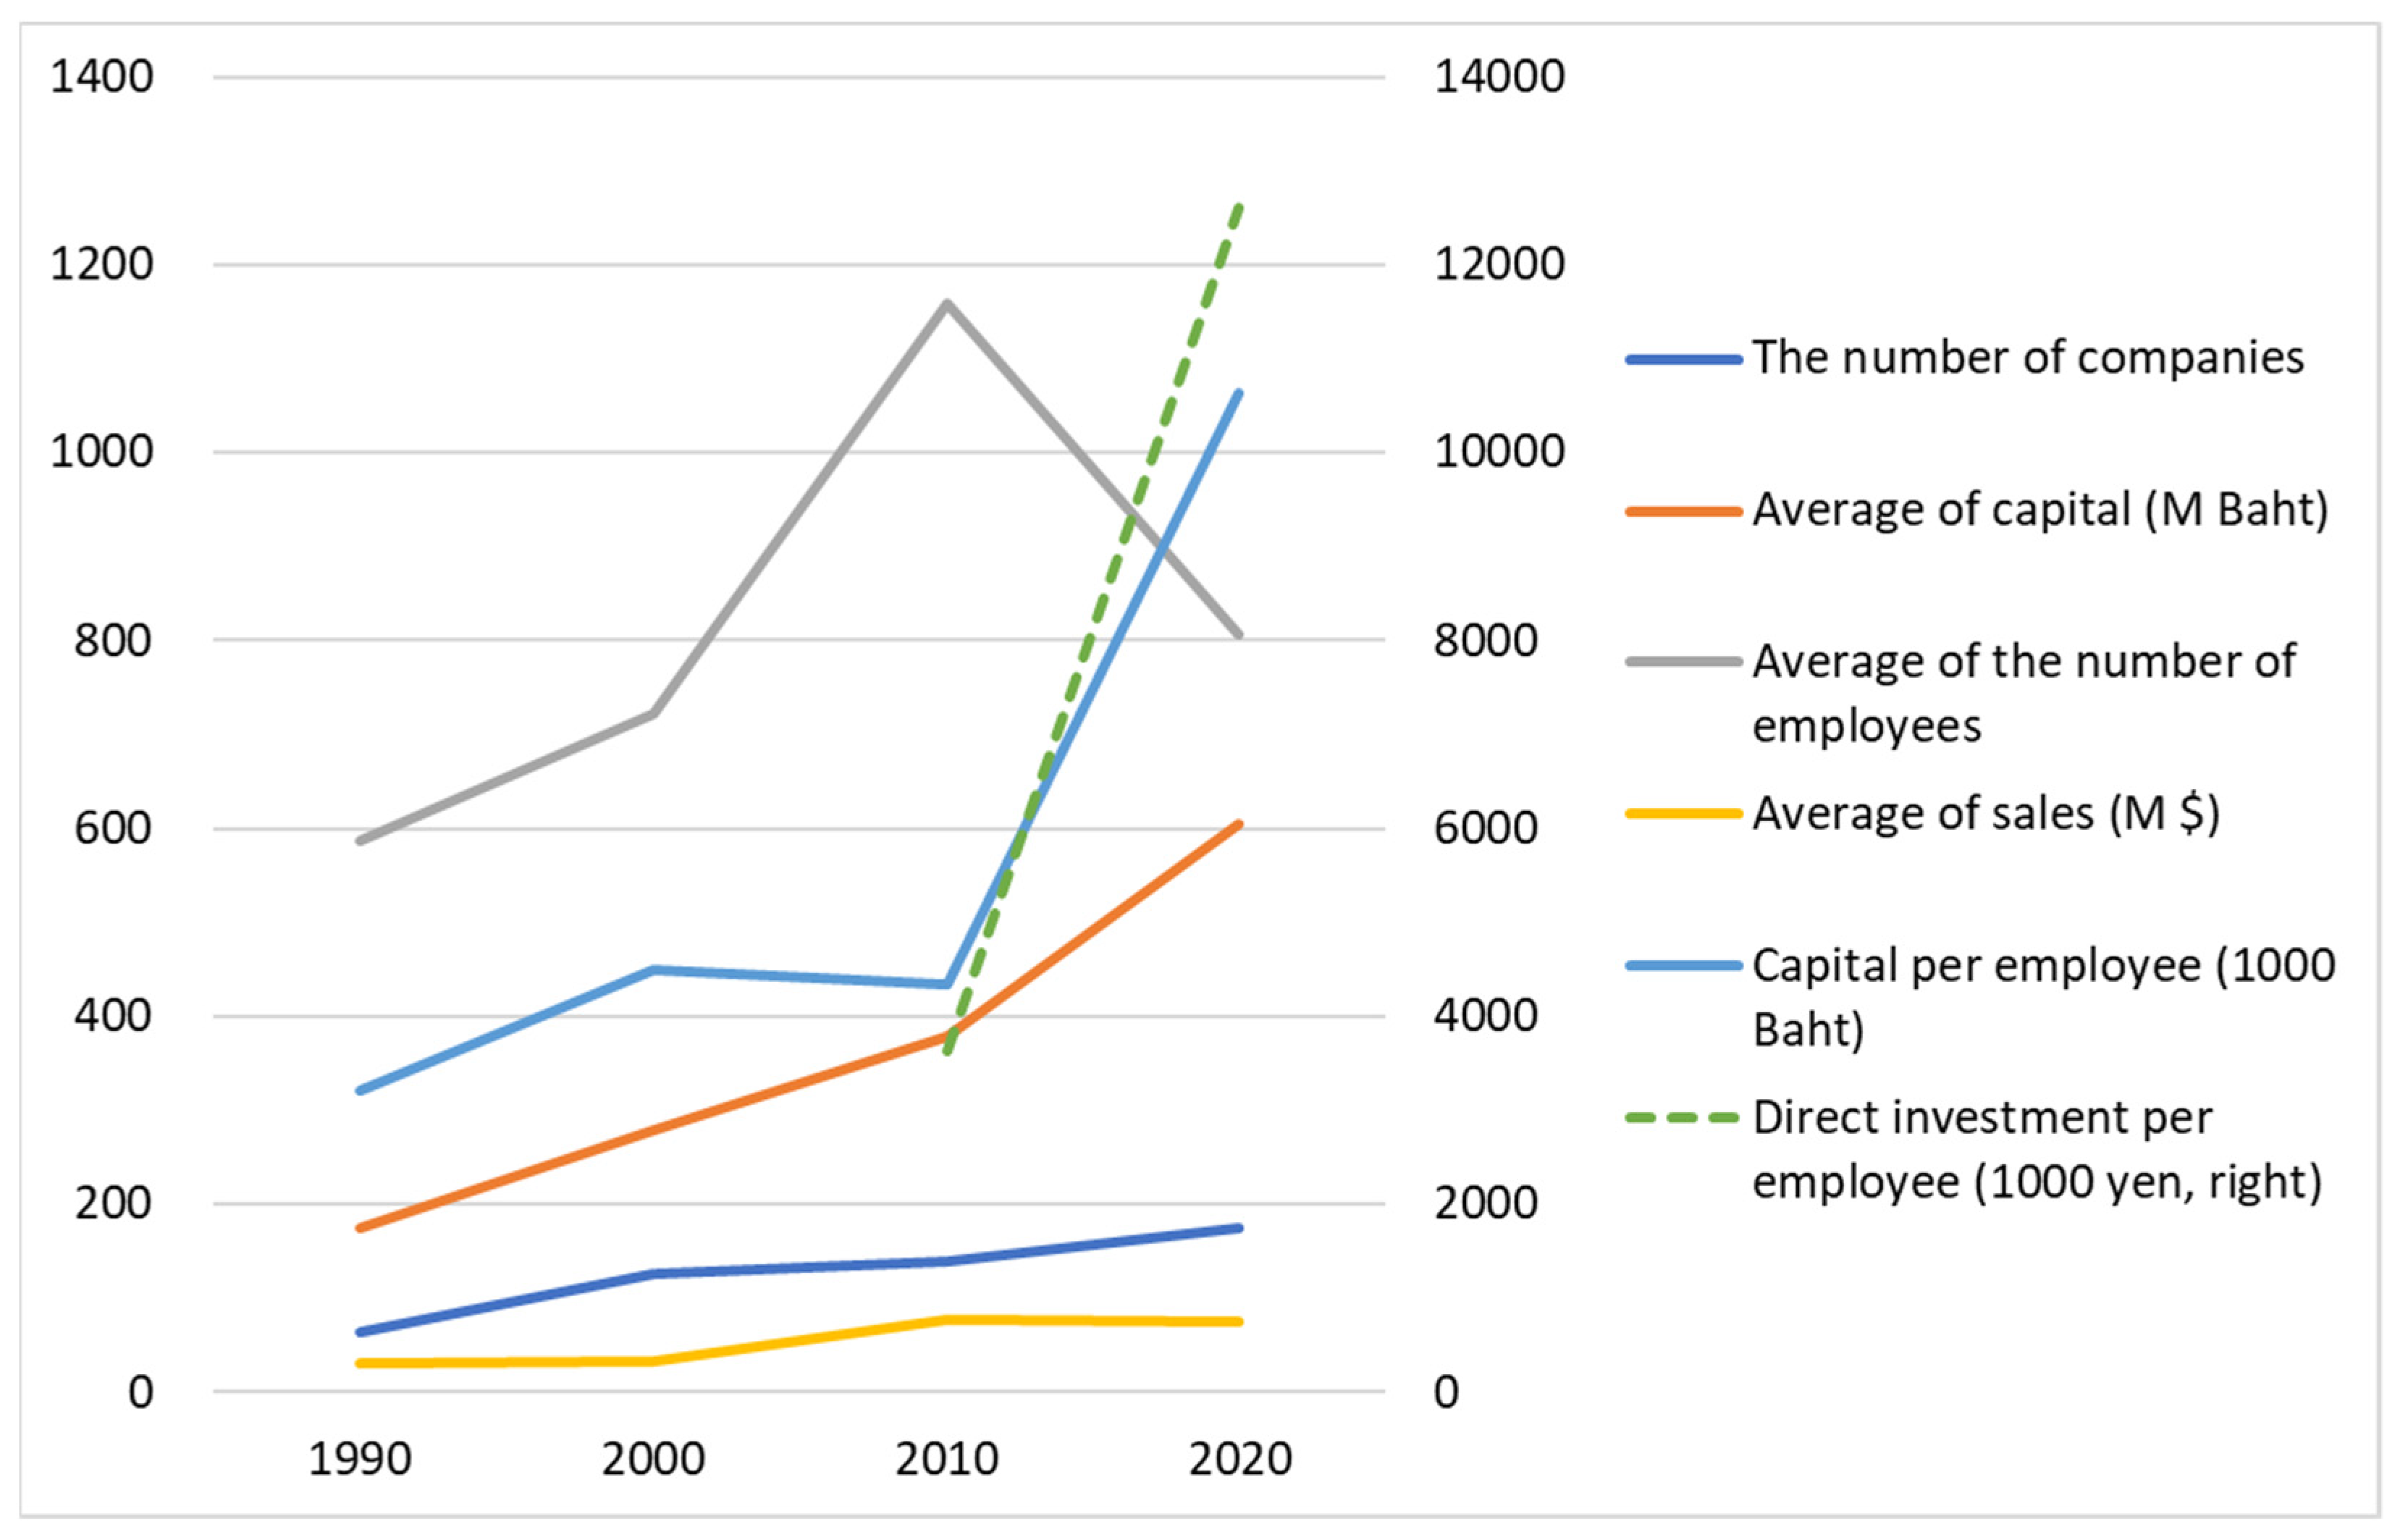
6.1. Evidence on Increasing FDI
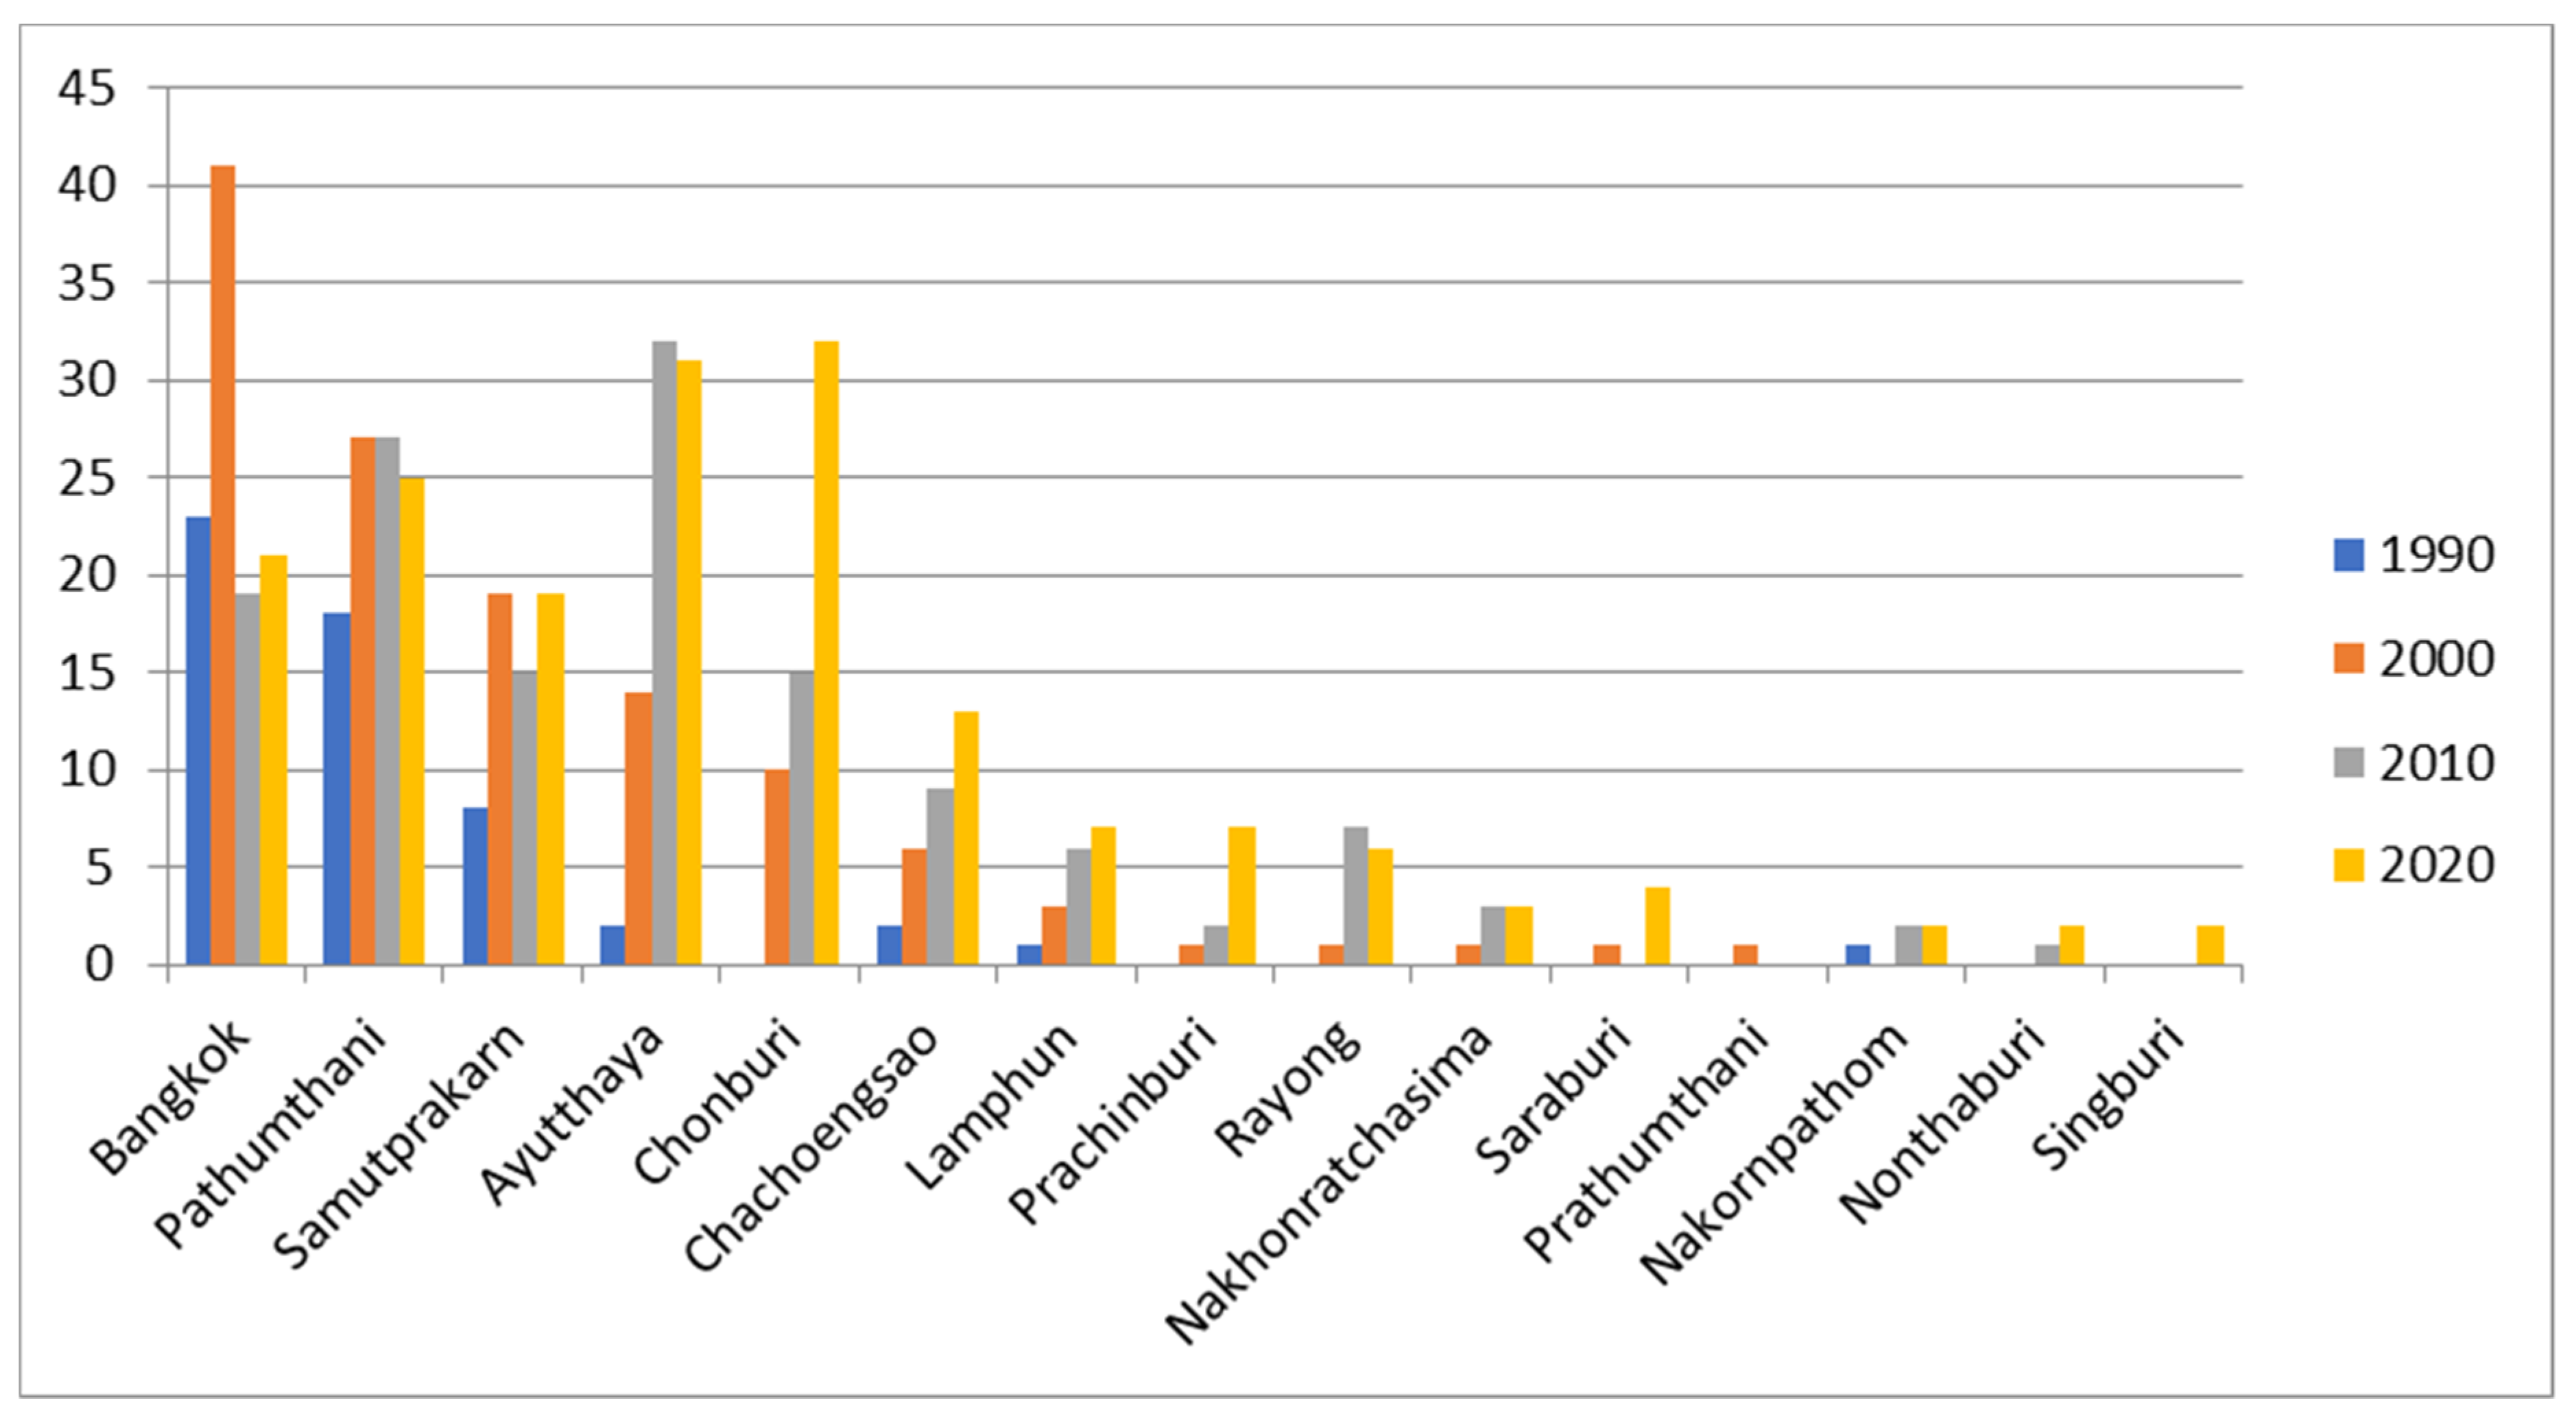
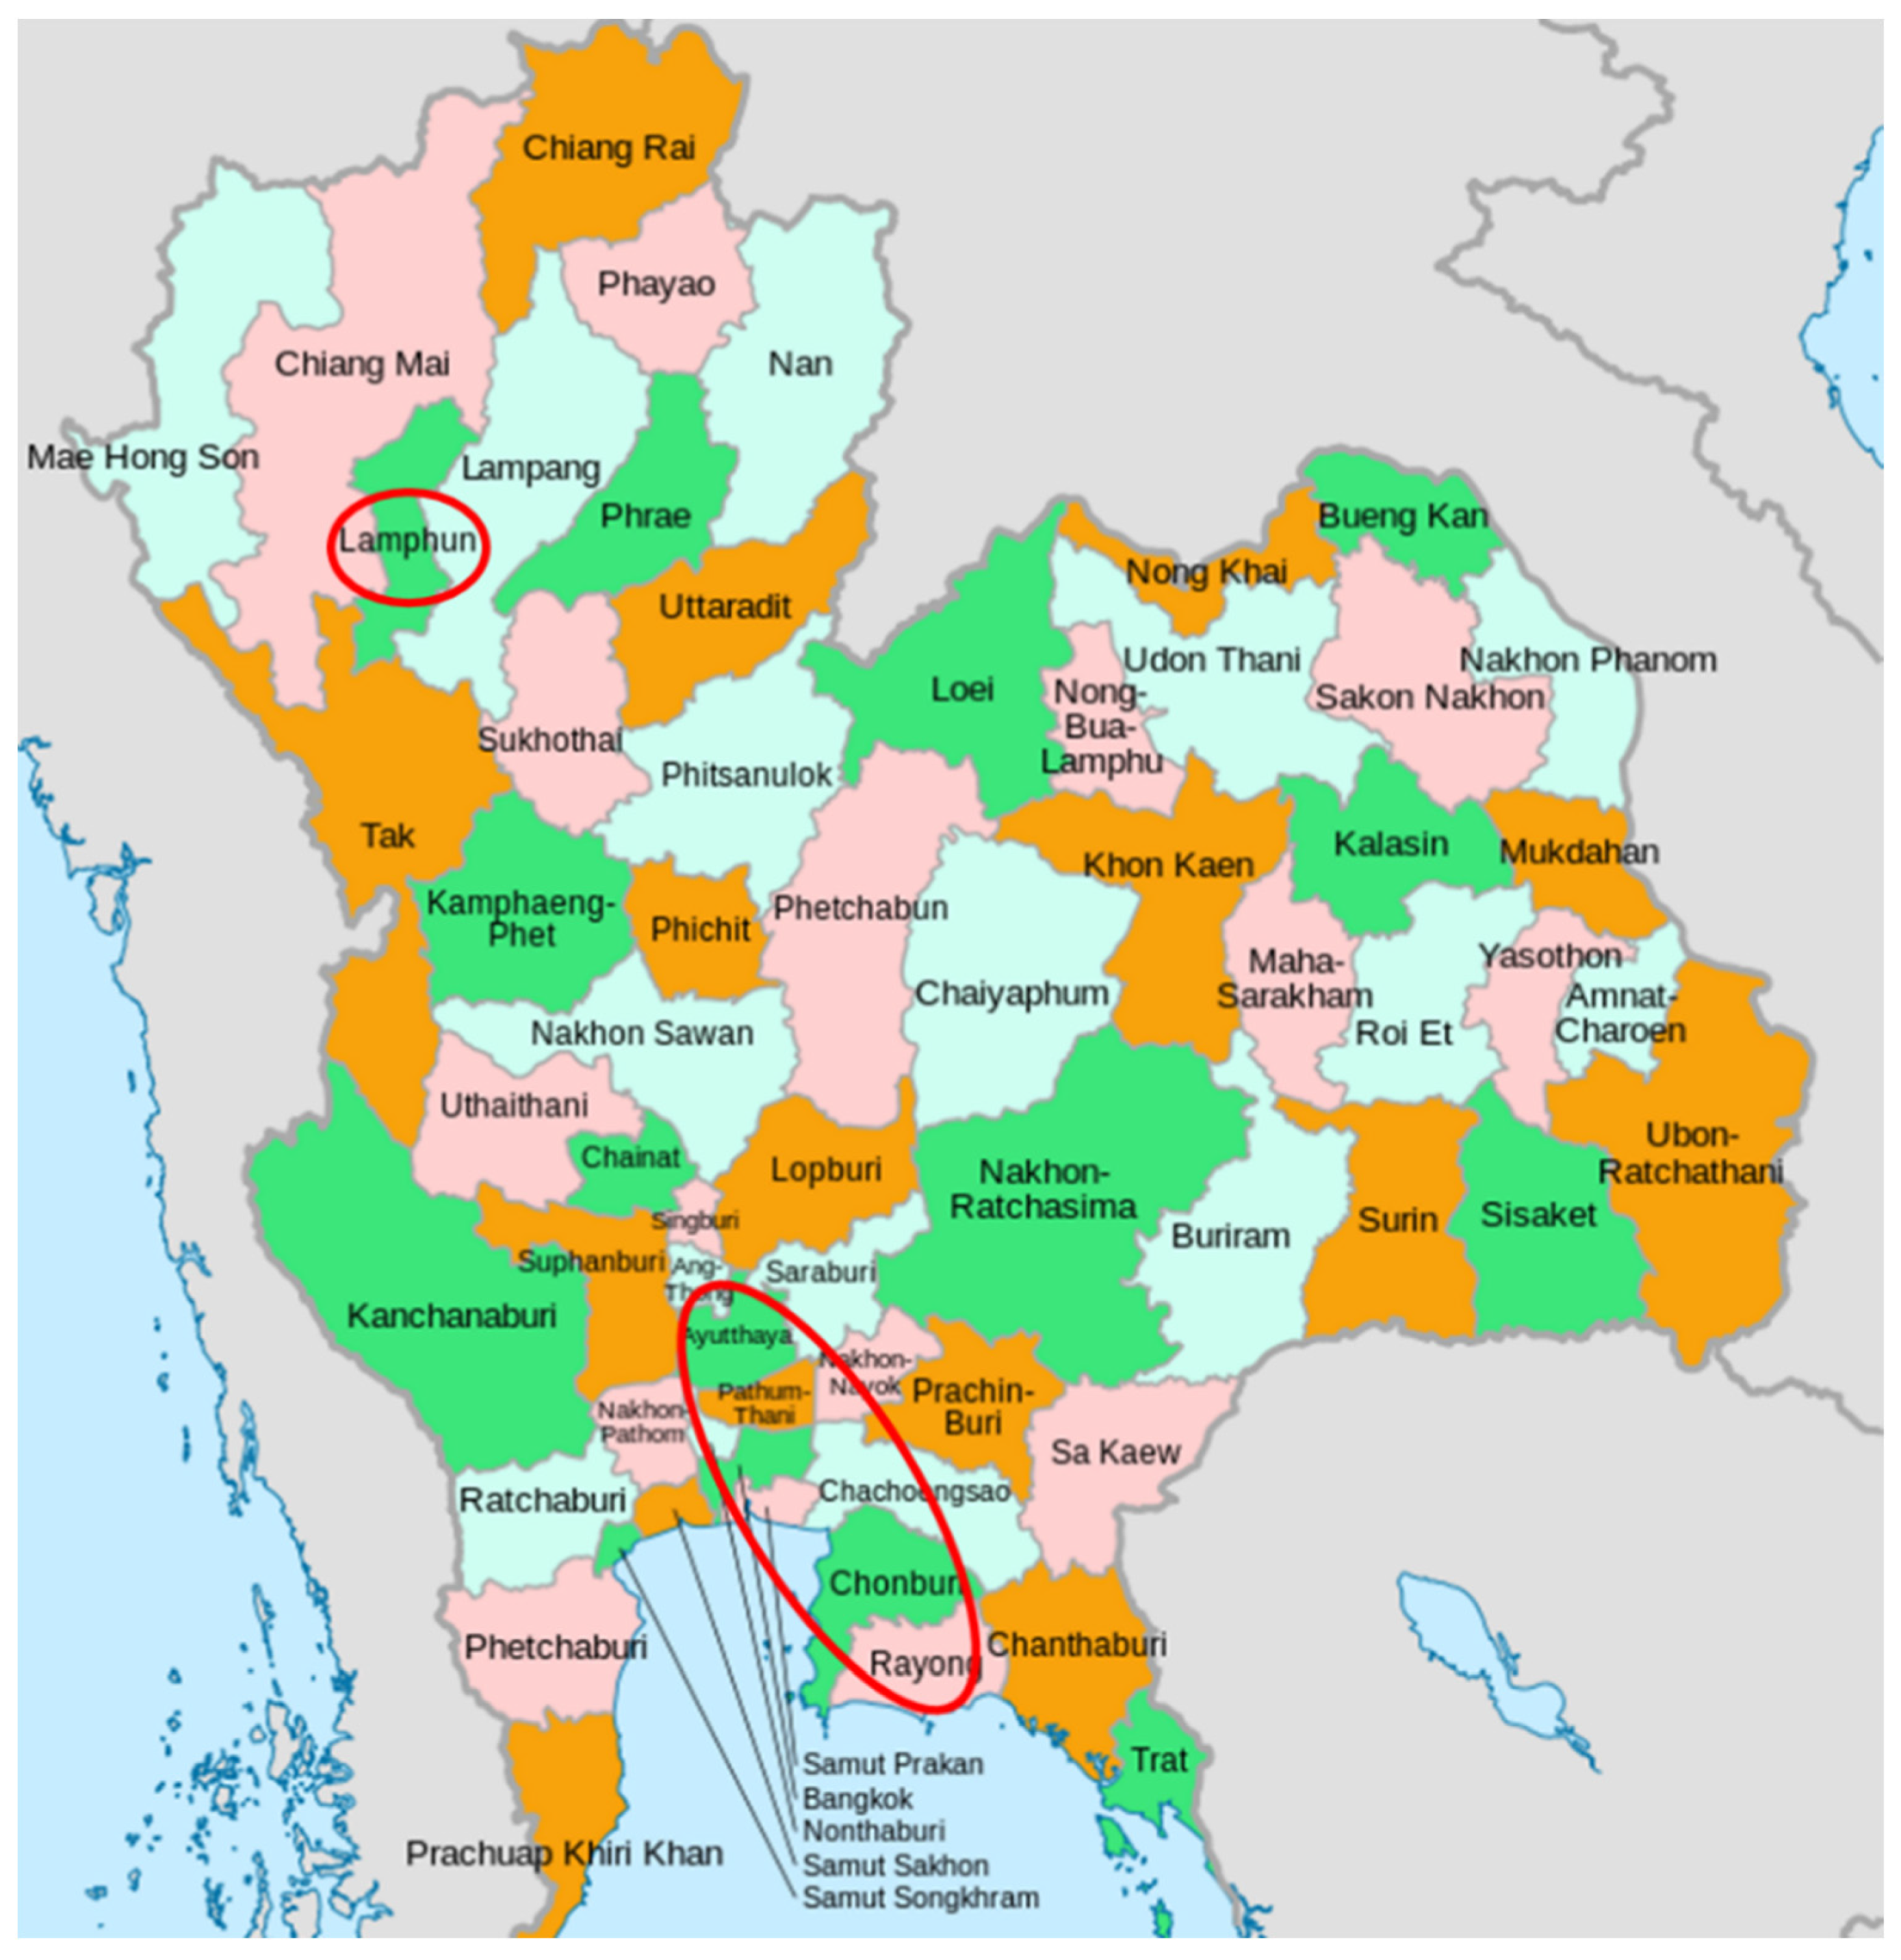
6.2. Evidence on Intra-Regional Industrial Agglomeration
| Map A.9 Number of establishments/firms by province in the Central region (2007 and 2012) (TSIC 30: Manufacture of machinery and equipment) (accessed on 1 July 2019) | |
| 2012 |  |
| 2007 |  |
 <500 <500  500–999 500–999  1000–1999 1000–1999  2000–3999 2000–3999  >4000 >4000 | |
| 2007 | Map A.10 Number of establishments/firms by province in the Central region (2007 and 2012) (TSIC 32: Manufacture of radio equipment, television equipment) (accessed on 1 July 2019) |
 | |
| 2012 |  |
| <500 500–999 1000–1999 2000–3999 >4000 Source: http://statgis.nso.go.th/d/index/th (accessed on 1 January 2020). |
6.3. Evidence on Regional Value Chains
7. Policy Implications
8. Concluding Remarks and Limitations
Author Contributions
Funding
Institutional Review Board Statement
Data Availability Statement
Acknowledgments
Conflicts of Interest
| 1 | Asian NIES (Asian New Industrializing Economies) is Korea, Taiwan, Hong Kong, and Singapore; ASEAN 4 (Association of South-East Asian Nations) means Malaysia, Thailand, Indonesia, and the Philippines; CLMV indicates Cambodia, Laos, Myanmar, and Vietnam. |
| 2 | |
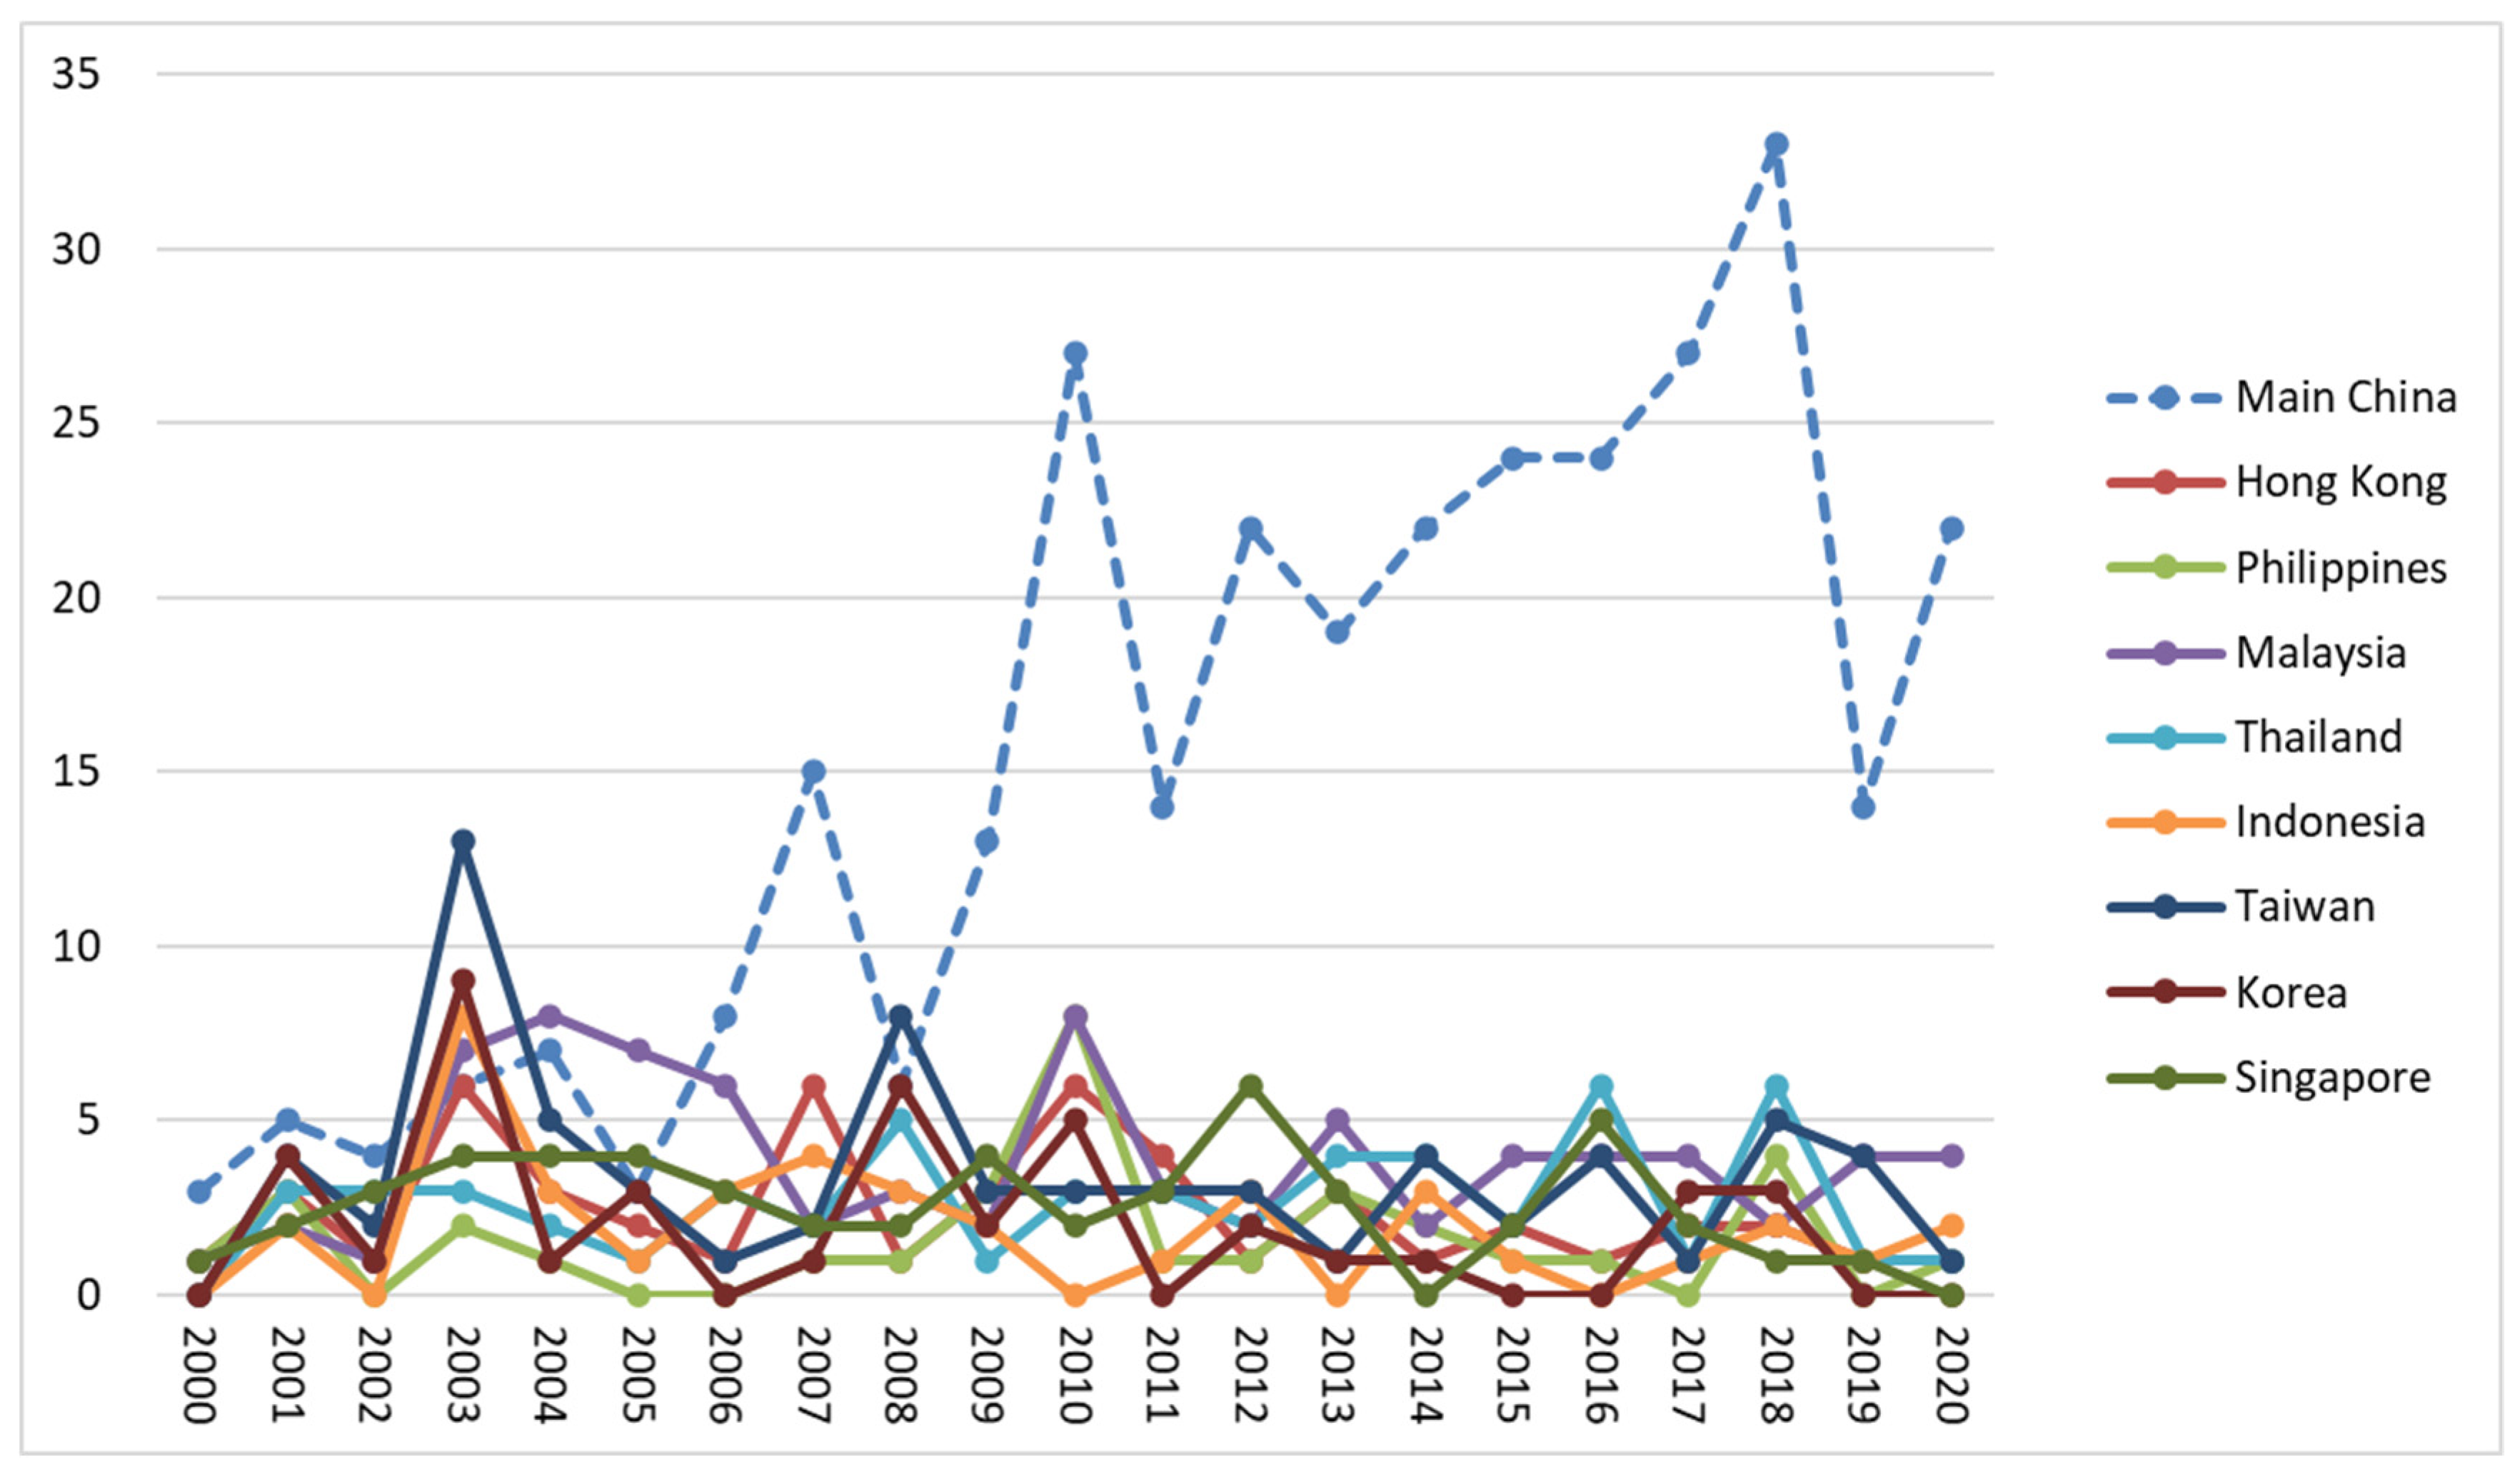
| 3 | The sharp decline in the number of withdrawals in 2019 in China may be due to a wait-and-see approach to the US–China trade conflict, or it may be a temporary phenomenon. However, we need to keep a close eye on longer-term and structural trends. |
| 4 | |
| 5 | In addition, since China, which has a very large scale in terms of both production and market, has developed, there have been various debates regarding to which areas (including Africa) the factories utilizing low-wage labor will be relocated. See, for example, Ozawa and Bellak (2011), Lin (2013), and Brautigam et al. (2018) for the discussion. Moreover, Lin (2012) proposes ‘a new structural economics’ and insists that ‘[t]he new approach also considers structural differences between countries at different levels of development and tries to explain them’ (p. 9). Furthermore, as we can find from Lin (2012, p. 222), who discusses the flying geese theory in detail, his new approach has a close relationship to our theory. This paper also adopts this new structural analysis. See also Suenaga (2002) and Bui (2016) for the structural approach. |
| 6 | According to Fujita (2010), ‘spatial economics’ has seen a process of theoretical development for almost two centuries since (von Thunen [1826] 1966). Many prominent economists have contributed to its development, expanded on a wide variety of ideas, and invented many theoretical tools in this field. |
| 7 | In addition to the effects of the forward and backward linkages, the agglomeration forces include economies of scale (increasing returns), thick markets (high-income levels, large population sizes), the formation of a labor market that contains workers with specialized skills, the supply of inexpensive and specialized non-tradable goods, knowledge spillover due to use of tools for reducing the difficulty of communication, external economies of technologies, diversity of goods such as consumer goods, capital goods, intermediate goods and public goods, promotion of innovation, etc. On the other hand, the dispersion forces include the existence of immobile factors, the increase in wages, increase in land rent (costs of land acquisition for factories, office rents, housing expenses, etc.) and commuting costs, traffic congestion, serious environmental pollution, other external diseconomies, and so on. See Fujita et al. (1999, p. 344) and Fujita (2003, pp. 213–32). |
| 8 | One industrial sector is completely agglomerated within the city. Therefore, the city specializes in the production of one good. |
| 9 | The forward linkage generates the effect that the supply of various intermediate goods from the upstream process improves the productivity of firms (industries) in the downstream process and attracts more firms (industries) to the region. Thus, it leads to the backward linkage effect where the expansion of the demand for the intermediate goods induces an increase in the supply in the upstream process and realizes economies of scale. In these models, the agglomeration effect is caused by the positive feedback process of circular causality of effects of both the forward and backward linkages. See Hirschman (1958) on the forward and backward linkage effects. |
| 10 | See also Ito et al. (2007) for empirical analysis in this regard. |
| 11 | When consigning production to another company, inefficiency arises because the contract for production consignment must be an incomplete contract. However, there are also inefficiencies that can arise when producing in-house. Which production method is more efficient depends on the nature of the intermediate goods produced. For more details, see Antràs and Helpman (2004) and Antràs (2016). |
| 12 | |
| 13 | |
| 14 | Various discussions have been held on these points from the perspective of service link costs. See also Jones and Kierzkowski (1990) and Kimura and Ando (2005) for more information. |
| 15 | ‘Vertical division of labor’ means, for example, division of labor between agriculture and industry and division of labor between crude and refined cotton cloth. On the other hand, ‘horizontal division of labor’ refers to the division of labor between shipbuilding and the automobile industry and the division of labor between commercial vehicles and passenger cars. For the concept of division of labor, see Akamatsu (1965, pp. 129–30) and Suenaga (2012, 2015). |
| 16 | |
| 17 | The magnitude of transportation costs in the narrow and broad senses is not included here. |
| 18 | It is possible to use the capital/labor ratio on the vertical axis, but in this paper, we explicitly use the term ‘technology’, which is the most important factor in economic development. |
| 19 | In addition, the boundaries of low, middle, and high technology sectors (or processes) were not as clear as they are now. |
| 20 | See also Khan and Jomo (2000) for economic development and rent seeking. |
| 21 | Gereffi et al. (2005) classify the production networks in GVCs into five types: Market type, Modular type, Relational type, Captive type, and Hierarchy type. In such production networks, there are cases where there are no core firms, as shown by the Market type, but in many cases, the MNCs of the leading countries play an important role. |
| 22 | |
| 23 | In this paper, for convenience, we distinguish between TFG and FFG models, but this classification is not adequate, because Akamatsu (1945) has already discussed the international division of labor, for example, in the cotton industry. See also Suenaga (2020) for the international division of labor in the cotton industry. Ozawa (2019) insists that ‘Japan is the very last latecomer that managed to forge ahead largely by means of its old-style H-L (Alexander Hamilton–Friedrich List) strategy both prior to and immediately after World War II. By contrast, the NIEs and China have effectively crafted their own new catch-up models by capitalizing on MNC-driven global capitalism’ (p. 112). |
| 24 | However, this does not mean that China does not follow the flying geese theory. China itself has made progress through using the same pattern of flying geese theory, but the scale of supply and demand is too large, which has greatly disrupted the developmental patterns of other countries. |
| 25 | Baldwin and Okubo (2014) point out that the RVCs are often more important than the GVCs. Baldwin (2016) emphasizes the importance of being able to make a day trip and focuses on the regional clusters of Germany and Central and Eastern Europe, the USA and Mexico, and Japan and South-East Asia. |
| 26 | A recent study by Bui (2019) on the production network between Thailand and the CLMV with respect to the role of MNCs describes an interesting case of a Japanese MNC in the automobile industry that had been in Thailand for several decades and had recently expanded operations to Cambodia successfully. The strong linkage between the regional headquarters in Thailand with a nearby subsidiary was more evident in the production and transfer phases. In each stage of production, including procurement, in-house part processing, assembly and inspection, and the quality assurance service, there was always involvement by the Thai regional technicians to assist the infant factory in Cambodia. Some labor-intensive parts that were produced in Thailand in the early 2000s have been produced in Cambodia since 2015, and by 2020, some other mature products with higher levels of automation that were previously produced in Thailand would be made in Cambodia. The Thai subsidiary was gradually phased out as the Cambodian subsidiary expanded. Meanwhile, in that time, Thailand had been able to produce more high-end products, requiring a higher level of technical expertise. |
| 27 | As for other items, Malaysia significantly outperforms Thailand in infrastructure and political/social aspects, but there are no major differences between the two countries in other economic and institutional items. In addition, according to JETRO (2020a, pp. 100–1), the annual real cost of local workers for Japanese manufacturing MNCs is higher in Thailand (US$8135) than in Malaysia (US$7048). |
| 28 | However, under the RCEP, the introduction of a full accumulation system will be considered after all signatories have brought the agreement into force. |
| 29 | |
| 30 | |
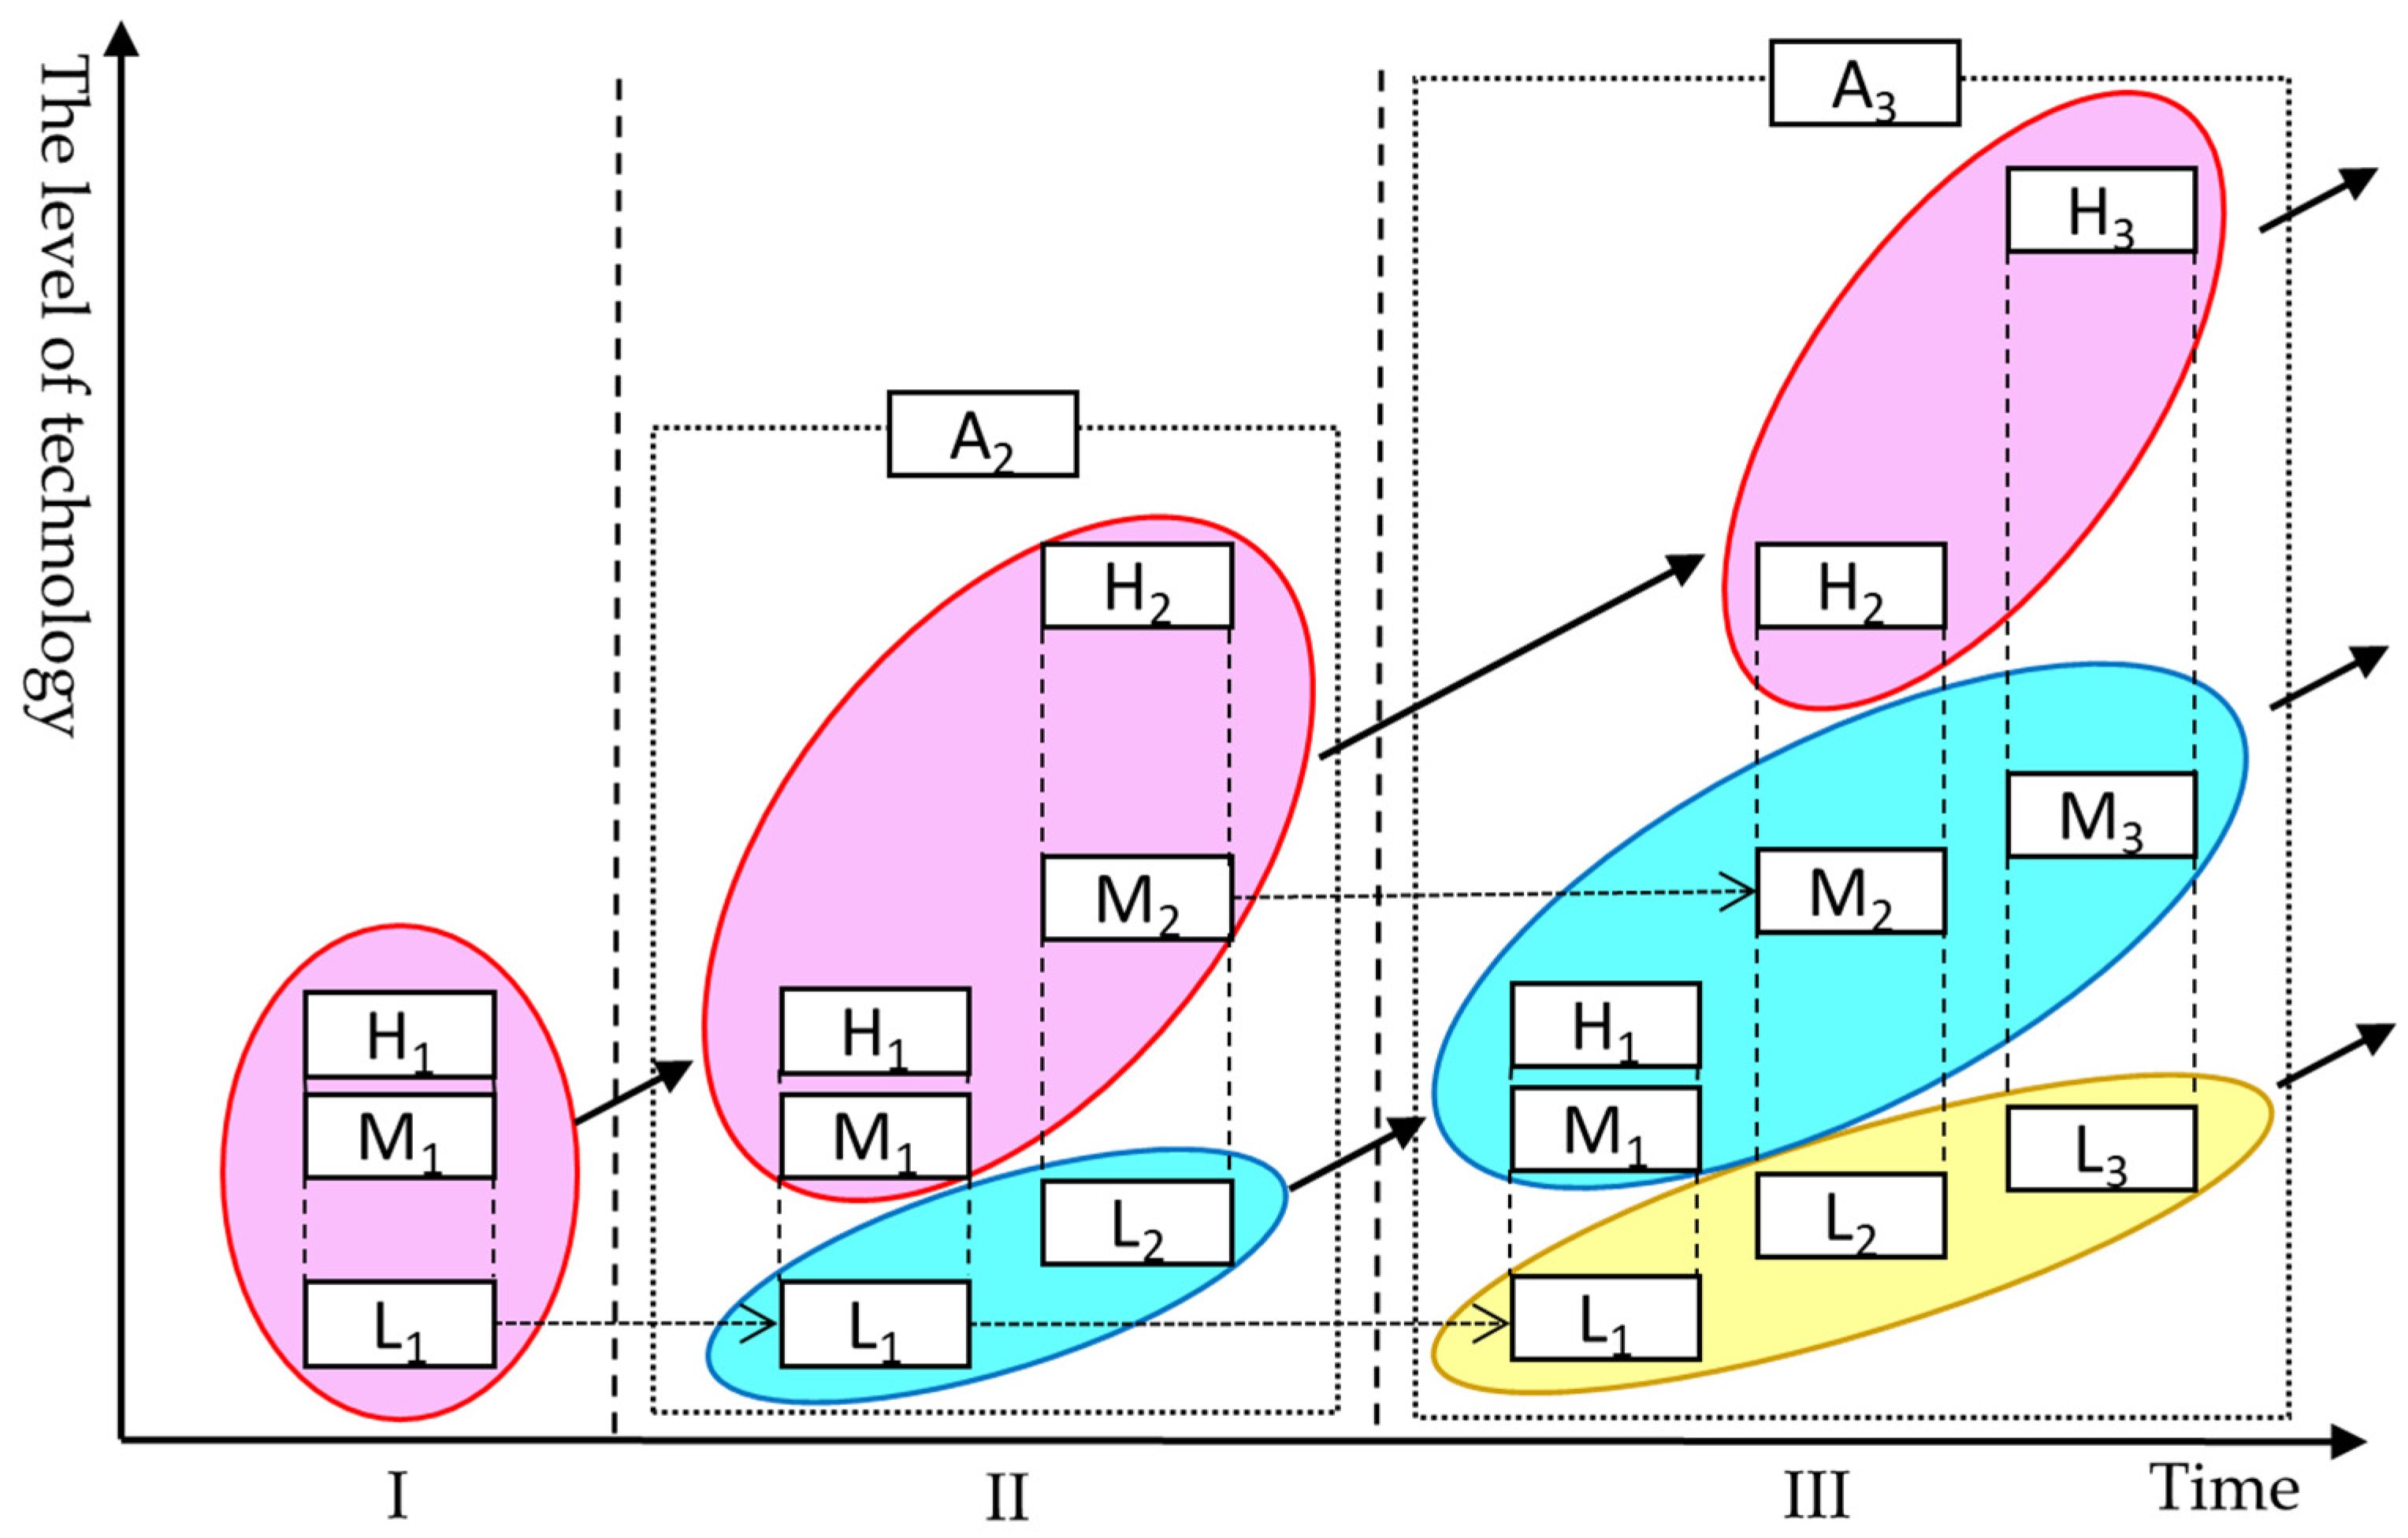
| 31 | In addition, as the FFG theory suggests, although we were unable to cover it in detail in this paper, Japanese MNCs are withdrawing from Malaysia, which is less attractive for agglomeration, and are rapidly moving into Vietnam, where wages are lower. This is not exact, but it corresponds to the situation in Figure 9, for example, in Phase III, where Japan (the headquarters) plays the role of the red circle, while Thailand (and Japanese subsidiaries) plays the core role of the blue circle, and Vietnam is becoming a representative country of the yellow circle as Thailand’s labor costs and technological level become more advanced. |
References
- Abramovitz, Moses. 1989. Thinking about Growth: And Other Essays on Economic Growth and Welfare. Cambridge: Cambridge University Press. [Google Scholar]
- Akamatsu, Kaname. 1945. Keizai Shin Titsuzyo No Keisei Genri. Tokyo: Risosya. (In Japanese) [Google Scholar]
- Akamatsu, Kaname. 1961. A Theory of Unbalanced Growth in the World Economy. Weltwirtschaftliches Archiv 86: 196–217. [Google Scholar]
- Akamatsu, Kaname. 1965. Sekai Keizai Ron. Tokyo: Kunimoto Shobo. (In Japanese) [Google Scholar]
- Ang, Yuen Yuen. 2018. Domestic Flying Geese: Industrial Transfer and Delayed Policy Diffusion in China. China Quarterly 234: 420–43. [Google Scholar] [CrossRef]
- Antràs, Pol. 2016. Global Production: Firms, Contracts, and Trade Structure. Princeton: Princeton University Press. [Google Scholar]
- Antràs, Pol, and Elhanan Helpman. 2004. Global Sourcing. Journal of Political Economy 112: 552–80. [Google Scholar] [CrossRef]
- Baldwin, Richard. 2014. Multilateralising 21st Century Regionalism. Paris: OECD Conference Centre. [Google Scholar]
- Baldwin, Richard. 2016. The Great Convergence: Information Technology and the New Globalization. Harvard: Harvard University Press. [Google Scholar]
- Baldwin, Richard, and Toshihiro Okubo. 2014. Networked FDI: Sales and Sourcing Patterns of Japanese Foreign Affiliates. World Economy 37: 1051–80. [Google Scholar] [CrossRef]
- Brainard, Lael. 1997. An Empirical Assessment of the Proximity-Concentration Trade-off between Multinational Sales and Trade. American Economic Review 87: 520–44. [Google Scholar]
- Brautigam, Deborah, Tang Xiaoyang, and Ying Xia. 2018. What Kinds of Chinese ‘Geese’ Are Flying to Africa? Evidence from Chinese Manufacturing Firms. Journal of African Economies 27: i29–i51. [Google Scholar] [CrossRef]
- Bui, Thi Minh-Tam. 2016. The Development of Special Economic Zones in East Asia and Implications of Thailand. Policy Note. Bangkok: School of Economics and Public Policy, Srinakharinwirot University, vol. 3, pp. 1–8. [Google Scholar]
- Bui, Thi Minh-Tam. 2019. SEZ Development in Cambodia, Thailand and Vietnam and the Regional Value Chains. In EEC Development and Transport Facilitation Measures in Thailand, and the Development Strategies by the Neighboring Countries; Edited by Daisuke Hiratsuka. BRC Research Report; Bangkok: Bangkok Research Center, JETRO Bangkok/IDE-JETRO, chp. 5. pp. 82–117. [Google Scholar]
- Bui, Thi Minh-Tam, and Arayah Preechametta. 2019. Will manufacturing investors go to border zones? The case of central Thailand. International Journal of Emerging Markets. ahead-of-print. [Google Scholar] [CrossRef]
- Damijan, Jože P., and Matija Rojec. 2007. Foreign Direct Investment and Catching Up of New EU Member States: Is There a Flying Geese Pattern? Applied Economics Quarterly 53: 91–118. [Google Scholar]
- Dicken, Peter. 1998. Global Shift: Transforming the World Economy, 3rd ed. London: Paul Chapman Publishing Ltd. [Google Scholar]
- Dixit, Avinash K., and Joseph E. Stiglitz. 1977. Monopolistic competition and optimum product diversity. American Economic Review 67: 297–308. [Google Scholar]
- Fujita, Masahisa. 2003. Kukan Keizaigaku no Shiten kara mita Sangyo Kurasuta Seisaku no Igi to Kadai. In Nihon No Sangyo Kurasuta Senryaku. Edited by Yoko Ishikura, Masahisa Fujita, Noboru Maeda, Kazuyori Kanai and Akira Yamazaki. Tokyo: Yuhikaku, chp. 6. pp. 211–61. (In Japanese) [Google Scholar]
- Fujita, Masahisa. 2010. Kukan Keizaigaku no Hatten. In Gendai Keizaigaku no Thoryu 2010. Edited by Shinsuke Ikeda, Masao Ogaki, Akihisa Shibata, Takatoshi Tabuchi and Yasuo Maeda. Tokyo: Toyo Keizai Shinposya, pp. 3–53. (In Japanese) [Google Scholar]
- Fujita, Masahisa, and Jacques-François Thisse. 2002. Economics of Agglomeration: Cities, Industrial Location, and Globalization. Cambridge: Cambridge University Press. [Google Scholar]
- Fujita, Masahisa, and Jacques-François Thisse. 2013. Economics of Agglomeration: Cities, Industrial Location, and Globalization, 2nd ed. Cambridge: Cambridge University Press. [Google Scholar]
- Fujita, Masahisa, Paul Krugman, and Anthony J. Venables. 1999. The Spatial Economy: Cities, Regions and International Trade. Cambridge: MIT Press. [Google Scholar]
- Gereffi, Gary, and Timothy Sturgeon. 2013. Global Value Chain-Oriented Industrial Policy: The Role of Emerging Economies. In Global Value Chains in a Changing World. Edited by Deborah K. Elms and Patrick Low. Geneva: World Trade Organization, chp. 14. pp. 329–60. [Google Scholar]
- Gereffi, Gary, John Humphrey, and Timothy Sturgeon. 2005. The Governance of Global Value Chains. Review of International Political Economy 12: 78–104. [Google Scholar] [CrossRef]
- Helpman, Elhanan. 1984. A Simple Theory of International Trade with Multinational Corporations. Journal of Political Economy 92: 451–71. [Google Scholar] [CrossRef]
- Helpman, Elhanan, Marc Melitz, and Stephen Yeaple. 2004. Export Versus FDI with Heterogeneous Firms. American Economic Review 94: 300–16. [Google Scholar] [CrossRef]
- Hirschman, Albert O. 1958. The Strategy of Development. New Haven: Yale University Press. [Google Scholar]
- Ito, Banri, Eiichi Tomiura, and Ryuhei Wakasugi. 2007. Dissecting Offshore Outsourcing and R&D: A Survey of Japanese Manufacturing Firms; RIETI Discussion Paper Series 07-E-060; Tokyo: Research Institute of Economy, Trade and Industry.
- JETRO. 2020a. FY2019 Survey on Overseas Business Development of Japanese Companies; Tokyo: JETRO. (In Japanese)
- JETRO. 2020b. FY2020 Survey of Japanese Companies Operating Overseas (Asia & Oceania); Tokyo: JETRO. (In Japanese)
- Jones, Ronald W., and Henryk Kierzkowski. 1990. The Role of Service in Production and International Trade: A Theoretical Framework. In The Political Economy of International Trade. Edited by Ronald Jones and Anne Krueger. Oxford: Basil Blackwell, chp. 3. pp. 31–48. [Google Scholar]
- Kamińska, Teresa. 2016. Is the ‘Flying Geese’ Paradigm Useful to Explain Advancement in the European Union by Means of FDI Phenomenon? Journal of International Studies 9: 9–24. [Google Scholar] [CrossRef] [PubMed][Green Version]
- Kemanai, Yuji. 1998. Hakenkoku America no Ruiseki Saimu Mondai. In Ruiseki Saimu to Tyoki Hado. Edited by Shiro Shiraishi, Yuji Kemanai and Toshinobu Mikami. Tokyo: Sekai Shoin, chp. 7. pp. 181–205. (In Japanese) [Google Scholar]
- Khan, Mushtaq H., and Kwame Sundaram Jomo, eds. 2000. Rents, Rent-Seeking and Economic Development: Theory and Evidence in Asia. Cambridge: Cambridge University Press. [Google Scholar]
- Kimura, Fukunari. 2009. Expansion of the Production Networks into the Less Developed ASEAN Region: Implications for Development Strategy. In Plugging into Production Networks: Industrialization Strategy in Less Developed Southeast Asian Countries. Edited by Ikuo Kuroiwa. Singapore: ISEAS Publishing, chp. 2. pp. 15–35. [Google Scholar]
- Kimura, Fukunari, and Mitsuyo Ando. 2005. Two-dimensional Fragmentation in East Asia: Conceptual Framework and Empirics. International Review of Economics and Finance 14: 317–48. [Google Scholar] [CrossRef]
- Kimura, Fukunari, Yuya Takahashi, and Kazunobu Hayakawa. 2007. Fragmentation and Parts and Components Trade: Comparison between East Asia and Europe. North American Journal of Economics and Finance 18: 23–40. [Google Scholar] [CrossRef]
- Kojima, Kiyoshi. 2003. The Flying Geese Theory of Economic Development. Kure: Bunshindo, vol. 1. (In Japanese) [Google Scholar]
- Krugman, Paul R. 1991a. Geography and Trade. Cambridge: MIT Press. [Google Scholar]
- Krugman, Paul R. 1991b. Increasing returns and economic geography. Journal of Political Economy 99: 483–99. [Google Scholar] [CrossRef]
- Krugman, Paul R., and Anthony J. Venables. 1995. Globalization and the inequality of nations. Quarterly Journal of Economics 110: 857–80. [Google Scholar] [CrossRef]
- Lee, Keun. 2016. Economic Catch-Up and Technological Leapfrogging: The Path to Development and Macroeconomic Stability in Korea. Cheltenham: Edward Elgar. [Google Scholar]
- Lin, Justin Yifu. 2012. The Quest for Prosperity: How Developing Economies Can Take Off. Princeton: Princeton University Press. [Google Scholar]
- Lin, Justin Yifu. 2013. From Flying Geese to Leading Dragons: New Opportunities and Strategies for Structural Transformation in Developing Countries. In The Industrial Policy Revolution II. Edited by Joseph E. Stiglitz, Justin Lin Yifu and Ebrahim Patel. London: Palgrave, pp. 50–70. [Google Scholar]
- Markusen, James. 1984. Multinationals, Multi-plant Economies, and the Gains from Trade. Journal of International Economics 16: 205–26. [Google Scholar] [CrossRef]
- Markusen, James, and Anthony J. Venables. 2000. The Theory of Endowment, Intra-industry and Multi-national Trade. Journal of International Economics 52: 209–34. [Google Scholar] [CrossRef]
- Marshall, Alfred. 1920. Principles of Economics. London: Macmillan. [Google Scholar]
- Melitz, Marc. 2003. The Impact of Trade on Intra-Industry Reallocations and Aggregate Industry Productivity. Econometrica 71: 1695–725. [Google Scholar] [CrossRef]
- Mieno, Fumiharu. 2013. The Eastern Seaboard Development Plan and Industrial Cluster in Thailand: A Quantitative Overview. In Aid as Handmaiden for the Development of Institutions. Edited by Machiko Nissanke and Yasutami Shimomura. London: Palgrave Macmillan, chp. 3. pp. 81–105. [Google Scholar]
- National Statistical Office of Thailand. n.d. Industrial and Business Census 2007 and 2012. Available online: http://statgis.nso.go.th (accessed on 1 July 2019).
- Oizumi, Keiichiro. 2013. Kakudai suru Shinkokoku Tozyoukoku Yunyuu Sizhou wo dou Kouryaku suruka. Kan Taiheiyo Business Zhouho RIM 13: 95–117. (In Japanese). [Google Scholar]
- Ozawa, Terutomo. 2016. The Evolution of the World Economy: The ‘Flying-Geese’ Theory of Multinational Corporations and Structural Transformation. Cheltenham: Edward Elgar. [Google Scholar]
- Ozawa, Terutomo. 2019. The Flying-Geese Theory: Reassessed and Reformulated in New Structuralist Perspective. In The Oxford Handbook of Structural Transformation. Edited by Célestin Monga and Justin Yifu Lin. Oxford: Oxford University Press, chp. 5. pp. 109–26. [Google Scholar]
- Ozawa, Terutomo, and Christian Bellak. 2011. Will the World Bank’s Vision Materialize? Relocating China’s Factories to Sub-Saharan Africa, Flying-Geese Style. Global Economy Journal 11: 1850234. [Google Scholar] [CrossRef]
- Ozawa, Terutomo, Sergio Castello, and Ronnie J. Phillips. 2001. The Internet Revolution, the “McLuhan” Stage of Catch-up, and Institutional Reforms in Asia. Journal of Economic Issues 35: 289–98. [Google Scholar] [CrossRef]
- Petri, Peter A. 2012. The Determinants of Bilateral FDI: Is Asia Different? Journal of Asian Economics 23: 201–9. [Google Scholar] [CrossRef][Green Version]
- Puga, Diego, and Anthony J. Venables. 1996. The spread of industry: Spatial agglomeration in economic development. Journal of the Japanese and International Economies 10: 440–64. [Google Scholar] [CrossRef]
- Radelet, Steven, and Jeffrey Sachs. 1997. Asia’s Reemergence. Foreign Affairs 76: 44–59. [Google Scholar] [CrossRef]
- Ruan, Jianqing, and Xiaobo Zhang. 2014. “Flying Geese” in China: The Textile and Apparel Industry’s Pattern of Migration. Journal of Asian Economics 34: 79–91. [Google Scholar] [CrossRef]
- Shiozawa, Yoshinori. 2017. The New Theory of International Values: An Overview. In A New Construction of Ricardian Theory of International Values. Edited by Yoshinori Shiozawa, Tosihiro Oka and Taichi Tabuchi. Singapore: Springer, pp. 3–76. [Google Scholar]
- South, Robert B. 2016. The Flying Geese Metaphor: Export-Oriented Manufactures in Mexico. Regional Studies 50: 1483–95. [Google Scholar] [CrossRef]
- Suenaga, Keiichiro. 2002. Economic Development and Government: Toward a Theory of Economic Structural Change. Ph.D. thesis, Meiji University, Tokyo, Japan. (In Japanese). [Google Scholar]
- Suenaga, Keiichiro. 2012. The Flying-Geese Theory, Division of Labor, and Catching-up. The Review of Economics and Political Science 80: 303–22. (In Japanese). [Google Scholar]
- Suenaga, Keiichiro. 2015. The Division of Labour and Economic Development: An Evolutionary Approach. Research Paper of Japan Academy for International Trade and Business 4: 1–20. [Google Scholar]
- Suenaga, Keiichiro. 2018. Catching up and Innovation in the Asia Pacific: An Evolutionary Approach. In Innovation in the Asia Pacific: From Manufacturing to Knowledge Economies. Edited by Thomas Clarke and Keun Lee. Berlin/Heidelberg: Springer, chp. 4. pp. 83–100. [Google Scholar]
- Suenaga, Keiichiro. 2020. Evolution of Division of Labour in the British Cotton and Machine Industries during the ‘Invisible Hand’ Era. Review of Economics and Political Science 88: 647–62. [Google Scholar]
- Taglioni, Daria, and Deborah Winkler. 2014. Making Global Value Chains Work for Development. Economic Premise 143: 1–10. [Google Scholar]
- Tokunaga, Suminori, Yuko Akune, Maria Ikegawa, and Mitsuru Okiyama. 2015. Wagakuni Seizogyo no Sangyo Shuseki to Higashi Asia niokeru Nikkei Takokuseki Kigyo no Supply Chain Global ka no Keizaiteki Yoin Bunseki; RIETI Policy Discussion Paper Series 15-P-021; Tokyo: Research Institute of Economy, Trade and Industry. (In Japanese)
- Venables, Anthony J. 1996. Equilibrium locations of vertically linked industries. International Economic Review 37: 341–59. [Google Scholar] [CrossRef]
- von Thunen, Johann Heinrich. 1966. Der Isolierte Staat in Beziehung auf Land-wirtschaft und National Okonomie [The Isolated State]. Oxford: Pergammon Press. First published 1826. [Google Scholar]
- Wang, Fei, Junjie Xia, and Jiajun Xu. 2020. To Upgrade or to Relocate? Explaining Heterogeneous Responses of Chinese Light Manufacturing Firms to Rising Labor Costs. China Economic Review 60: 101333. [Google Scholar] [CrossRef]
- Watanabe, Tadashi. 2011. A Research on the Flying Geese Theory and Production Fragmentation. Journal of Economics 34: 41–58. (In Japanese). [Google Scholar]
- World Bank. 1993. The East Asian Miracle: Economic Growth and Public Policy. New York: Oxford University Press. [Google Scholar]
- Yeaple, Stephen. 2003. The Complex Integration Strategies of Multinationals and Cross Country Dependencies in the Structure of Foreign Direct Investment. Journal of International Economics 60: 293–314. [Google Scholar] [CrossRef]
- Yeung, Henry Wai-Chung, and Neil M. Coe. 2015. Toward a Dynamic Theory of Global Production Networks. Economic Geography 91: 29–58. [Google Scholar] [CrossRef]


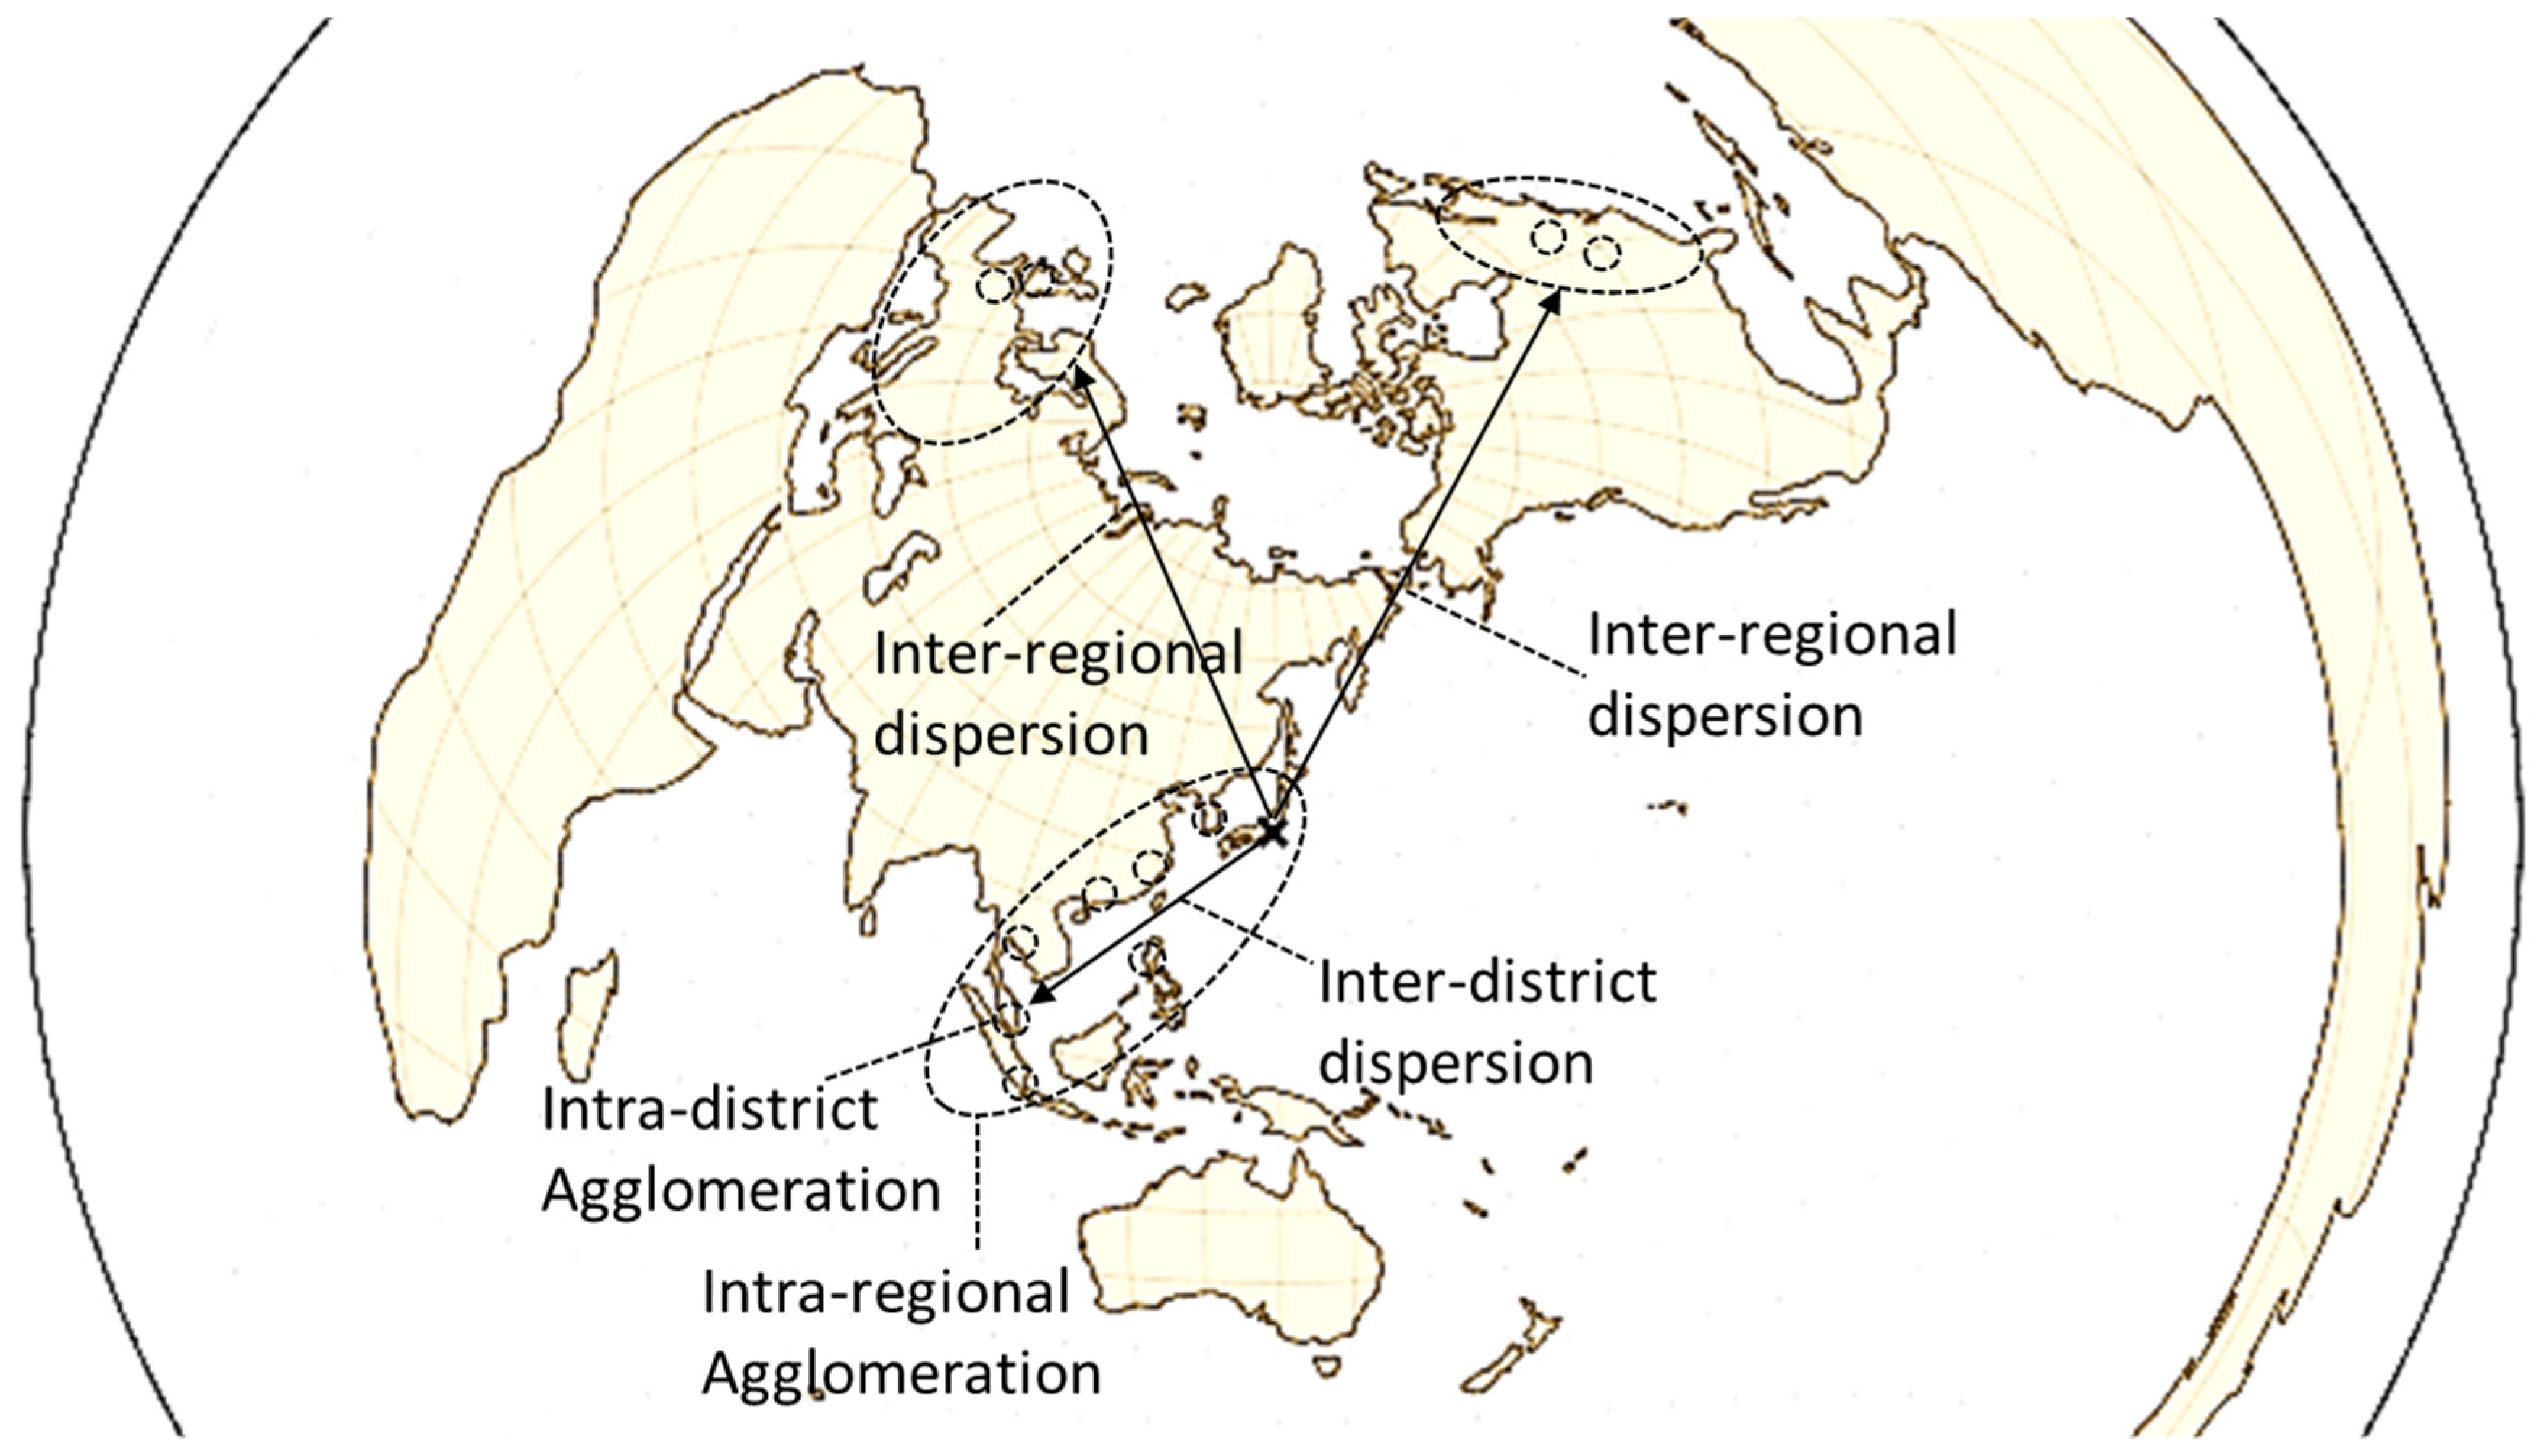
| Intra-District Agglomeration | Inter-District Dispersion/Intra-Regional Agglomeration | Inter-Regional Dispersion | |
|---|---|---|---|
| Area | Industrial zone | Continent | World |
| Example | Keihin | East and southeast Asia | US, EU |
| Structure | Vertical | Networked | Horizontal |
| Theory | Agglomeration | Fragmented flying geese | Strategic trade |
| Trip length | Less than 100 km | 100 to 5000 km | Longer |
| Lead time | Less than 2.5 h | 1 day to 2 weeks | 2 weeks to 2 months |
| Frequency | Once or more in a day | Once or more in a week | Less than once a week |
| Transport mode | Trucks | Trucks/ships/airplanes | Ships/airplanes |
| TFG | FFG | |
|---|---|---|
| Industrial structure | Integral | Disintegral |
| Industrial relationship | Intra-industry | Inter-industry |
| Network of production | National full-set | Regional networked |
| Speed of catching-up | Time-consuming | Time-saving |
| Sequence | Continuous | Discontinuous; “Leap-frogging”? |
Publisher’s Note: MDPI stays neutral with regard to jurisdictional claims in published maps and institutional affiliations. |
© 2022 by the authors. Licensee MDPI, Basel, Switzerland. This article is an open access article distributed under the terms and conditions of the Creative Commons Attribution (CC BY) license (https://creativecommons.org/licenses/by/4.0/).
Share and Cite
Bui, M.T.; Miura, R.; Saito, M.; Shibata, Y.; Suenaga, K. Fragmented Flying Geese (FFG) and Intra-Regional Agglomeration: Towards a Model Explaining Location Shifting of Japanese Multinational Corporations and the Electric Value Chains of ASEAN Economies. Economies 2022, 10, 238. https://doi.org/10.3390/economies10100238
Bui MT, Miura R, Saito M, Shibata Y, Suenaga K. Fragmented Flying Geese (FFG) and Intra-Regional Agglomeration: Towards a Model Explaining Location Shifting of Japanese Multinational Corporations and the Electric Value Chains of ASEAN Economies. Economies. 2022; 10(10):238. https://doi.org/10.3390/economies10100238
Chicago/Turabian StyleBui, Minh Tam, Rumi Miura, Masami Saito, Yusuke Shibata, and Keiichiro Suenaga. 2022. "Fragmented Flying Geese (FFG) and Intra-Regional Agglomeration: Towards a Model Explaining Location Shifting of Japanese Multinational Corporations and the Electric Value Chains of ASEAN Economies" Economies 10, no. 10: 238. https://doi.org/10.3390/economies10100238
APA StyleBui, M. T., Miura, R., Saito, M., Shibata, Y., & Suenaga, K. (2022). Fragmented Flying Geese (FFG) and Intra-Regional Agglomeration: Towards a Model Explaining Location Shifting of Japanese Multinational Corporations and the Electric Value Chains of ASEAN Economies. Economies, 10(10), 238. https://doi.org/10.3390/economies10100238