Article

Lemon Juice Assisted Green Synthesis of Reduced Graphene Oxide and Its Application for Adsorption of Methylene Blue

Department of Chemistry and Chemical Engineering, Graduate School of Science and Engineering, Yamagata University, Jonan 4-3-16, Yonezawa, Yamagata 992-8510, Japan
*
Author to whom correspondence should be addressed.
Technologies 2021, 9(4), 96; https://doi.org/10.3390/technologies9040096
Submission received: 12 October 2021 / Revised: 27 November 2021 / Accepted: 29 November 2021 / Published: 2 December 2021

Abstract

:
Sustainable synthesis of reduced graphene oxide (rGO) is of crucial significance within the development of carbon nanomaterials. In this study, a green and eco-friendly strategy for the synthesis of rGO using lemon juice as the reducing agent for graphene oxide (GO) without using toxic and harmful chemicals was demonstrated. The reduction with lemon juice effectively eliminated the oxygen-containing functionalities of GO and regenerated the conjugated systems as confirmed by the UV-vis and FTIR spectroscopic and X-ray diffraction analyses. Microscopic evaluation showed the successful manufacturing of exfoliated and separated few layers of nano-sheets of rGO. The application of the resultant rGO as an adsorbent for organic pollutants was investigated using methylene blue (MB) as a model. The adsorption kinetics of MB on rGO is best matched with the pseudo-second-ordered kinetic model and the Langmuir model with a high adsorption capacity of 132.2 mg/g. The rGO exhibited good reusability with a removal efficiency of 80.4% in the fourth cycle. This green method provides a new prospect for the large-scale production of rGO in a cost-effective and safe manner.

1. Introduction

The discovery of graphene [1] changed the scenario of the research world of nanomaterials. Graphene and its derivatives have become one of the most fascinating and hottest research topics in the empire of carbon nanomaterials [1,2,3,4,5,6,7,8,9], because of their versatile properties like high surface area, high mechanical strength, and excellent electrical and thermal conductivities, and promising applications in the field of material science and engineering, including energy storage, catalysis, drug delivery, sensing and biosensing, and water treatment [10,11,12,13,14,15,16,17,18] Various methods have been employed to produce graphene and its analogue, reduced graphene oxide (rGO). In particular, chemical reduction of exfoliated graphene oxide (GO) is efficient and advantageous in the large-scale production of rGO, because high-quality rGO with a relatively lower oxygen content can be obtained at a low cost in a short time [19,20]. Despite the significant advantages of this method, uses of toxic and dangerously unstable reducing agents including sodium borohydride [21], hydrazine and its derivatives [22,23], hydroquinone [24], and hydrogen sulfide [25] are a major limitation due to the requirements of exceptional care for handling and environmental hazard. Therefore, environmentally friendly and facile alternative methods are highly demanded to resolve the above-mentioned limitations. Aqueous-phase reduction of GO, utilizing safe and abundant natural sources as reducing agents, is a pioneering approach for efficient green and facile methods [2,3,26,27]. Among the various natural sources, plants allow scalable, safe, and cost-effective processes. Reported plant sources as reducing agents for the reduction of GO to rGO include green tea [6], mango leaves and potato [28], Aloe vera [29], eucalyptus bark [30], sugarcane bagasse [31], kaffir lime peel [32], Terminalia chebula seed [33], and rose water [34]. These green-synthesized rGOs were investigated for applications in sensing, photocatalysis, electrochemical charge storage, etc. Furthermore, some of these green synthesized rGOs have the tremendous ability to adsorb organic dyes [29,31,32,35]. Although a lot of plants have been investigated, plant sources accessible regardless of the region are still attractive for practical uses.
Lemons have a special taste and aroma and are extensively fed on globally. Lemon [Citrus limon (L.) Burm] is the second maximum planted citrus fruit [36]. As of 2016, India has been the world’s main lemon producer with 2.98 million tons of yearly manufacturing, while Mexico secured the second position with 2.43 million tons, and China become third with 2.33 million tons (www.atlasbig.com) (accessed on 8 October 2021) [37]. The huge production of lemons represents its high commercial value and consumption flow. Lemons are rich in phytochemicals including ascorbic acid, citric acid, sugars, and polyphenols [38,39,40,41] that can serve as reducing agents for the synthesis of various metal nanoparticles from their corresponding metal ions [42,43,44]. Specifically, the high contents of ascorbic and citric acids in lemons are well known, and the detail of the typical composition of lemon juice is summarized in a review by Szopa et al. [45]. Gurbani et al. employed a biogenic strategy for the fabrication of rGO using lemon juice [46]. The rGO based on lemon juice hybridized with Pt exhibits a higher catalytic ability in hydrogen production by water splitting than rGO prepared by reduction with ascorbic acid, while the optimization of synthetic conditions has not been addressed.
Therefore, in this paper, we demonstrate the preparation of rGO using lemon juice as an abundant, efficient, and economical reducing agent through a simple, ecofriendly, and cost-effective approach by optimizing the synthetic conditions and application of the obtained rGO as a potential adsorbent for the removal of dyes using methylene blue (MB) as a model compound.

2. Materials and Methods

2.1. Collection of Lemon Juice

Yellow lemon was purchased from a supermarket in Yonezawa city of Yamagata prefecture, Japan, and thoroughly washed with deionized distilled water. The juice was collected by squeezing the lemon followed by centrifugation (13,000 rpm, 10 min) and filtration, and finally stored at 4 °C for further use.

2.2. Materials

Graphite powder purchased from Sigma-Aldrich (St. Louis, MO, USA). Sodium borohydride (NaBH4), sodium nitrate (NaNO3), hydrogen peroxide (H2O2), sulfuric acid (H2SO4), MB, and sodium hydroxide (NaOH) were purchased from Kanto Chemical Co. Inc. (Tokyo, Japan). Potassium permanganate (KMnO4) was obtained from Tokyo Chemical Industry Co. Ltd. (Tokyo, Japan). All of the reagents were of analytical grade and were used directly without further purification. Deionized (DI) water was used throughout the study.

2.3. Measurements

UV-vis spectroscopic analysis was carried out on a HACH (Loveland, CO, USA) DR 5000 spectrometer. Absorption spectra were recorded at a resolution of 1 nm within 200–800 nm. Fourier-transform infrared (FTIR) spectra were recorded on a Shimadzu (Tokyo, Japan) IRSprit spectrometer equipped with a Shimadzu QATR-S single-reflection ATR accessory and a diamond prism with 32 scans (both for sample and air background) and a scan rate of 4 cm−1 s−1 approximately at 25 °C in the range of 400 to 4000 cm−1. Approximately 0.5 mg of samples were used for the measurements. Scanning electron microscopy (SEM) measurement was conducted on a Hitachi (Tokyo, Japan) SU-8000 microscope at accelerating voltages of 10 and 15 kV. Energy-dispersive X-ray spectroscopy (EDX) analysis was conducted on a JEOL (Tokyo, Japan) JSM-6510A analytical scanning electron microscope equipped with a JEOL JED2300 EDX spectrometer operated at an acceleration voltage of 10 kV using sample as a compressed disk placed on an SEM pin with the help of double-sided carbon tape. Transmission electron microscopy (TEM) measurement was conducted on a JEOL TEM-2100F field emission electron microscope. X-ray diffraction (XRD) analysis was conducted on a Rigaku (Tokyo, Japan) MiniFlex 600 diffractometer with Cu-Kα radiation. Raman spectra were recorded on a JASCO (Tokyo, Japan) RPM-320 spectrometer with a laser of 532 nm using powder samples. Thermogravimetric analysis (TGA) was carried out on a Seiko Instruments (Tokyo, Japan) TG/DTA 6200 (EXSTER6000) at a heating rate of 10 °C min−1 under N2.

2.4. Synthesis of Graphene Oxide (GO)

GO was prepared by a modified Hummer’s method based on previous reports [28,47]. Briefly, 2 gm of graphite powder was mixed with 80 mL of concentrated sulfuric acid under ice bath conditions by maintaining the temperature below 0–5 °C. After 30 min, 2 gm of sodium nitrate was added, and the mixture was stirred for 1 h. Then, 12 gm of KMnO4 was added slowly to the mixture, and the temperature was controlled below 10 °C with stirring for 1 h. Subsequently, the flask was transferred to an oil bath, maintained at 40 °C, and the mixture was constantly stirred for 2 h. After the addition of 80 mL of water, the mixture was stirred for another 1 h at 90 °C, and then, at room temperature overnight. To control the pH of the reaction medium and to terminate the reaction, 180 mL of water and 20 mL of H2O2 were sequentially added to the reaction mixture. The color of the suspension changed from brown to light yellow indicating oxidation of graphite to GO. After centrifugation of the solution at 10,000 rpm for 10 min, GO was washed with 2 M HCl to remove metal ions and with distilled water several times. The resulting GO was vacuum-dried at 50 °C for 24 h and stored for further use for the preparation of rGO.

2.5. Green Synthesis of rGO Using Lemon Juice (Typical Procedure)

GO (50 mg) was mixed with 20 mL of lemon juice by sonication, and the pH of the mixture was adjusted to 12.3 using 4 M aqueous NaOH. Then, the mixture was stirred in an oil bath at 80 °C for 2 h. After that, the resultant black product was collected by centrifugation and washed with water four times. Then, the product was vacuum-dried for 24 h at 50 °C and stored at 25 °C for further use.

2.6. Preparation of Methylene Blue (MB) Solutions

A stock solution of 1000 mg/L MB was made by dissolving MB powder in water. The solution used in the experiments was prepared by diluting the stock solution.

2.7. The Adsorption of MB on rGO

To evaluate the adsorption kinetics and the effect of contact time (batch tests), adsorption of MB was carried out by adding 15 mg of rGO into 100 mL of 20 mg/L MB solution in a 200 mL round bottom flask. The resulting mixture was stirred at 150 rpm using a magnetic stirrer up to 2.5 h at three different temperatures (25, 40, and 60 °C). At the specified time, rGO was precipitated by centrifugation at 10,000 rpm for 5 min, and the final concentration of MB in the supernatant was determined from optical absorption at 665 nm. Similarly, adsorption isotherm was obtained by batch experiments adding 10 mg of rGO in 100 mL of MB solutions with different concentrations in the range of 8–20 mg/L with the step of 2 mg/L at 25 °C. Dependence of removal of MB on the mass of rGO was determined by using different addition masses of rGO (4–9 mg with the step of 1 mg) into a series of Erlenmeyer flasks, which contain 50 mL of 20 mg/L MB solution. The effect of pH in the range of 2–9 (step size: 1) was studied by adding 8 mg of rGO in 100 mL of 16 mg/L MB solution at 25 °C. The initial pH of the MB solution was adjusted by HCl (0.1 M) and NaOH (0.1 M).
The adsorption capacity ( q t , the amount of adsorbed MB per unit mass of adsorbent) of rGO was calculated by the following equation [35]:
q t = ( C 0 C t ) V W
where C 0 and C t are the concentrations (mg/L) MB at initial and at time t, respectively; V represents the volume of the solution (L); and W is the adsorbent mass (g). C e (mg/L) and q e denotes the equilibrium concentration and the equilibrium adsorption capacity, respectively. The removal efficiency (RE%) was calculated by the following equation [35,48]:
R E % = ( C 0 C e ) C 0   ×   100

3. Results and Discussion

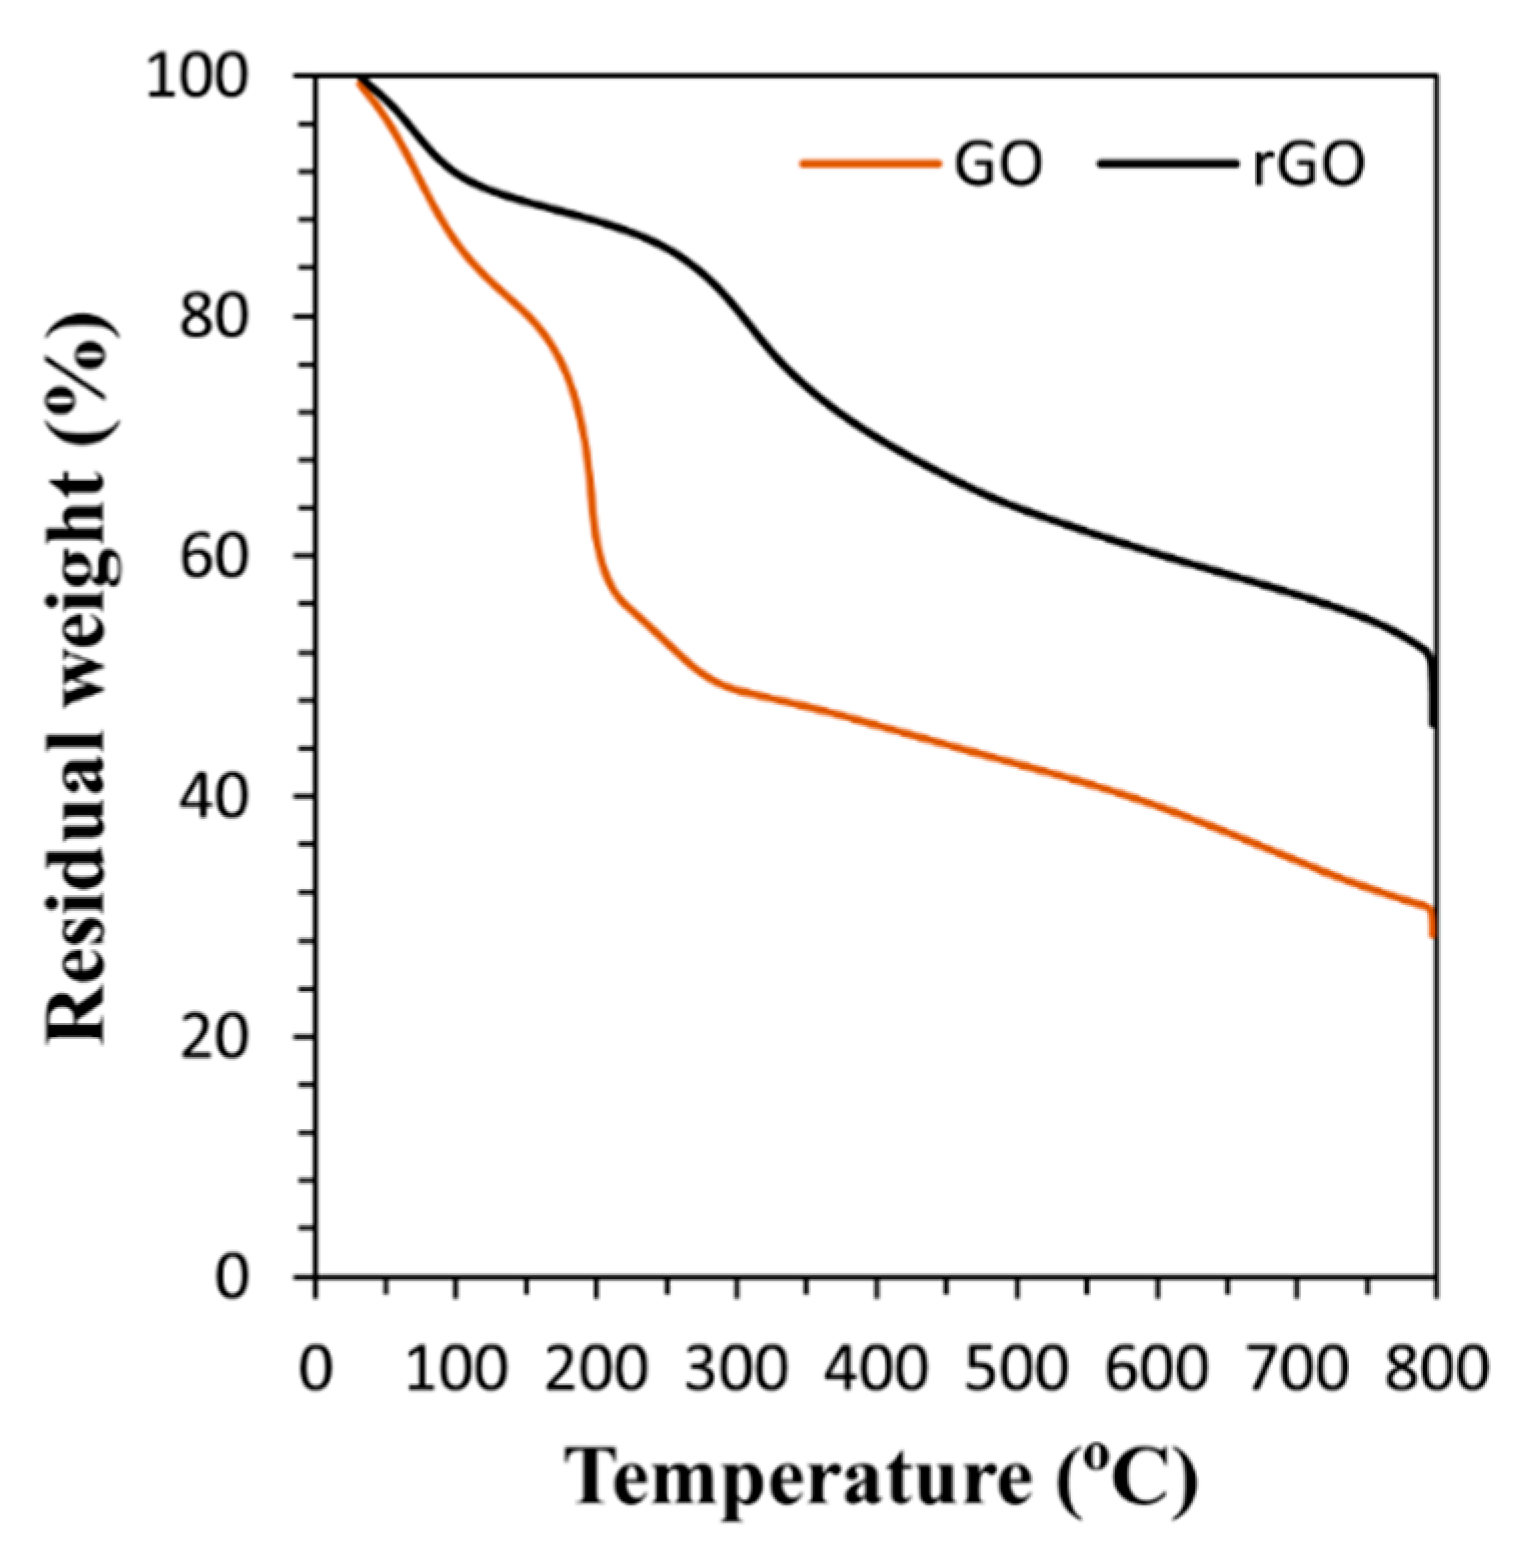
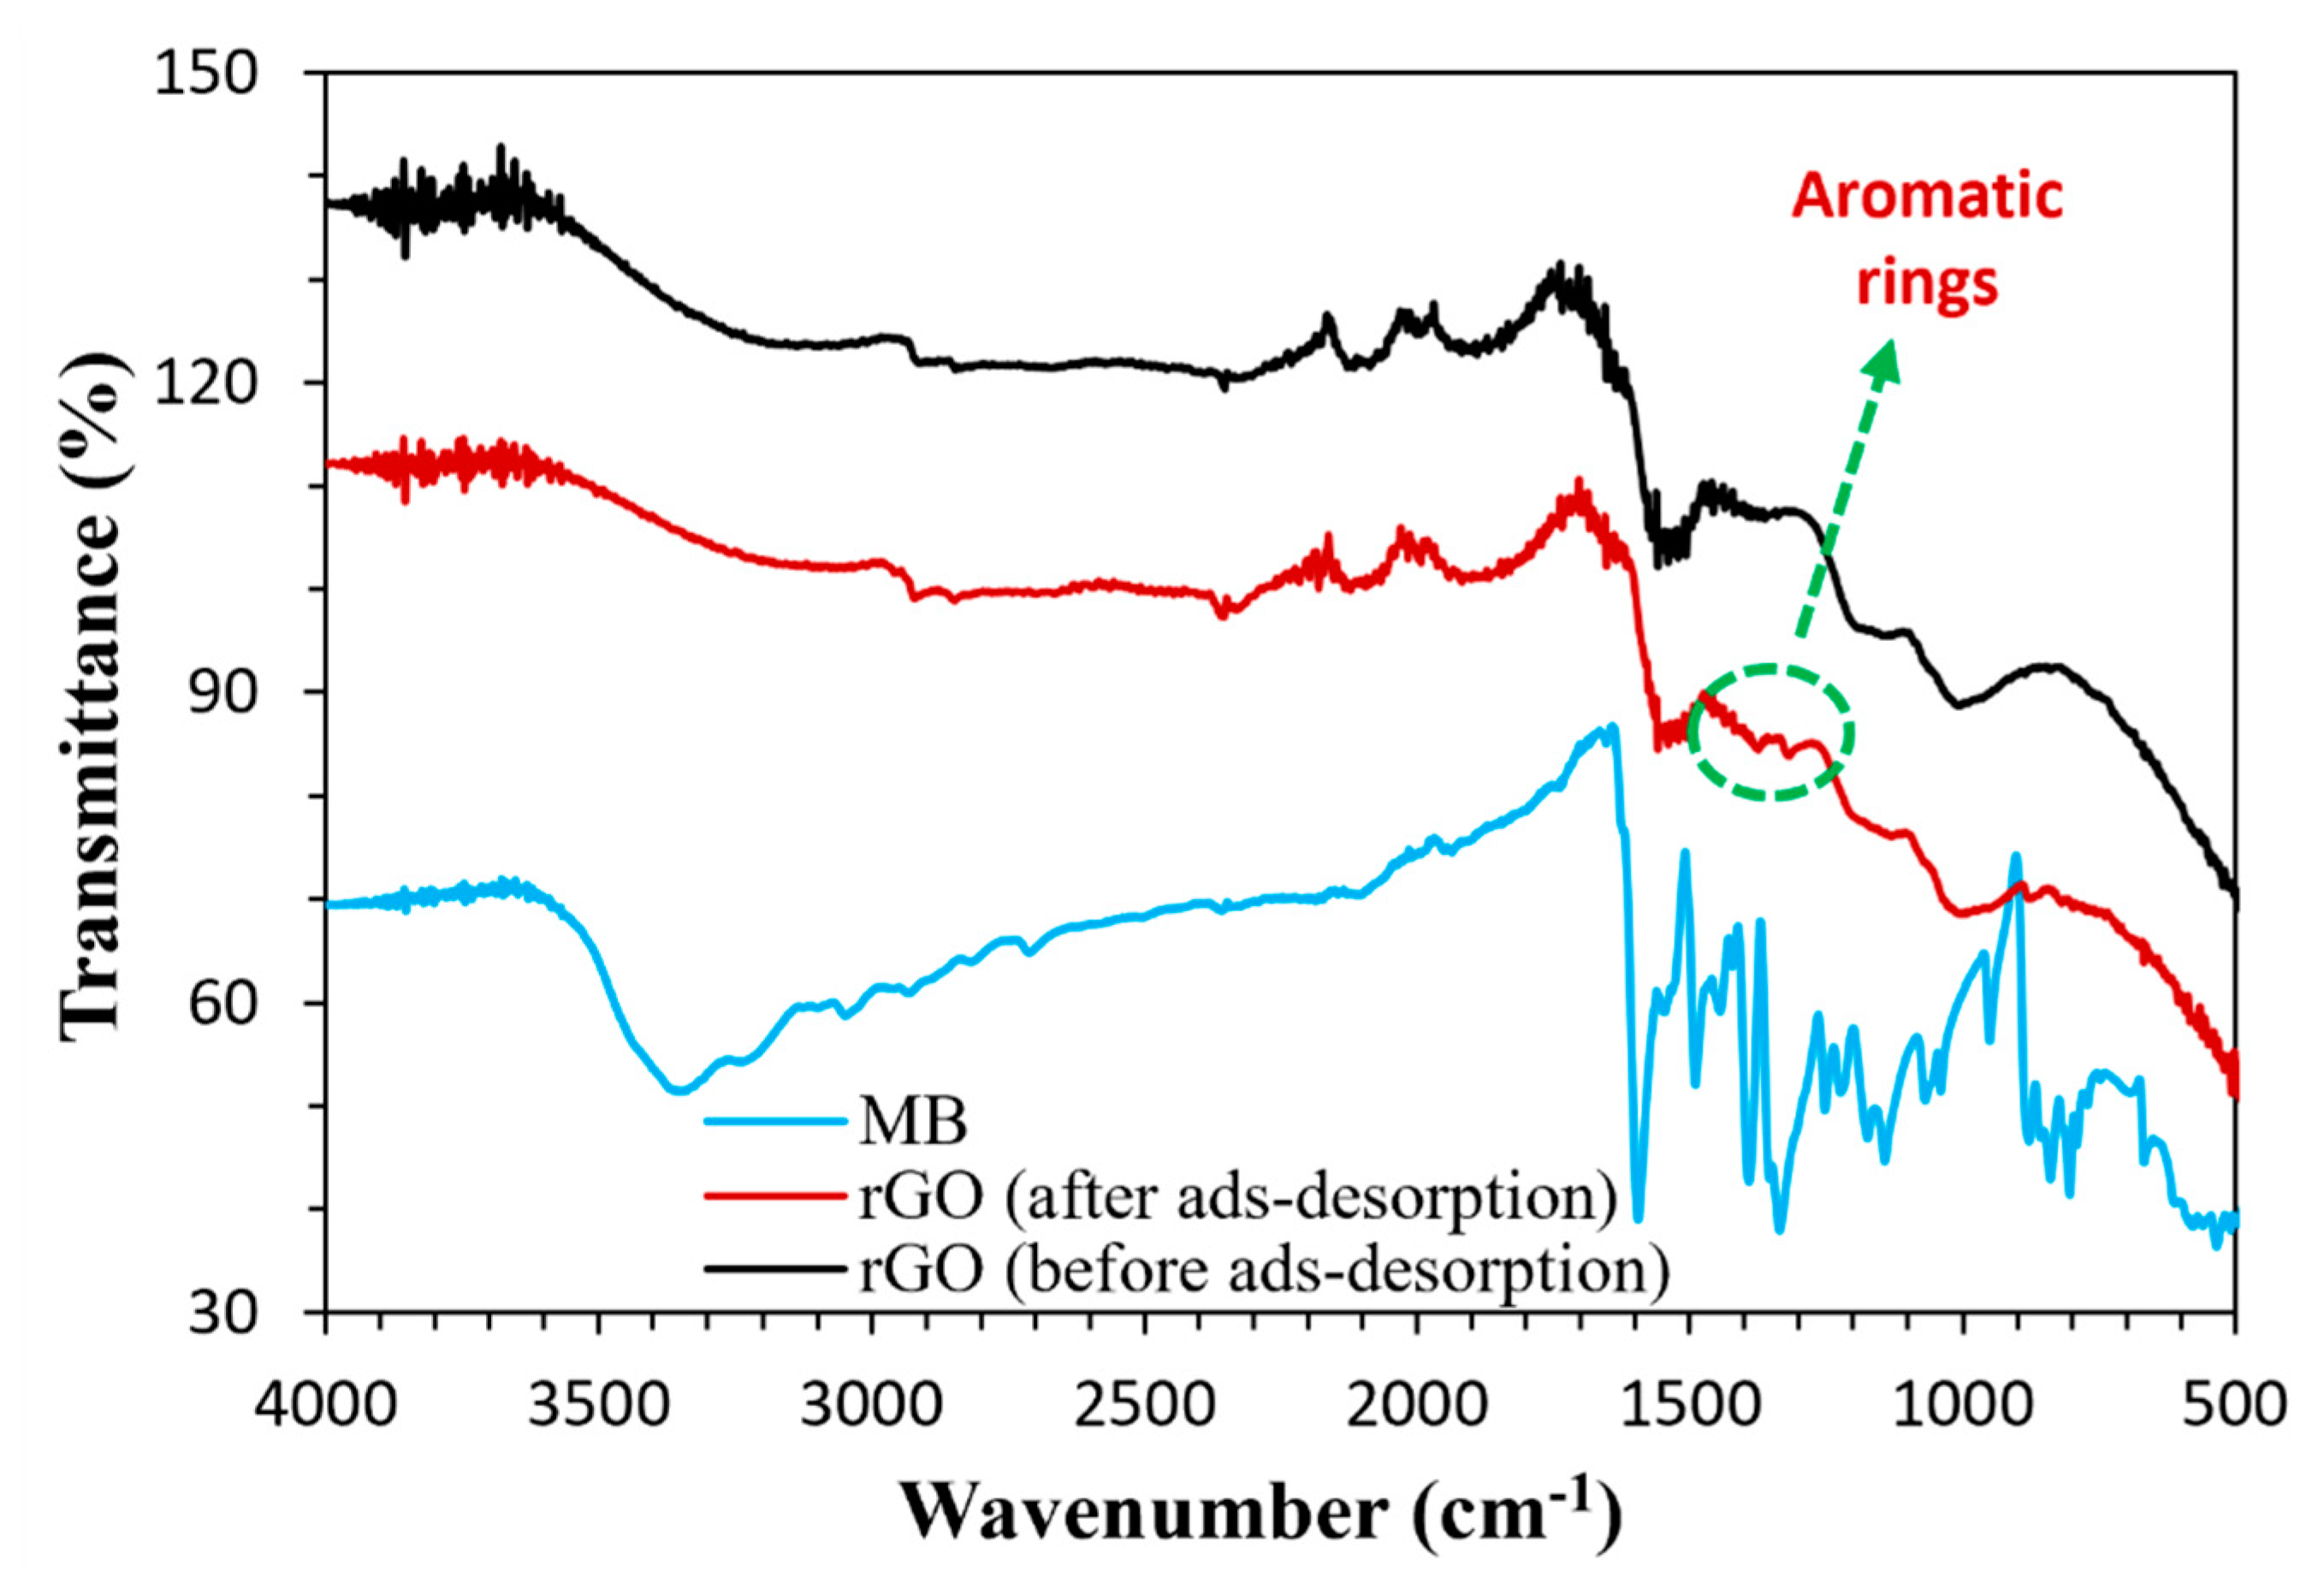
3.1. Characterization

The reduction of GO to rGO was carried out using lemon juice as an efficient and economical green reducing agent. The change of the color of the reaction mixture from brownish to deep black indicates the reduction of GO. The reduction of GO to produce rGO was first confirmed by UV-vis spectroscopy with the characteristic absorption peaks of GO and rGO (Figure 1). We employed rGO prepared by the reduction of GO with lemon juice at 80 °C for 2 h. The absorption spectrum of GO exhibits a peak at 231 nm corresponding to the π – π * transitions, whereas the spectrum of rGO shows a broad absorption peak around 272 nm due to the π – π * transitions of more conjugated double bonds [30]. In addition, the cut-off wavelength significantly shifted to the infrared region. This change indicates that the conjugated structures were regenerated by the reductive removal of oxygen functionalities in GO cleaving the conjugated system.
The optical band gap energy was estimated from UV-vis results using the following Tauc’s expression [49]:
α h ν = B ( h ν E g ) m
where α is the absorption coefficient, B is a constant, h ν is the photon energy, Eg is the optical band gap and m = ½ for direct allowed transitions. The optical band gap was obtained from the extrapolation of the linear region to the x-axis of the ( α h ν )2 vs. h ν plot (Figure 1b,c). The optical band gap of GO decreases from 4.25 eV to 2.95 eV upon the reduction by lemon juice, supporting the formation of rGO. A similar trend was reported for the reduction of GO using the gas-based hydrazine method by Mathkar et al. [50] and for the reduction of GO using mild reagents (glucose, fructose, and ascorbic acid) by Velasco-Soto et al. [51].
The time-dependent progress of the reaction was monitored by UV-vis spectroscopy (Figure 2). The absorption maxima red-shifted as time with the increasing of the absorption intensity. The spectra show that the red shift reaches the characteristic peak of rGO at 272 nm at 30 min and that the intensity becomes identical, suggesting the completion of the reduction. The slight difference in the peak intensity probably originates from the sedimentation of rGO during the reaction and measurement due to the low dispersibility as the loss of the functional groups by the reduction.
To understand the role of temperature on the reduction of GO by lemon juice, the reaction was conducted at different temperatures and the obtained rGO was characterized by UV-vis and FTIR spectroscopy and XRD analysis (discussed later). UV-vis absorption spectra of reaction mixtures (Figure 3) show that the intensity of absorption maxima increased as the temperature increased, indicating speeding up of the reduction.
The surface functionality of GO and rGO was evaluated by FTIR analysis. Figure 4 shows the FTIR spectra of GO and rGO synthesized using lemon juice at different temperatures, clearly reflecting the removal of the oxygen functionalities in GO.
The spectrum of GO exhibits a broad band at 3447 cm−1 of the O–H stretching of the hydroxyl group [17,28,52]; sharp peaks of the C=O stretching at 1705 cm−1 [15,28] and C=O bending at 1610 cm−1 [28]; and C–O stretching of C-O-H stretching at 1056 cm−1, ester group (C–O) at 1398 cm−1, and epoxy groups at 1215 cm−1 [3,6,52,53]. In the spectra of rGO, the peaks at 1705 cm−1 are completely unobservable, while the intensities of the peaks at 1056 cm−1 and 3447 cm−1 gradually decreased due to the accelerated reduction of GO as the temperature increased. The signals finally became almost unobservable as can be confirmed by the low signal to noise ratios, indicating that the oxygen functionalities are adequately removed in comparison to the previously reported rGO based on lemon juice [46]. The intensity of detectable peaks that appeared in the range of 1000–1400 cm−1 was considerably weaker. By contrast, the peak at 1570 cm−1 unobservable for GO is assignable to the in-plane vibration of the C=C skeleton and adsorbed phytochemicals, mainly carboxylate moieties of lemon juice [44]. These changes in FTIR spectra clearly indicate that GO was successfully reduced to rGO and higher temperatures make GO reduction more convenient.
To characterize the interlayer spacing and crystal structure, powder XRD analysis was carried out. Figure 5 shows the XRD patterns of graphite powder, GO, and rGO synthesized using lemon juice at different temperatures.
The XRD pattern of graphite powder exhibits a characteristic diffraction peak at 26.6° corresponding to the basal reflection (002) with an interlayer d-spacing of 0.335 nm [30]. On the other hand, the diffraction peak of GO appeared at a lower diffraction angle of 12.04° with interlayer d-spacing of 0.734 nm widened the presence of functional groups and the intercalation of water molecules. The XRD patterns of rGO prepared by the reduction of GO with lemon juice at different temperatures shows a broad peak approximately at 24°. At lower temperatures, the GO peak is still observed with a broad shoulder of the characteristic peak of rGO, indicating the incomplete reduction of GO. As the temperature increased the sharpness and intensity of the peak improved. At 80 °C, the peak was observed at 24.26° with interlayer d-spacing of 0.367 nm, while the diffraction peak at 12.04° [30] was unobservable, indicating the completion of GO reduction. This interlayer spacing of rGO, identical to those of previously reported rGO and close to that of graphite, indicates the efficient removal of oxygen functionalities of GO by reduction [6,30,54]. However, the shape of the characteristic diffraction of rGO produced in this work is broader than the previously reported lemon-juice-based rGO, showing both shape and broad peaks [46]. The sharp peak is assignable to the graphitic structure that remained unreacted in the GO precursor, and the sufficient oxidation to GO probably resulted in the formation of well-exfoliated rGO in this work. The broad and weak (002) reflection of rGO is also attributed to a small size (<1 µm) and disordered stacking of rGO sheets, as similarly reported by Penki et al. [55].
Overall, at 25 °C, all the analytical data indicate that the reaction does not proceeds insufficiently and that the product partially contains the GO structure. At 40 °C, the UV-vis and IR spectra show that the reaction proceed more than 25 °C but less than 60 °C, and the XRD profile shows the absence of the diffraction originating from layers of GO. The identical UV-vis spectra of the products obtained at 60 and 80 °C indicate that the conjugation length of rGO reached effective conjugation length of UV-vis spectroscopy. The XRD profiles indicate that the diffraction of rGO obtained at 80 °C is clearer than that obtained at 60 °C containing a trace amount of functional groups as confirmed by the IR spectra. Therefore, the rGO synthesized at 80 °C for 2 h was used for further characterizations and adsorption study.
Electron microscopy analysis was employed for morphological studies of the obtained rGO. Figure 6 shows the SEM images GO and rGO. The SEM image of GO shows the 3D-stacked layers of GO sheets. By contrast, the SEM image of rGO shows exfoliated and separated few layers of sheets in a similar manner with previously reported rGO [31,35,52,56].
The TEM image (Figure 7) also proved that the lemon juice-based synthetic process successfully produced exfoliated nano-sheets of rGO. The number of layers of 2D nanosheets of rGO cannot be determined exactly, but the absence of graphitic aggregates indicates the efficient formation of exfoliated rGO sheets.
A qualitative analysis of the graphene structures in GO and rGO synthesized using lemon juice was carried out by Raman spectroscopy (Figure 8). The Raman spectra of GO exhibited the D and G bands as the major characteristic bands at 1348 cm−1 and 1589 cm−1, respectively, which are shifted to 1344 cm−1 (D band) and 1574 cm−1 (G band) after reduction. This behavior complies with the previously reported works [52,53,57,58]. The D band corresponding to sp3 carbon atoms results from the formation of structural defects, whereas the G band referred to the vibration of sp2 carbon atoms. The intensity ratio of the D band and G band (ID/IG) can be used to estimate the degree of disorder in the graphitic structure [3,58], where the higher ID/IG values of rGO than their counterparts suggest a high degree of disorder, in contrast, the lower values indicate fewer defects [56,59,60,61]. As shown in Figure 8, the ID/IG value of rGO is calculated to be 1.05, which is closely resembles the value of GO (1.04), indicating that the obtained rGO contains a structural disorder almost identical to GO. Whereas previously reported lemon juice-based rGO (0.99) exhibited fewer structural defects than GO (0.83) [46], it is unable to compare the difference with this work due to the presence of the graphitic domain in GO in the previous work.
Figure 9 illustrates the EDX spectra of rGO synthesized using lemon juice and GO. The spectrum of rGO (C = 81%, O = 16%, and Na = 3%) exhibits a higher intensity ratio of carbon to oxygen than that of GO (C = 61% and O = 39%). The higher intensity ratio of carbon to oxygen originated from the elimination of the oxygen functionalities in GO during the reduction process, confirming the formation of rGO using lemon juice. In the case of rGO, the peak at ~1.1 keV associated with Na in sodium carboxylate moieties probably originating from NaOH contained in the reaction medium.
The thermal stability of rGO was evaluated by TGA (Figure 10). The TGA curve of GO shows a three-stage weight loss. The first weight loss of approximately 17% before 120 °C can be attributed mainly to the removal of water molecules trapped between GO sheets. The next approximately 32% weight loss up to 300 °C originates mostly from the pyrolysis of functional groups. The third weight loss from 300 °C to 800 °C, was approximately 15%, which corresponds to the elimination of remaining functional groups and combustion of the carbon skeleton of GO. The TGA curve of rGO shows the first to third weight losses of approximately 10, 15, and 15%, respectively. The lower weight losses than that of GO, specifically at the first and second stages, are due to the removal of the functional groups. Previous works reported by Gan et al. [31] and Hou et al. [62] also showed a similar trend of weight losses for GO and rGO.

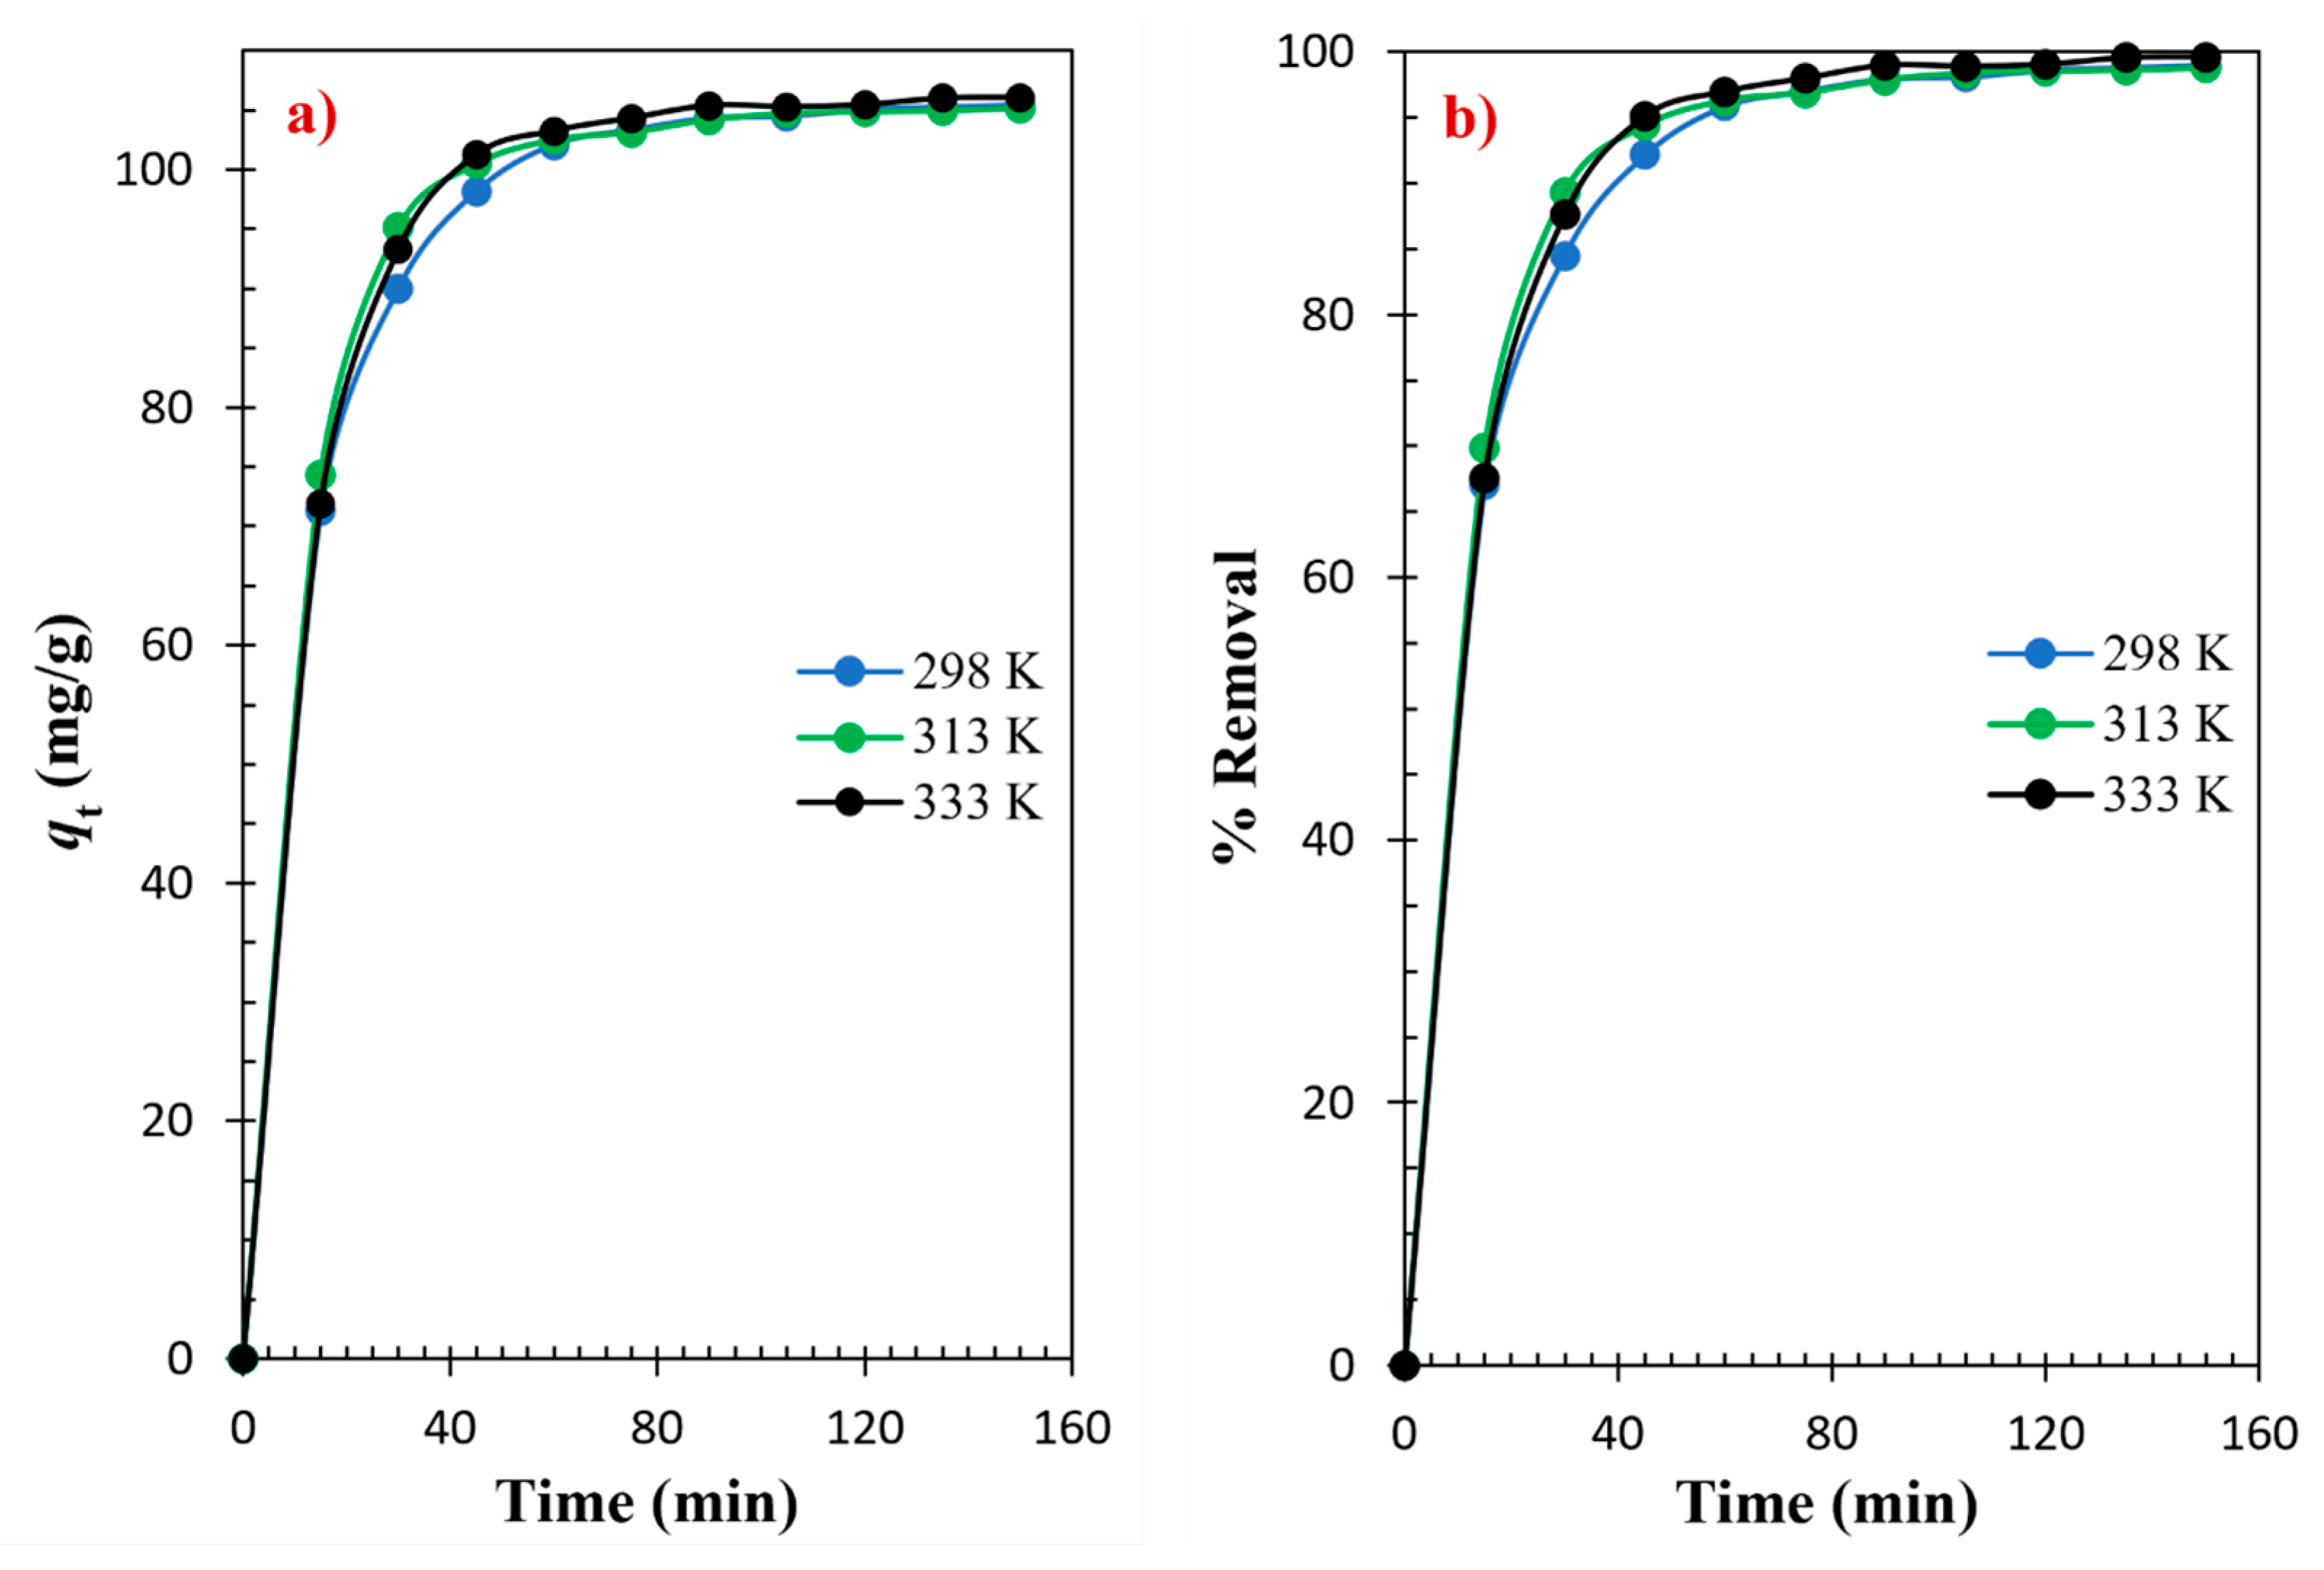
3.2. Adsorptions Kinetics

The adsorption of MB onto obtained rGO in an aqueous medium was studied at three different temperatures (298, 313, and 333 K) using 20 mg/L of MB and 25 mg of rGO. In every case, rapid adsorption took place within the first 15 min, and then the rates were slowed down. The adsorption reached equilibria in 90 min (Figure 11a) with a removal efficiency of 98 to 99% (Figure 11b). Thus, we set 90 min as the reference time for the upcoming adsorption study.
The experimental data were fitted to four kinetic models, namely pseudo-first and pseudo-second orders, intraparticle diffusion (IPD), and Boyd kinetic models [29,35,57,63,64] (Figure 12), and the obtained parameters of the adsorption kinetics of MB on rGO are summarized in Table 1. The kinetic model plots fitted the pseudo-second-order model (Figure 12b) better than the pseudo-first-order model (Figure 12a) as can be confirmed by the higher correlation coefficients (R2) exceeding 0.999. In addition, the calculated qe (cal) values from the pseudo-first-order model (93.4, 77.1, 86.6 mg/g) were lower than the experimental data (104.3, 104.2, 105.4 mg/g), while the values from the pseudo-second-order model (111.1, 108.7, 111.1 mg/g) agreed well with the experimental data. The kinetics obeying the pseudo-second-order kinetic model means that the adsorption of MB on rGO synthesized using lemon juice is mostly controlled by chemisorption.
The transport mechanism of the adsorption process was investigated by the Weber and Morris intra-particle diffusion (IPD) [56] and Boyd kinetic [57] model. IPD model considers multi-linearity in qt vs. t1/2 plots with two or three steps in the whole adsorption process. If a plot becomes a straight line passing through the origin, the intra-particle diffusion is the rate-limiting step. In our study, the plots of the IPD model consisted of two parts and did not pass through the origin (Figure 12c), indicating that intraparticle diffusion is not the rate-limiting step of this adsorption process. The initial and later stages are associated with the transportation of MB to the exterior surface of rGO and gradual adsorption, respectively. In addition, calculated Ri values less than 0.5 also testify surface adsorption of MB on rGO [58]. Furthermore, the actual rate-limiting step was determined with the help of the Boyd kinetic model, where the Boyd number, Bt was plotted against time, t (Figure 12d). If a plot shows a linear relationship and passes through the origin, the intra-particle diffusion is the rate-limiting step, on the other hand, if the plot is linear and does not pass through the origin, external mass transfer is the rate-limiting step. In our study, the plots of the Boyd model provided a linear relationship without passing through the origin (Figure 12d). Thus, the transportation of MB to the exterior surface of rGO governs the rate-limiting step of the adsorption process. A similar result was reported for the adsorption of MB on rGO by Bhattacharya et al. [27].

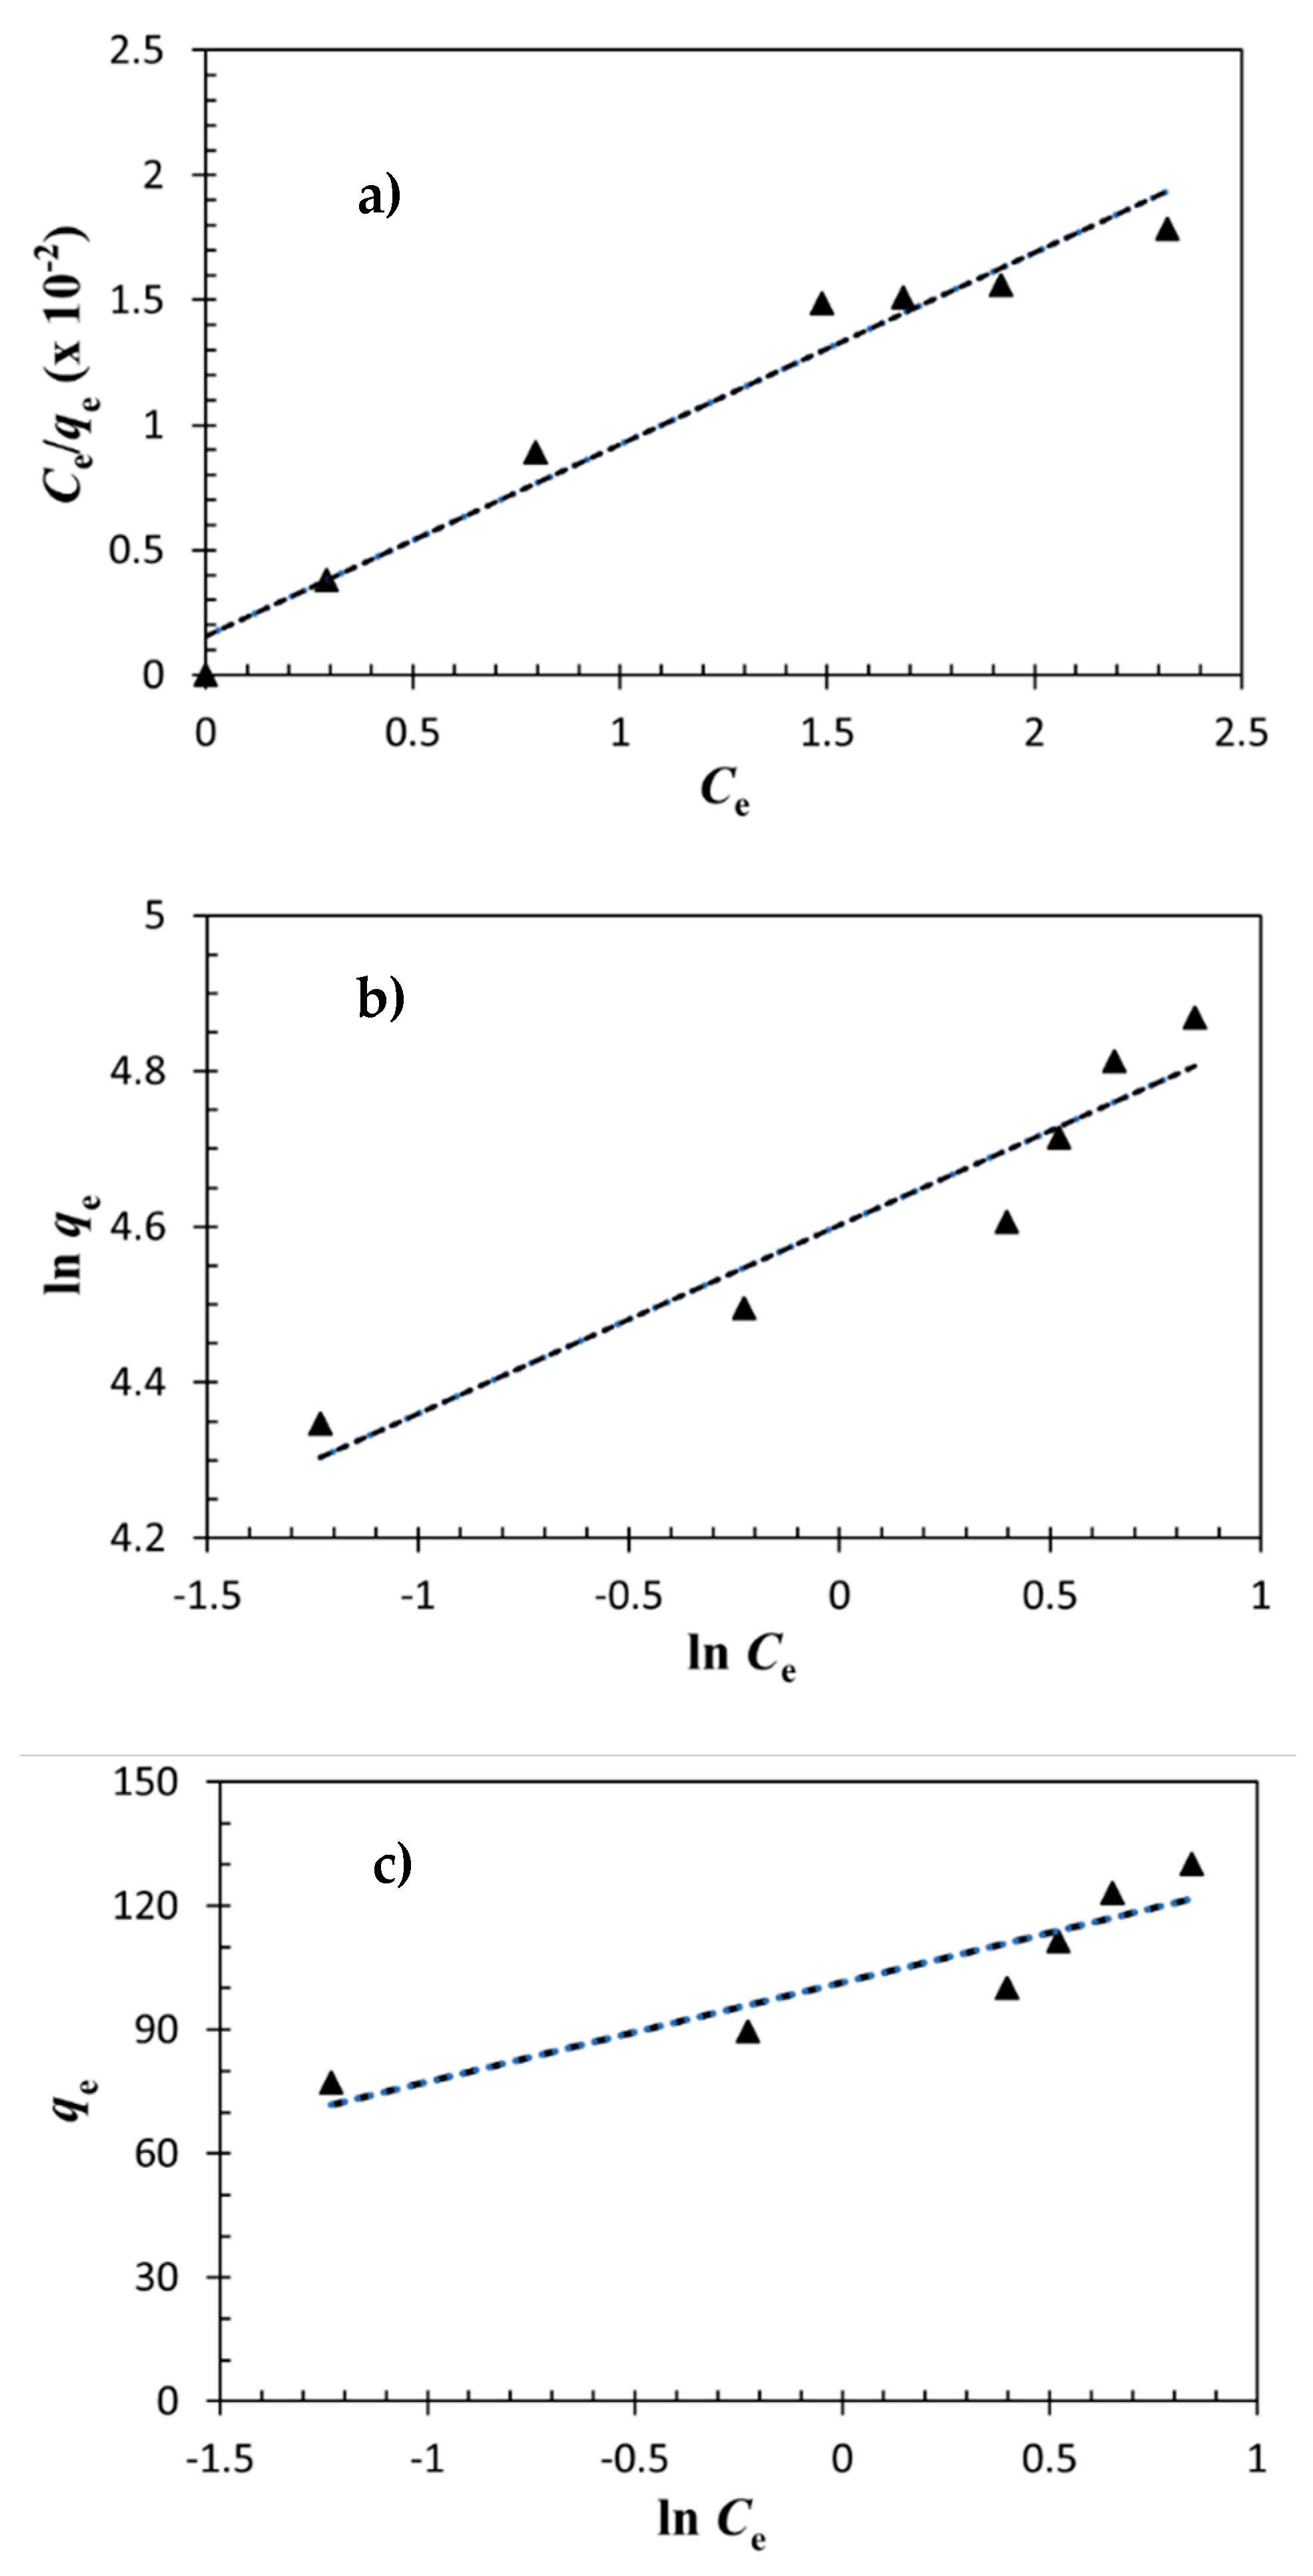
3.3. Adsorption Isotherm

The interaction of dyes with adsorbents can be interpreted from adsorption properties and equilibrium data, which is referred to as the adsorption isotherm. The adsorption isotherms were studied at 298 K over a span of 90 min. In this study, we applied the Langmuir, Freundlich, and Temkin models. The observed results are displayed in Figure 13 and the parameters are summarized in Table 2 with the mathematical expressions.
The adsorption behavior fitted best to Langmuir’s model. The Ce/qe vs. Ce plot for the adsorption of MB on rGO shows a linear relationship with a good correlation coefficient (R2) of 0.988. By contrast, the plots of Freundlich and Temkin models, typically suitable for systems with heterogeneous surface and adsorbate-adsorbate interactions respectively, are not linear with low R2. This result indicates the homogeneous surface of rGO for mono-layered adsorption. In addition, the dimensionless constant RL referred to as the separation factor or the equilibrium parameter was calculated, and the obtained values (Table 2) lie between 0 to 1, indicating favorable adsorption isotherm. Moreover, the calculated maximum amount of dye per unit weight of adsorbent for complete monolayer coverage (qm) value was comparable to the experimental values, testifying to the applicability of the Langmuir isotherm model. Compared with other reported graphene-based adsorbents, rGO produced in this study exhibits a qm value (130.2 mg/g) higher than exfoliated GO (17.3 mg/g) [57], rGO-based hydrogel (7.85 mg/g) [11], nanocomposite of β-cyclodextrin/magnetic GO (94 mg/g) [65], interconnected rGO (106.0 mg/g) [66], rGO (121.95 mg/g) synthesized using citric acid [35], glycine-functionalize rGO (117.6 mg/g) [63], suggesting that lemon juice-based rGO is a prominent candidate for removal of organic pollutants.

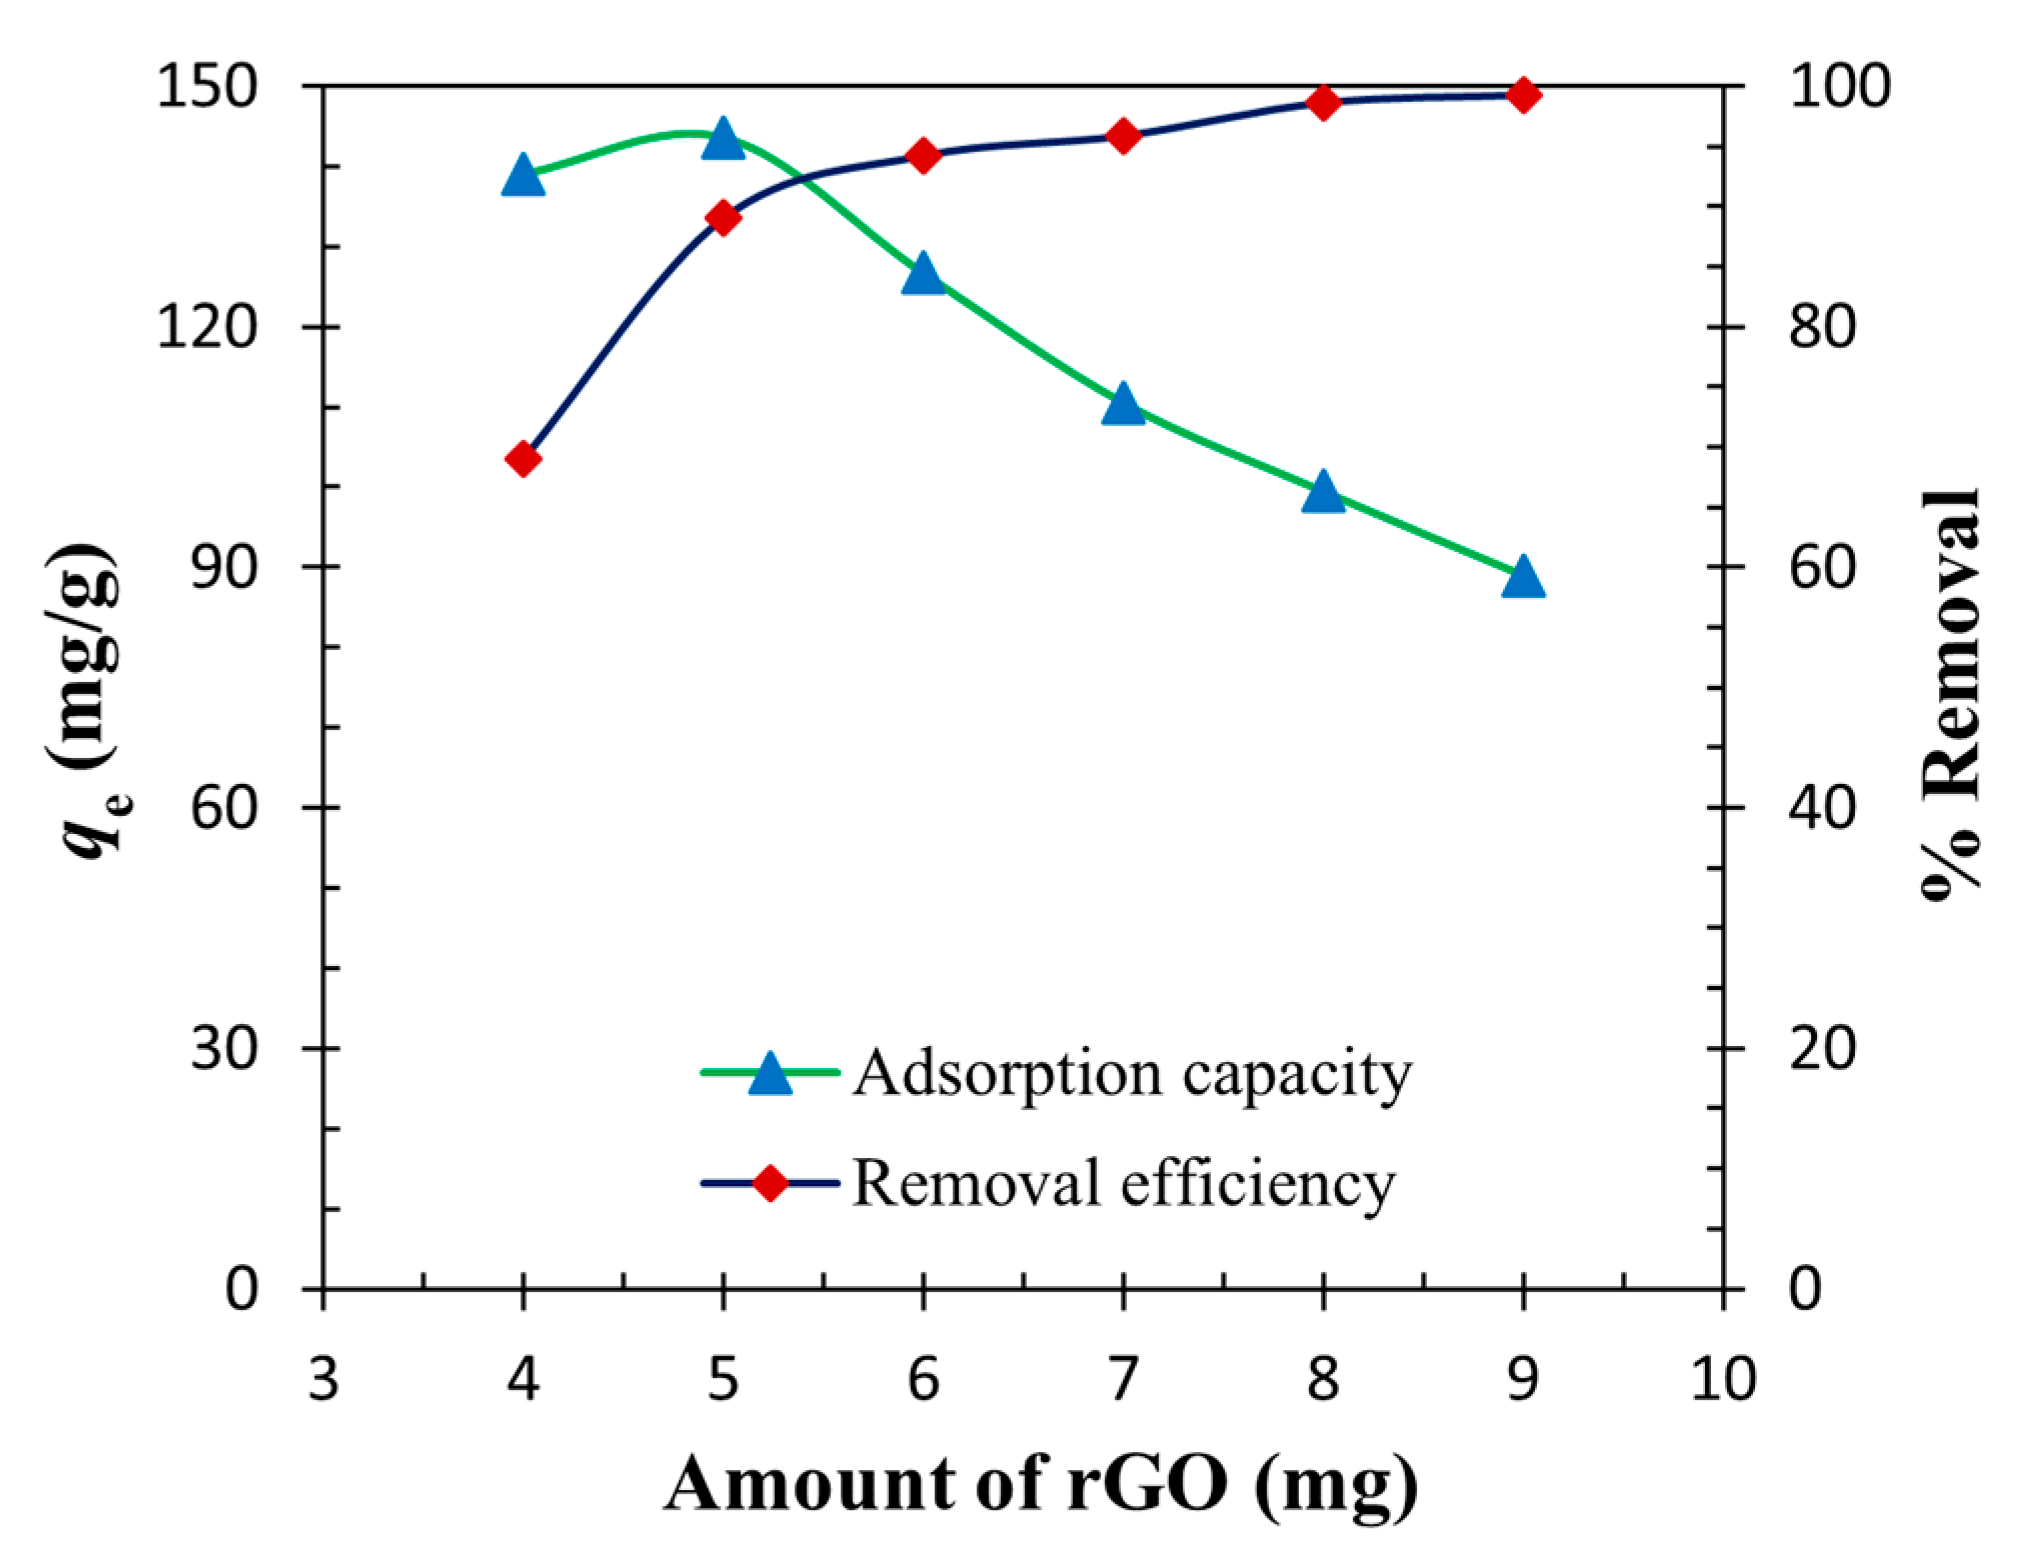
3.4. Effect of Mass of rGO

The maximum efficiency of this rGO toward the adsorptions of MB over rGO was investigated using different masses of rGO (4–9 mg) toward a fixed initial concentration of MB (20 mg/L) at 298 K. The effect of the mass of rGO on the adsorption of MB is demonstrated in Figure 14. The removal efficiency of MB increased from 69.0 to 99.3% by an increase of rGO from 4 to 9 mg due to the increase in the adsorption sites. In contrast, the adsorption capacity dropped from 143.6 to 89.0 mg/g as the increase of mass of rGO from 5 to 9 mg due to the increase in the unutilized adsorption sites.

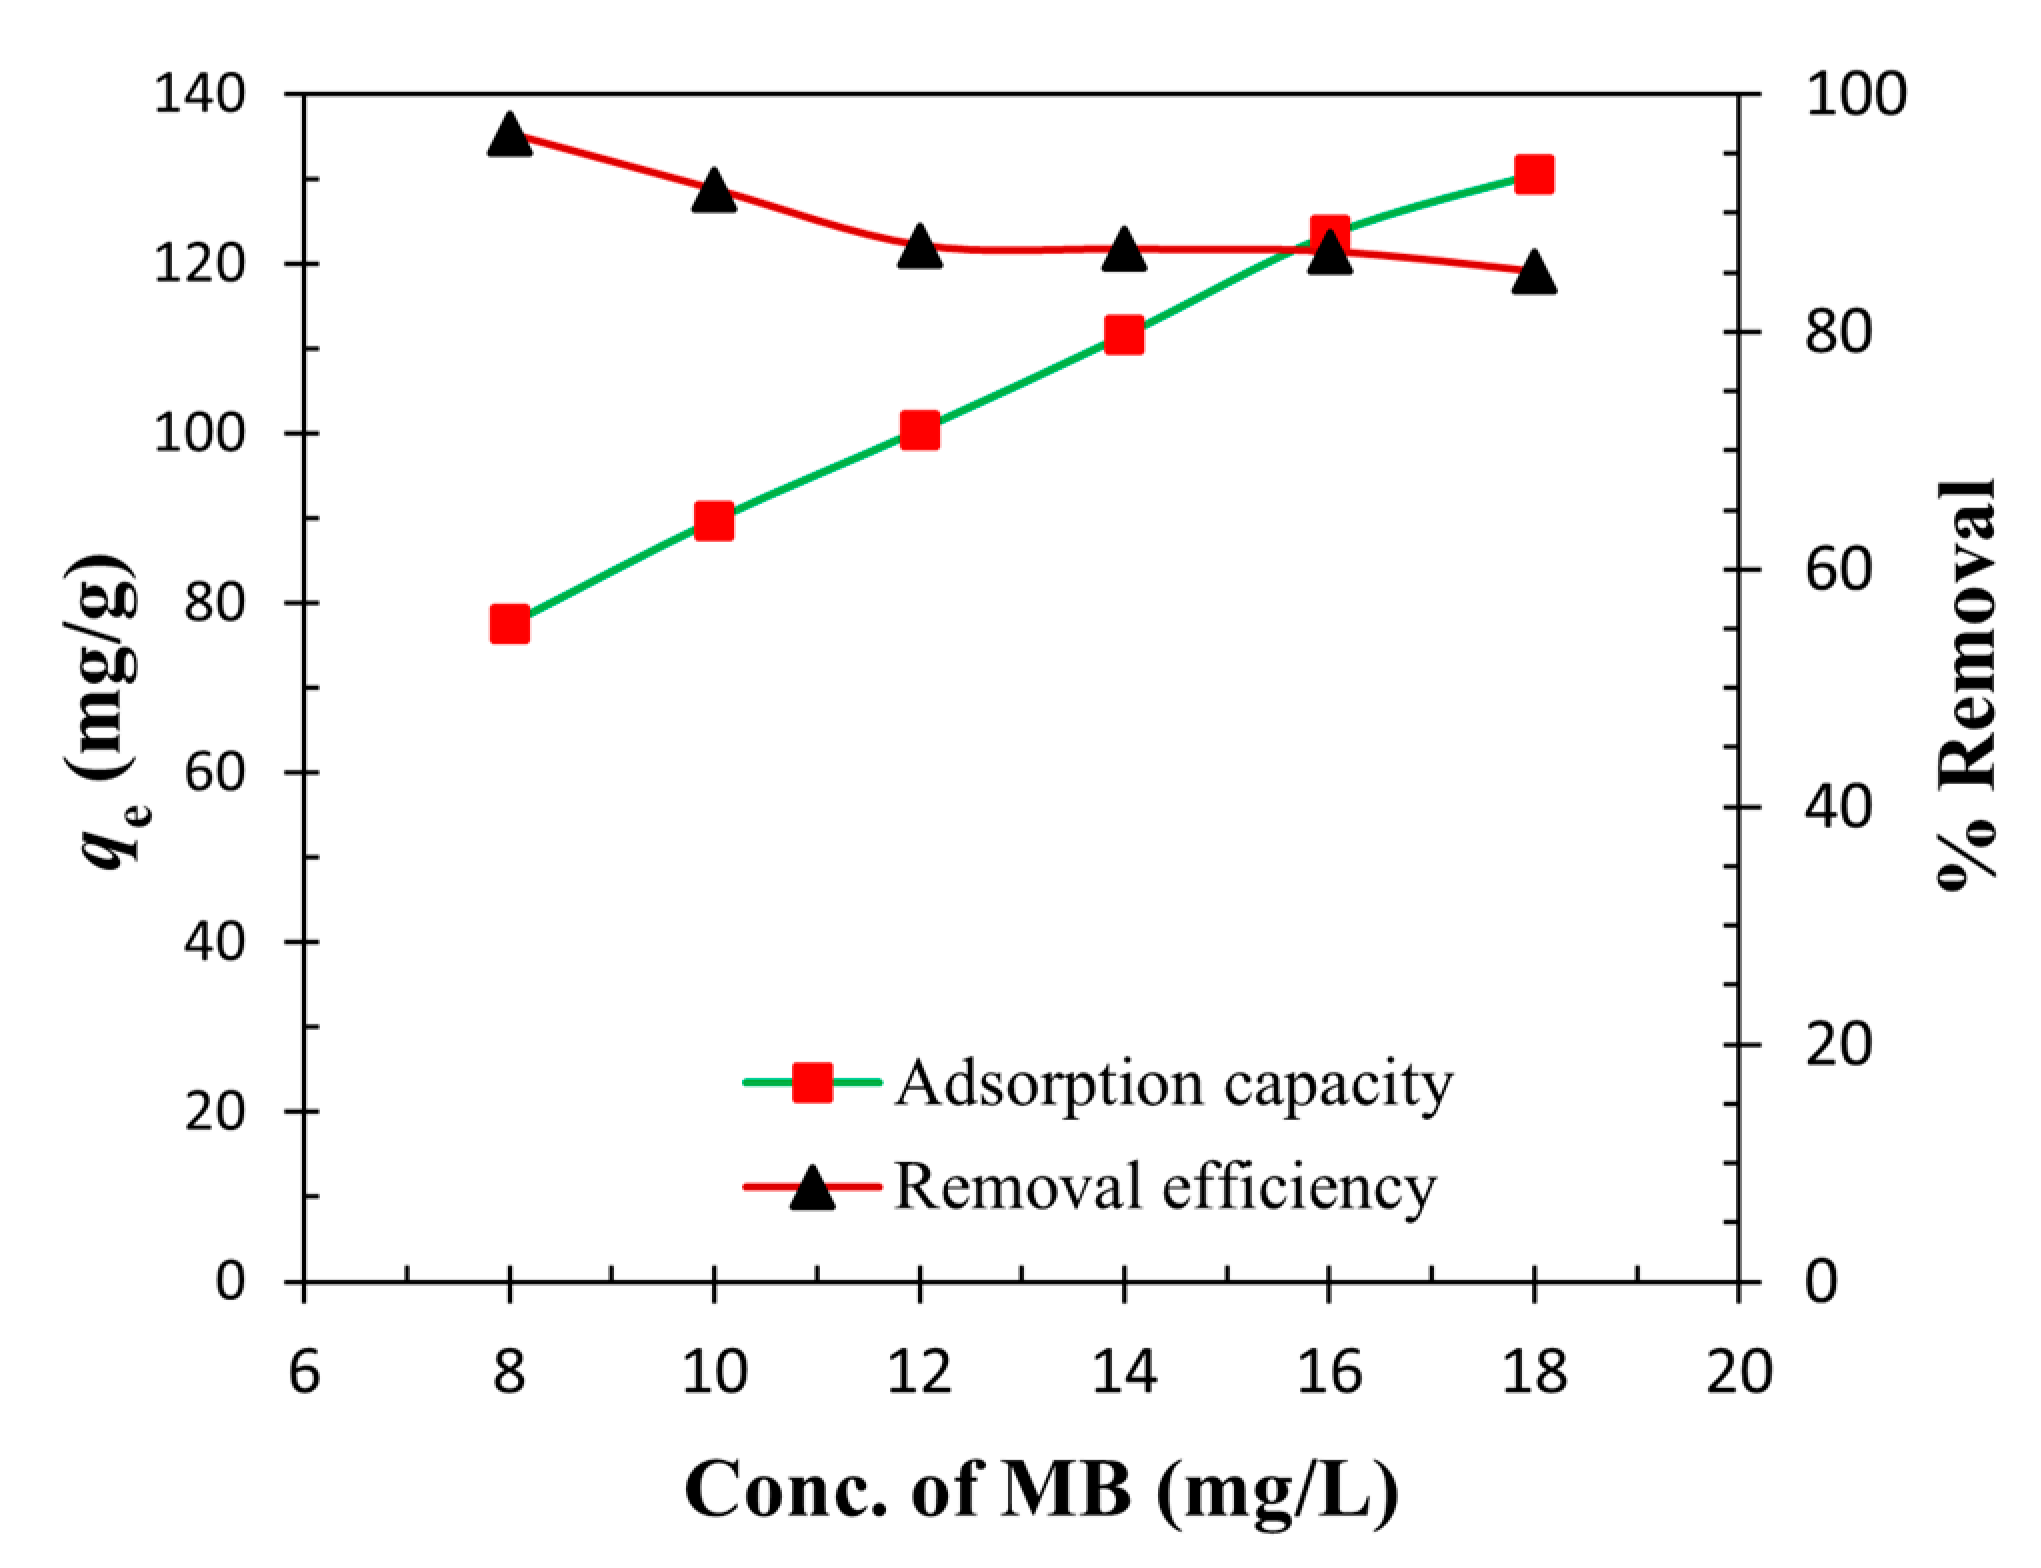
3.5. Effect of the Initial Concentration of MB
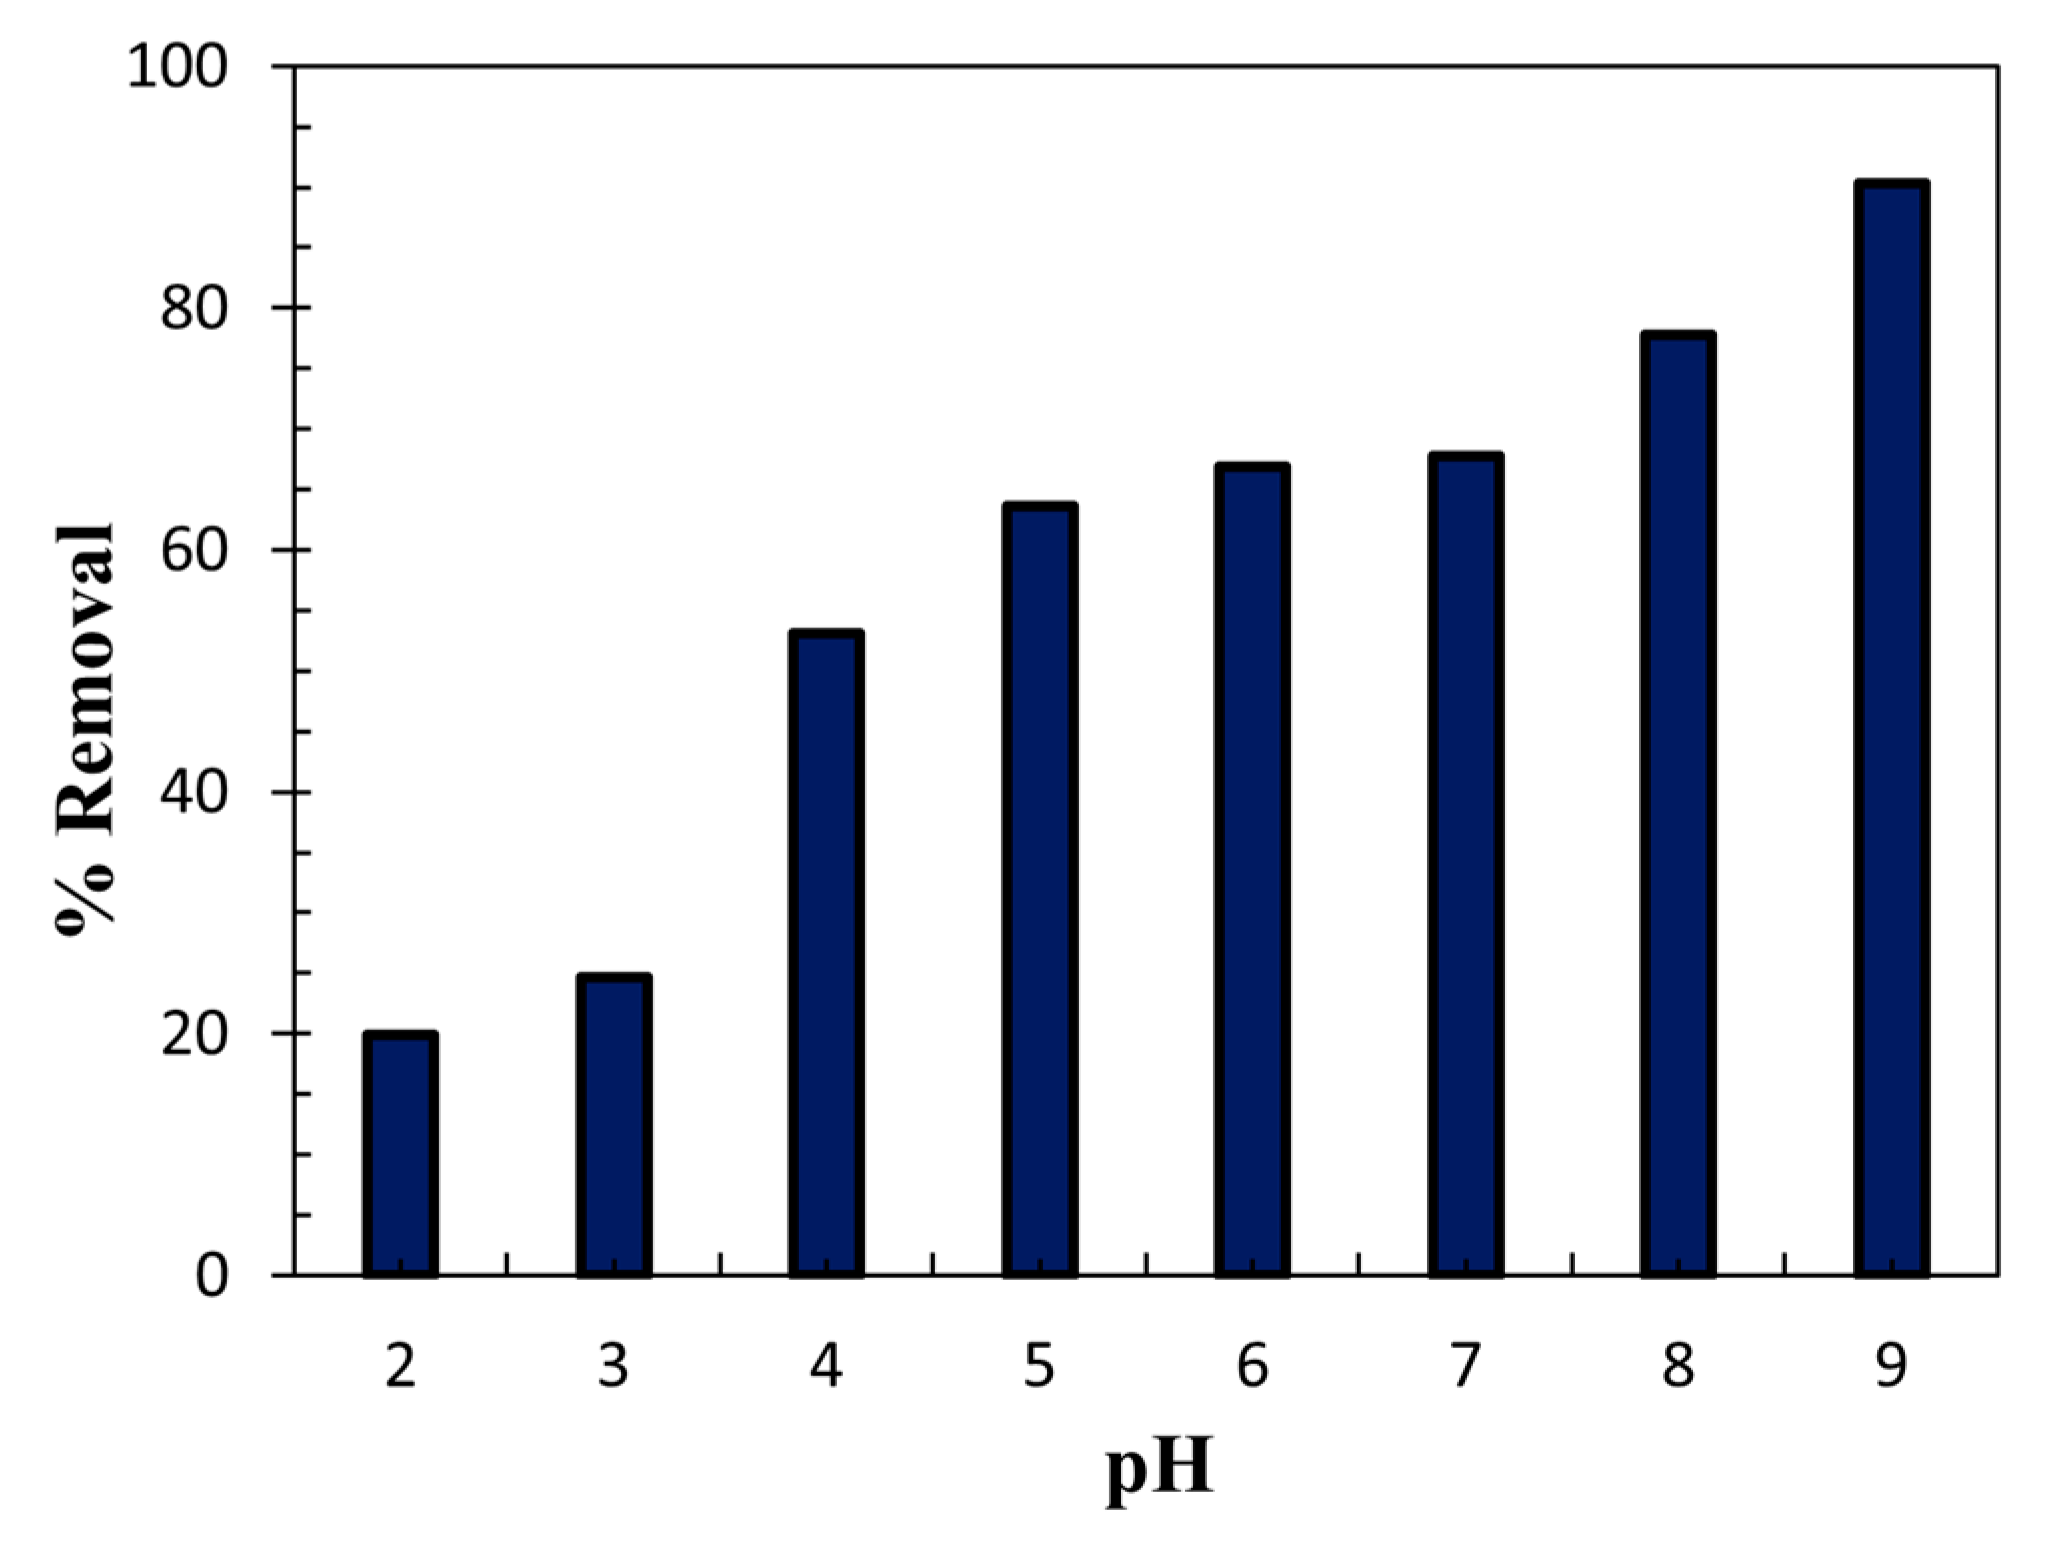
The effect of the initial concentration of MB on the adsorption process was demonstrated in Figure 15. The experiments were carried out using 10 mg of rGO to 100 mL of MB solution at 298 K. The removal efficiency decreased from 96.6 to 67% as the increase of the concentration of MB from 8 to 18 mg/L with a steady-state (87.3 to 85.1%) at the concentration range of 12 to 18 mg/L. At lower concentrations of MB, enough amounts of rGO resulted in high efficiency. As the increase of concentration of MB, the active sites become saturated, resulting in lower dye removal efficiency in spite of the increase of qe.

3.6. Effect of pH

The effect of pH was investigated at 298 K using 16 mg/L MB solution with 8 mg of rGO (Figure 16). The removal efficiency increased with increasing pH. Under highly acidic conditions, the basic moieties in MB (pKa = 2.6) accept protons to make MB di-cationic, and the high polarity of MB results in low affinity with the hydrophobic rGO surface, leading to very low removal efficiency. As the pH gets higher, MB becomes stably mono-cationic with a moderate amphiphilicity, and the adsorption becomes preferable to enhance the removal efficiency [54,67,68]. It is reported that the decrease in the cationic nature of MB in basic media increasingly facilitates its adsorption [54,69].

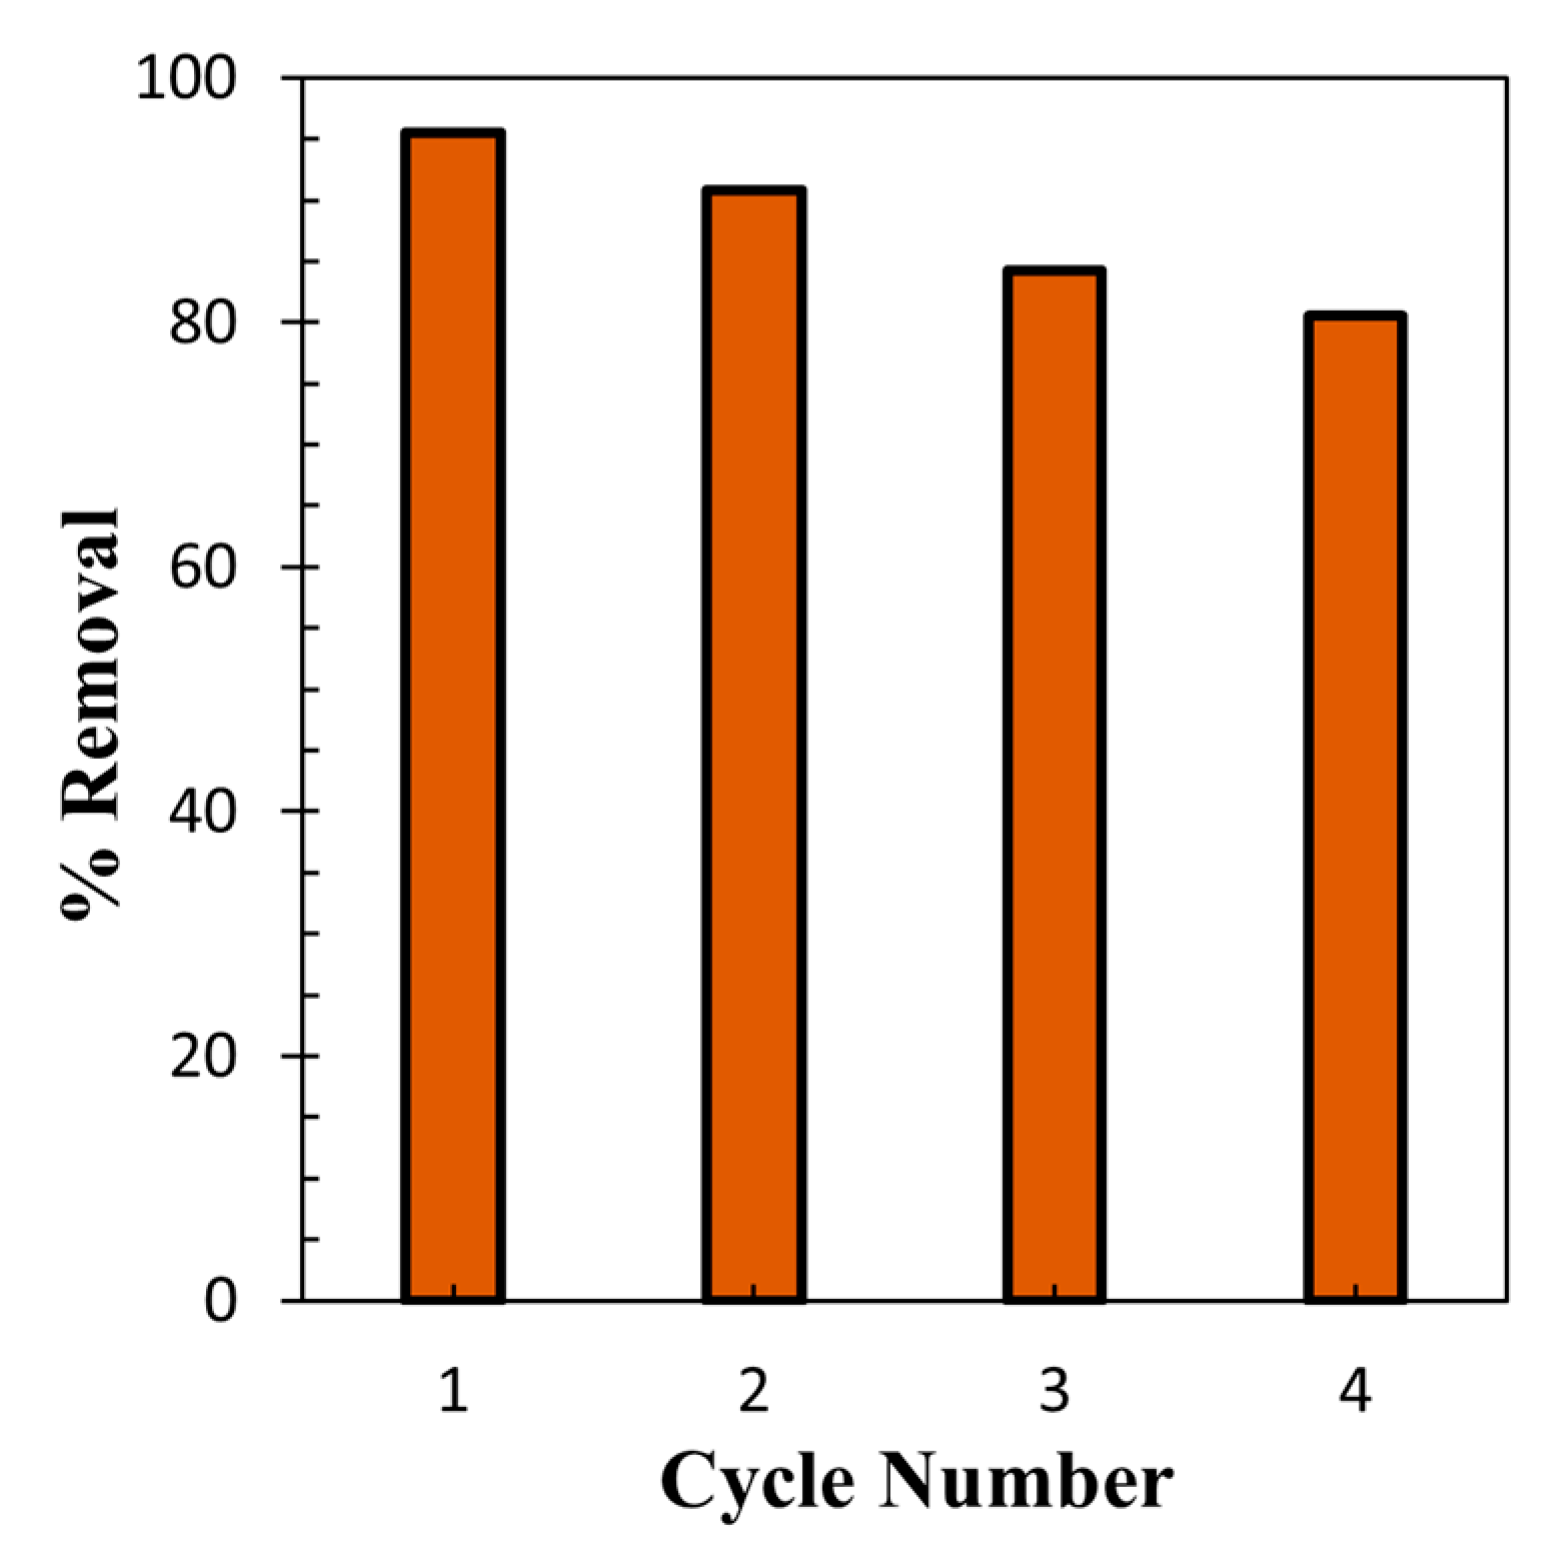
3.7. Recycling and Reuse Study

The reusability of rGO was examined by four successive adsorption/desorption cycles according to the method developed by Aboelfetoh et al. [70] (Figure 17). The desorption of MB from spent rGO was conducted by separating rGO by centrifugation, followed by sequential washing with 0.1 M NaOH (aq), diluted ethanol (aq), and distilled water. Figure 17 indicates that the removal efficiency was above 80% even after four cycles of its usage with a decrease in the efficiency from 95.5 to 80.4%. This decrease can be attributed to the incomplete recovery of adsorption sites because some of the adsorption sites were blocked by a trace amount of MB or its degraded products that are produced at higher pH during the desorption processes as confirmed by the appearance of two tiny peaks at 1375 and 1315 cm−1 assignable to the aromatic rings in the FTIR spectrum of rGO after being used for three consecutive adsorption-desorption cycles (Figure 18). Presumably, MB or its degraded products are attached with rGO either by physical adsorption or any chemical bond formation with the functional groups of rGO. By contrast, the morphology of rGO was not changed as confirmed from the SEM image of rGO (Figure 19) showing the exfoliated and separated few layers of sheets used for three consecutive adsorption-desorption cycles. Thus, it can be supposed that the high significant reusability of rGO suggests its potential for broad applications.

4. Conclusions

A successful green approach was demonstrated for the reduction of GO to exfoliated rGO using lemon juice as an efficient, cheap, and green reducing agent. The excellence of this method is its low cost, avoidance of toxic agents and hazardous wastes, worthy elimination of functional groups from GO, and scalability. The adsorption study performed on MB revealed that rGO exhibits fast dye adsorption with a maximum adsorption capacity of 132.2 mg/g. The adsorption process follows pseudo-second-order kinetics and is best described by the Langmuir isotherm model. In addition, synthesized rGO showed good recyclability. The present study indicates that lemon juice is an ideal substitute for hazardous reducing agents like sodium borohydride, hydrazine, and dimethylhydrazine in the large-scale synthesis of rGO. The high adsorption ability of rGO originates from the high efficiency of exfoliation. Therefore, further investigation on the applications of lemon juice-based rGO will lead to industrial applications.

Author Contributions

Conceptualization, M.M. and B.O.; methodology, data investigation, data curation, and writing—original draft, M.M.; supervision, B.O.; writing—review and editing, M.M. and B.O. All authors have read and agreed to the published version of the manuscript.

Funding

This research received no external funding.

Institutional Review Board Statement

Not applicable.

Informed Consent Statement

Not applicable.

Data Availability Statement

Not applicable.

Acknowledgments

M.M. gratefully acknowledges the Ministry of Education, Culture, Sports, Science and Technology, Japan, for providing the Japanese Government (Monbukagakusho: MEXT) Scholarship.

Conflicts of Interest

The authors declare no conflict of interest.

References

  1. Novoselov, K.S.; Geim, A.K.; Morozov, S.V.; Jiang, D.; Zhang, Y.; Dubonos, S.V.; Grigorieva, I.V.; Firsov, A.A. Electric field effect in atomically thin carbon films. Science 2004, 306, 666–669. [Google Scholar] [CrossRef] [Green Version]
  2. Liu, J.; Fu, S.; Yuan, B.; Li, Y.; Deng, Z. Toward a Universal “Adhesive Nanosheet” for the Assembly of Multiple Nanoparticles Based on a Protein-Induced Reduction/Decoration of Graphene Oxide. J. Am. Chem. Soc. 2010, 132, 7279–7281. [Google Scholar] [CrossRef] [PubMed]
  3. Zhu, C.; Guo, S.; Fang, Y.; Dong, S. Reducing Sugar: New Functional Molecules for the Green Synthesis of Graphene Nanosheets. ACS Nano 2010, 4, 2429–2437. [Google Scholar] [CrossRef] [PubMed]
  4. Ciesielski, A.; Samorì, P. Graphene via sonication assisted liquid-phase exfoliation. Chem. Soc. Rev. 2014, 43, 381–398. [Google Scholar] [CrossRef] [PubMed]
  5. González-Domínguez, J.M.; León, V.; Lucío, M.I.; Prato, M.; Vázquez, E. Production of ready-to-use few-layer graphene in aqueous suspensions. Nat. Protoc. 2018, 13, 495–506. [Google Scholar] [CrossRef] [PubMed]
  6. Wang, Y.; Shi, Z.; Yin, J. Facile Synthesis of Soluble Graphene via a Green Reduction of Graphene Oxide in Tea Solution and Its Biocomposites. ACS Appl. Mater. Interfaces 2011, 3, 1127–1133. [Google Scholar] [CrossRef]
  7. Gao, M.; Li, X.; Qi, D.; Lin, J. Green Synthesis of Porous Spherical Reduced Graphene Oxide and Its Application in Immobilized Pectinase. ACS Omega 2020, 5, 32706–32714. [Google Scholar] [CrossRef] [PubMed]
  8. Joshi, S.; Siddiqui, R.; Sharma, P.; Kumar, R.; Verma, G.; Saini, A. Green synthesis of peptide functionalized reduced graphene oxide (rGO) nano bioconjugate with enhanced antibacterial activity. Sci. Rep. 2020, 10, 1–11. [Google Scholar] [CrossRef]
  9. Poudel, M.B.; Awasthi, G.P.; Kim, H.J. Novel insight into the adsorption of Cr(VI) and Pb(II) ions by MOF derived Co-Al layered double hydroxide @hematite nanorods on 3D porous carbon nanofiber network. Chem. Eng. J. 2021, 417, 129312. [Google Scholar] [CrossRef]
  10. Cai, X.; Lai, L.; Shen, Z.; Lin, J. Graphene and graphene-based composites as Li-ion battery electrode materials and their ap-plication in full cells. J. Mater. Chem. A 2017, 5, 15423–15446. [Google Scholar] [CrossRef]
  11. Tiwari, J.N.; Mahesh, K.; Le, N.; Kemp, K.; Timilsina, R.; Tiwari, R.N.; Kim, K.S. Reduced graphene oxide-based hydrogels for the efficient capture of dye pollutants from aqueous solutions. Carbon 2013, 56, 173–182. [Google Scholar] [CrossRef]
  12. Chia, J.S.Y.; Tan, M.; Khiew, P.; Chin, J.; Lee, H.W.; Bien, D.; Siong, C.W. A novel one step synthesis of graphene via sonochemical-assisted solvent exfoliation approach for electrochemical sensing application. Chem. Eng. J. 2014, 249, 270–278. [Google Scholar] [CrossRef]
  13. Goud, K.Y.; Hayat, A.; Catanante, G.; Satyanarayana, M.; Gobi, K.V.; Marty, J.L. An electrochemical aptasensor based on functionalized graphene oxide assisted electrocatalytic signal amplification of methylene blue for aflatoxin B1 detection. Electrochimica Acta 2017, 244, 96–103. [Google Scholar] [CrossRef]
  14. Jiang, C.; An, D.; Wang, Z.; Zhang, S.; An, X.; Bo, J.; Yan, G.; Moon, K.-S.; Wong, C. A sustainable reduction route of graphene oxide by industrial waste lignin for versatile applications in energy and environment. J. Clean. Prod. 2020, 268, 122019. [Google Scholar] [CrossRef]
  15. Sun, X.; Liu, Z.; Welsher, K.; Robinson, J.T.; Goodwin, A.; Zaric, S.; Dai, H. Nano-graphene oxide for cellular imaging and drug delivery. Nano Res. 2008, 1, 203–212. [Google Scholar] [CrossRef] [PubMed] [Green Version]
  16. Ferrari, A.C.; Bonaccorso, F.S.; Fal’Ko, V.; Novoselov, K.; Roche, S.; Bøggild, P.; Borini, S.; Koppens, F.H.L.; Palermo, V.; Pugno, N.; et al. Science and technology roadmap for graphene, related two-dimensional crystals, and hybrid systems. Nanoscale 2014, 7, 4598–4810. [Google Scholar] [CrossRef] [Green Version]
  17. Sharma, N.; Sharma, V.; Jain, Y.; Kumari, M.; Gupta, R.; Sharma, S.K.; Sachdev, K. Synthesis and Characterization of Graphene Oxide (GO) and Reduced Graphene Oxide (rGO) for Gas Sensing Application. Macromol. Symp. 2017, 376. [Google Scholar] [CrossRef]
  18. Poudel, M.B.; Kim, H.J. Synthesis of high-performance nickel hydroxide nanosheets/gadolinium doped-α-MnO2 composite nanorods as cathode and Fe3O4/GO nanospheres as anode for an all-solid-state asymmetric supercapacitor. J. Energy Chem. 2022, 64, 475–484. [Google Scholar] [CrossRef]
  19. Feng, H.; Cheng, R.; Zhao, X.; Duan, X.; Li, J. A low-temperature method to produce highly reduced graphene oxide. Nat. Commun. 2013, 4, 1539. [Google Scholar] [CrossRef] [PubMed] [Green Version]
  20. De Silva, K.; Huang, H.-H.; Joshi, R.; Yoshimura, M. Chemical reduction of graphene oxide using green reductants. Carbon 2017, 119, 190–199. [Google Scholar] [CrossRef]
  21. Shin, H.-J.; Kim, K.K.; Benayad, A.; Yoon, S.-M.; Park, H.K.; Jung, I.-S.; Jin, M.H.; Jeong, H.-K.; Kim, J.M.; Choi, J.-Y.; et al. Efficient Reduction of Graphite Oxide by Sodium Borohydride and Its Effect on Electrical Conductance. Adv. Funct. Mater. 2009, 19, 1987–1992. [Google Scholar] [CrossRef]
  22. Stankovich, S.; Dikin, D.A.; Piner, R.D.; Kohlhaas, K.A.; Kleinhammes, A.; Jia, Y.; Wu, Y.; Nguyen, S.; Ruoff, R.S. Synthesis of graphene-based nanosheets via chemical reduction of exfoliated graphite oxide. Carbon 2007, 45, 1558–1565. [Google Scholar] [CrossRef]
  23. Li, D.; Müller, M.B.; Gilje, S.; Kaner, R.B.; Wallace, G.G. Processable aqueous dispersions of graphene nanosheets. Nat. Nanotechnol. 2008, 3, 101–105. [Google Scholar] [CrossRef]
  24. Wang, G.; Yang, J.; Park, J.; Gou, X.; Wang, B.; Liu, H.; Yao, J. Facile synthesis and characterization of graphene nanosheets. J. Phys. Chem. C 2008, 112, 8192–8195. [Google Scholar] [CrossRef]
  25. Zhang, C.; Lv, W.; Zhang, W.; Zheng, X.; Wu, M.-B.; Wei, W.; Tao, Y.; Li, Z.; Yang, Q.-H. Reduction of Graphene Oxide by Hydrogen Sulfide: A Promising Strategy for Pollutant Control and as an Electrode for Li-S Batteries. Adv. Energy Mater. 2013, 4, 1301565. [Google Scholar] [CrossRef]
  26. Wang, Y.; Zhang, P.; Liu, C.F.; Zhan, L.; Li, Y.F.; Huang, C.Z. Green and easy synthesis of biocompatible graphene for use as an anticoagulant. RSC Adv. 2012, 2, 2322–2328. [Google Scholar] [CrossRef]
  27. De Silva, K.K.H.; Huang, H.-H.; Yoshimura, M. Progress of reduction of graphene oxide by ascorbic acid. Appl. Surf. Sci. 2018, 447, 338–346. [Google Scholar] [CrossRef]
  28. Sadhukhan, S.; Ghosh, T.K.; Rana, D.; Roy, I.; Bhattacharyya, A.; Sarkar, G.; Chakraborty, M.; Chattopadhyay, D. Studies on synthesis of reduced graphene oxide (RGO) via green route and its electrical property. Mater. Res. Bull. 2016, 79, 41–51. [Google Scholar] [CrossRef]
  29. Bhattacharya, G.; Sas, S.; Wadhwa, S.; Mathur, A.; McLaughlin, J.; Roy, S.S. Aloe vera assisted facile green synthesis of reduced graphene oxide for electrochemical and dye removal applications. RSC Adv. 2017, 7, 26680–26688. [Google Scholar] [CrossRef] [Green Version]
  30. Manchala, S.; Tandava, V.S.R.K.; Jampaiah, D.; Bhargava, S.K.; Shanker, V. Novel and Highly Efficient Strategy for the Green Synthesis of Soluble Graphene by Aqueous Polyphenol Extracts of Eucalyptus Bark and Its Applications in High-Performance Supercapacitors. ACS Sustain. Chem. Eng. 2019, 7, 11612–11620. [Google Scholar] [CrossRef]
  31. Gan, L.; Li, B.; Chen, Y.; Yu, B.; Chen, Z. Green synthesis of reduced graphene oxide using bagasse and its application in dye removal: A waste-to-resource supply chain. Chemosphere 2018, 219, 148–154. [Google Scholar] [CrossRef]
  32. Wijaya, R.; Andersan, G.; Santoso, S.P.; Irawaty, W. Green Reduction of Graphene Oxide using Kaffir Lime Peel Extract (Citrus hystrix) and Its Application as Adsorbent for Methylene Blue. Sci. Rep. 2020, 10, 1–9. [Google Scholar] [CrossRef] [PubMed]
  33. Maddinedi, S.B.; Mandal, B.K.; Vankayala, R.; Kalluru, P.; Pamanji, S.R. Bioinspired reduced graphene oxide nanosheets using Terminalia chebula seeds extract. Spectrochim. Acta Part A Mol. Biomol. Spectrosc. 2015, 145, 117–124. [Google Scholar] [CrossRef] [PubMed]
  34. Haghighi, B.; Tabrizi, M.A. Green-synthesis of reduced graphene oxide nanosheets using rose water and a survey on their characteristics and applications. RSC Adv. 2013, 3, 13365–13371. [Google Scholar] [CrossRef]
  35. Arias, F.A.; Guevara, M.; Tene, T.; Angamarca, P.; Molina, R.; Valarezo, A.; Salguero, O.; Gomez, C.V.; Arias, M.; Caputi, L.S. The Adsorption of Methylene Blue on Eco-Friendly Reduced Graphene Oxide. Nanomaterials 2020, 10, 681. [Google Scholar] [CrossRef] [PubMed] [Green Version]
  36. Hsieh, C.-Y.; Hsieh, S.-L.; Ciou, J.-Y.; Huang, Y.-W.; Leang, J.-Y.; Chen, M.-H.; Hou, C.-Y. Lemon juice bioactivity in vitro increased with lactic acid fermentation. Int. J. Food Prop. 2020, 24, 28–40. [Google Scholar] [CrossRef]
  37. ‘World’s Top Lemon Producing Countries. Available online: www.atlasbig.com (accessed on 8 October 2021).
  38. Cicero, N.; Corsaro, C.; Salvo, A.; Vasi, S.; Giofrè, S.V.; Ferrantelli, V.; Di Stefano, V.; Mallamace, D.; Dugo, G. The metabolic profile of lemon juice by proton HR-MAS NMR: The case of the PGI Interdonato Lemon of Messina. Nat. Prod. Res. 2015, 29, 1–9. [Google Scholar] [CrossRef]
  39. Alfadul, S.M.; Hassan, B.H. Chemical Composition of Natural Juices Combining Lemon and Dates. ETP Int. J. Food Eng. 2016. [Google Scholar] [CrossRef]
  40. Mucci, A.; Parenti, F.; Righi, V.; Schenetti, L. Citron and lemon under the lens of HR-MAS NMR spectroscopy. Food Chem. 2013, 141, 3167–3176. [Google Scholar] [CrossRef]
  41. Yu, L.; Liao, Z.; Zhao, Y.; Zeng, X.; Yang, B.; Bai, W. Metabolomic analyses of dry lemon slice during storage by NMR. Food Front. 2020, 1, 180–191. [Google Scholar] [CrossRef]
  42. Mosae Selvakumar, P.; Antonyraj, C.A.; Babu, R.; Dakhsinamurthy, A.; Manikandan, N.; Palanivel, A. Green synthesis and antimicrobial activity of monodispersed silver nanoparticles synthesized using lemon extract. Synth. React. Inorg. Met. Nano-Metal. Chem. 2016, 46, 291–294. [Google Scholar] [CrossRef]
  43. Sujitha, M.V.; Kannan, S. Green synthesis of gold nanoparticles using Citrus fruits (Citrus limon, Citrus reticulata and Citrus sinensis) aqueous extract and its characterization. Spectrochim. Acta Part A Mol. Biomol. Spectrosc. 2013, 102, 15–23. [Google Scholar] [CrossRef] [PubMed]
  44. Mahiuddin, M.; Ochiai, B. Green synthesis of crystalline bismuth nanoparticles using lemon juice. RSC Adv. 2021, 11, 26683–26686. [Google Scholar] [CrossRef]
  45. Klimek-Szczykutowicz, M.; Szopa, A.; Ekiert, H. Citrus limon (lemon) phenomenon—A review of the chemistry, pharmacological prop-erties, applications in the modern pharmaceutical, food, and cosmetics industries, and biotechnological studies. Plants 2020, 9, 119. [Google Scholar] [CrossRef] [Green Version]
  46. Gurbani, N.; Han, C.-P.; Marumoto, K.; Liu, R.-S.; Choudhary, R.J.; Chouhan, N. Biogenic Reduction of Graphene Oxide: An Efficient Superparamagnetic Material for Photocatalytic Hydrogen Production. ACS Appl. Energy Mater. 2018, 1, 5907–5918. [Google Scholar] [CrossRef]
  47. Hummers, W.S., Jr.; Offeman, R.E. Preparation of Graphitic Oxide. J. Am. Chem. Soc. 1958, 80, 1339. [Google Scholar] [CrossRef]
  48. Poudel, M.B.; Yu, C.; Kim, H.J. Synthesis of conducting bifunctional polyaniline@Mn-TiO2 nanocomposites for supercapacitor electrode and visible light driven photocatalysis. Catalysts 2020, 10, 546. [Google Scholar] [CrossRef]
  49. Jin, Y.; Zheng, Y.; Podkolzin, S.G.; Lee, W. Band gap of reduced graphene oxide tuned by controlling functional groups. J. Mater. Chem. C 2020, 8, 4885–4894. [Google Scholar] [CrossRef]
  50. Mathkar, A.; Tozier, D.; Cox, P.; Ong, P.; Galande, C.; Balakrishnan, K.; Reddy, A.L.M.; Ajayan, P.M. Controlled, Stepwise Reduction and Band Gap Manipulation of Graphene Oxide. J. Phys. Chem. Lett. 2012, 3, 986–991. [Google Scholar] [CrossRef]
  51. Velasco-Soto, M.A.; Pérez-García, S.A.; Alvarez-Quintana, J.; Cao, Y.; Nyborg, L.; Licea-Jiménez, L. Selective band gap ma-nipulation of graphene oxide by its reduction with mild reagents. Carbon 2015, 93, 967–973. [Google Scholar] [CrossRef] [Green Version]
  52. Abdolhosseinzadeh, S.; Asgharzadeh, H.; Kim, H.S. Fast and fully-scalable synthesis of reduced graphene oxide. Sci. Rep. 2015, 5, 10160. [Google Scholar] [CrossRef] [PubMed] [Green Version]
  53. Ahmad, S.; Ahmad, A.; Khan, S.; Ahmad, S.; Khan, I.; Zada, S.; Fu, P. Algal extracts based biogenic synthesis of reduced graphene oxides (rGO) with enhanced heavy metals adsorption capability. J. Ind. Eng. Chem. 2018, 72, 117–124. [Google Scholar] [CrossRef]
  54. Siong, V.L.E.; Lee, K.M.; Juan, J.C.; Lai, C.W.; Tai, X.H.; Khe, C.S. Removal of methylene blue dye by solvothermally reduced graphene oxide: A metal-free adsorption and photodegradation method. RSC Adv. 2019, 9, 37686–37695. [Google Scholar] [CrossRef]
  55. Penki, T.R.; Valurouthu, G.; Shivakumara, S.; Sethuraman, V.A.; Munichandraiah, N. In situ synthesis of bismuth (Bi)/reduced graphene oxide (rGO) nanocomposites as high-capacity anode materials for a Mg-ion battery. N. J. Chem. 2018, 42, 5996–6004. [Google Scholar] [CrossRef] [Green Version]
  56. Qiao, S.-J.; Xu, X.-N.; Qiu, Y.; Xiao, H.-C.; Zhu, Y.-F. Simultaneous Reduction and Functionalization of Graphene Oxide by 4-Hydrazinobenzenesulfonic Acid for Polymer Nanocomposites. Nanomaterials 2016, 6, 29. [Google Scholar] [CrossRef] [Green Version]
  57. Ramesha, G.; Kumara, A.V.; Muralidhara, H.; Sampath, S. Graphene and graphene oxide as effective adsorbents toward anionic and cationic dyes. J. Colloid Interface Sci. 2011, 361, 270–277. [Google Scholar] [CrossRef]
  58. Ramesha, G.K.; Sampath, S. Electrochemical reduction of oriented graphene oxide films: An in-situ Raman spectro electro-chemical study. J. Phys. Chem. C 2009, 113, 7985–7989. [Google Scholar] [CrossRef]
  59. Kolya, H.; Kuila, T.; Kim, N.H.; Lee, J.H. Bioinspired silver nanoparticles/reduced graphene oxide nanocomposites for catalytic reduction of 4-nitrophenol, organic dyes and act as energy storage electrode material. Compos. Part B Eng. 2019, 173, 106924. [Google Scholar] [CrossRef]
  60. Johra, F.T.; Lee, J.-W.; Jung, W.-G. Facile and safe graphene preparation on solution based platform. J. Ind. Eng. Chem. 2014, 20, 2883–2887. [Google Scholar] [CrossRef]
  61. Chu, H.-J.; Lee, C.-Y.; Tai, N.-H. Green reduction of graphene oxide by Hibiscus sabdariffa L. to fabricate flexible graphene electrode. Carbon 2014, 80, 725–733. [Google Scholar] [CrossRef]
  62. Hou, D.; Liu, Q.; Cheng, H.; Zhang, H.; Wang, S. Green reduction of graphene oxide via Lycium barbarum extract. J. Solid State Chem. 2017, 246, 351–356. [Google Scholar] [CrossRef]
  63. Wang, C.; Ma, G.; Zhou, J.; Zhang, M.; Ma, X.; Duo, F.; Chu, L.; Huang, J.; Su, X. Glycine-functionalized reduced graphene oxide for methylene blue removal. Appl. Organomet. Chem. 2019, 33, e5077. [Google Scholar] [CrossRef]
  64. Shukla, S.P.; Kisku, G.C. Linear and non-linear kinetic modeling for adsorption of disperse dye in batch process. Res. J. Environ. Toxicol. 2015, 9, 320–331. [Google Scholar] [CrossRef] [Green Version]
  65. Wang, C.; Li, B.; Niu, W.; Hong, S.; Saif, B.; Wang, S.; Dong, C.; Shuang, S. β-Cyclodextrin modified graphene oxide–magnetic nanocomposite for targeted delivery and pH-sensitive release of stereoisomeric anti-cancer drugs. RSC Adv. 2015, 5, 89299–89308. [Google Scholar] [CrossRef]
  66. Mao, B.; Sidhureddy, B.; Thiruppathi, A.R.; Wood, P.C.; Chen, A. Efficient dye removal and separation based on graphene oxide nanomaterials. New J. Chem. 2020, 44, 4519–4528. [Google Scholar] [CrossRef]
  67. Hossain, M.S.; Ochiai, B. Detailed study on rapid removal of cationic dyes using TiO2 -poly(3-chloro-2-hydroxypropyl meth-acrylate) nanocomposite. J. Electrochem. Soc. 2019, 166, B3240–B3245. [Google Scholar] [CrossRef]
  68. Huang, T.; Yan, M.; He, K.; Huang, Z.; Zeng, G.; Chen, A.; Peng, M.; Li, H.; Yuan, L.; Chen, G. Efficient removal of methylene blue from aqueous solutions using magnetic graphene oxide modified zeolite. J. Colloid Interface Sci. 2019, 543, 43–51. [Google Scholar] [CrossRef]
  69. Zarrabi, M.; Haghighi, M.; Alizadeh, R.; Mahboob, S. Solar-light-driven photodegradation of organic dyes on sono-dispersed ZnO nanoparticles over graphene oxide: Sono vs. conventional catalyst design. Sep. Purif. Technol. 2018, 211, 738–752. [Google Scholar] [CrossRef]
  70. Aboelfetoh, E.F.; Gemeay, A.H.; El-Sharkawy, R.G. Effective disposal of methylene blue using green immobilized silver na-noparticles on graphene oxide and reduced graphene oxide sheets through one-pot synthesis. Environ. Monit. Assess. 2020, 192, 355. [Google Scholar] [CrossRef] [PubMed]
Figure 1. (a) UV-vis spectra of GO and rGO synthesized using lemon juice (conditions: pH = 12.3, 80 °C, and 2 h; dispersed in water) and Tauc plots of (b) GO and (c) rGO for the optical band gap determination.
Technologies 09 00096 g001
Figure 2. Time-dependent UV-vis spectra of the reaction mixture of the reduction of GO to rGO using lemon juice (conditions: pH = 12.3 and 80 °C).
Technologies 09 00096 g002
Figure 3. UV-vis spectra of the reaction mixture of the reduction of GO to rGO using lemon juice at different temperatures (conditions: pH = 12.3 and 2 h).
Technologies 09 00096 g003
Figure 4. FTIR spectra of GO and rGO synthesized using lemon juice at different temperatures (conditions: pH = 12.3 and 2 h).
Technologies 09 00096 g004
Figure 5. XRD patterns of graphite powder, GO and rGO synthesized using lemon juice at different temperatures (conditions: pH = 12.3 and 2 h).
Technologies 09 00096 g005
Figure 6. SEM images of GO and rGO synthesized using lemon juice.
Technologies 09 00096 g006
Figure 7. TEM images of rGO synthesized using lemon juice.
Technologies 09 00096 g007
Figure 8. Raman spectra of GO and rGO synthesized using lemon juice.
Technologies 09 00096 g008
Figure 9. EDX spectra of GO and rGO synthesized using lemon juice (the peak at 0.1 keV is peak originating from background).
Technologies 09 00096 g009
Figure 10. TGA curves of GO and rGO synthesized using lemon juice (heating rate = 10 °C /min, N2 flow).
Technologies 09 00096 g010
Figure 11. Time dependence of adsorption of MB onto rGO at different temperatures: (a) adsorption capacity and (b) removal efficiency (conditions: CMB0 = 20 mg/L, V = 100 mL, WrGO = 15 mg).
Technologies 09 00096 g011
Figure 12. Adsorption kinetics of adsorption of MB by rGO for (a) pseudofirst order, (b) pseudosecond order, (c) intraparticle diffusion (IPD), and (d) Boyd kinetic models (conditions: CMB0 = 20 mg/L, V = 100 mL; WrGO = 15 mg).
Technologies 09 00096 g012aTechnologies 09 00096 g012b
Figure 13. Adsorption isotherms of MB adsorption onto rGO (a) Langmuir, (b) Freundlich, and (c) Temkin models at 298 K.
Technologies 09 00096 g013
Figure 14. Effect of the mass of rGO on the adsorption process (CMB0 = 20 mg/L, V = 50 mL, T = 298 K).
Technologies 09 00096 g014
Figure 15. Effect of the initial concentration of MB on the adsorption process (WrGO = 10 mg, V = 100 mL, T = 298 K).
Technologies 09 00096 g015
Figure 16. Effect of pH on the adsorption of MB on rGO (CMB0 = 16 mg/L, WrGO = 8 mg, V = 100 mL, T = 298 K).
Technologies 09 00096 g016
Figure 17. Recycling performance of rGO for capturing of MB up to 4 cycles (CMB0 = 20 mg/L, WrGO = 8 mg, V = 100 mL, T = 298 K).
Technologies 09 00096 g017
Figure 18. FTIR spectra of MB and rGO before and after three consecutive adsorption-desorption cycles.
Technologies 09 00096 g018
Figure 19. SEM images of rGO used for three consecutive adsorption-desorption cycles.
Technologies 09 00096 g019
Table 1. Parameters obtained from different kinetics models for MB adsorption on rGO a.
Models and EquationsTemperatureParameters
K1 (×10−2/min)qcal (mg/g)qexp (mg/g)R2
pseudo–first order
log ( q e q t ) = l o g q e k 1 2.303 t
298 K
313 K
333 K
6.1
6.2
6.2
93.4
77.1
86.6
104.3
104.2
105.4
0.998
0.977
0.989
K2 (×10−3 g/(mg·min)qcal (mg/g)qexp (mg/g)R2
pseudo–second order
t q t = 1 k 2 q e 2 + t q e
298 K
313 K
333 K
1.4
1.9
1.6
111.1
108.7
111.1
104.3
104.2
105.4
0.999
0.999
0.999
kdif (mg/(g·min1/2))RiC (mg/g)R2
Intraparticle diffusion298 K3.40.3469.60.733
q t = k d i f t 1 / 2 + C 313 K2.80.2875.50.659
R i = q r e f C q r e f 333 K3.20.3272.60.667
R2
Boyd kinetic298 K 0.998
B t = 0.4977 ln ( 1 F ) 313 K 0.977
F = q t q e 333 K 0.989
a Conditions: CMB0 = 20 mg/L, V = 100 mL, WrGO = 15 mg.
Table 2. Constant parameters and correlation coefficients calculated for different adsorption isotherm models at different temperatures for MB adsorption on rGO.
Models and EquationsConstants
Langmuirqm (mg/g)130.2
C e q e = 1 q m b + C e q m ;   R L = 1 1 + b C 0 RL (C0 = 8 mg/L
C0 = 10 mg/L
C0 = 12 mg/L
C0 = 14 mg/L
C0 = 16 mg/L
C0 = 18 mg/L)
0.0245
0.0197
0.0164
0.0141
0.0124
0.011
b (L/mg)4.98
R20.988
Freundlichn4.11
l n   q e = l n   K F + 1 n l n   C e KF (mg/g(L/mg)1/n)99.7
R20.898
TemkinbT102.76
q e = B   l n   A T + B   l n   C e ; considering B = R T b T AT (L/g)67.33
B (J/mol)24.1
R20.852
Publisher’s Note: MDPI stays neutral with regard to jurisdictional claims in published maps and institutional affiliations.

