1. Introduction
Modern information technology has led the way to an era of ubiquitous information availability in our private lives. Large amounts of data are generated every second to enable the subsequent collection, storage, usage and analysis of this data for various applications. The enterprises that focus on analyzing this data and create products out of it follow a green-field approach that enables them to set up infrastructures that are exactly designed for this purpose. However, the application of these methods in already existing environments proves to be challenging. IT infrastructures have been set up over the last few decades, tailored to the needs of specific tasks. Enterprises run whole landscapes of very heterogeneous and complex infrastructures. Trying to apply these new innovative data driven methods often is limited by the design of the systems, but must now be enabled exactly for this purpose. One area in which such environments can be found is the industrial sector. In industrial settings, those infrastructures consist, for instance, of legacy devices as well as modern machines, different network zones and heterogeneous storage systems, data formats and models. As a result, tasks for analyzing data, such as collecting, accessing, searching, understanding and processing data, become very time-consuming. This makes it difficult to realize visions, such as the Internet of Production (IoP) [
1], which pursues the goal of guaranteeing the availability of real-time information at any time and place. To reach this goal, data must be available and accessible to every participant in such a scenario.
However, in current industrial settings, this is not possible. For working on an analytical use case, it is, for instance, required to first identify potential data sources and the system that might contain them. Once those candidates are identified, the next step is to actually access the systems, extract the data and understand it, which is another challenge. In the past, the objective of collecting data that is usable and accessible has not been pursued. Hence, most companies either do not collect data from the shop floor or they collect their data in isolated silos, like databases or file systems. Therefore, one of the most challenging tasks of data analytics is the acquisition of data. For every analytic use case, this data acquisition task has to be repeated over and over again for any of the existing systems, such as machines on the shop floor or databases.
Solutions currently in use and applied for this problem are either the introduction of a data catalog that indexes all available data sources, or the centralization of the data storage. For centralizing the storage of different data sources, various solutions have already been proposed by researchers and have been appropriately adopted and implemented by the industry. Data warehouses enable the centralization of structured data sources, like relational databases, by following a schema-on-write approach. Although this solution has the advantage of a pre-defined and fixed schema, it lacks the capability of storing unstructured data and it suffers from a decreased flexibility, which is necessary in current data analytics and machine learning scenarios. For instance, adding a new system to a data warehouse or changing existing systems by adding new sensors requires the adaption of the existing data model. To overcome these limitations, modern data lakes, which follow a schema on read approach, allow for storing both structured and unstructured data. In addition, they offer the flexibility that modern data analytics and machine learning processes require. At the time of retrieval, the data consumer has to define how he wants to structure the data, tailored to the requirements of his analytical application. However, data lakes do not offer the possibility to easily access, find and understand all underlying data sources. The result is a data lake filled with heterogeneous data sets leading to a data swamp [
2]. Thus, finding and understanding all available data sets is another challenge for the employees of a company, as it is almost impossible if the necessary domain knowledge is missing, especially when it comes to combining data points from different data sources. The reason for this is that a data lake itself does not contain any information about the relationships between different data sources. All these drawbacks result from the fact that the data stewards, who store the data in the lake and are responsible for the data, usually do not belong to the group of data scientists or application developers, who are going to use the data later on. Thus, the implicit context knowledge of data stewards needs to be committed alongside with each single data set to allow analysts to interpret the received values later on. The interoperability of data sources can only be achieved if the parties involved develop a common understanding of the overall system. Therefore, an entity is required that is able to support all the users and their divergent perspectives on the same subject. The capabilities of this entity should range from supporting the description of a source system to the provisioning of a query interface bridging different views of the world.
To support people in establishing a common understanding, the usage of data catalogs, which allow to index data sources, can be helpful. In this area, different commercial meta-data management solutions as well as research tools and approaches exist that provide better accessibility, searchability and comprehensibility. For instance, following the research approach of the Semantic Web, this knowledge can be expressed using semantic models that are defined by the data stewards upon the data sets. The concepts and relations used within the semantic model represent the data stewards’ view of this data source. Those semantic models are usually based on a reference ontology. The mapping between the data attributes and the concepts of the semantic model is done by converting the data into a different format, e.g., RDF (Resource Description Framework) resulting in a semantic data integration where each data attribute and raw value is mapped to a concept of the underlying ontology. In this case, the set of semantic models combined with the corresponding ontology build an index over all data sources available. The index allows users to search and understand data sets inside the lake by their semantic representation instead of raw (and potentially cryptic) data labels.
While this approach builds a solid foundation for describing heterogeneous data sets within a data lake, it limits the variety and granularity of information that can be expressed during the semantic modeling process at the same time. Due to the underlying ontology and the implicit formalism associated with it, the data stewards are bound to the pre-defined vocabulary when building their model.
To achieve the objectives of the Internet of Production, it becomes necessary to focus on the challenges of collecting, finding, understanding, and accessing data sources in large enterprise production settings. To reduce the time to analytics for data sources, we present a data ingestion, integration and processing approach consisting of a flexible and configurable data ingestion pipeline that enables controllable access to data and meta information contained in machines and other systems on the shop floor and forwards the data to a configurable endpoint, such as a data lake. Instead of just ingesting the data into a raw data lake, we feed it into our semantic data platform, called Evolving Semantic Knowledge Aggregation and Processing Engine (ESKAPE) [
3,
4], which enables the semantic annotation of data sets and performs a semantic data integration. ESKAPE features a three-layered architecture consisting of raw data storage, a semantic annotation to store data sets and an implementation of a knowledge graph that serves as an index. The knowledge graph offers data stewards the capability to reuse semantic concepts and relations for their modeling process, which is similar to an ontology, while also enabling users to introduce new semantic concepts and relations on demand, leading to a continuously evolving knowledge graph. However, increasing the degree of freedom during modeling leads to new challenges, such as inconsistencies or contradictions that may arise during the modeling and data integration. Hence, a flexible architecture with well-defined building blocks is required in order to deal with the new arising challenges by providing a flexible semantic data integration. We present and discuss our approach and its benefits and limitations based on a real-world industrial use case. Here, we show how our data ingestion pipeline in combination with ESKAPE reduce the time to analytics in this use case.
The remainder of this paper is organized as follows: first, we define the term
time to analytics in
Section 2. Next, we present our real world industrial setting in
Section 3. Based on the presented setting, we discuss the functionality of our ingestion pipeline in
Section 4 and the features and design of ESKAPE in
Section 5. Afterwards, we discuss how we reduce the time to analytics in the described setting in
Section 6 and elaborate on current limitations. Finally, we present the current state of the art in
Section 7 before we conclude and give a short outlook in
Section 8.
3. Industrial Setting
In this section, we describe an industrial setting based on a real-world use case, which we are going to use as a demonstration for the concepts that follow. First, we explain the scenario in general (cf.
Section 3.1). Afterwards, we highlight the specific aspects of production divisions (cf.
Section 3.2) and data acquisition (cf.
Section 3.3) in more detail.
3.1. General Introduction
In order to better understand and grasp the complexity of the complete data ingestion and surrounding conditions, we start with the description of an industrial setting. This setting represents a class of manufacturing settings consisting of a common setup of a typical multi-site manufacturing company and the involved production processes.
Figure 1 shows the general overview of the scenario considered here.
The scenario is based on a grown manufacturing ecosystem. A typical production site was built decades ago and as the portfolio changed, the factories were adapted to the needs of the current specification of the product. The production processes are often automated and the tools and machine in such a mass production scenario are generally expensive and therefore re-purposed as long as possible. Given this fact, acquiring new machines is a big investment into the future, where their time of operation is typically in the magnitude of decades. One unique property of this scenario therefore deals with the restrictions imposed by interoperability with legacy devices. This means that these existing devices have to be integrated and it is not possible to just start from scratch and build everything right from the ground up. In contrast to the green-field scenario, this fact is referred to as the brown-field approach, since one has to deal with the existing and grown environment.
One concrete example for such a scenario could be a mainstream car manufacturing. Car manufacturers produce multiple car models. A car is produced by multiple separate production divisions. The manufacturing process continues for the lifetime of a car model. Once a new model is introduced, some machines and tools will be replaced by model specific ones, while others are just adapted to the needs of the model. Therefore, the lifetime of a machine is bound by the life-cycle of a product model and only changes when restructuring for a completely new model or a bigger upgrade. In the car example, this translates to a face-lift model of a car that occurs in a shorter time frame (currently just 1–3 years) than a completely new updated version of a car model.
Another aspect we consider in our scenario is the distributed fashion of a manufacturing company itself. For global companies, the aspect of geographically distributed factories that operate on their own is another vital aspect. This distribution may be motivated by various reasons like financial aspects or regional consumer requirements. Although the general structure of the distributed production sites are similar and the sites often produce the same general product, there are variances and differences in each dedicated process. They not only produce other parts or assemble another product, the machines are naturally of different age and wear levels. Furthermore, regional factors such as working hours, legal requirements or the stability of the electric network have to be regarded. Additionally, timing optimization of the production has to deal with different time zones and the information of location is important. All of these are factors that have to be considered for the time to analytics.
We regard a company with multiple geographically distributed production sites. Each site has at least two separate network zones. The manufacturing process consists of multiple distinguishable divisions providing their own dedicated, potentially proprietary data management systems. The following sections highlight some specific aspects of the scenario.
3.2. Production Divisions
In our scenario, we consider that, in one site, i.e., one factory, the product is produced in multiple sequential and/or parallel stages by dedicated and specialized divisions. Therefore, at each location, we have divisions that match the requirements of the product. While some divisions may be present at every location, some may be only used in specific locations. Each division is responsible for one specific step in the process of creating the product.
Figure 2 shows an example for one production site and the interaction of the corresponding divisions. Here, we see the existing material flow of the production process along with the lack of data flow in the process from one division to the next.
As a concrete example, we look again at the automobile industry. There are many divisions involved in the creation of an automobile, however, for the sake of simplicity, we focus on some of the most well known ones. Consider these divisions in the automobile industry: logistic, body shop, paint shop and assembly.
The logistics division receives orders for cars to be built, it orders the required materials and it is responsible that the other manufacturing divisions have enough resources to do their job. After the materials are available, metal sheets will be pressed and cut into body parts, which will be used in the body shop to assemble the body of the car. Depending on the model, there are multiple paths that the raw materials and parts can take on their way into the final product. In the paint shop, the body will be painted according to the colors ordered by the customer. Painting also does not consist of one simple step. There are multiple sub steps involved, e.g., the application of primers, adhesion, coating and other layers of chemicals specific to the model or the paint. Finally, in the assembly division, we find again a highly dynamic process. Depending on the configuration of the ordered car, different components are going to be put together. For example, one order contains special leather seats while another customer wants the premium satellite navigation system. Therefore, based on the configuration of the car, the assembly is often unique to one specific car, where not all steps have to be taken for every product.
Each of these steps in the production process have a different semantical concept for the same thing. In the body shop and paint shop, it is the bare metal body as a part of the car, whereas, in assembly and logistics, it is a car. This results in different designations of the parts, which all end up in the end product, as the sum of all parts.
However, on an abstract level, similar steps are carried out at each location and could be considered for analytical applications. The most prominent problem for analytics from a global perspective is the interoperability between the data silos used at the different divisions and locations. There is very strict separation of data sources in enterprises like this. Each division is working as a sovereign unit. The operators of the divisions are focused on the optimal operation of their tasks. There are systems in place responsible for the operation and the monitoring of these specific tasks. The data there is stored inside one or multiple dedicated systems—silos dedicated to a specific division. Even on a division level, each subtask potentially is operated in a similar fashion. The problem becomes even more evident if we consider that the production sites may not be located in the same country. This global distribution gives each system a country-specific touch. Starting with trivial differences like the language and different time zones, other non-trivial differences may include country-specific regulations.
Therefore, there are data silos distributed across the whole company often containing similar process information, inaccessible or not compatible. Thus, the production scenario considers the problems related to the interoperability of semantically similar data sets coming from physically separated divisions.
3.3. Brown-Field Data Acquisition
Another important aspect of our production scenario is related to the separation of computer and communication networks. The typical IT setup in industrial settings is to secure and separate the production shop floor from business office computers. Current standards by the International Organization for Standardization and International Electrotechnical Commission, such as ISO/IEC 27002 [
6] or [
7], are suggesting the use of technical barriers like firewalls and audited access controls. However, despite the security aspect, these restrictions oppose the endeavors of an Industry 4.0, which demands a full and seamless interconnection of machines and information systems along the manufacturing hierarchy and thereby represents a major challenge. This challenge is also considered by various research studies [
8,
9] regarding the brown-field scenario and how to include existing devices into the digitalization. However, this task is not the focus of our work, and we focus on how to acquire the data of such devices despite or in conformity with the given restrictions.
The data sources in our settings can be generally divided into the categories production critical and non-critical. The automation pyramid defines up to five hierarchy levels: field, control, supervision, management and enterprise of the communication layers on the production network. All systems that are located above the control level are considered to be non-critical with regards to the production process itself. If these systems are non-operational, the manufacturing operation still proceeds and is unaffected. Although these levels will get more blurry or get combined with progressing digitalization of the Industry 4.0 movement, the basic aspect of production criticalness will still remain. Therefore, we have systems with a low direct process impact at the top and systems that are directly and physically controlling machines on the bottom field level. Data sources in the non-critical category can be accessed arbitrarily. The most intensive task when accessing these systems is related to network access restrictions. Interested parties often can request direct access to these systems and will then receive a read-only view without much hassle. These systems are often located in networks, which are already close to the office zone. In the critical area, however, we are getting closer to the actual machines themselves. Source systems in this category have a direct controlling aspect. There are aspects like real-time control, i.e., deterministic bounds on response times these systems have to consider. Arbitrary access to these systems will have a direct impact on the production process. In the worst case, the production will come to a stop. The pyramid also reveals that unfortunately most of the data is being generated at the lower layers. Upper layers will only receive condensed information or aggregated reports, such as key-performance indicators (KPI) that are updated on a lower frequent basis. For instance, if we consider an assembly robot, we could be interested in all kinds of data points from this device. Live access to this device will create a massive stream of continuously changing values, which could potentially overload the bandwidth of the networking as well as crippling its original purpose of controlling the robot. For such systems, it is essential to a have a controlled access, guaranteeing a deterministic load on the network infrastructure.
Furthermore, this variance of systems on the hierarchical levels is only one part of the diversity with a different access mechanism. The field level consists mainly of streaming data in contrast to the more rarely-changing batch natured data on the higher levels. The time-dependent control operation on the shop floor deals with different requirements than the reporting layer on the enterprise level. However, also on each of these levels a great variety of systems is put in place. The different requirements of the specific layers create the need for various protocols, formats, storage or communication approaches. Especially, due to the brown-field scenario with a multitude of legacy devices on the field level, a wide zoo of technologies exist even at one plant. The problem is present in all the levels up to the enterprise level, where, for example, different dashboard and reporting systems as well as storage techniques are used for specific analytic tasks. Everything is uniquely tailored to a specific job and thus to requirements at hand.
The industrial environment, as considered in this paper, therefore consists of a grown ecosystem, containing a variety of different data sources. These sources primarily serve the specific needs of the business areas and their tasks. The tasks deal with a wide range of data properties like volume, velocity and variety. Since an analytical use case requires access to the data contained in such a system, an approach is required that can also handle a large number of very specific system-dependent requirements.
4. Data Ingestion Pipeline
In this section, we describe an ingestion pipeline compatible with the industrial scenario described in
Section 3. In general, the ingestion pipeline is built around the concept of dynamically reconfigurable agents (cf.
Section 4.1), which access a source system and retrieve the relevant data points, acting as an intermediary for all plant data acquisition plans. These agents require configuration (cf.
Section 4.2) in order to operate and connect to a data source system and handle the specific data ingestion, retrieving data along with its meta information, such as the data schema. This agent concept is based on the general integration architecture previously published in Kirmse et al. [
10]. The previous work presents a basic abstraction architecture of data sources over a modularized framework. So far, it lacks the semantic integration and is therefore extended with the connection to ESKAPE (cf.
Section 5).
Figure 3 shows schematically how the agents connect to different systems using configurable connectors for arbitrary systems, how they store the collected data in a buffering system and forward it to a data consumer. Agents cooperate universally across geographic locations, divisions and network zones and thereby help to reduce the complexity overhead of organizational as well as multiple connections to the same source (e.g., spaghetti network topology).
4.1. Ingestion Agents
As described in the previous section, accessing data sources on the lower levels of the automation pyramid has to be coordinated in order to prevent the collapse of the production. The concept of an agent acting as a single data customer for those systems relieves the need to negotiate multiple agreements between multitudes of interested parties. A single coordination instance also counters the problem of creating many connections to the systems, opening firewalls for every connection or maintaining access restrictions. Since there are many systems without this single coordinator, the management overhead will increase exponentially. In the sense of the Industry 4.0, interconnectivity is the goal to be achieved. However, if these connections are made in an uncoordinated manner, they cause more problems than benefits. Therefore, the agent also acts as a new access point for parties interested outside the scope of the data lake ingestion pipeline. The agent retrieves the data and stores it in an intermediate storage, which is potentially dedicated to a production site. In general, the agent is equipped with a buffering system implemented by a message queue system to decouple the systems load, such as the Advanced Message Queuing Protocol (AMQP) [
11]. AMQP is an open source message-oriented broker based publish–subscribe protocol for reliable message exchange. The AMQP broker acts as a buffer and an access point to high frequency data. A default endpoint of the agent is the connection to the semantic data platform ESKAPE (cf.
Section 5). The communication from the agent to ESKAPE is thus handled over AMQP, where ESKAPE is one consumer of the messages published by the different agents. A newly started agent automatically uses the Representational State Transfer Application Programming Interface (REST API) of ESKAPE to notify about a new data source, which includes the credentials (user name/password) and connection details (such as the topic) of the AMQP broker. Later on, ESKAPE subscribes to the AMQP topic and receives the data that is sent by the agent (cf.
Section 5).
The agent is a piece of software that can potentially run on any machine and can be deployed depending on the specifications of the production site. For the implementation, we rely on the Java programming language and its multi-platform and modularization capabilities. Additionally, we rely on the Spring framework [
12] as an abstraction of the operational boilerplate code. This approach covers a wide range of deployment scenarios as agents can be run on a containerized service architecture located on or off the premises. They can be deployed on edge devices or on dedicated machines. For example, in order to deal with network congestion, the agent could run on an industrial computer close to the field device, reducing the network traffic from the device through the whole production network. Simultaneously acting as a gateway to a potential separated ingestion network, one agent can access a multitude of data sources at once. Depending on the load of the agent, it is also possible to deploy a multitude of agents, accessing single systems or even subsets of one system. Thus, the agent approach is highly scalable. The distribution of agents in the complete integration context will be described in more detail in
Section 5.
As described in
Section 3, the agent has to consider different kinds of source systems. The first category of source systems are classical database systems. These data sources are often used by systems at the upper layers of the automation pyramid, for example, Enterprise Resource Planning (ERP) systems or Manufacturing Execution Systems (MES). Database systems provide a standardized interface for access. These interfaces are often based on dialects of the Structured Query Language (SQL). Although there exists the SQL standard defined in ISO/IEC 9075 [
13] and extended by ISO/IEC 13249, different variants are still in use. For example, database providers add additional features to the language or change the syntax. Listing 1 shows an example for the same query on three different systems:
Listing 1: The different Structured Query Language (SQL) dialects for “get the first 10 rows of table ‘table’ ”.
![Technologies 06 00086 i001]()
There are system dependent specifications that require the agent to handle different database systems differently. The query language is only the first difference. Another concern is the data type used by these databases. Each system is providing a different set of data types where some are compatible with each other while others are not. The agent homogenizes these differences and provides an abstraction to all these systems.
When accessing the data from database systems, they are usually already heavily loaded and therefore the task of retrieving data is a batch job with defined time constraints. Thus, the agent can access, within the coordinated limits, a batch of data points in the source systems. The access method is based on the polling principle. Hence, for batch data access, the agent needs to be limited to a certain polling frequency and polling batch size. This polling can occur on tables as well as views inside the database system as long as reading access is granted. For more critical database systems, also a strictly defined query can be set. Other systems, which fall under the batch category, are file-based systems—for example, a shared network folder or an File Transfer Protocol (FTP) server where some files are located.
The second category of source systems is concerned with systems mainly located at the lower levels of the automation pyramid. At the base level, these systems are machines on the shop floor. In contrast to the first category, these data sources provide a continuous stream of data points. The agent therefore needs to be connected to these systems continuously and perform a stream ingestion process. Current standards for data access on the machine level include interfaces like Open Platform Communications Unified Architecture (OPC UA [
14]) or Message Queue Telemetry Transport (MQTT [
15]). The principle of OPC UA currently involves the connection to a dedicated OPC UA server. Today, an OPC UA server is often integrated into the Programmable Logic Controller (PLC) directly providing access to certain register values. However, since OPC UA is an extension to the classical data access (Distributed) Component Object Model (COM/DCOM) OPC, there exist so-called wrappers that also enable the direct access of such legacy devices within OPC UA [
9]. The benefit of UA is the information description of the values with a meta model consisting of blueprint objects defined by the standard and extensible by vendors. OPC UA allows for registering for certain value change events, e.g., the value changed by a certain percentage. The agent can therefore be configured to listen for such an event and provide the resulting values. In practical use cases, the agents will register for a certain change event and then read a group of values once the event value changes. For example, the PLC is tracking the current product. Once the tracking identifier changes, the agent will read out the values of some sensors connected to the PLC to get a continuous stream of process start states. Another common standard is the MQTT protocol, where the agent subscribes to certain topics and will receive updates immediately after something was published to the subscribed topic. The MQTT protocol is very lightweight and has a small footprint, specifically tailored to small low energy devices, which also benefits its use in the smart home context. The data itself is arbitrary. Therefore, no explicit description of the contained information is given, unless this is realized with the hierarchical topic tree.
In general, the agent performs its data acquisition tasks and transfers data from one point to another. Additionally, it is also capable of detecting changes to the source system and react to recoverable changes of the source system. Thus, the agent is a skeleton, which comes with a pre-defined set of capabilities. How it behaves solely depends on the configuration. The design of the ingestion agent allows for a flexible extension in order to handle arbitrary future and legacy source systems. In order to add a new agent for an arbitrary and specific data source, only the specifics of the communication have to be implemented. This includes the specifics of connecting and data access, for example, implementing a specific protocol or polling mechanism. The agent framework provides the environment to transmit data via AMQP to any possible endpoint.
4.2. Configuration
The configuration is the description of a data source for the agent. The idea of the configuration is to have an abstraction level and ease of connection by not having to deal with the specifics of the individual system, but focus on the relevant part of data access. In order to be able to connect to a data source, the location and access credentials need to be provided. Furthermore, the description of the data itself and what data pieces the agent has to ingest have to be specified. This connection information is part of a preliminary configuration. An automatic tool can use this information in order to connect with the data source. The content of such a configuration is shown exemplary in
Figure 4.
In case of Relational Database Management Systems (RDBMS), the tool does an automatic detection of all tables and identifies their index fields in order to detect newly arriving data points as well as changes in the data. The change detection requires an updated field value, such as a last modification timestamp or principal of re-adding the whole entry (table row) with a new unique identifier. For the OPC UA protocol, the detection tool performs a complete server browse in order to list all readable nodes and for MQTT a complete tree browse of available topics. Afterwards, it allows for precisely defining trigger values on which data points, defined as a reading group, should be ingested. The trigger can either be time-based as an interval trigger (also CRON) or value change based for a deadband-value. Here, the variance in a specified data value defines the reading process, which can also be a step counter of the machine states.
The resulting configuration by the automatic tool is a default configuration for this system, which can be used without further modifications. The agent uses this configuration for the continuous and ongoing ingestion of data along with its data schema that it extracts specifically from the source system. Additionally, the user can further enhance and modify this configuration and tweak the polling time as well as batch sizes according to the requirements of the system. Some RBDMS already have stressful times during maintenance times, where additional data load would increase the time or also hinder their default operation. Also limiting the size of transferred data can assure the proper utilization of network infrastructure by stretching heavy peak traffic to a flat but continuous flow of data packets. This can also concur with transfer jobs that already limit available network capacity and thereby shift the load to a less used time window.
The configuration thus is a crucial part of the reduction in time to analytics, when the system is the only source of the data needed for a specific analytics. If the source is already defined by a configuration description, it only has to be changed if the available data schema is also changed. The configuration has to be done only one time for a data source to be ingested into the semantic data platform.
In summary, the described ingestion concept leverages the problems of accessing data source systems providing a flexible and scalable solution for the wide range of data sources available in an environment of complex and heterogeneous infrastructures like the IoP.
5. Semantic Data Platform
ESKAPE, previously published by Pomp et al. [
3,
4], is a semantic data platform that connects data stewards and data scientists. The goal of ESKAPE is to semantically integrate different heterogeneous data sources into its data lake. Therefore, ESKAPE is capable of collecting data from different sources (e.g., file systems, AMQP, HTTP, Twitter, ...) in various formats (e.g., Extensible Markup Language (XML), JavaScript Object Notation (JSON), Comma-separated values (CSV), Avro, ...). It offers a REST API to register new data sources and a user interface to monitor and manage all registered data sources. To increase the usability and comprehensibility of registered sources for users such as data scientists, ESKAPE uses semantic annotations in the form of semantic models that are stored alongside the data sets. Therefore, data stewards are responsible for creating semantic models for all the data sources that are added to ESKAPE. This enables data scientists to search, process and extract the available data sources based on their semantic meanings rather than on their raw data attributes.
Figure 5 gives an overview about the interaction between ESKAPE and the ingestion agents, which are described in
Section 4.1. On each plant, multiple agents collect data from different heterogeneous data sources, such as database systems, machines or file directories. As described in
Section 4.1, the data that is collected by the agents is ingested into ESKAPE via AMQP. If an agent is started for the first time, it registers itself as a new data source at ESKAPE via a REST call. Afterwards, ESKAPE reads the data from the newly registered data source, analyzes its schema and presents it to the responsible data steward. Based on the detected schema, the data steward has to create a semantic model for it by using ESKAPE’s web client. Each created semantic model is added to a knowledge graph that is maintained by ESKAPE. Thus, ESKAPE’s knowledge graph continuously evolves based on the semantic models created by all the data stewards. Based on the created semantic models, ESKAPE performs a semantic data integration into the data lake. This integration links the raw data attributes to the semantic information covered in the knowledge graph resulting in a semantic data lake, which we define as follows:
Definition 1. A semantic data lake extends the capabilities of a traditional data lake by storing semantic descriptions alongside the records. It consists of raw data storage containing the data, a precisely defined mapping between the data attributes and their semantic representation, and a vocabulary that defines the available semantic concepts and their relationships.
As storing data sets with semantic models requires the data to be integrated in specific formats supporting those kinds of modifications, ESKAPE defines its own data format, named Semantic Linked Tree (SLT). The SLT format is a JSON-based data format that links the semantic information of the knowledge graph to the raw data values (cf.
Section 5.1.4). This enables us to add semantic information to the raw data values within the data format.
The Internet of Production is aiming to establish an infrastructure where data can be used based on the needs of the data consumer. The concept is premised on the concept of highlighting the research object from use case specific perspectives, called digital shadows. These digital shadows should only consist of relevant information described in terms the consumer is familiar with. ESKAPE incorporates this vision by enable a flexible semantic description and extraction of data sets. Also leveraging, by considering semantic processing, that the data consumer could also be a machine, envisioning semantic machine to machine communication.
In
Section 5.1, we give an overview of the general three-layered information storage architecture with detailed looks into the single components and their technical realization. Afterwards, we give in
Section 5.2 an overview of how data scientists can query and extract the data from ESKAPE.
5.1. Information Storage Architecture
The previous publications [
3,
4] about ESKAPE gave only an overview of the core functionalities and concepts of ESKAPE. Although ESKAPE’s semantic data storage has already been mentioned in these publications, it has not been fully described. The following sections describe in detail how the ingested data is stored in the data lake and how the engine converts the raw data lake into a semantic data lake using semantic annotations. We call this storage model
information storage as it is capable of storing and providing more than plain data.
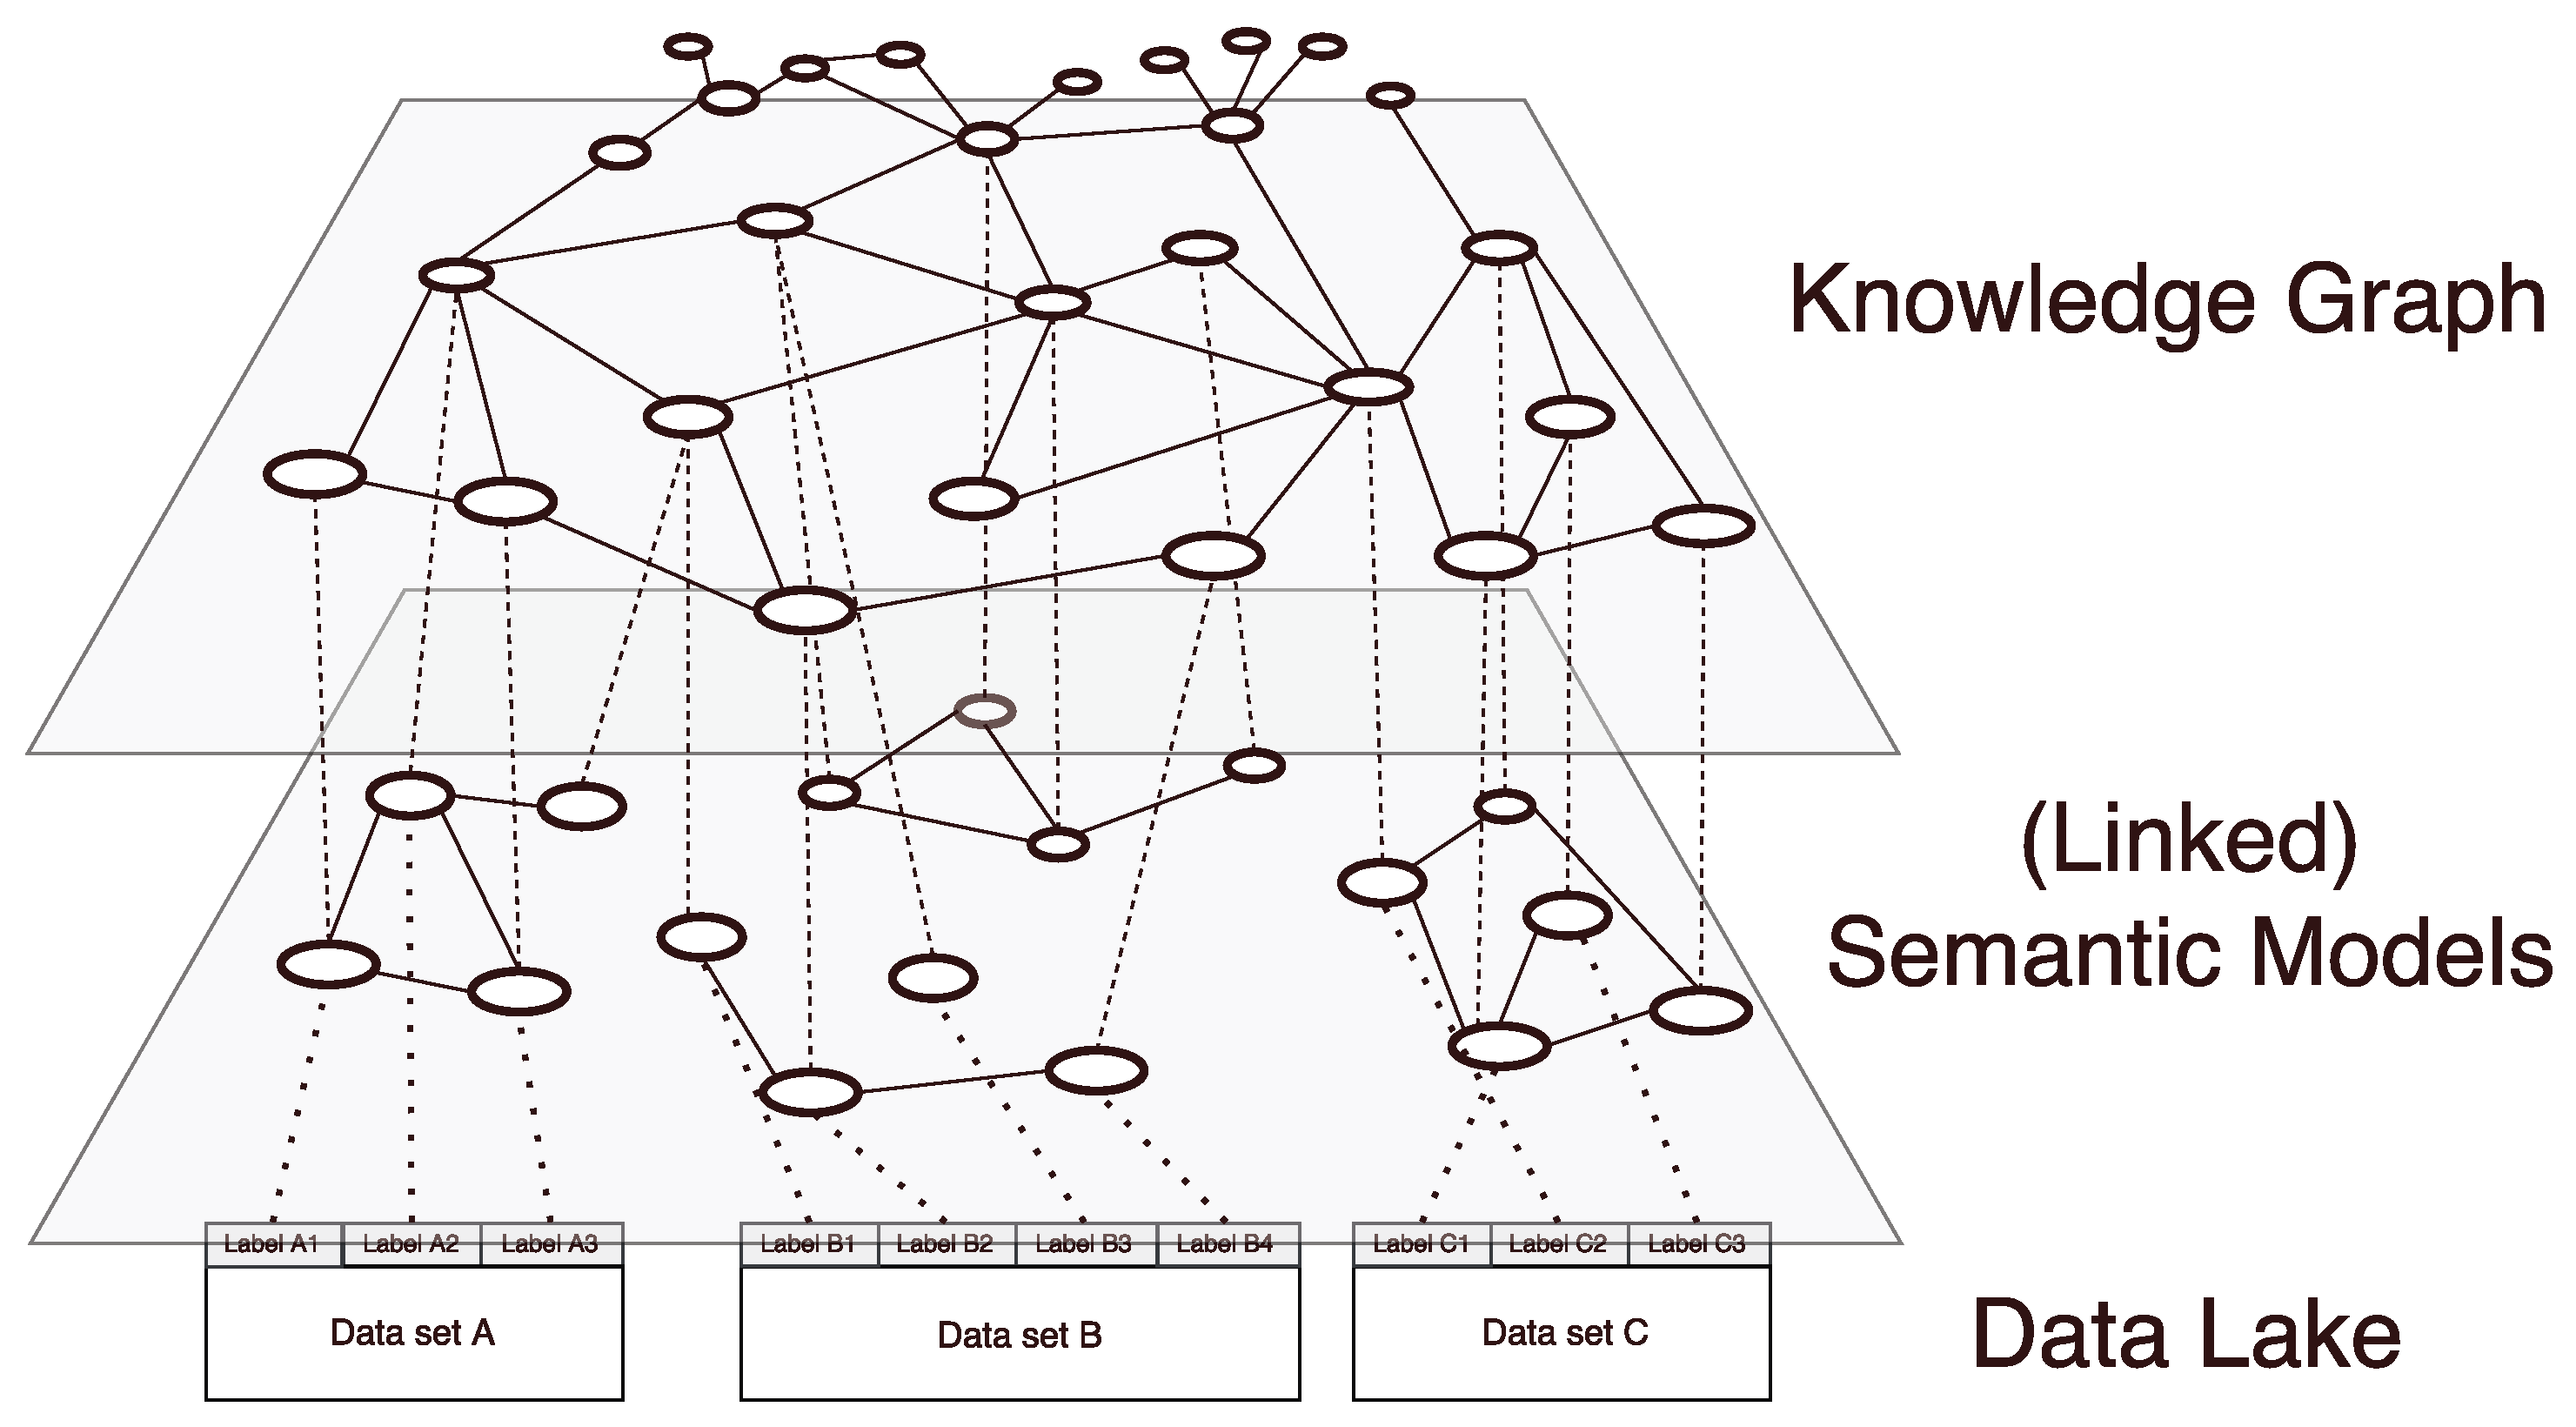
Our general information storage architecture incorporates three layers. The arrangement of layers can be seen in
Figure 6, whereas the lowest layer holds the raw integrated data, the middle layer stores the attached semantic models and the top layer is formed by the knowledge graph. The bottom layer, which we call
data layer, resembles a data lake and only consists of unconnected data sets that are only labeled by an ID and have no further information attached to them.
The intermediate layer, called the semantic layer, holds a semantic model for each of the data sets stored in the underlying data layer. Those semantic models are created during the initial addition of the data into the information storage. The creation is done by a data steward who possesses the domain and context knowledge necessary to annotate the new data sets. Thus, a semantic model represents the data stewards understanding of a data source and serves as a description of the data contained in the data sets, allowing data consumers, who might not be familiar with the data, to understand its meaning.
The top layer, which we call the knowledge layer, combines all semantic models into one repository, called knowledge graph. As elements from the knowledge graph can be used in multiple semantic models, the knowledge graph provides linkage between those data sets. Furthermore, the knowledge graph is extended by newly added semantic concepts/relations and thus is able to adapt to the users’ needs. Elements of the knowledge graph can be reused during the modeling process and therefore serve as anchors when relating different distinct semantic models and data sets. This way, the knowledge graph can serve as an index of all information that is available in the system.
In the following, we present the single layers in a more detailed way and describe the technical challenges and techniques used to realize the information storage.
5.1.1. Semantic Layer
A main prerequisite of storing data with semantic annotations is the definition of suitable semantic elements to form a semantic model of a data set. In our architecture, semantic models serve two purposes. First, they give a formal meaning to the content of the data set and second provide an abstraction layer to the raw data. Semantic models consist of semantic concepts and give information on how the values represented by the model are to be interpreted. Additionally, they provide information about the relations between those concepts. A data set with a provided semantic model can be used by people not familiar with the original data as the semantic model provides the necessary context knowledge.
In our architecture, semantic models build the customization layer between the underlying knowledge graph and the raw data of the data provider. Semantic models consist of so-called Entity Types and Relations.
An Entity Type is a provider defined entity used for modeling that can be freely labeled and described to represent the provider’s view on the data set. During the modeling process, an Entity Type can either be mapped to a data attribute of the current data set directly or it can specify, generalize or combine other Entity Types. Exemplary data attributes can be the column of a table (e.g., in a CSV file) or a leaf node in a hierarchical data set (e.g., JSON-based data sets). When the user creates the Entity Type, the user can freely choose a label. For example, if the user creates an Entity Type and maps it to a data attribute, the label of the Entity Type could be either adopted from the data attribute or it can be renamed according to the user’s needs. In addition to a label, a data provider can also add an additional description. Thus, each Entity Type is unique and independent of each other. It is not universally valid and will not be shared with any other model. However, it allows for specifying more useful information on a given data attribute enabling data analysts to get a more fine-grained description of the modeled entity.
Figure 7 shows some links of data attributes to Entity Types, e.g., ‘hum’ and ‘humidity’. If and only if an Entity Type is linked to an attribute, the Entity Type also contains information on how the value stored in this attribute is to be syntactically handled. The
Data Type specifies whether the attribute values contain Numbers, Strings, Booleans or Binaries. This information originally does not belong to the semantic model but is nevertheless stored in our Entity Types, which therefore not only contain semantic data but serve as a more flexible modeling tool. Once an Entity Type has been defined for a data attribute, it will overshadow that attribute’s original label. The attribute will only be referenced by its semantic annotation from that time on. Following this approach, in our Information Storage, Entity Types serve as the central elements to form semantic models as they represent the data sets meaning more closely and from a user’s perspective.
To ensure the universal understandability of an Entity Type, each Entity Type is mapped to an Entity Concept associating the Entity Type with a globally valid semantic. This enables reasoning over multiple data sets. In general, an Entity Concept can be taken from any available vocabulary, such as an ontology. However, in our case, all concepts are obtained from the Knowledge Graph to enable knowledge expansion. Therefore, Entity Concept labels cannot be changed by the user. An Entity Concept does either already belong to the knowledge graph or the user defines a new one which is added to the knowledge graph (cf.
Section 5.1.2). Examples can be seen in
Figure 7, e.g., the Entity Concept
identifier (upper part of each node) is assigned to the user-defined Entity Type
reading ID (lower part) to preserve its universal meaning while the custom Entity Types label defines which type of ‘identifier’ is actually meant.
To add more context to a semantic model, the data provider can define additional relations between Entity Types as shown in
Figure 7. In our semantic models, Relations can only be defined for Entity Types and can have any semantic meaning, e.g., ‘has’, ‘consistsOf’, ‘isA’ to name a few common, but also more specific ones like ‘measures’, ‘relatesTo’ or any other user customized label. Similar to Entity Types, each relation is mapped to a Relation Concept (cf.
Section 5.1.2), which is either already present in the knowledge graph or introduced by the user on-demand. In contrast to Entity Types, it is not possible to define different labels or descriptions for Relations. Hence, Relations always inherit the properties of their linked Relation Concept.
5.1.2. Knowledge Layer
The knowledge layer forms the topmost layer of the information storage and incorporates (semantic) data from all semantic models into a single knowledge graph. We do not use any public ontology since there does not exist any ontology that covers all the concepts and relations that may be required in such flexible enterprise settings. This is the reason why we decided to follow a bottom-up approach instead of a traditional top-down approach based on ontologies. As defined by Gruber [
16], ontologies are the explicit and formal specification of a shared conceptualization. Today, humans decide in discussions and meetings what relations and concepts will be added to the ontology. Instead of letting humans define the ontology by discussing their shared conceptualization explicitly, ESKAPE builds its knowledge graph based on the semantic models created by the different data stewards. Similar to traditional ontologies, this knowledge graph builds an explicit and formal specification of a shared conceptualization. However, the shared conceptualization is based on the explicit and formal specification of all individual conceptualizations provided by the data stewards as semantic models. Each data steward defines his conceptualization of a data set as a semantic model and ESKAPE merges all defined conceptualizations into the knowledge graph which then results in the shared conceptualization of all data stewards and data sources. Thus, the knowledge graph gets updated and grows with newly added models. To combine the defined semantic models, ESKAPE is supervised by external knowledge bases, such as WordNet, BabelNet or existing public ontologies as well as domain specific sources. Thus, the knowledge graph functions as an index of all semantic knowledge that is available in the storage. As the knowledge graph is more than an traditional ontology, we define it as follows:
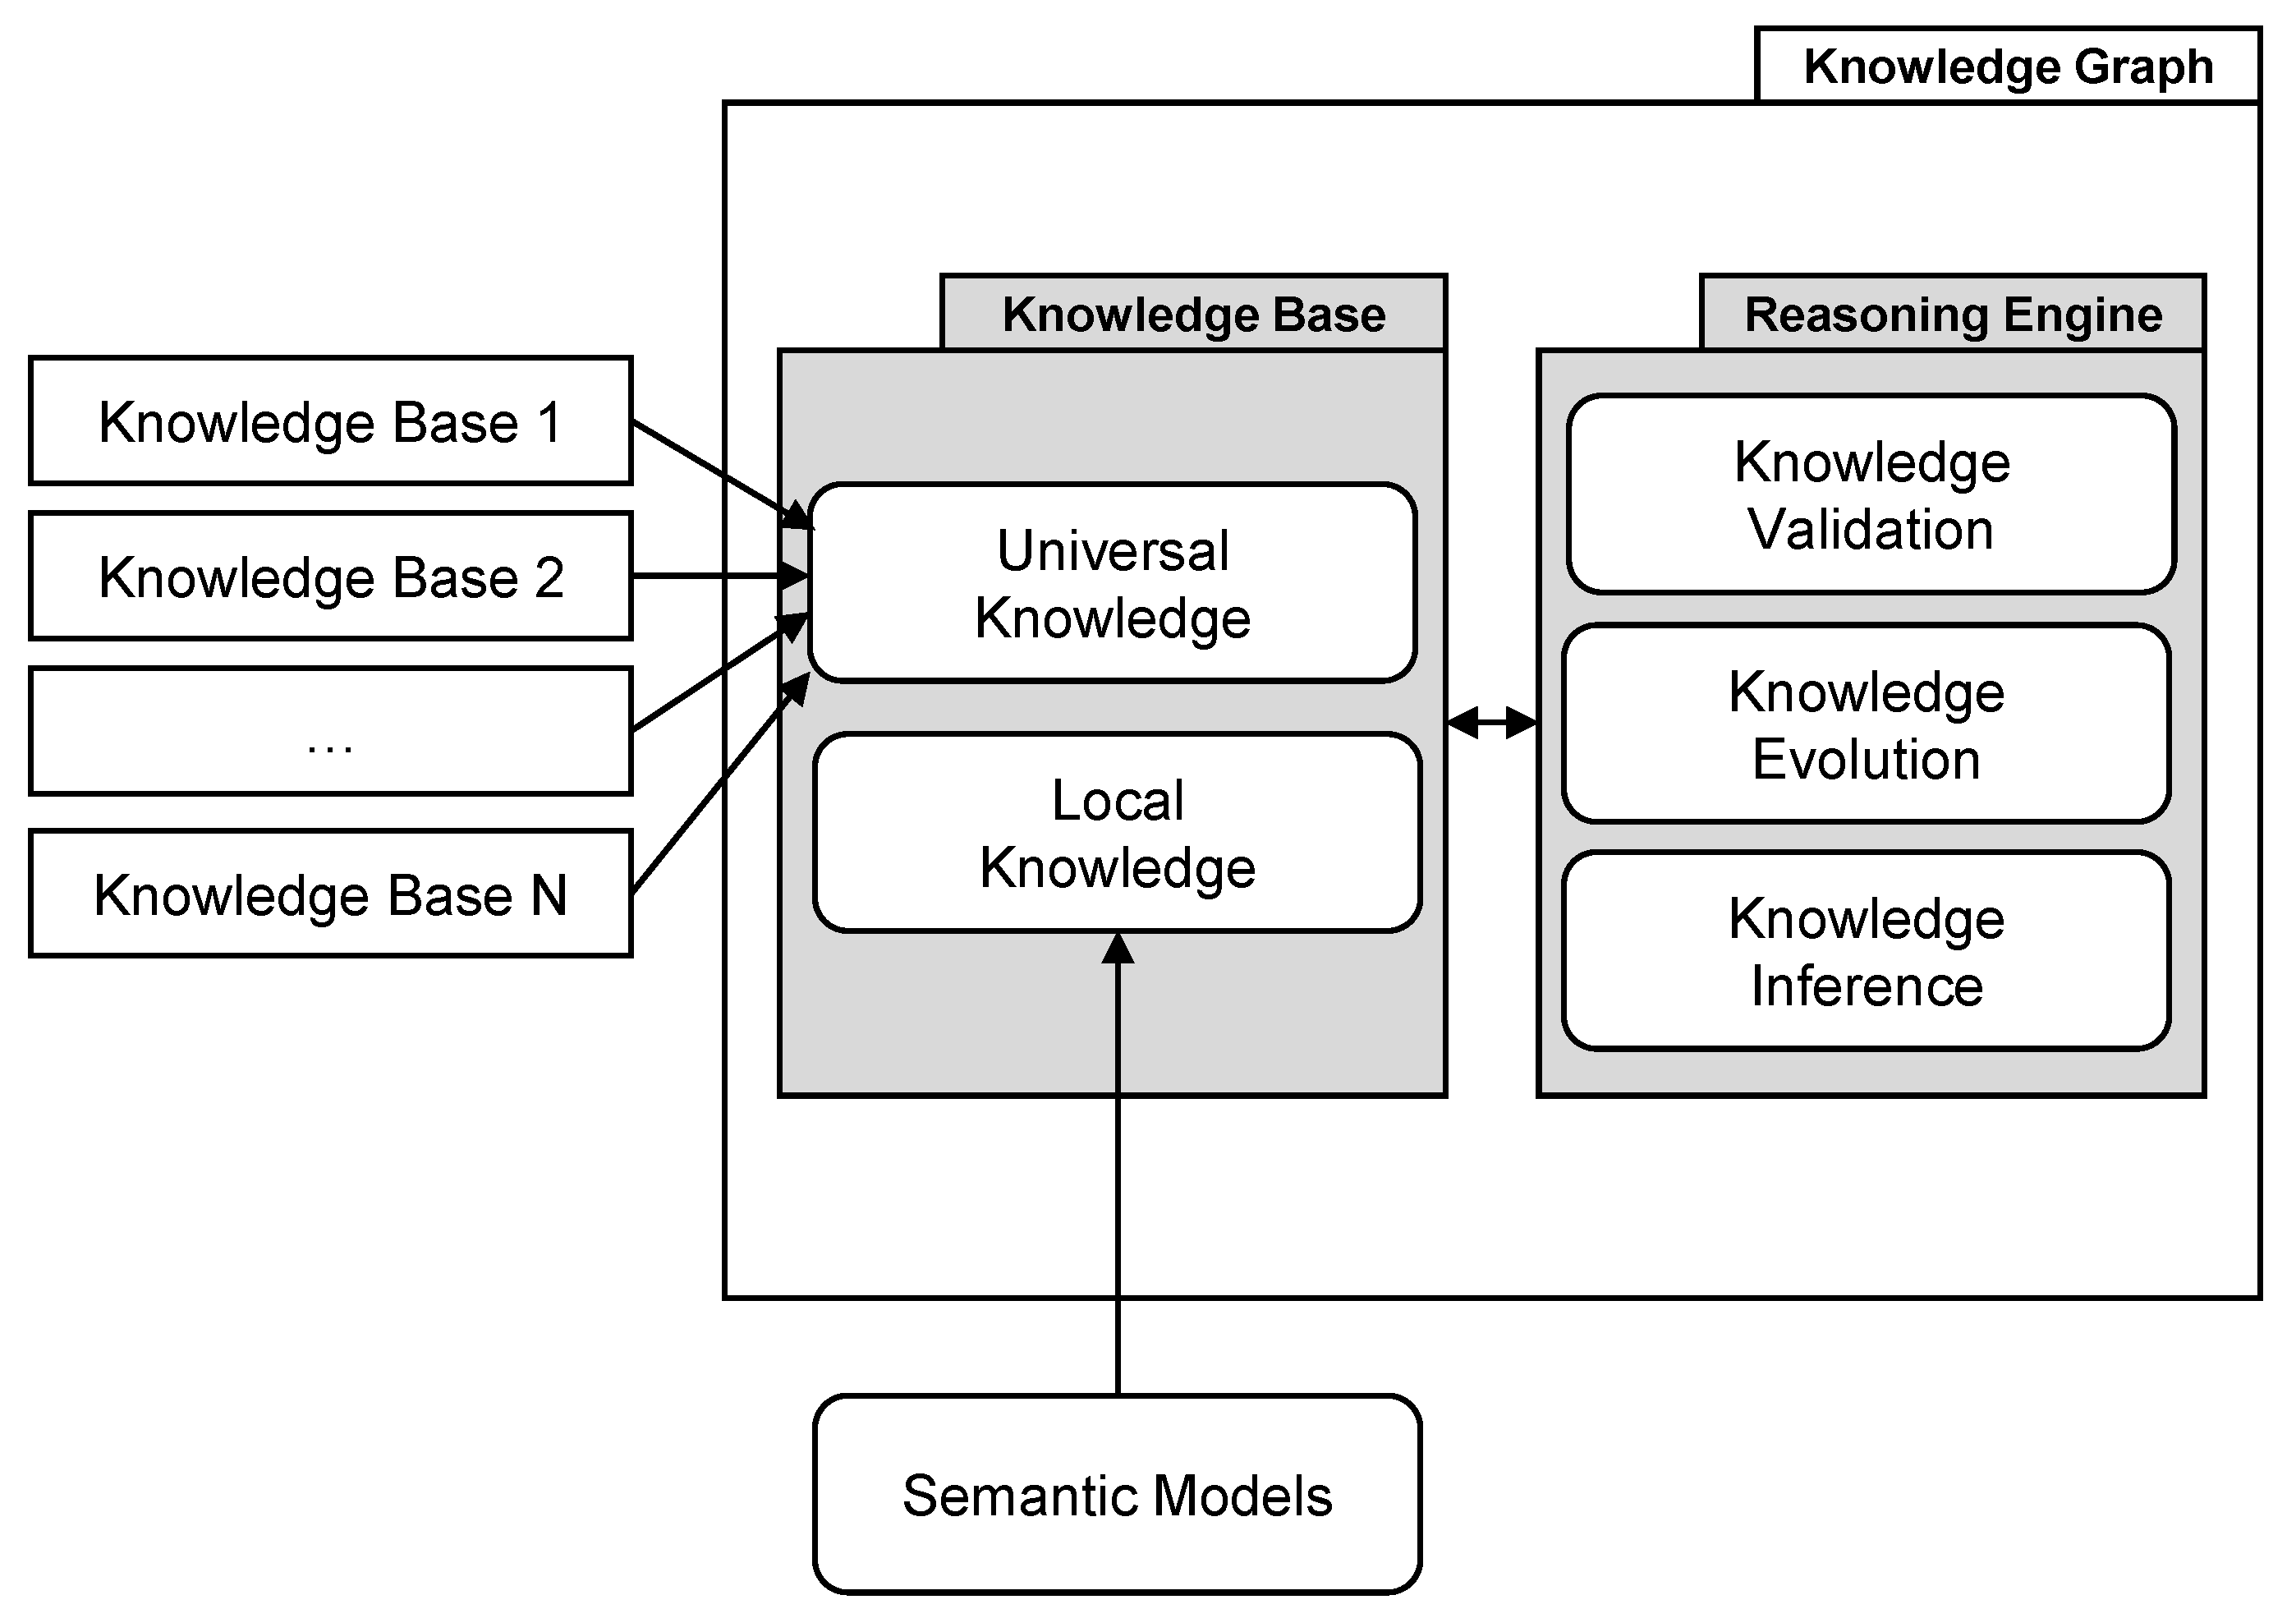
Definition 2. A knowledge graph is a dynamic system consisting of a continuously evolving internal knowledge base that interacts with an internal reasoning engine. The internal knowledge base features a local knowledge area learned from user-provided semantic models, and a universal knowledge core, which is supervised by the internal reasoning engine with the help of external knowledge bases. This universal knowledge core includes signature features of an ontology, and is continuously evolved by the knowledge evolution component, which adopts knowledge from the local knowledge area. Before the knowledge is adopted, it is validated by the knowledge validation component.
This definition is based on the knowledge graph model presented by Ehrlinger et al. [
17], and adds several crucial components to describe our vision of a knowledge graph in detail.
Figure 8 shows a graphical representation of our definition and illustrates the two essential components that we define, called knowledge base and reasoning engine, and their sub-features as well as the two different sources of knowledge. These are external knowledge bases providing universal fact knowledge, and user-provided semantic models, which provide locally valid knowledge that especially holds for the data sets they are assigned to. As soon as axioms from the local knowledge become accepted (i.e., if many users use them and therefore share the same opinion), the knowledge evolution component learns their significance and adopts them into the universal knowledge core. This information is then used to validate future statements from users. In addition, we plan to develop a Knowledge Inference component in the future, which will be responsible for deriving new knowledge from existing knowledge. We introduce this novel definition as existing definitions in related works are either too crude and too diverse or contradictory [
17]. The reason for this is that researchers either use the term
knowledge graph to describe different features or use distinct terms that are interchangeable with each other, although they have distinct particular meanings in other works.
On the implementation side, the knowledge graph consists of so-called Entity Concepts and Relation Concepts and refers to all available semantic models. Entity Concepts serve as globally unique semantic descriptors, which identify a generic or specific mental concept, such as identifier or person. An Entity Concept consists of a main label, a description, a number of synonym labels as well as whether the concept was obtained from an external knowledge base or if it was introduced by a user when it was missing. During the semantic modeling process, an Entity Concept is attached by the user to an Entity Type to describe its semantics. Hence, there exists an edge from the knowledge graph’s Entity Concept to that specific Entity Type. If a concept is reused multiple times, the knowledge graphs concept has multiple outgoing links to all Entity Types in which the concept is used.
Besides the named Entity Concepts, the knowledge graph contains so-called Relation Concepts. Those are semantic concepts that are used to define different relations between Entity Types in semantic models. A common example is the isA Relation Concept that indicates a preamble relationship between two Entity Types. The Relation Concept also holds all limitations that apply to relations using it, e.g., transitivity or asymmetry. By storing those attributes, the label and a common description at a single place inside the information storage, it is ensured that all relations using a specific Relation Concept (e.g., isA) provide the same semantic meaning. Similar to Entity Concepts, Relation Concepts can be created during the modeling process, allowing users to depict the world exactly as they wish to. If a Relation Concept is used a couple of times for a Relation between two Entity Types in different semantic models, the knowledge graph creates this Relation explicitly between two Entity Concepts of the knowledge graph. This enables suggesting this Relation to other users in the future.
If conflicts occur, these have to be solved, either manually (for small scale graphs) or automatically, e.g., by relying on external knowledge bases or by checking usage frequency. A major focus of our current research is to develop tools, techniques and heuristics to build a stable knowledge graph from various inputs. Opposite to semantic concepts, which usually do not influence each other and might peacefully coexist alongside in the same graph (duplicates and other problems are unwanted but not harmful to the graph’s consistency), relations are far more complex constructs and can cause multiple problems like violations of unidirectionality, contradicting relations or unwanted cyclic references (A isA B isA C isA A).
As all semantic concepts and their deducted relations are represented in the knowledge graph, it enables the system to provide searching, mapping and accessing tasks. Searching is simplified as all data concepts are stored in a single place and users do not have to crawl all available data sets. Mapping allows users to find similarities between distinct semantic models. This can, for example, be used to find substitute data sources or combine multiple data sources to a single one using nothing but the semantic annotations, a process we call
semantic processing. As our knowledge graph is a representation of available (semantic) concepts and relations, its contents are provided to the user during the modeling process (cf.
Section 5.1.1).
5.1.3. Semantic and Knowledge Layer Implementation
For the implementation of the semantic and knowledge layer, we choose a property graph database to model all semantic entities of our semantic models and the knowledge graph. Using a graph database allows for immediate modifications to the graph and furthermore the extension of single nodes to hold more data in case we need to change the underlying data model. We use Neo4J [
18] as technology as it is the current state of the art property graph database [
19]. We use version 3.4.1 of Neo4J, one of the latest versions as of writing this paper.
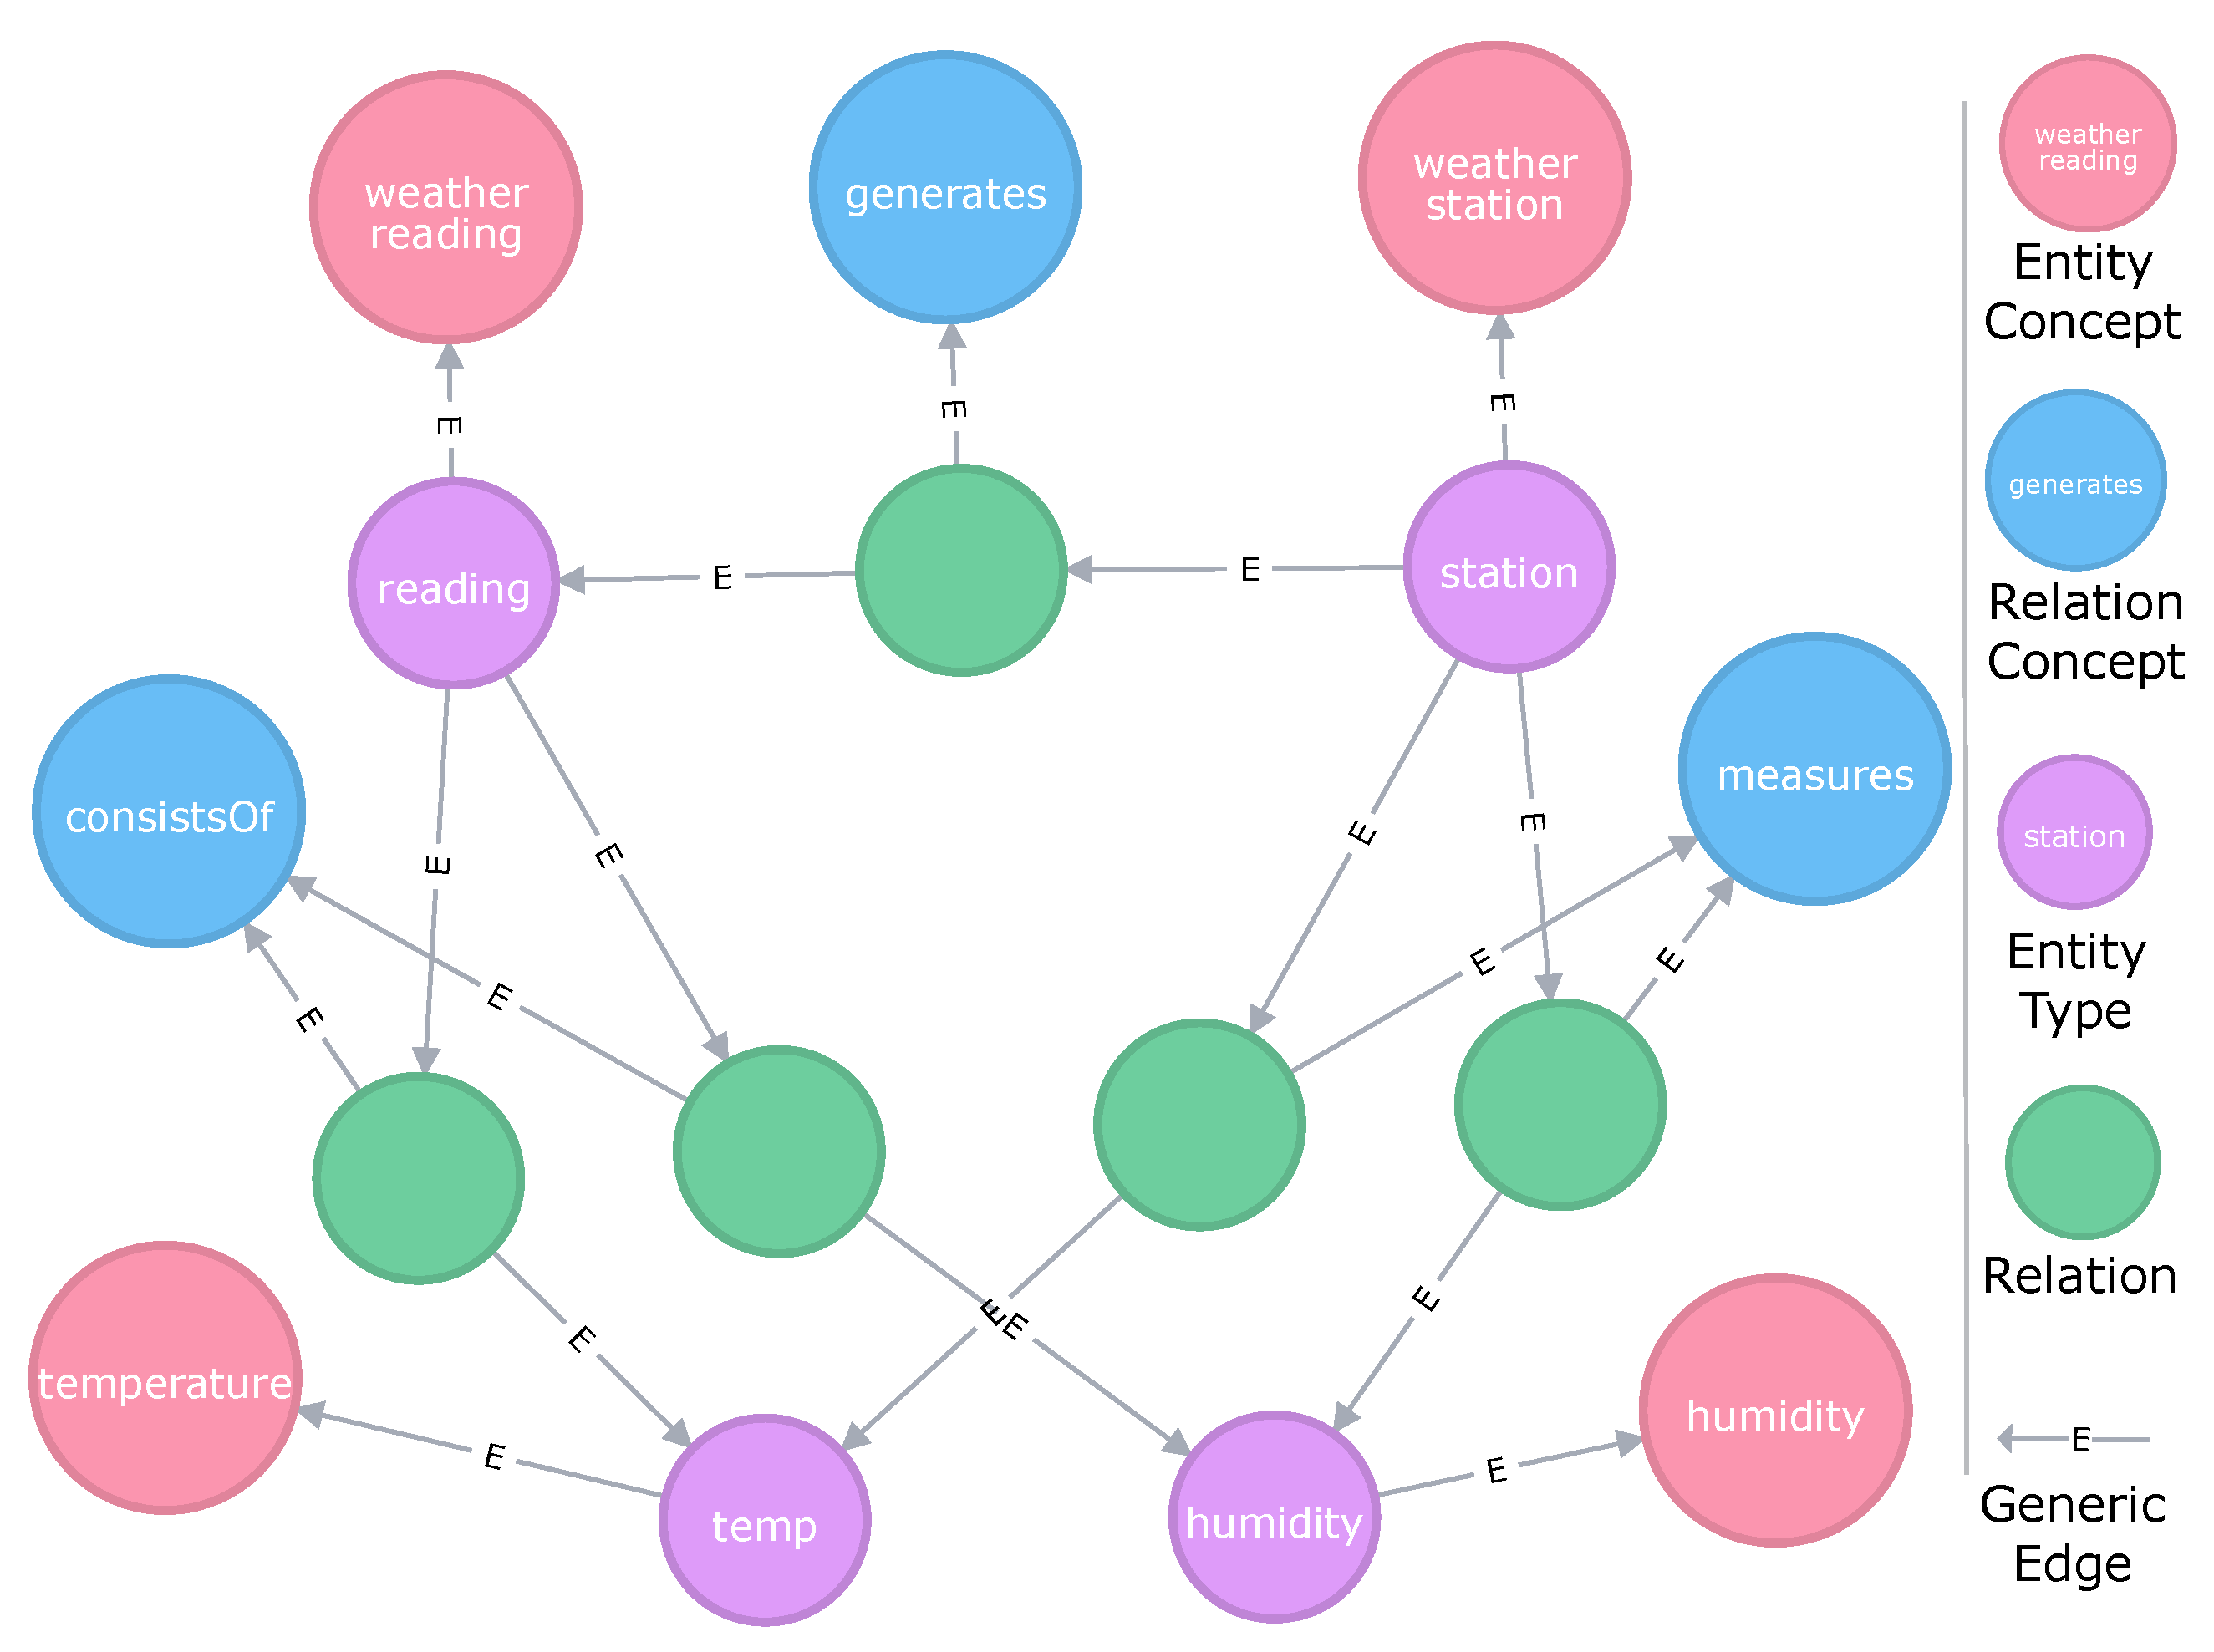
Figure 9 shows the graph representation of the semantic model shown in
Figure 7. As mentioned in
Section 5.1.2, relations are not single instances but are connected to a Relation Concept which defines the type of relation that is represented by that edge. This enables us to add additional information to each relation. For instance, we could add a property that models a period of validity or one that indicates which user introduced the relation.
For abstraction, Apache TinkerPop [
20] in combination with the graph traversal language Gremlin is used to build sophisticated drivers. This enables our semantic data platform to be compatible with any graph database that has TinkerPop support.
5.1.4. Data Layer
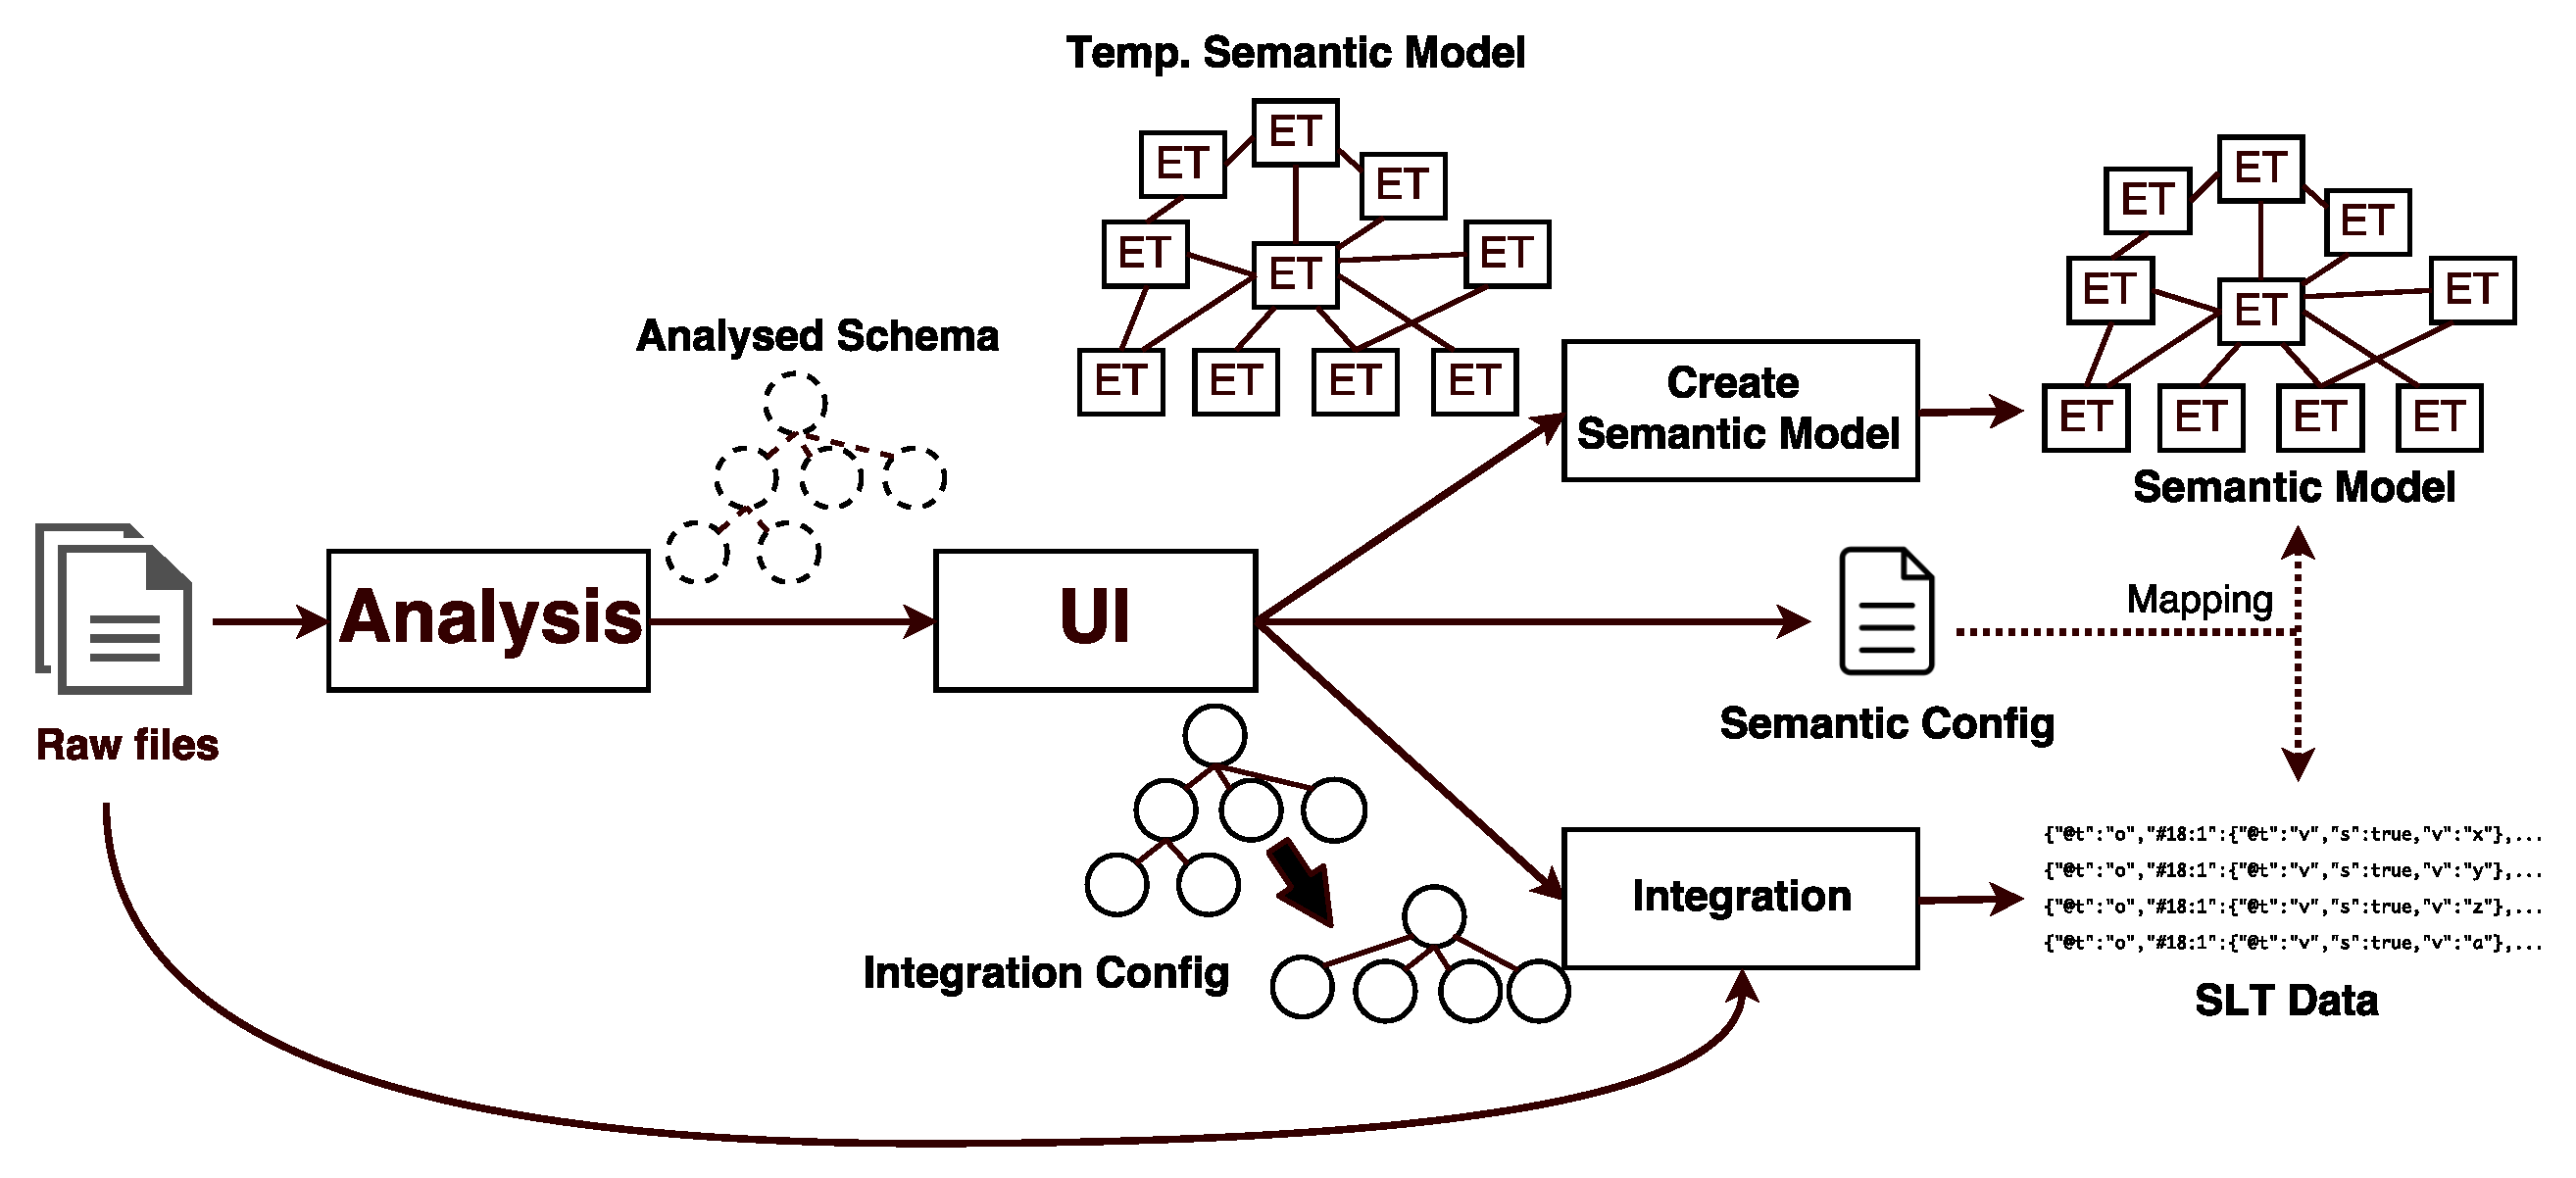
Although the semantic data platform ESKAPE is capable of integrating data sets of different formats (e.g., CSV, XML, JSON), we demonstrate the data integration based on an abstract data set supplied in JSON. Listing 2a shows this example. Integrating data into the data storage is done in a multi-step process (cf.
Figure 10). In the first step, called
Schema Analysis, the original data set is analyzed w.r.t. the data structure and inconsistencies in the model between multiple data points. A data point represents a single point of data (e.g., a single reading or status report) in the data set—for instance, in a table, each row corresponds to a single data point. Based on all available data points, we extract a data schema for that data set and use it as a starting point for the annotation. Should any inconsistencies be detected (e.g., different data types for values of the same data attribute), those are marked in the schema and have to be resolved by the user during the modeling process.
The schema is then handed over to the user interface (UI), which allows the user to adjust the data structure and values to his needs. During the modeling process, the user can perform the following operations:
Splitting primitive values on patterns: If one attribute (e.g., string) encodes multiple information that should be annotated separately, a split into an arbitrary but fixed amount of attributes, based on regular expressions, is possible. All instances of said attribute are split the same way and the semantic model is extended accordingly. For example, data attributes where each data value follows the same pattern (e.g., xxx–yyyy–zz) could be split into three data attributes (e.g., xxx yyyy zz) where each of those attributes can be annotated separately.
Split lists based on patterns: Similar to primitive values, a list, which might occur in some data representations like JSON, can also be split based on a pattern. This is necessary if lists contain multiple elements that are not semantically equal or have a repeating pattern. An example would be [timestamp, latitude, longitude, latitude, longitude, ...]. Using a pattern, this can be split into a list of multiple homogeneous objects containing the desired values like [{latitude, longitude}, {latitude, longitude}, ...] with the timestamp either assigned to each value or be stored as a new data attribute. The goal of this step is to convert the heterogeneous list into a list of homogeneous objects which can be safely annotated.
Removing prefixes and suffixes: If any leading or trailing part of an attribute’s value is occurring repeatedly and can be ignored before storing the value, this can be selected to be dropped during integration to keep the stored data as clean as possible.
Removing and filtering attributes: If an attribute that is contained in the data should be completely ignored, this can be indicated during the modeling phase. No Entity Type will then be assigned to that attribute, thus it will be dropped during the integration as it could not be accessed later on.
Besides these operations, ESKAPE offers well-defined interfaces to add further operations later on. Furthermore, the UI allows the user to do the actual creation of their semantic model for the data set at hand. Starting with a visualization of the detected data schema, it follows a drag and drop pattern to allow users to create their models as simple as possible. We refer to [
3] for additional and more detailed information.
If all modifications and annotations have been done, a temporary semantic model for the data set and an
Integration Config containing the desired data set changes is created (cf.
Figure 10). An additional
Semantic Config is created alongside them and allows for mapping the integrated data to the semantic model and vice versa later on (cf.
Section 5.1.5). The temporary semantic model is handed to a service which creates a new semantic model in the Neo4J database and a data source in the semantic data platform ESKAPE. Afterwards, each data point in the raw data set is processed according to the Integration Config. Additionally, the integration process includes procedures for flattening objects and a baseline syntactic homogenization. The flattening object reduces the complexity of the data hierarchy resulting in the original structure being lost during the process. However, as the data is maintained and viewed by their semantic representation only afterwards, some original data structures are not needed anymore. Due to the syntactic homogenization (e.g., ensuring that a data attribute marked as number can be parsed as a valid number), we can assure that all data attributes that have been annotated during the modeling are actually present in the data. Syntactic homogenization is done using common patterns and heuristics for selected data types (e.g., Boolean Value). If a value cannot be converted or parsed, this information is explicitly stored in the integrated data points, thus rendering this value as potentially unusable later on. However, we do not perform a semantic homogenization as the semantic model should contain all information to treat the data accordingly later on (e.g., the semantic model should contain the unit if the linked Entity Concept is
Temperature and if this temperature holds for all data values of this data set).
Listing 2. Transformation of a raw JavaScript Object Notation (JSON) data point to the Semantic Linked Tree (SLT) format. (a) Raw JSON data of a single data point of a data set to be integrated into the information storage. (b) Structure of an integrated data point in SLT format. The ’d’ value object has been flattened to single values. (c) Semantic configuration example. Maps Entity Type IDs to instances of SLT node entries identified by the URI member (* indicates a set of children). (d) Resulting integrated SLT. Entity Type and data type are not serialized as they are defined by the Semantic Config.
![Technologies 06 00086 i002]()
5.1.5. Mapping SLT to Semantic Models
When storing SLT data in a serialized form, the Entity Type and data type are not serialized alongside the content. Thus, as this information is common across all integrated data points, those values are stored in a separate file, called the Semantic Config. An example config can be seen in Listing 2c. It contains a mapping from the node IDs used in the SLT file to IDs of Entity Concepts in the associated semantic model. The nodes are identified by the URI member. It defines a path along the different IDs and uses as a wildcard to indicate a set. Thus, ‘*#XDS01.3/*/*#XDS01.4’ matches all Elements below the ‘*#XDS01.3’ node (which contains a list) that have a label equal to ‘*#XDS01.4’. The data type is stored alongside the other information. Decoupling the stored data from its semantic meaning allows for quick modifications like extending the semantic model or changing labels or descriptions without having to modify all integrated files.
Each entry in one of the SLT files for a single data source is built the same way, with only the values changing for each data point. The Semantic Config is a general mapping of the SLT schema to semantic entities stored in the semantic model. To parse SLT, the Semantic Config is read, and each data point is deserialized using the information stored in the serialized SLT and the Semantic Config. If a specific data type is defined in the Semantic Config, e.g., Number, the value is parsed to that type during the process. This procedure induces that, if the format of the files changes in an unforeseen way, the integration will fail during the processing of a streamed data source. As this can only occur on streaming data sources, those have to be treated with additional care to not corrupt the models. In case of a change in the data point structure, the integration will therefore cease to operate and notify the user to specify a new data source, including an updated model. Already integrated data will be preserved during this process and is available for future processing.
We realized the data layer using a Hadoop Distributed File System (HDFS), which stores raw data in preparation for batch integration and schema analysis as well as the integrated data sets and the semantic config for each data source. All data can be accessed using Apache Hive or AMQP after a selection of data sources based on semantic elements. For further information about the used technologies, we refer to [
4], although some parts may have changed in the meantime.
5.2. Data Exploration and Extraction
Exploring the available data in ESKAPE is currently possible by searching data sources available to the user for specific content like Entity Types or concepts. This search is more than a mere filtering process on semantic models but a query to the knowledge graph. This allows the platform to not only return candidate data sources containing the specific model searched for but also similar and linked ones. This includes synonyms, hyponyms and other strongly related concepts. Upon entering the search term, the user is presented with a selection of possibly matching data sources which can then be explored by examining the associated semantic model.
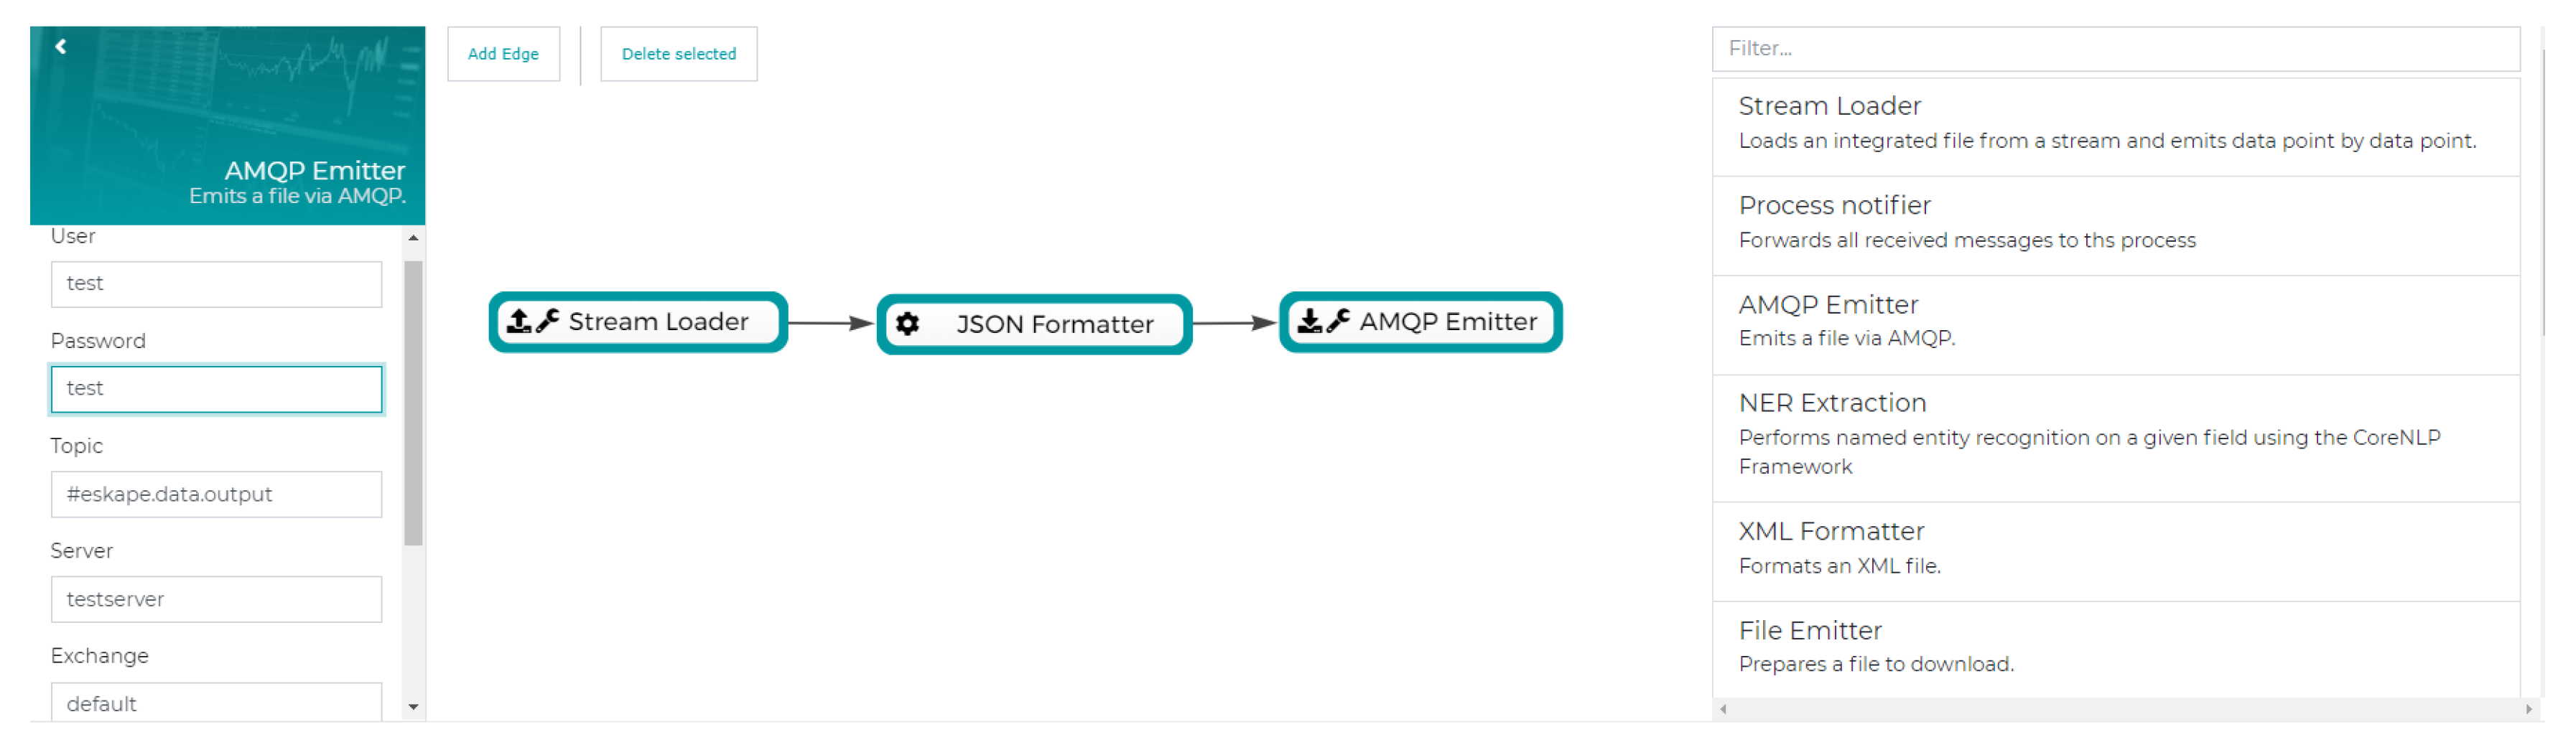
Once a suitable semantic model has been found, the data can be extracted in manifold ways. For any defined data source, the user has the opportunity to either create a stream-based processing pipeline with an emitter step at the end or to create a static view using Apache Hive.
Figure 11 and
Figure 12 (partly) show the configuration masks for both tasks. Processing pipelines can be assembled in a drag and drop fashion with the ability to configure each step. In
Figure 11, this is done using a pipeline consisting of a stream collector which parses a data source into a stream, a JSON converter to form every data point into a JSON object and an AMQP emitter which publishes the data to a given exchange. Extraction via Hive is shown in
Figure 12, providing a preview of a defined Hive view which can be accessed using the users favorite data exploration or processing tool (e.g., Tableau). Next to AMQP and Hive, there are other formats to extract data from ESKAPE like a plain file download containing all data points of a data source, e.g., in line-delimited JSON.
6. Discussion and Limitations of the Time to Analytics Reduction
To reach our goal of reducing the time to analytics, our approach first focuses on solving the challenges of accessibility, flexibility, findability and understandability.
Figure 13a gives an overview of how possible approaches solve these challenges. Starting from a brown-field of data silos, there are two concepts, which are complementary in regard to the metrics we consider. The concepts are either introducing a centralization of the data storage or a data catalog. The former solution is strictly concerned with solving the problems around accessibility, whereas the latter proposes concepts that deal with understandability and findability regardless of the accessibility of the system.
Since data access is a crucial factor in an ecosystem where users offer data that are analyzed by others, our approach aims to reduce the time that is required for making data accessible from existing legacy systems, such as shop floor machines, existing databases or other available data sources. Hence, our approach focuses on centralizing the data storage to mitigate that every available system feeds data into a dedicated database resulting in data silos that are distributed across the entire enterprise. However, at the moment, this means that all affected systems must be connected manually to the data lake. Therefore, one has to develop an application for each system that transfers the data into the data lake. Based on the experience that we made in our real world scenario, we identified that typical databases in such scenarios have around 400 tables with 10 to 100 columns each. Usually, it results in a large effort to connect such system table-wise to the data lake. Using the agent we presented in
Section 4.1, it takes around ten minutes to connect a new system to either a raw data lake or to other systems, such as ESKAPE. This time mainly depends on the size of the data source system, e.g., topic/node tree or amount of tables, and thus the automatic scanning process as the preparing step of an agents default configuration explained in
Section 4.2. Hence, the automatic configuration creation tool, is the first step towards reducing the time to analytics.
Since the scenario described in
Section 3 is very flexible, i.e., new systems, especially sensors, may be added at any time, it is not recommended to rely on a fixed data warehouse approach. Hence, our approach focuses on building a data lake. This mitigates the creation of an enterprise-wide data schema, which would be associated with a high effort for constructing and maintaining. However, raw data lake systems still have the problem of finding and understanding the desired data sources. Hence, our approach focuses on building a data lake that additionally stores the required meta data in a data catalog (cf.
Figure 13a). Therefore, we proposed ESKAPE. As soon as the data points are collected from the systems, the data stewards can add them to ESKAPE, which is a manual process so far. This is not an automatic process because ESKAPE provides the ability to perform additional data transformation steps before the data points are integrated. This allows, for example, to infer additional information from the collected data, such as inferring a language from a data attribute that contains text.
After ESKAPE has performed the schema analysis (cf.
Section 5), the data steward has to semantically annotate the data.
Figure 13b gives an overview about possible approaches. We decided to annotate data with semantic models instead of a simple tagging approach. Semantic models offer a much more detailed definition of the meaning and relationship of data attributes than conventional tagging systems. This leads to a higher expressiveness. However, this trade-off results in a higher effort for the data steward. Depending on the number of present data attributes and the desired level of detail that the semantic model should have, this step takes the most time. To reduce the required time to a minimum, ESKAPE supports the user with suggestions for possible semantic concepts, data types, etc., which already reduces the time that is required for creating semantic models. Nevertheless, it may still take up to 15 min for creating a sophisticated semantic model, which is much longer than simply tagging a data source with a few tags.
We are aware that this is a limitation of our approach as it takes additional time. However, creating semantic models is a one-time task for each data source and the time saved later therefore outweighs the initial required effort as each data scientist who has to find and understand this data source will save time. This is also an essential difference to existing meta-data management solutions (cf.
Section 7), which focus on either simple tagging approaches or on automatic collection of meta-data derived, e.g., from the database schema. To mitigate the initial creation of a static vocabulary, which has the same drawbacks regarding time consumption as setting up a data schema for a data warehouse, our approach is based on a dynamic vocabulary that evolves over time. However, using dynamic vocabularies can either be updated on-demand or periodically, such as every month (cf.
Figure 13b). The latter has the advantage that it reaches the same consistency as static vocabularies. However, it restricts the data steward to describe information that is missing from the current vocabulary. This leads to a delay for publishing the data source. Thus, ESKAPE focuses on an on-demand vocabulary expansion (the knowledge graph) based on the semantic models that are added by the data stewards. This means that no delay will occur for publishing a data set. Nevertheless, this on-demand expansion has the disadvantage that it may lead to inconsistencies or undefined relationships. Therefore, our research in ESKAPE also focuses on automatically detecting and aligning of vocabularies, e.g., by detecting synonyms based on the framework provided by Paulus et al. [
21], whereas current tagging systems or the automatic collection of meta-data do not deal with the alignment of the used terms/labels of the vocabulary. This reduces the effort for manual alignment of vocabularies.
Besides the time that we save in the data provision process, our developed approach also enables the data scientist to search, retrieve and extract their desired data more efficiently. Due to the maintained knowledge graph and the automatic identification of synonyms, our approach offers a very efficient search across all data sources that were registered in ESKAPE. In addition, the knowledge graph allows for drawing conclusions among the relationships between different data sets. Identifying these relationships is not possible with solutions that solely rely on tagging systems that do not maintain any vocabulary alignment. After finding the data, ESKAPE offers data scientists the functionality to access the data via SQL or to extract the data in a desired format (cf.
Section 5.2). These two steps reduce the necessity to perform certain data pre-processing steps and thus simplify the work of a data scientist. In addition, they enable the data scientist to get related data sets in the same data format and with the same data attribute names, which is not possible when working with data silos or raw data lakes. In the future, we plan to introduce additional semantic processing steps that will cover additional transformation tasks, such as converting temperatures or extract additional information. This will be possible since the semantic models in combination with our semantic data integration provide all the necessary information to automatically perform such steps. This will additionally decrease the time to analytics, as it further simplifies the data pre-processing.
Altogether, our approach targets the time to analytics reduction by centralizing the data storage, simplifying the data collection of existing systems, providing different methods for defining exhaustive semantic annotations for data sources without relying on a static vocabulary. All these actions lead to a time to analytics reduction as they solve the problems of accessing, understanding and finding data sources without limiting the flexibility, expandability or usability (cf.
Figure 13). While this approach introduces some complexity in the initial integration of new data sources, it is most beneficial for the continuous implementation of analytic use cases.
7. Related Work
Due to our goal of collecting data from the shop floor and other connected systems and making these data available to data scientists, many different research topics are related to our work. These are data ingestion, meta-data management and semantic modeling as well as semantic data integration.
In the area of data ingestion, various reference architectures for classical data integration approaches exist. The importance here is the difference between integration and ingestion, where, in integration data, transformation occurs into a consolidated target schemata, and the ingestion deals with the homogenization of the access layer by consolidating the data. For the classical data integration into Data-warehouse systems, the Extract-Transform-Load (ETL) process is well defined in terms of information management systems [
22,
23,
24].
Pääkkönen et al. [
25] introduce a generic data integration reference architecture, which is mapped against the different infrastructure elements of tech-giants proven environments (Facebook, Twitter, Netflix, etc.). The architecture consists of the base elements ‘Data Source’, ‘Data extraction’, ‘Data loading and preprocessing’, ‘Data processing’, ‘Data Analysis’, ‘Data loading and transformation’, ‘Interfacing and visualization’, and ‘Data storage’. It thus represents the basic and connecting building blocks for a generic data integration infrastructure and emphasizes its necessity. However, this approach is not tailored nor specific to Industrial context and therefore not directly applicable to shop floor systems. Since the concepts are derived from green-field approaches, they do not consider factors like production criticality or support for legacy devices on the brown-field. Specifically, the production criticality is a factor that must be considered. An analytic use case is only useful if the production is able to benefit from it. A production stop caused by uncontrolled access to systems and devices is certainly not beneficial.
Specifically tailored to the problems of the shop floor, data integration is the approach proposed by Bonci et al. [
26] for database-centric cyber-physical production systems (CPPS). Their idea is to use lightweight database synchronization with a distributed replication on every CPS device. They introduce a swarmlet concept that facilitates the publish and subscribe paradigm for Internet of Things devices, which thereby extends the central database to a service-oriented architecture similar to an Enterprise Service Bus. However, the requirement is that each system has enough (computational) power to perform such operations in this regard and to get a full picture of the production process that the interconnection over different network zones is possible.
More tailored towards the shop floor are the reference architecture models RAMI4 and the Industrial Data Space. The RAMI4.0 model proposed by the German VDI [
27] is a three-dimensional model based on the layer structure of the Smart Grid Architecture Model [
28]. The base model is extended by a life cycle and value stream dimension with an additional hierarchy level. The architecture focuses on the data acquisition step of Industrial Big Data and only partially addresses subsequent steps like data storage, access and analysis. Their suggestion is a so called ‘Administration Shell’, which handles the devices meta-data management (head) and data transfer (body). Thereby, they turn single devices into I4.0 objects that should enable easier data access.
The ‘Industrial Data Space’ developed by the Fraunhofer society [
29] introduces a five-layer structure and defines roles within a data ecosystem. They describe each role based on the required functionality and depending on the layer inside the model. Base roles are the data provider and data user, which refer in our terms to the data steward and analyst. Moreover, they also define the terms of broker, appstore operator and certification authority. The reference architecture is an approach to establishing key features along roles and assigning responsibilities in the data space on a higher level without providing an actual solution to the specific problem of data analytics in an industrial setting.
To achieve the goals of finding data sources, understanding them in their entirety and accessing them, we can differentiate between approaches that build up data catalogs, which just contain the meta-data of all added data sources, and approaches where an actual centralized data integration takes place, which means that the raw data are stored in a new data format. In both cases, we can further differentiate between approaches that rely on the principles originating from the Semantic Web and approaches from the research area of database and information systems. For instance, in the case of the Semantic Web, one could build a semantic data integration system by annotating data with semantic models built based on a fixed vocabulary (e.g., an ontology) and storing the integrated data in the standardized RDF format.
The community around databases and information systems focuses on providing sophisticated meta-data management systems. Here, the construction of data catalogs is a wide-spread approach for managing data sets that are available in different systems, such as databases, file systems or data lakes. For instance, Quix et al. proposed in [
30] the system GEMMS, which is a generic and extensible meta-data management system that was developed for managing data lakes. Instead of integrating the data into a common format, their system focuses solely on managing the data in an own meta model where annotations can also be enriched with additional semantic concepts extracted from, e.g., an ontology. This enables users to find exactly the data they are looking for. Compared to our approach, Quix et al. [
30] focus solely on finding the data, whereas our approach also deals with the additional semantic data integration where each data attribute is directly linked to the corresponding semantic concept. In addition, we perform a syntactic homogenization that enables us to directly identify data points that do not correspond to the defined data type.
A similar approach is followed by Hai et al. [
2] in another work, named Constance. In this paper, the authors presented an intelligent data lake solution that discovers and extracts meta-data from data sources. In addition, the system annotates the data with additional semantic information. Compared to our approach, the authors do not perform a semantic data integration. Instead, they focus their work on rewriting queries whereas our approach transforms the data into the unified SLT format and stores them in the underlying data lake.
Besides approaches originating from the research community, commercial solutions, such as Microsoft Data Catalog [
31] or Informatica Enterprise Data Catalog [
32], exist. The Microsoft Data Catalog, which is a commercial solution, allows users to collaboratively add tags to data sources as well as to data attributes. Users can simply choose from existing tags or define new ones in the process. To support the data steward during the annotation process, the user interface offers an auto-completion functionality. However, the tool does not care about the alignment of tags (e.g., by suggesting already existing synonyms) like we do in our work. By contrast, the Informatica Data Catalog enables the tagging of data attributes with so-called Data Domains. These Data Domains represent a semantic meaning and can be assigned to data attributes. Several of those can also be aggregated to more complex Data Domains, resulting in a basic semantic model (e.g., a person has a first name, last name and an e-mail address). Similar to the Microsoft Data Catalog, the Data Domains can be created by users. However, it is possible to manually define synonyms. The user interface allows for manually assigning a Data Domain to a data attribute supported with an auto-complete function as well as acknowledging automatically identified ones.
Instead of just constructing data catalogs, other solutions also focus on integrating the data, which has the advantage that the data is available more quickly when requested by a data scientist. Informatica offers additional data integration for their Data Catalog by extending this product with further products, such as the Informatica Enterprise Data Lake [
33]. Here, the data are moved from the original data source (e.g., a database) into the data lake.
Following the approach of the Semantic Web, using semantic annotations or models to describe data sources is a widespread approach for managing meta-data and understanding the meaning of data. Here, the annotations are created based on fixed vocabularies, such as taxonomies or ontologies. Knoblock et al. propose in multiple papers [
34,
35] a platform, called KARMA, that enables the semi-automatic mapping of structured data sources into the Semantic Web. Their approach integrates heterogeneous data sources, such as CSV or Excel Files, into RDF triples which build the mapping between a raw data point (RDF object) and the corresponding semantic type (RDF subject). The semantic model is generated based on an underlying Web Ontology Language (OWL) ontology. Besides KARMA, other solutions rely on RDF and pre-defined ontologies for integrating mapped data. Prominent examples are smart data platforms, such as the Anzo Semantic Data Lake [
36] or OpenLink’s Virtuoso [
37].
There are also several commercial platforms that follow the idea of adding semantics/meta data to raw data sources and, optionally, can perform an additional data integration. Examples are the knowledge platform provided by MAANA [
38], the MANTRA Smart Data Platform [
39], or kSpheres provided by Kinor Technologies [
40]. Unfortunately, those platforms do not state how they achieve the task of a semantic data integration, i.e., they do not provide any information about the used vocabulary or if they designed their own data format or rely on, e.g., RDF.
8. Conclusions
In this paper, we focused on dealing with the challenges of collecting, finding, understanding and accessing data sources in large enterprise production settings to achieve the objectives of guaranteeing the availability of real-time information at any time and place as stated by the Internet of Production. Therefore, we aimed at reducing the time that passes from collecting data to analyzing data. As a solution, we based our approach on the concepts of centralizing the data storage in a modern data lake architecture. We first presented concepts for data ingestion, data integration and data processing consisting of a flexible and configurable data ingestion pipeline. The first step in the pipeline was covered by an ingestion agent, which collects data from machines on the shop floor or other related systems (e.g., databases) and feeds the data into ESKAPE. By just configuring and deploying this agent, we are capable of gathering data from a variety of systems. Instead of just ingesting the data into a raw data lake, we additionally presented a semantic data platform, called ESKAPE, which enables data source stewards to semantically annotate and integrate the ingested data. For that, ESKAPE features a three-layered architecture consisting of a raw data storage, semantic annotations for stored data sets and an implementation of a knowledge graph which serves as an index. Compared to traditional meta data management solutions, ESKAPE’s knowledge graph evolves over time based on the semantic models and data sources that are added. Based on the created semantic models, data scientists are able to find, understand, and extract the data from the different data sources. To show the benefits of our approach, we discussed it with regard to a real-world use case in which we deployed our data ingestion agents and ESKAPE. Here, we showed that our approach is capable of reducing the overall time to analytics by saving time during the connection of new data sources, the data collection, as well as for accessing, finding and understanding the data sources. However, we are also aware that our approach introduces an additional step for creating the semantic models which may be time-consuming. Nevertheless, we argue that this step is only a one-time task and the support offered by ESKAPE, e.g., by recommending semantic concepts, already focuses on reducing this additional required effort to a minimum. Thus, the time saved in the other steps outweighs the time that is required for creating sophisticated semantic models.
Future Work
From the ingestion perspective, we will focus on extending the connector pool providing the possibility to access even more system. Similarly, we would like to extend the configurable access patterns. In the context of ESKAPE, we will focus on improving the creation and maintenance of the knowledge graph. With a rising number of participants in ESKAPE, the number of modeling approaches increases, thus rendering the resolution of conflicts and inconsistencies more difficult. Instead of strengthening the graph by only including external knowledge bases that model world or domain knowledge, we also want to learn from the data that are annotated with semantic concepts. This will enable us to learn the representation of semantic concepts. In addition, we want to extend ESKAPE to include the import and export of semantic data from and to common formats like RDF to ensure compatibility and transfer of knowledge across system borders. Moreover, we would like to make more use of the semantic models. Although practically usable, ESKAPE’s extraction methods do not unlock the full potential of the semantic information available. For future developments, we are planning on developing a more flexible query processing engine to yield even better results by unlocking all features of the knowledge graph and reducing the amount of manual work needed to extract the required data. For example, we aim to implement a processing of data sources (e.g., combine, filter) using semantic models instead of data attributes. This semantic processing, which will be based on a user’s query input, will enable data scientists to perform additional data analysis steps directly on the ESKAPE platform and thereby save additional time. This would allow the user to use more natural language constructs when formulating a query, which will eventually return the desired data set(s) directly instead of only presenting suitable data sources.


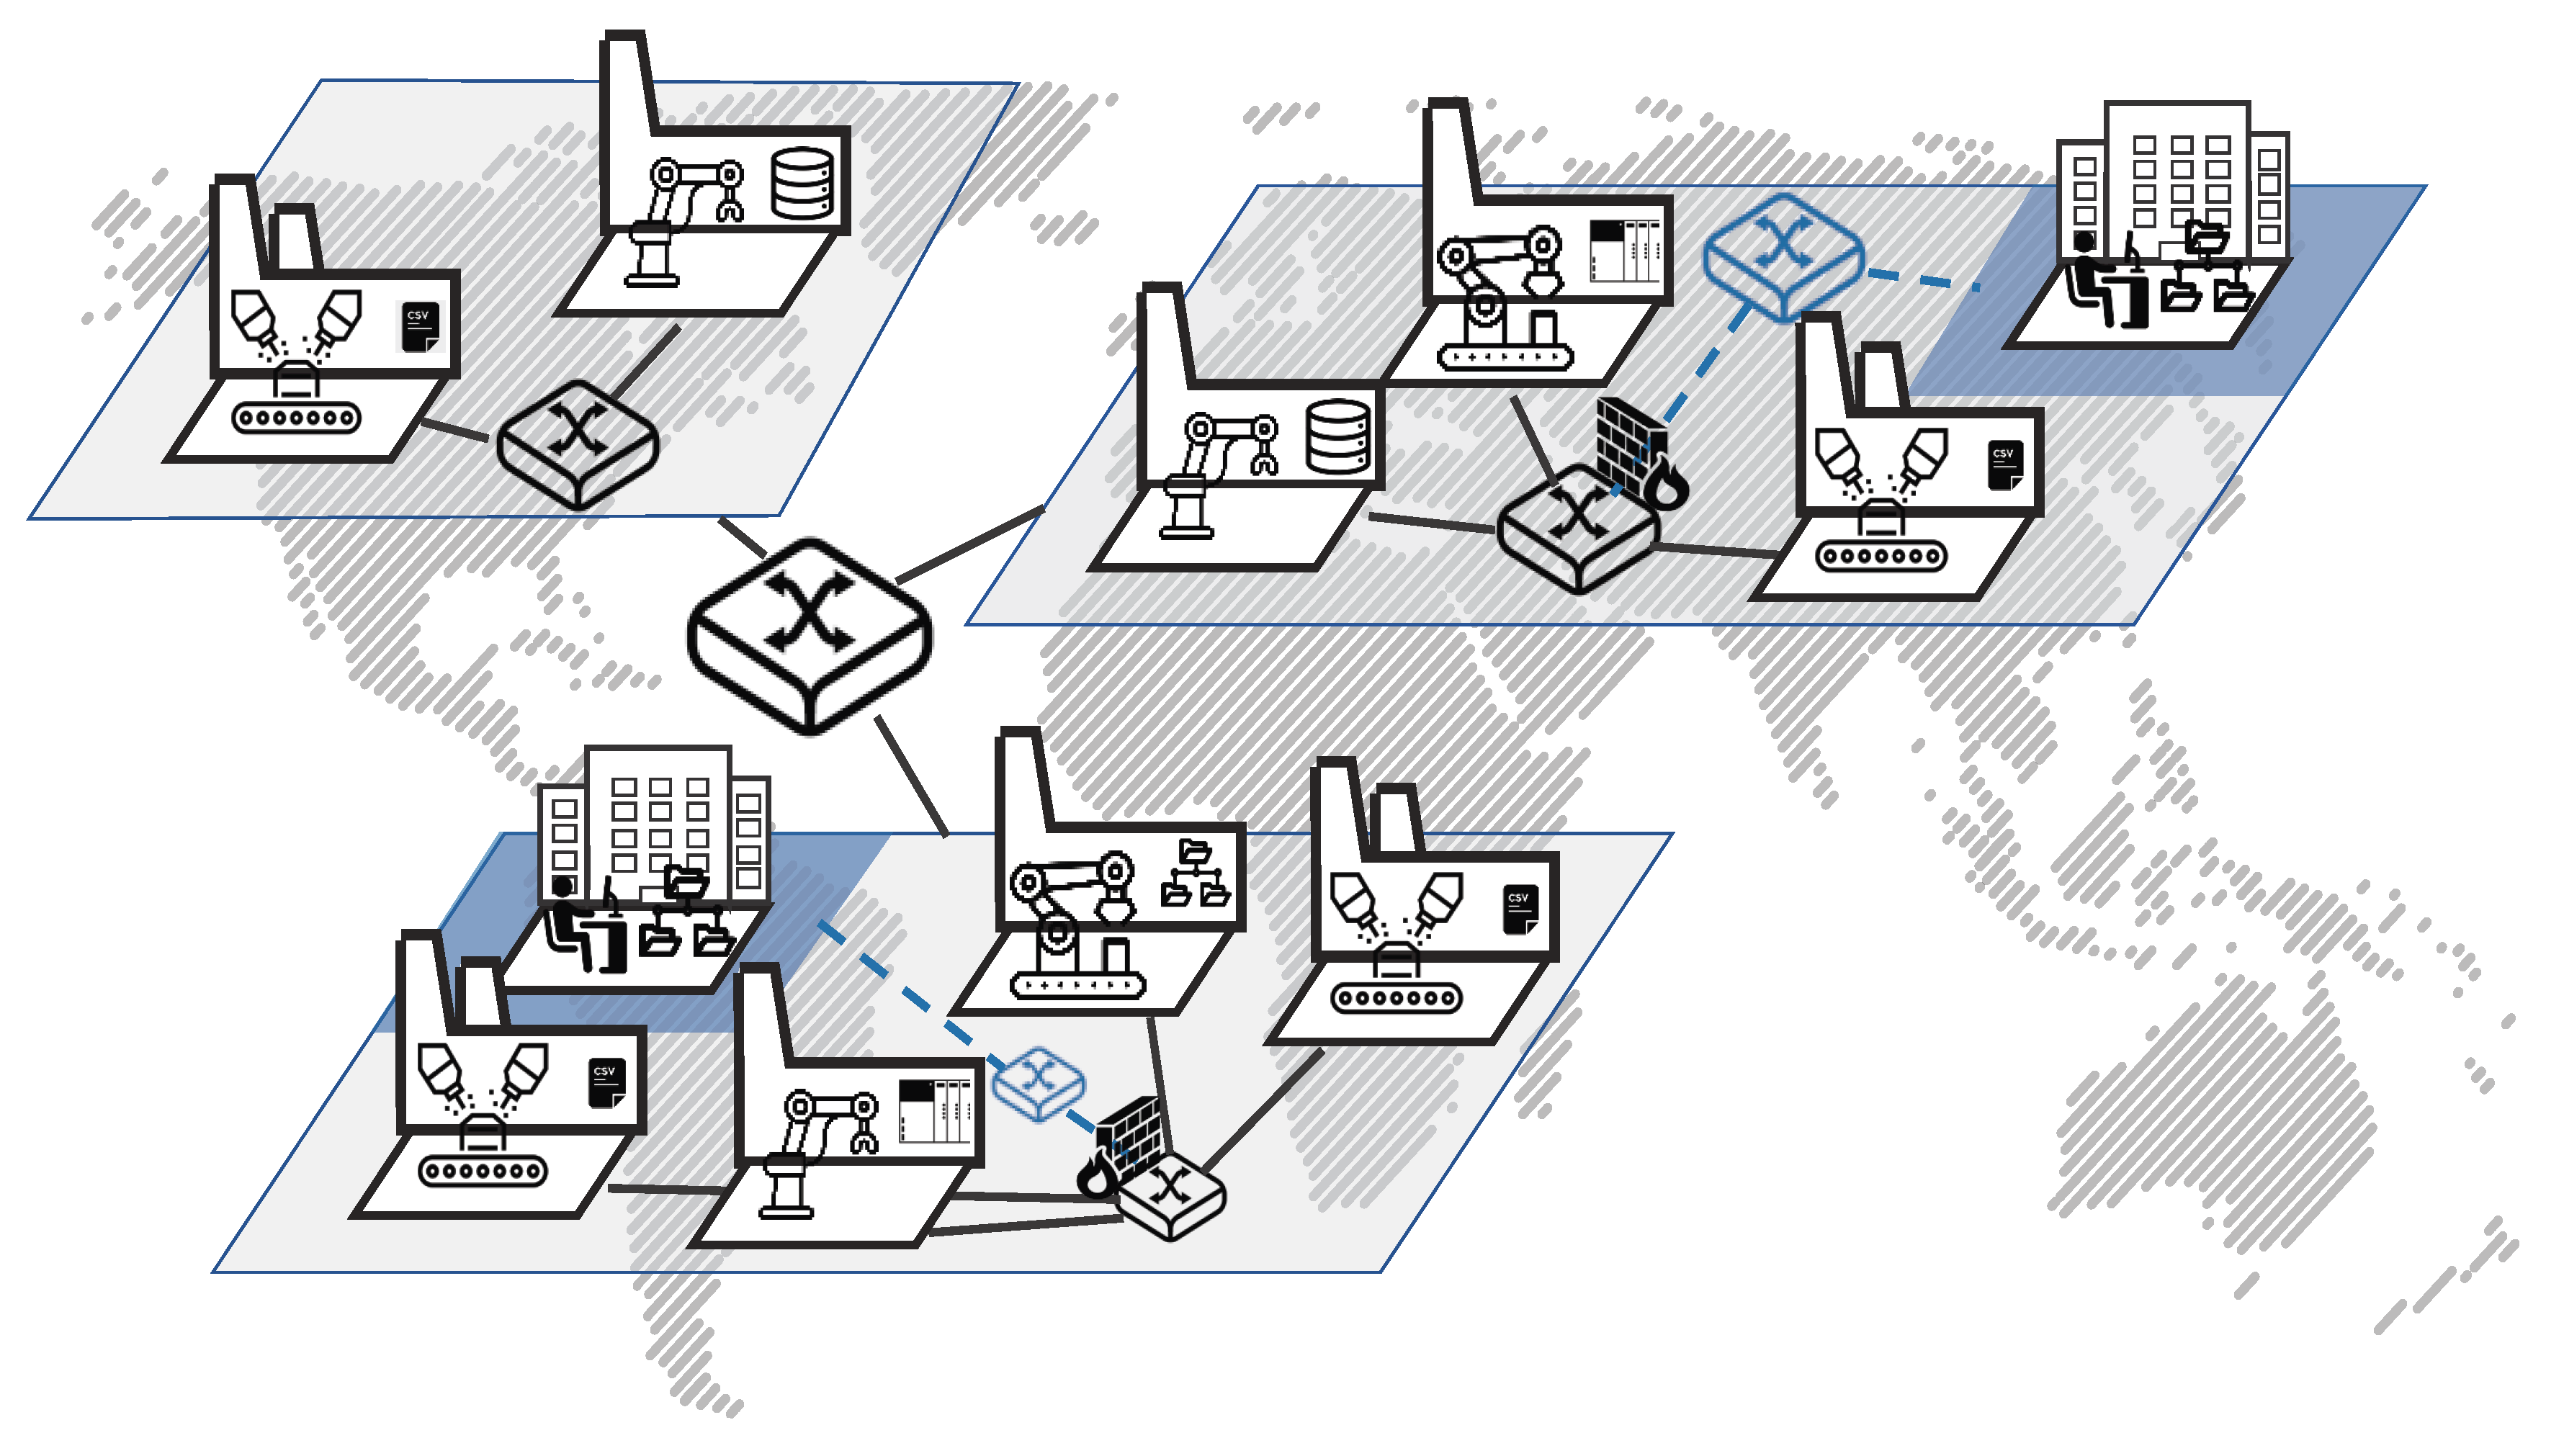
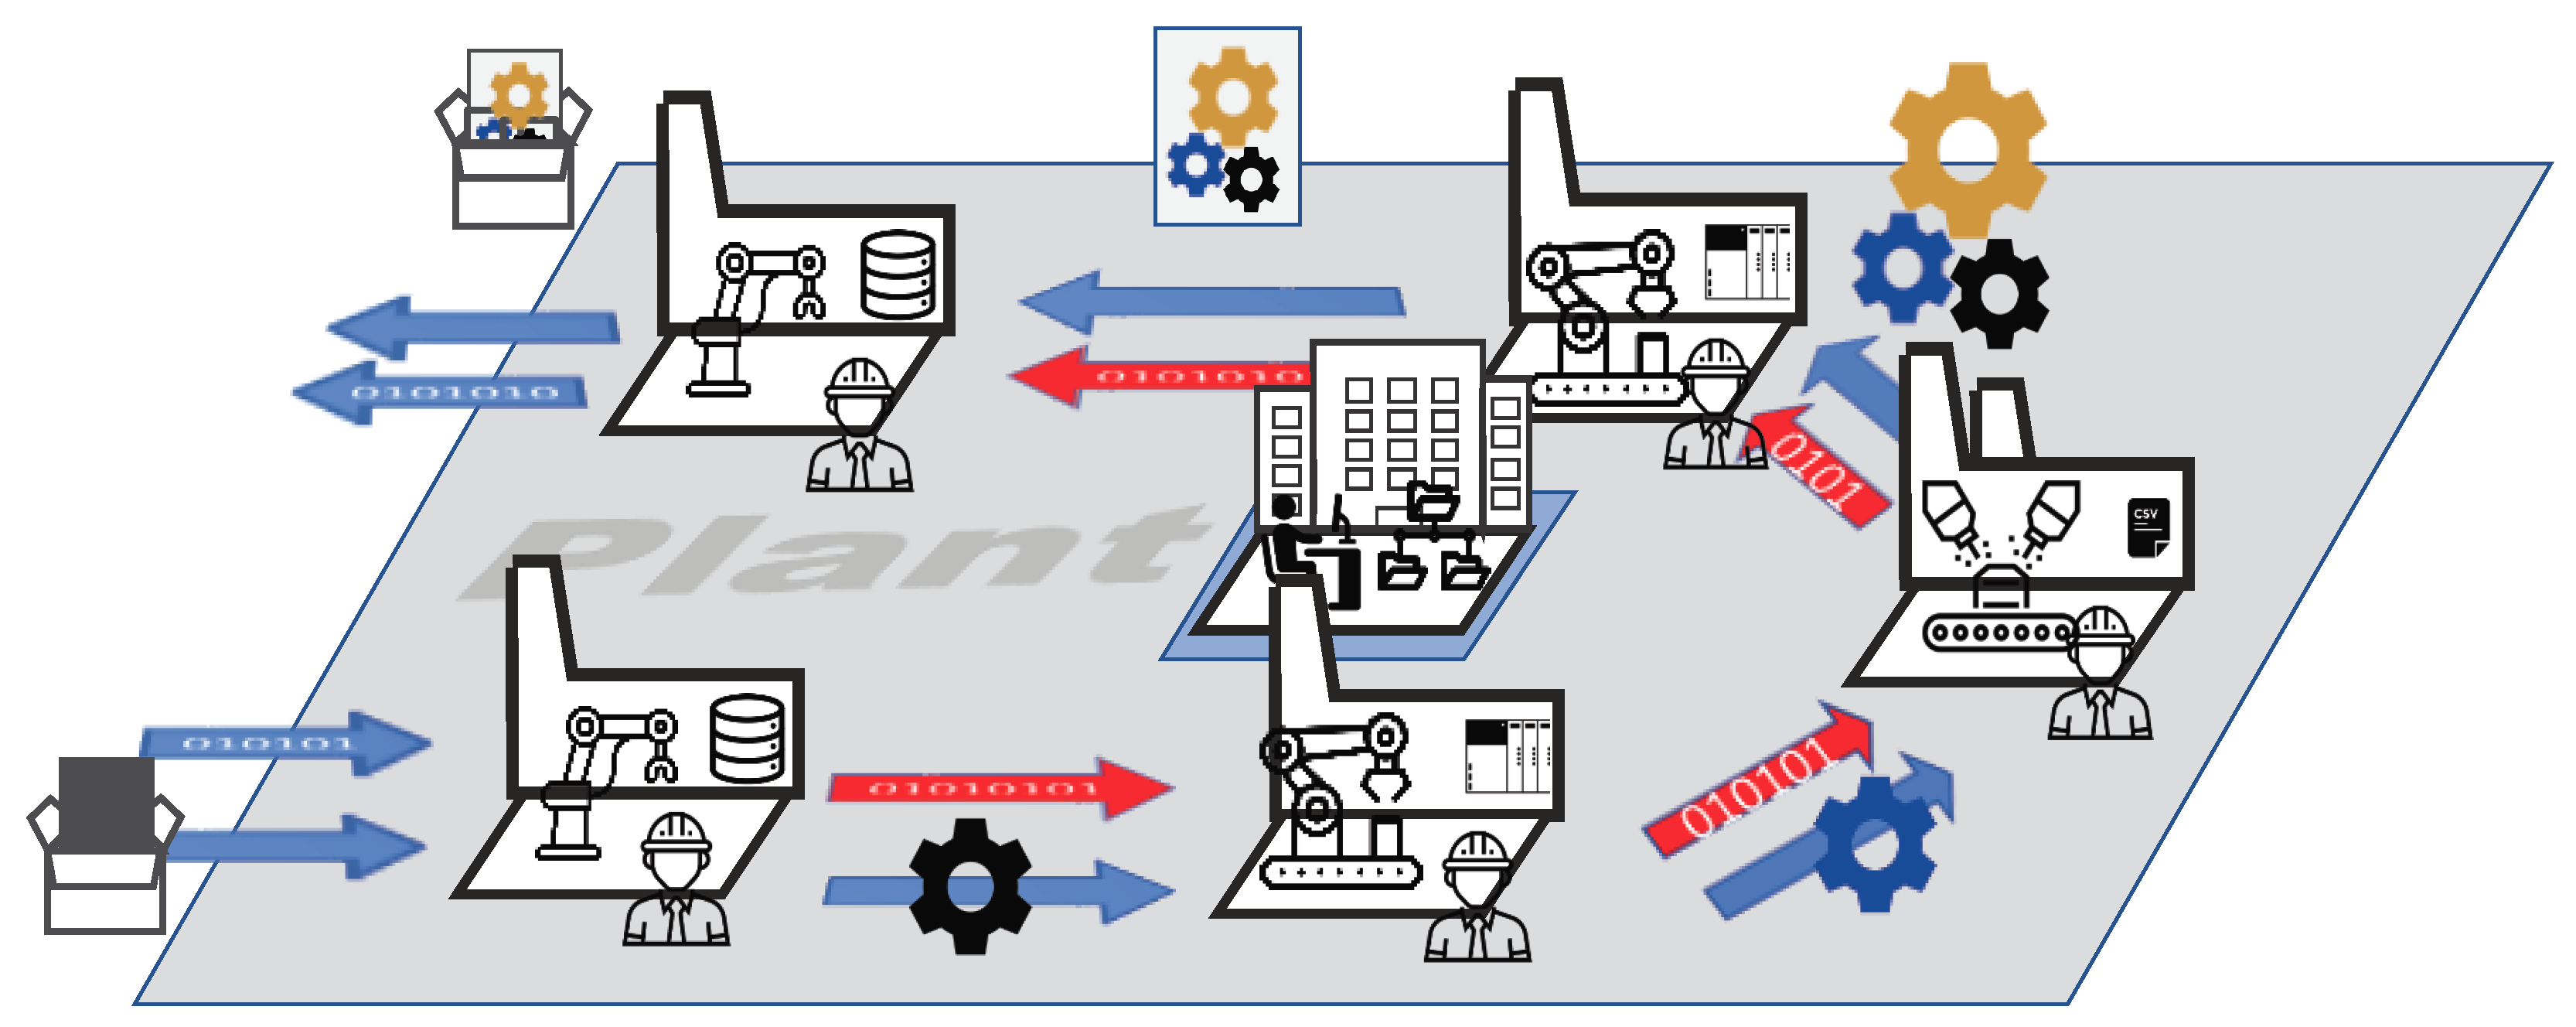
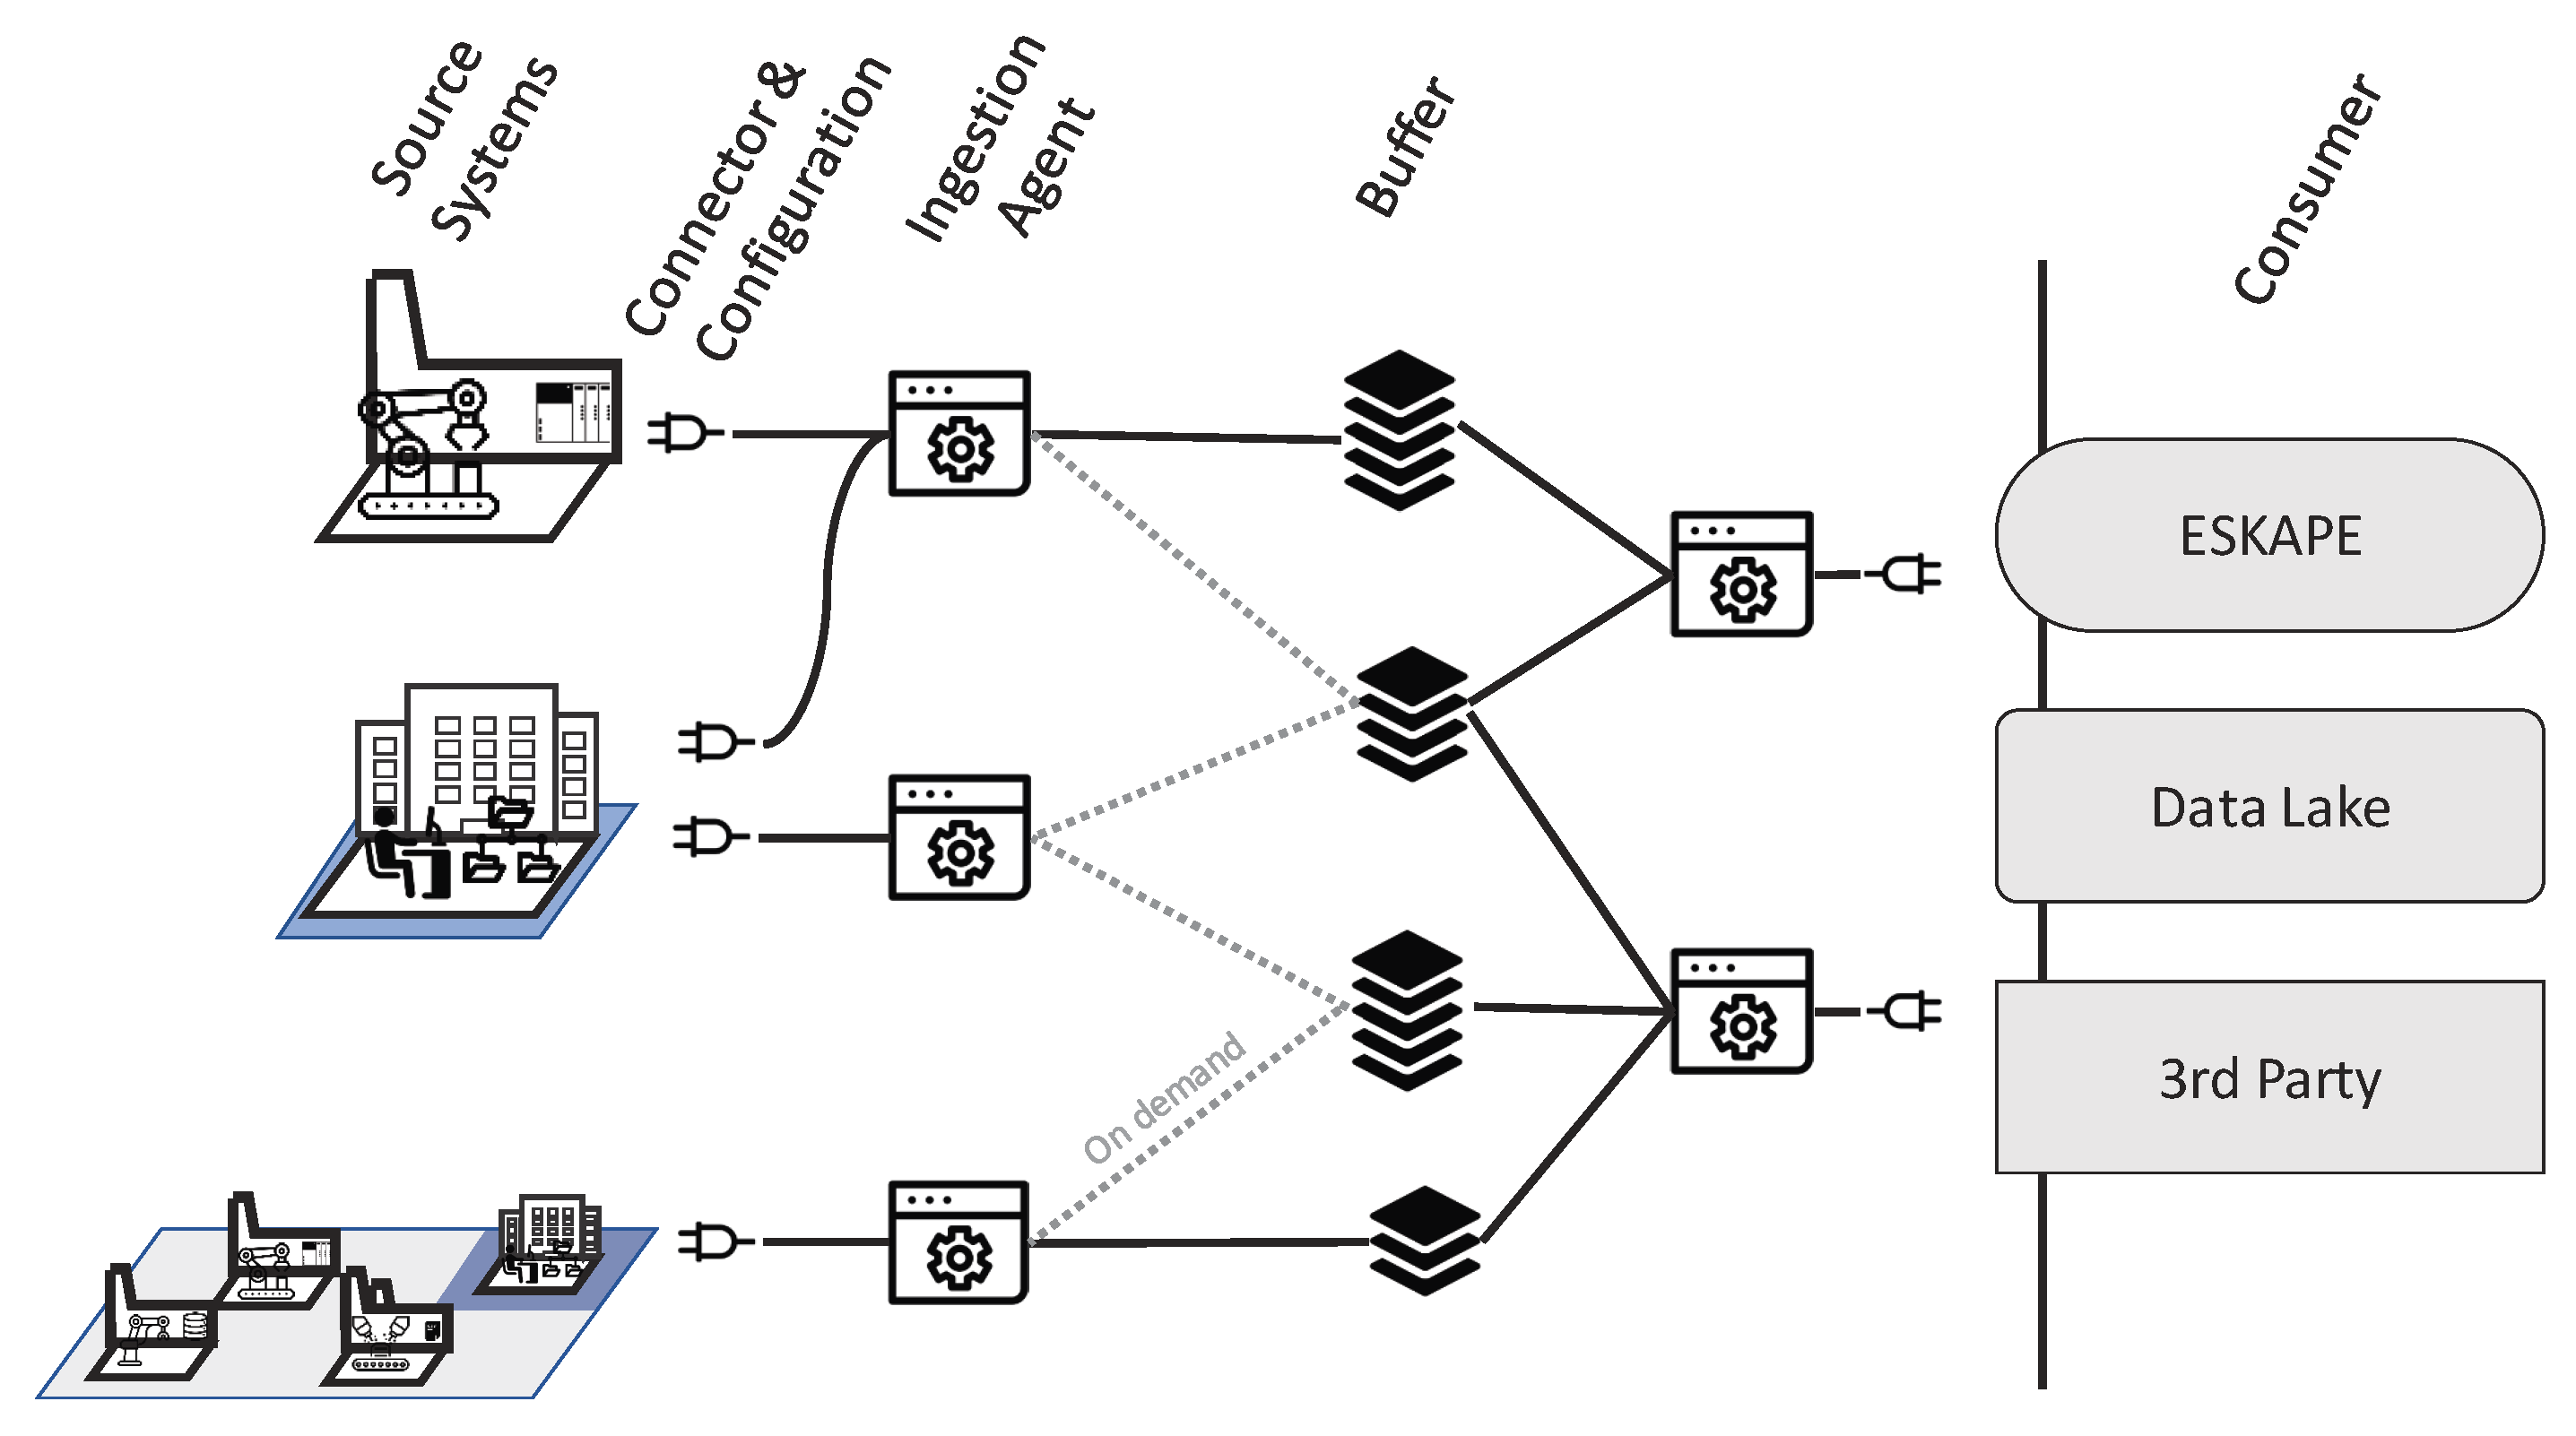
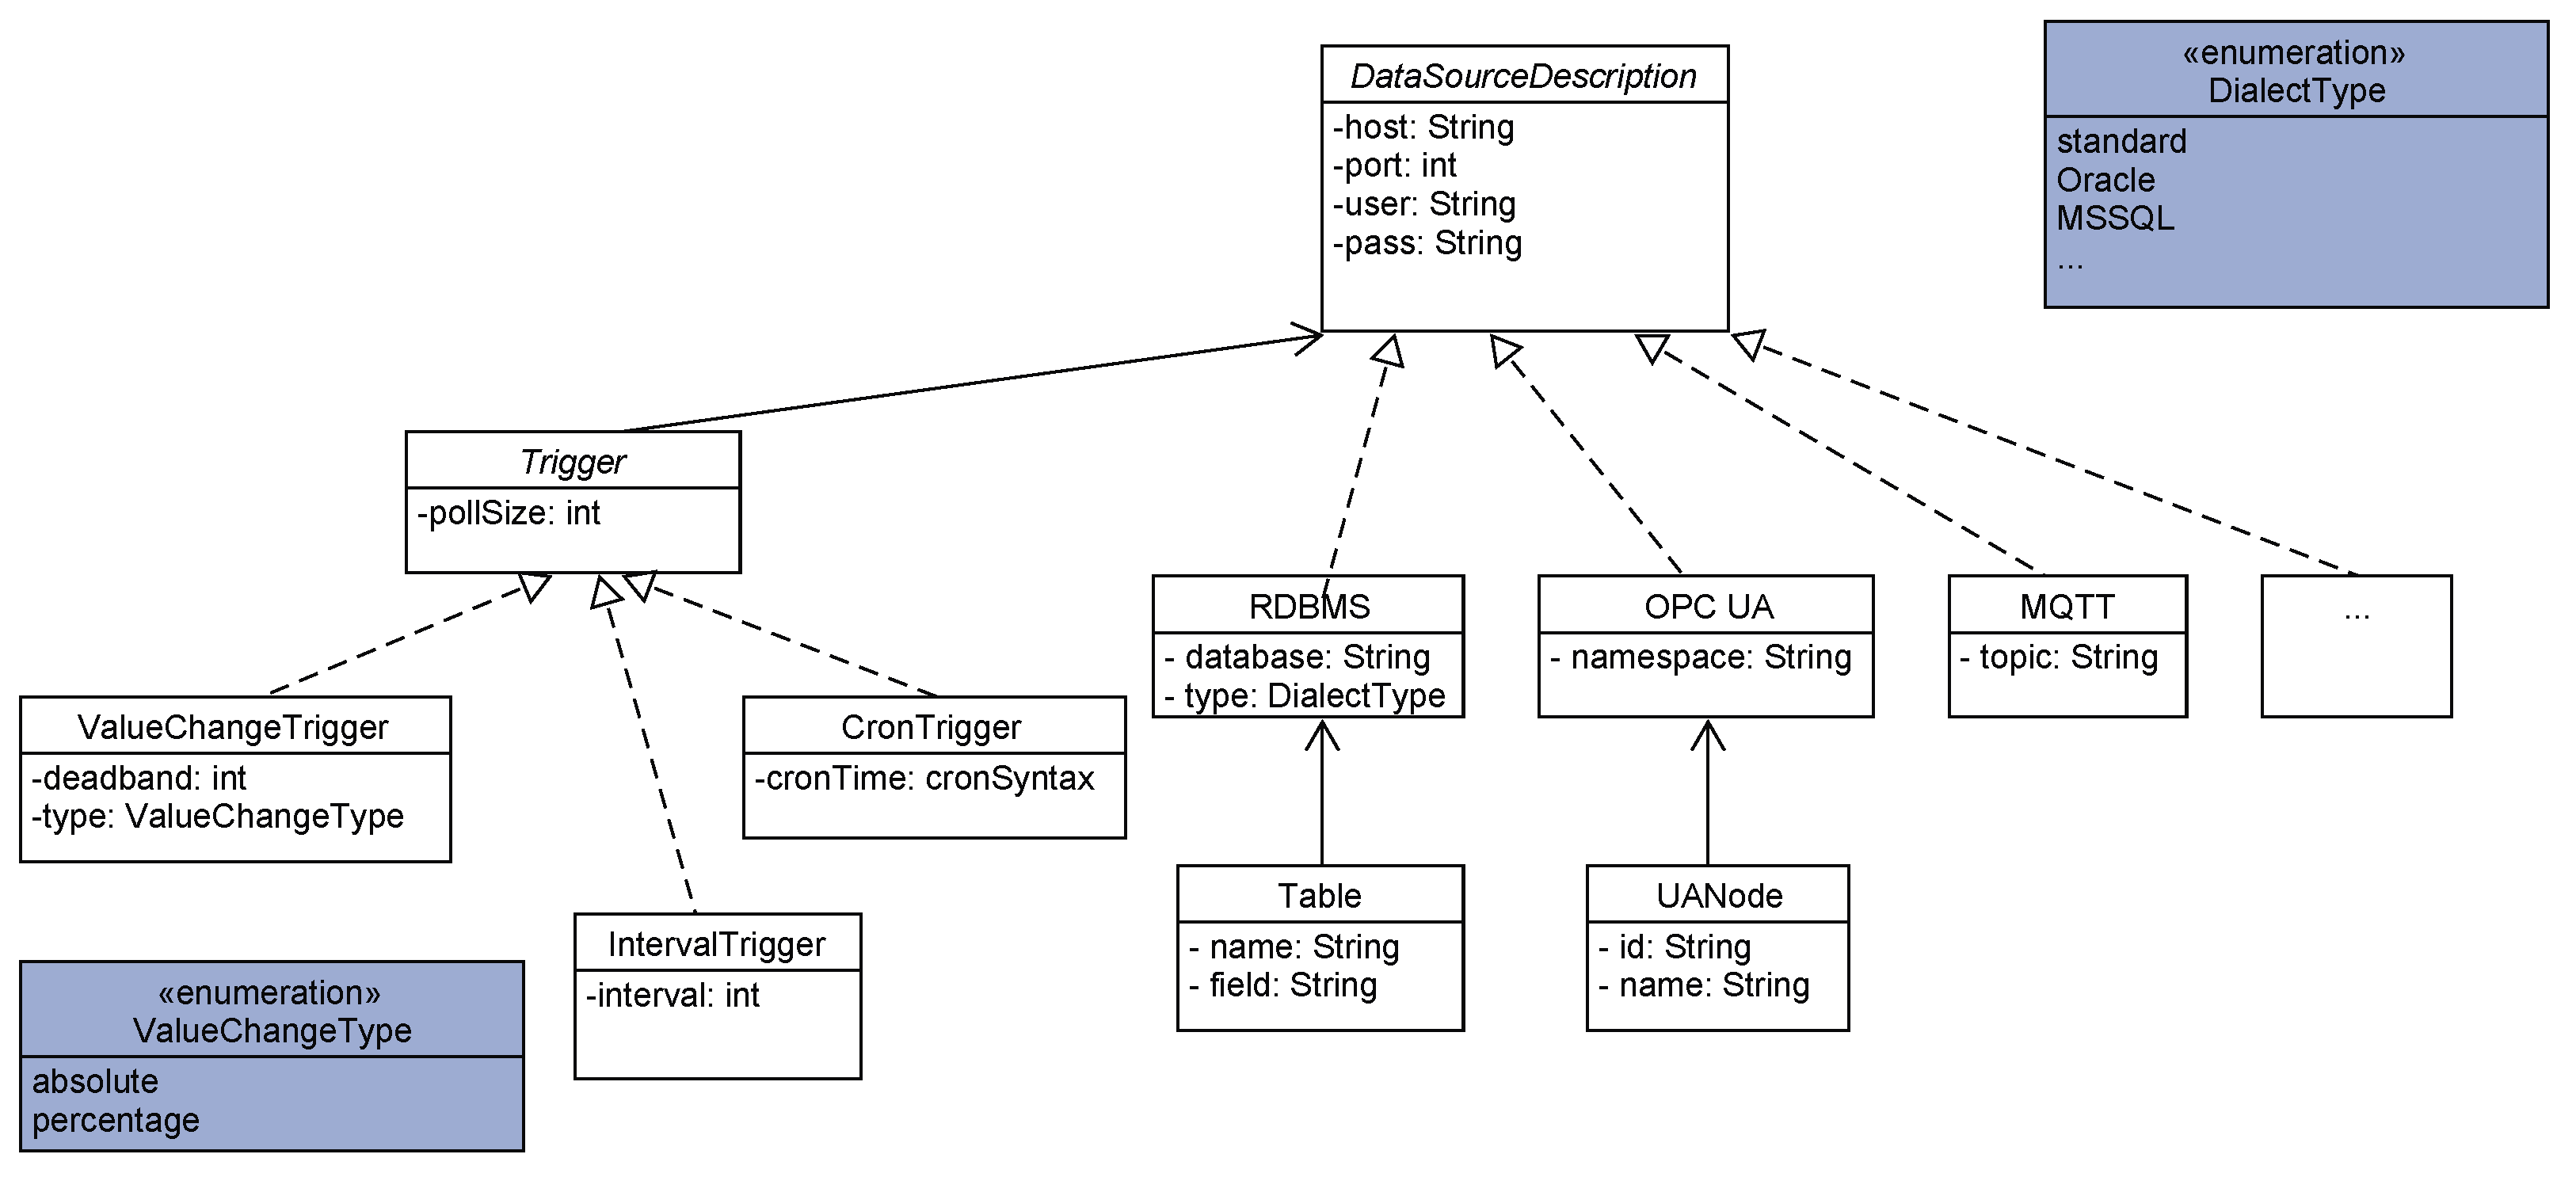
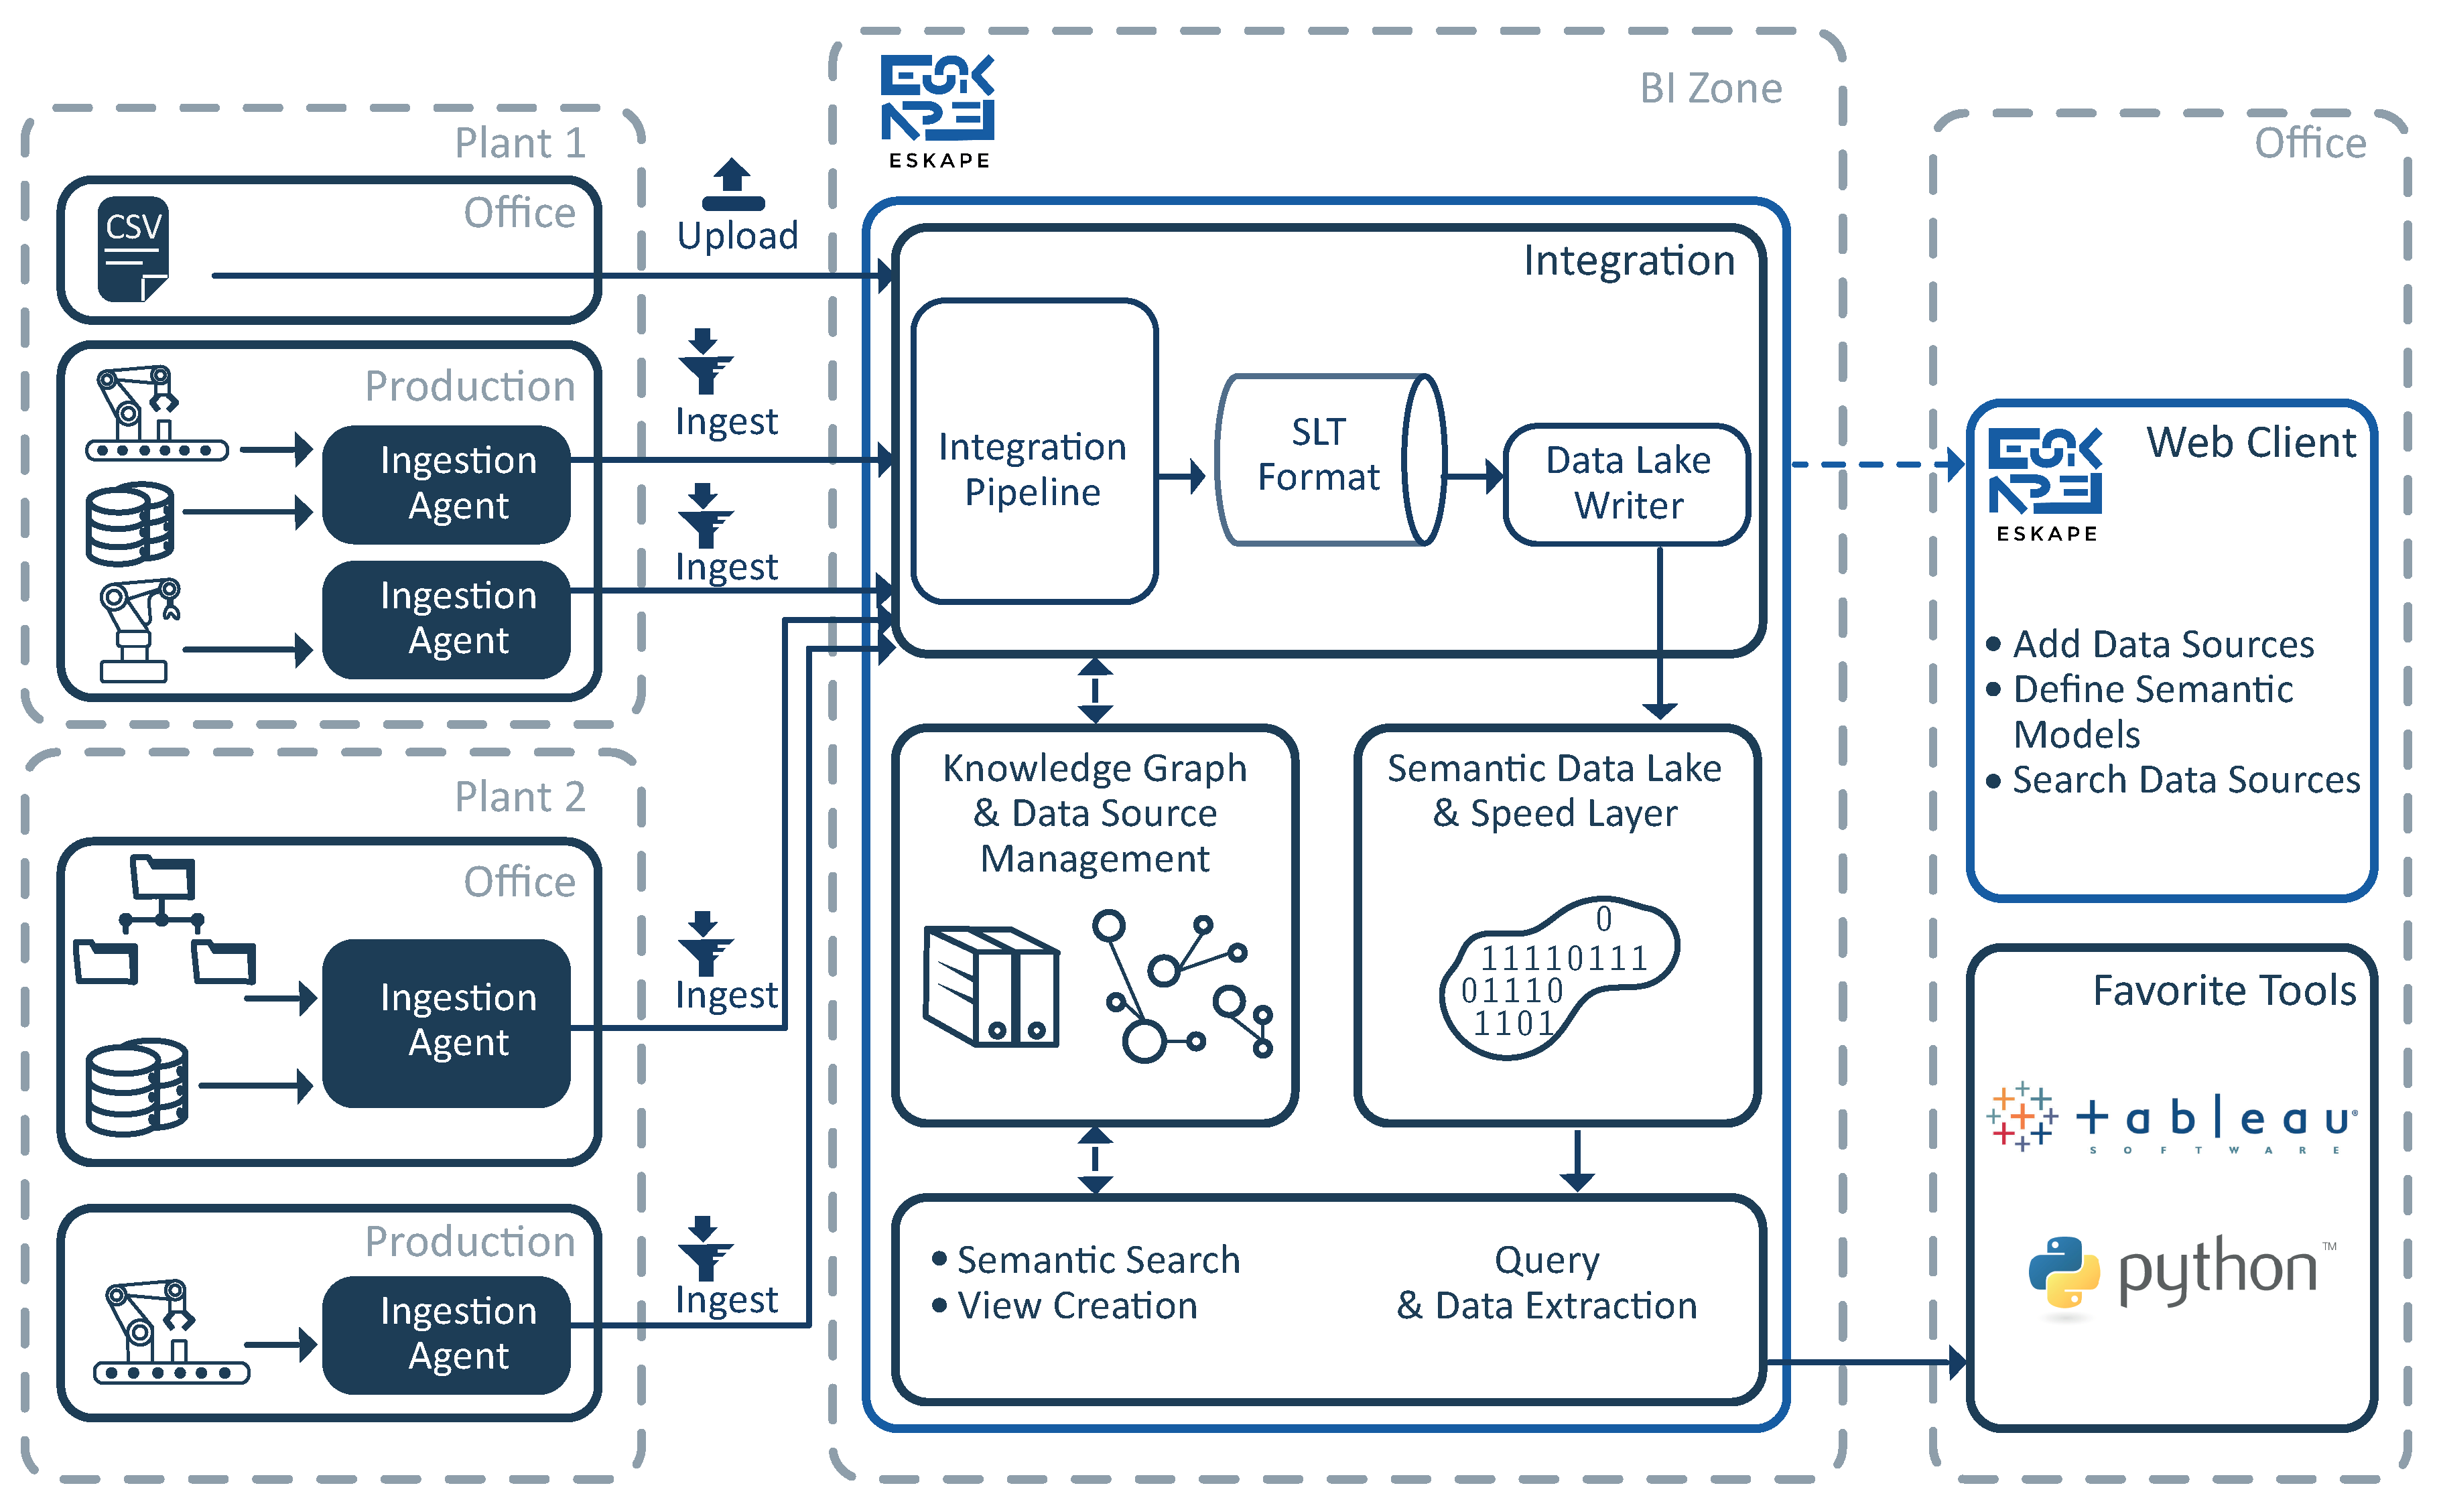
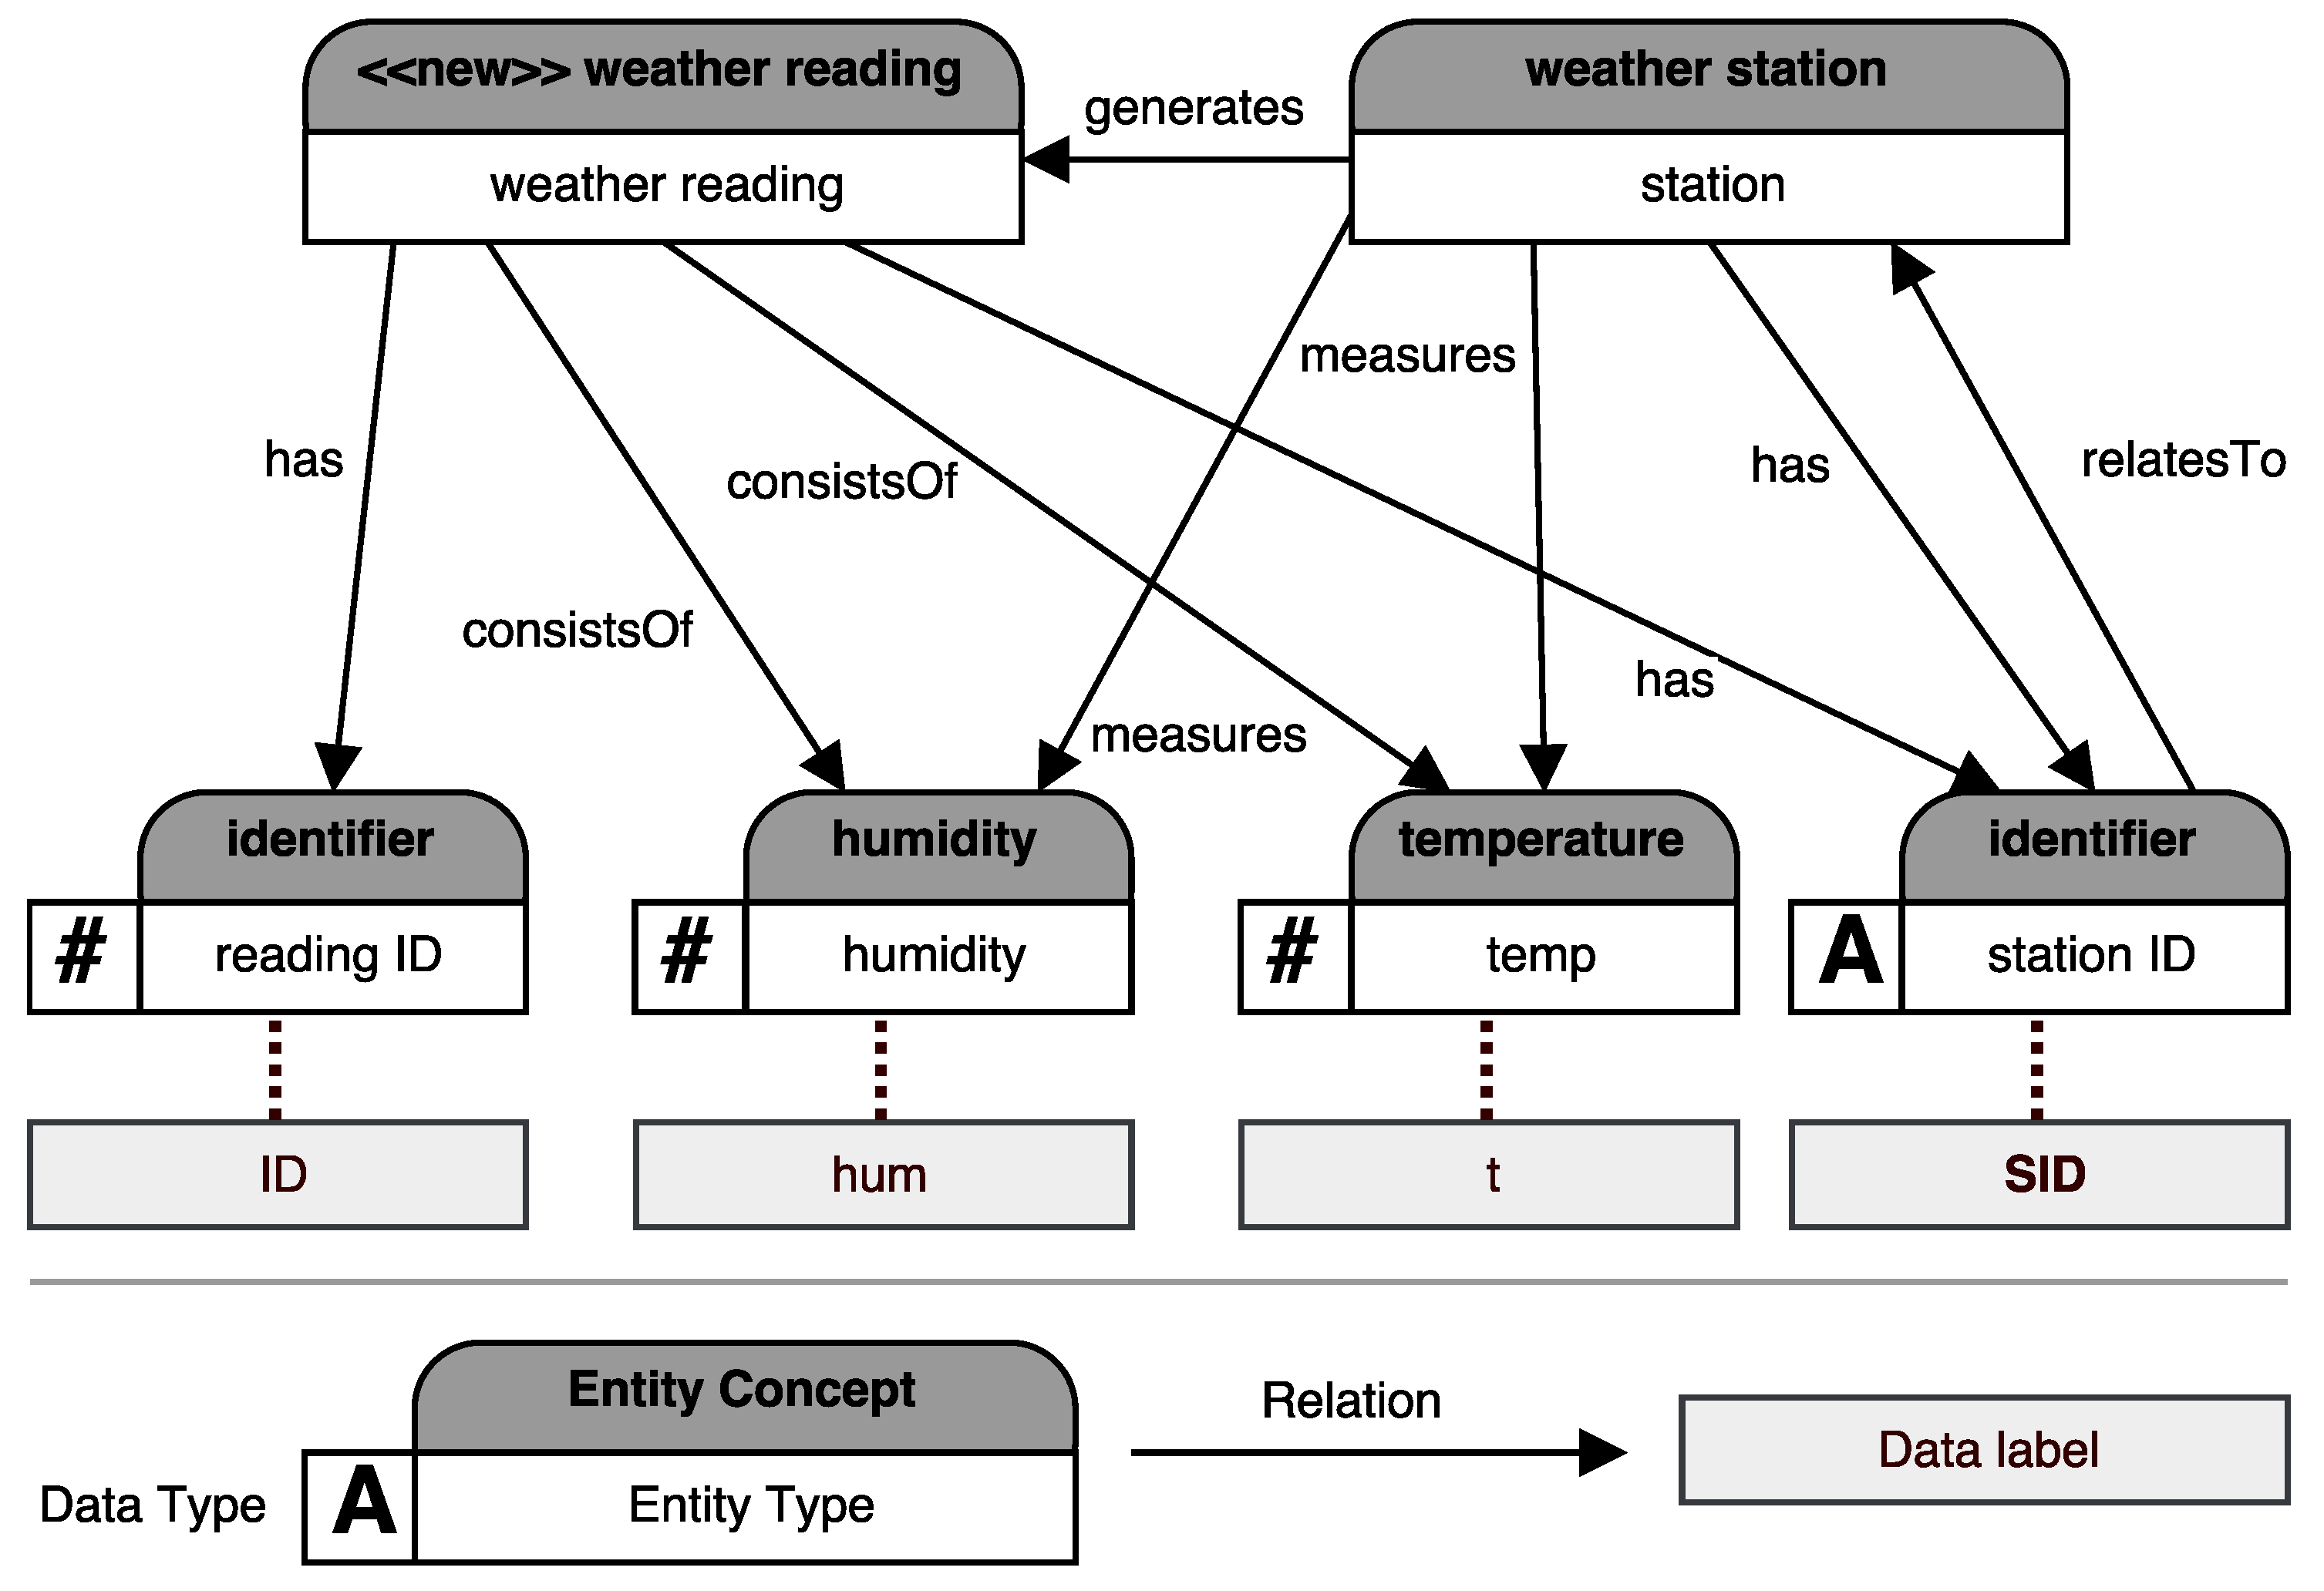
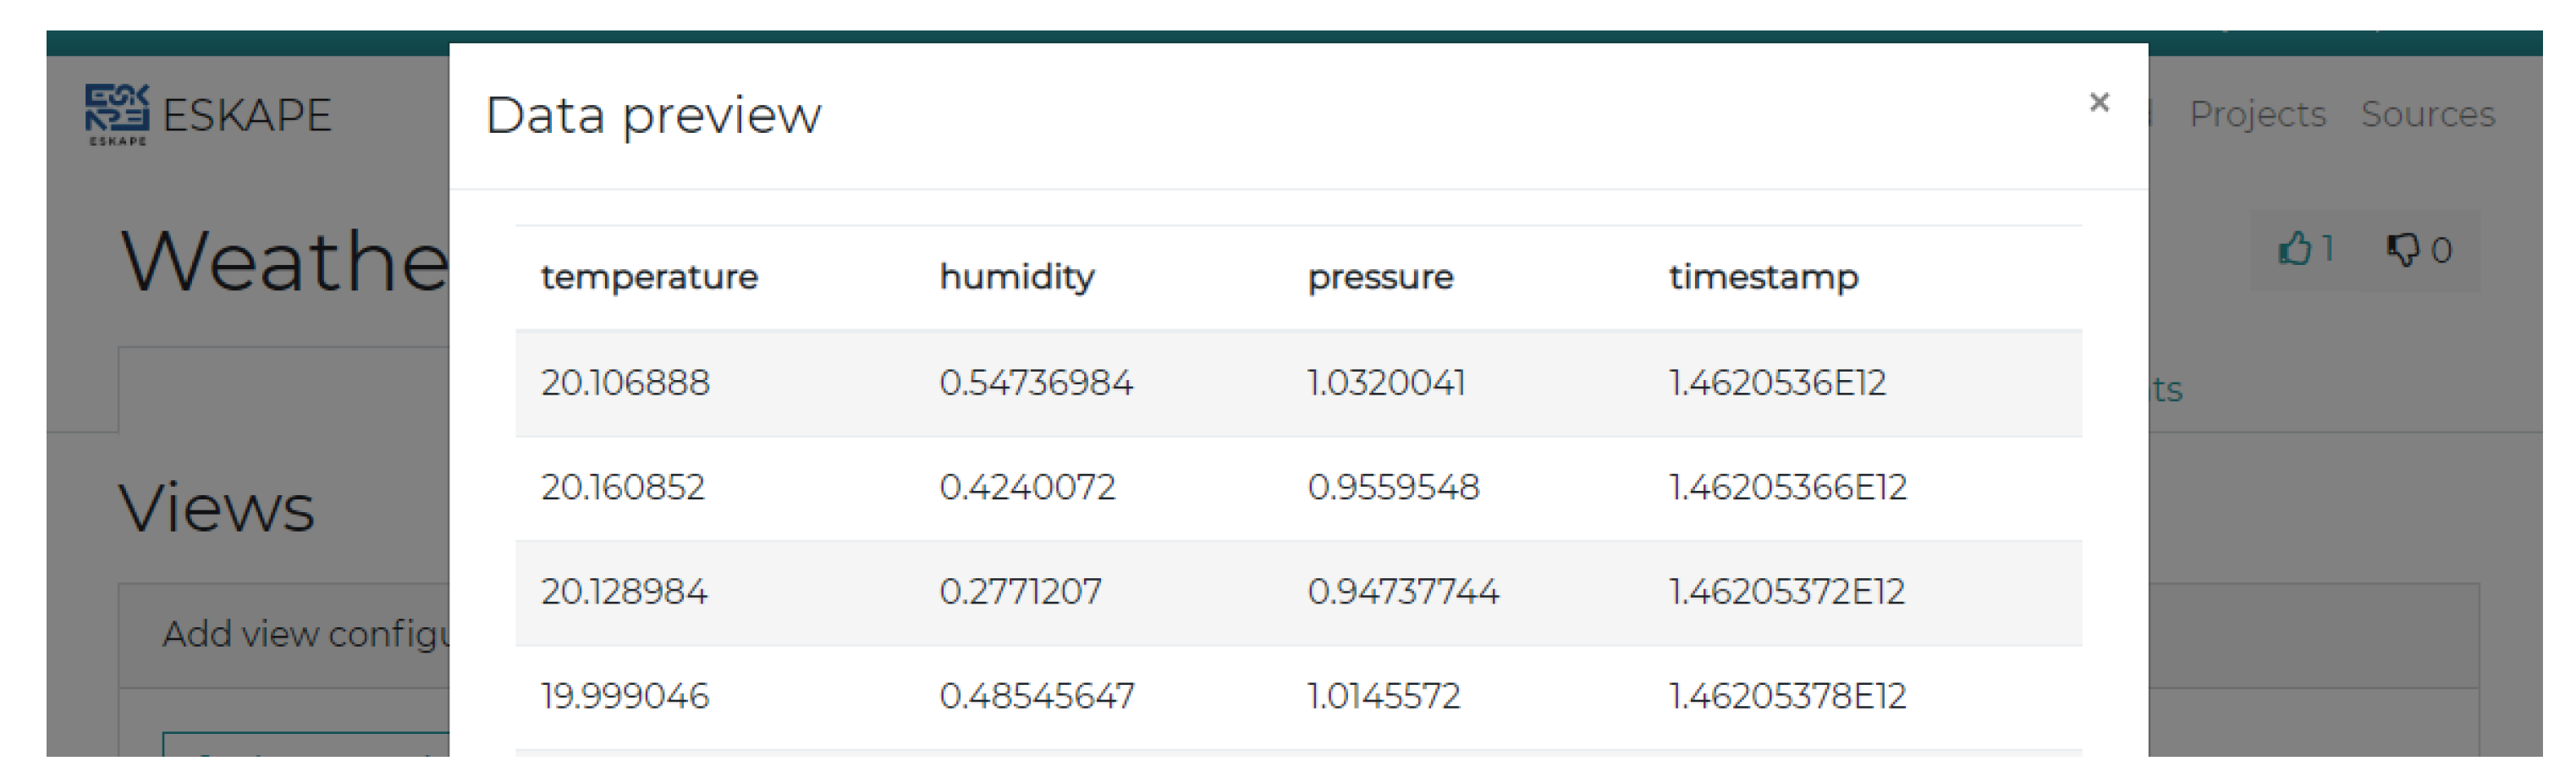
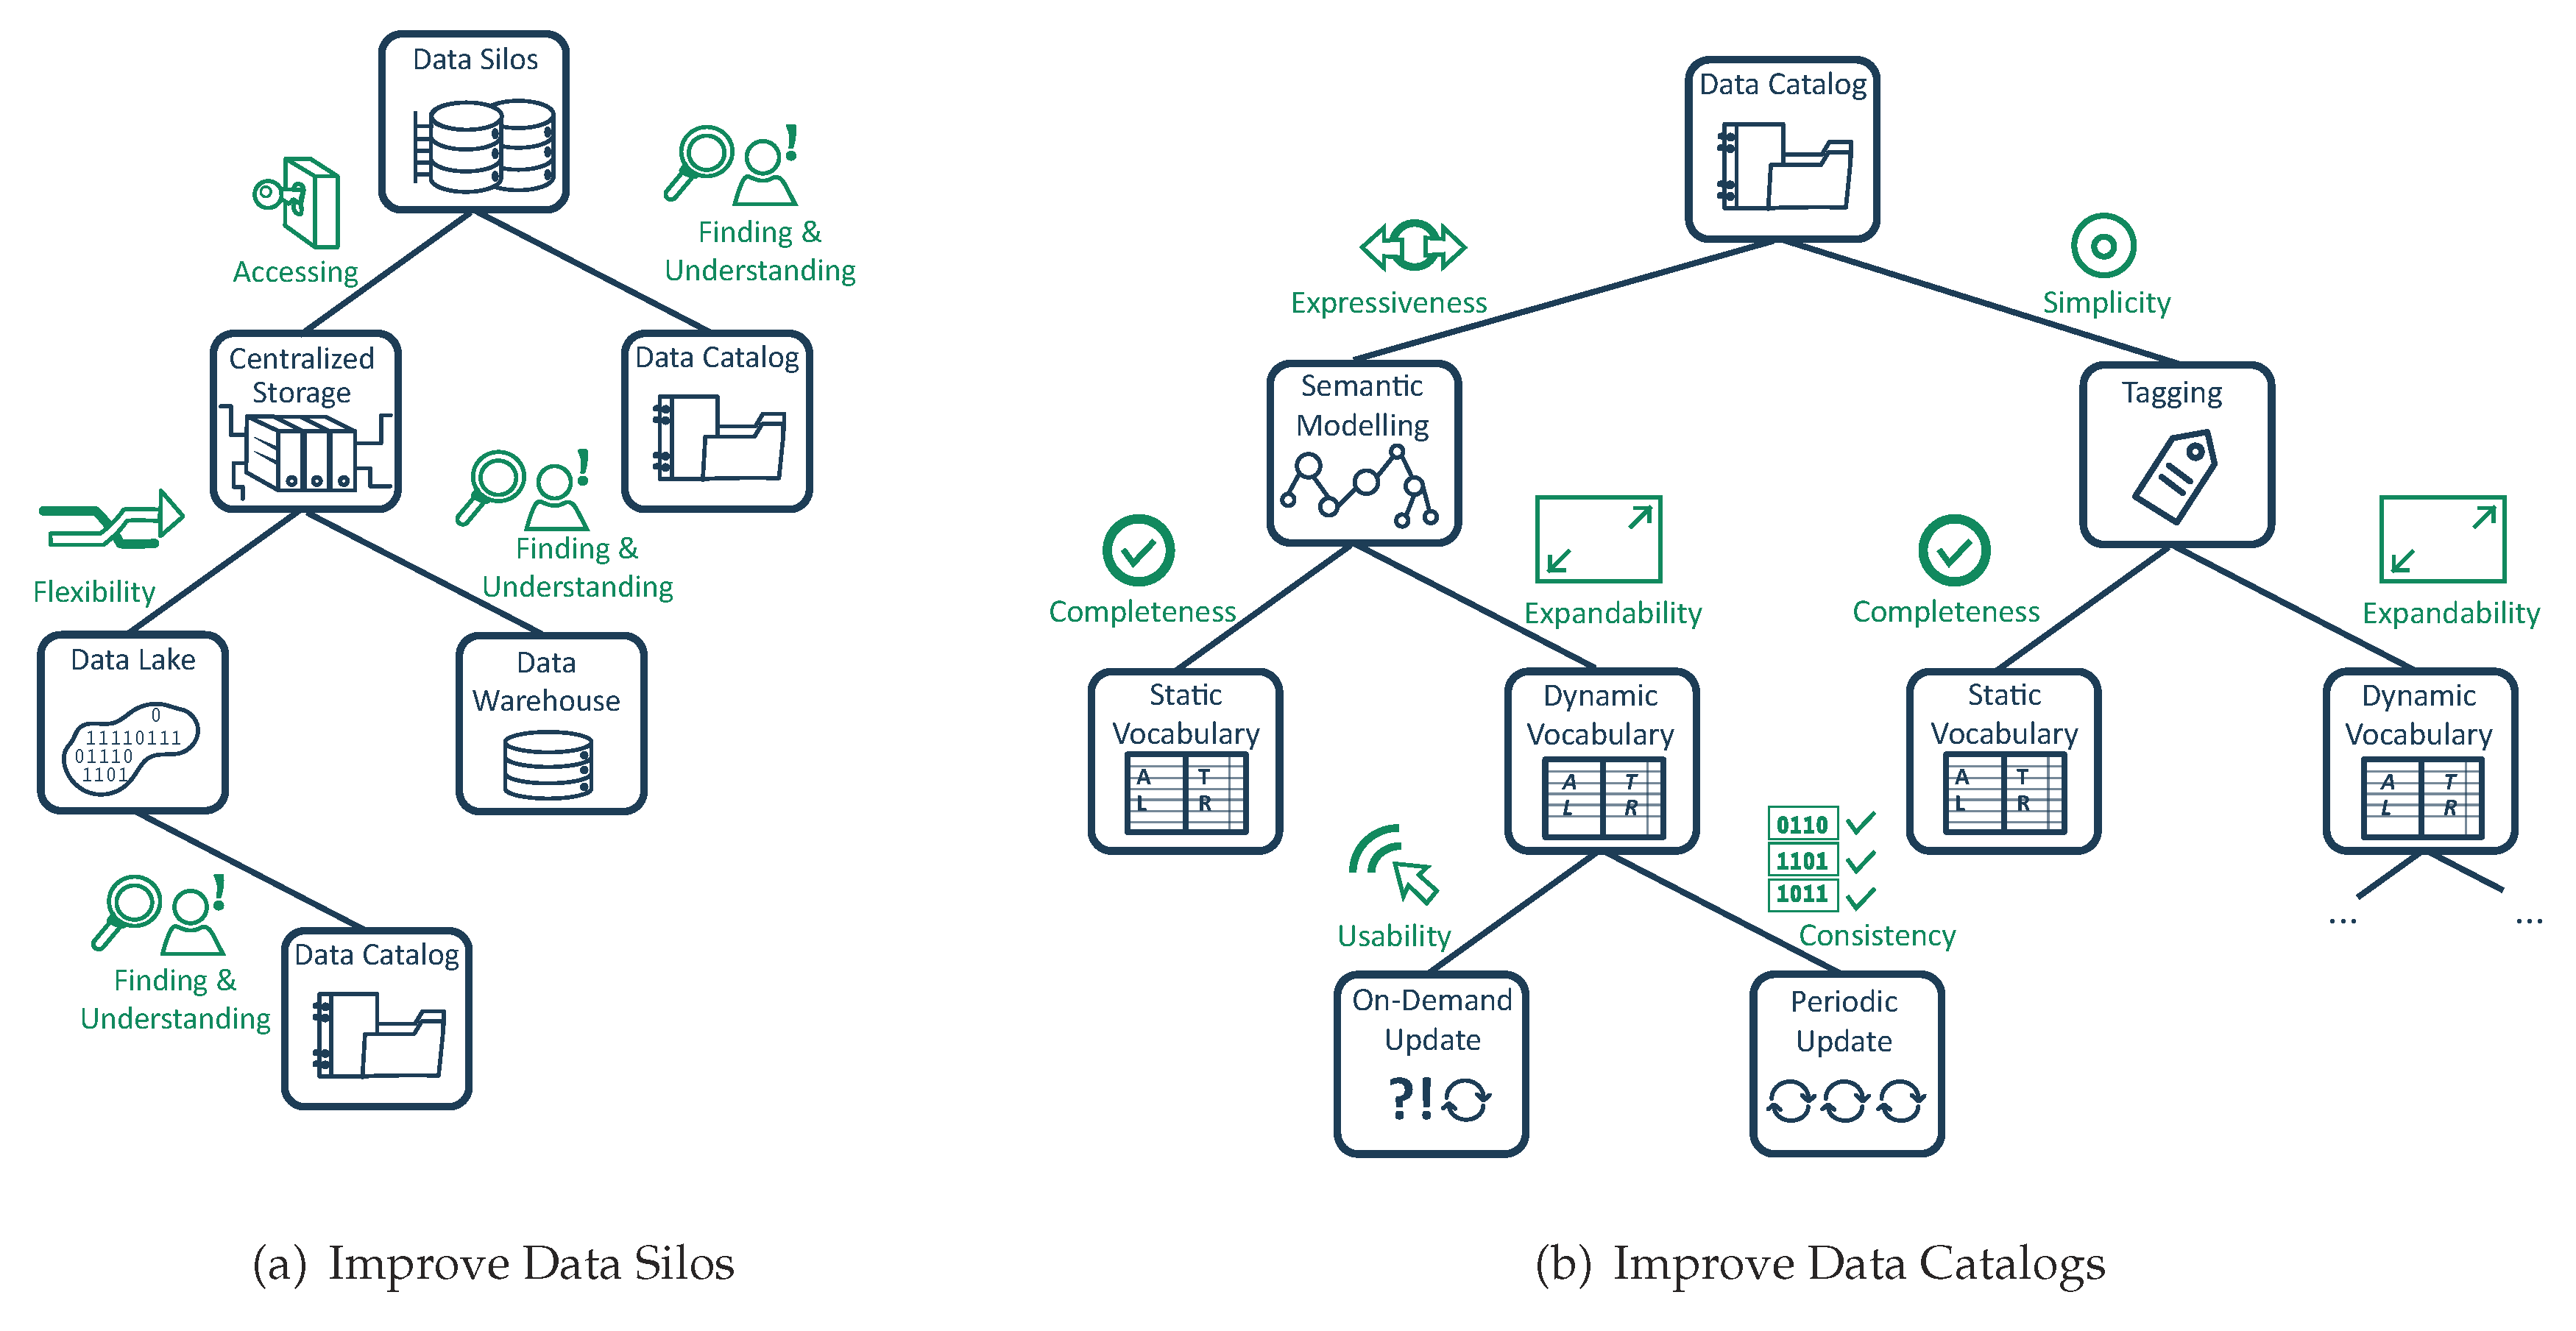