
Scale-Up Effects of CO2 Capture by Methyldiethanolamine (MDEA) Solutions in Terms of Loading Capacity


Abstract
: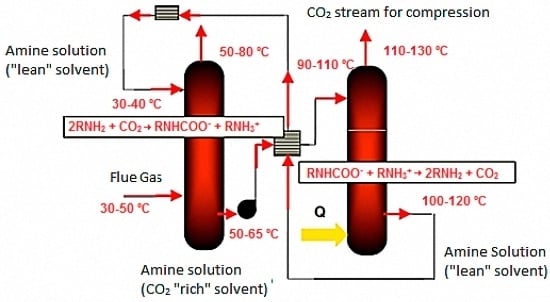
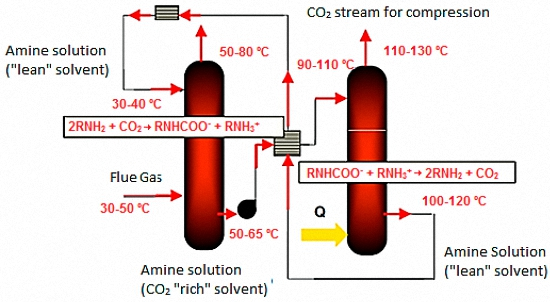
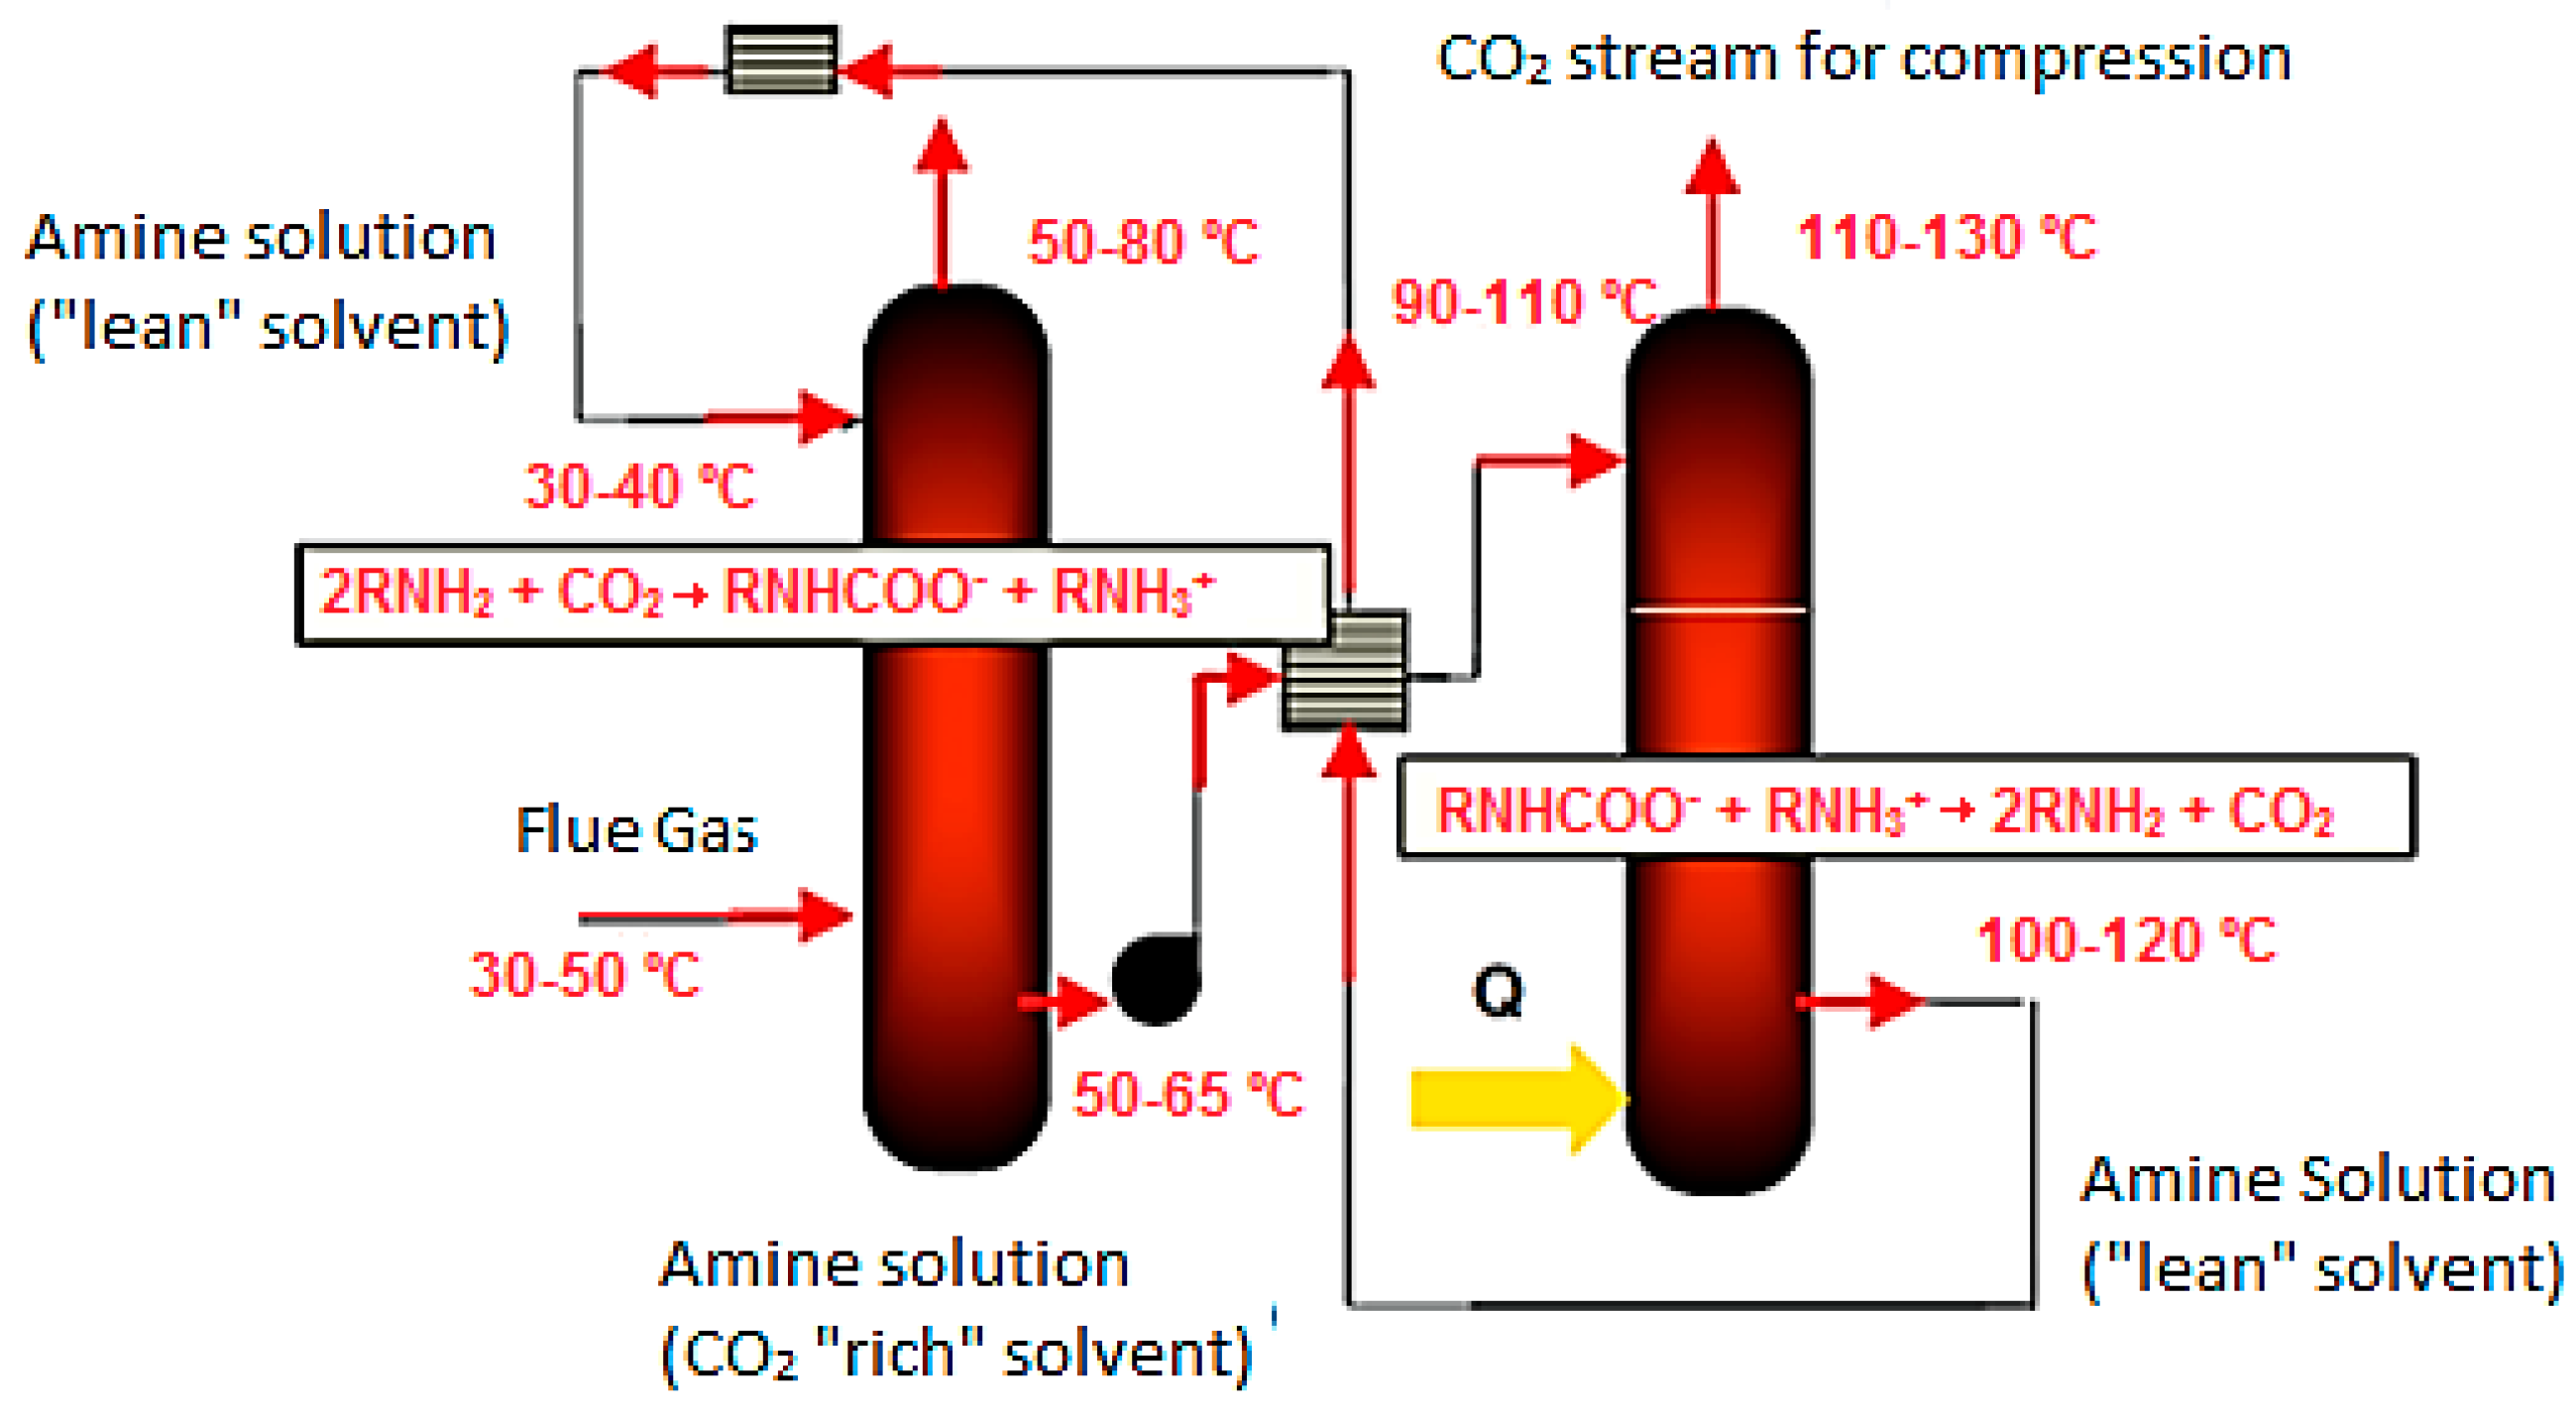
1. Introduction
2. Experimental
2.1. Technique for CO2 Dosing
- wamine is the amine weight (g);
- wsample is the weight of the sample collected from the pilot unit (g);
- %w is the concentration of aqueous amine solution.
- namine is the number of moles of amine (mol amine);
- wamine is the amine weight calculated before in Equation (1);
- MWamine is the molecular weight of the amine (g/mol).
- nCO2 is the number of moles of the obtained CO2 (mol CO2);
- mprecipitate is the weight of the obtained precipitate (g);
- MWBaCO3 is the molecular weight of BaCO3 (g/mol).
- α is the CO2 loading capacity of the aqueous amine solution (mol CO2/mol amine);
- nCO2 is the number of moles of the obtained CO2 calculated before as in Equation (3) (mol CO2);
- namine is the number of moles of the amine calculated before as in Equation (2) (mol amine).
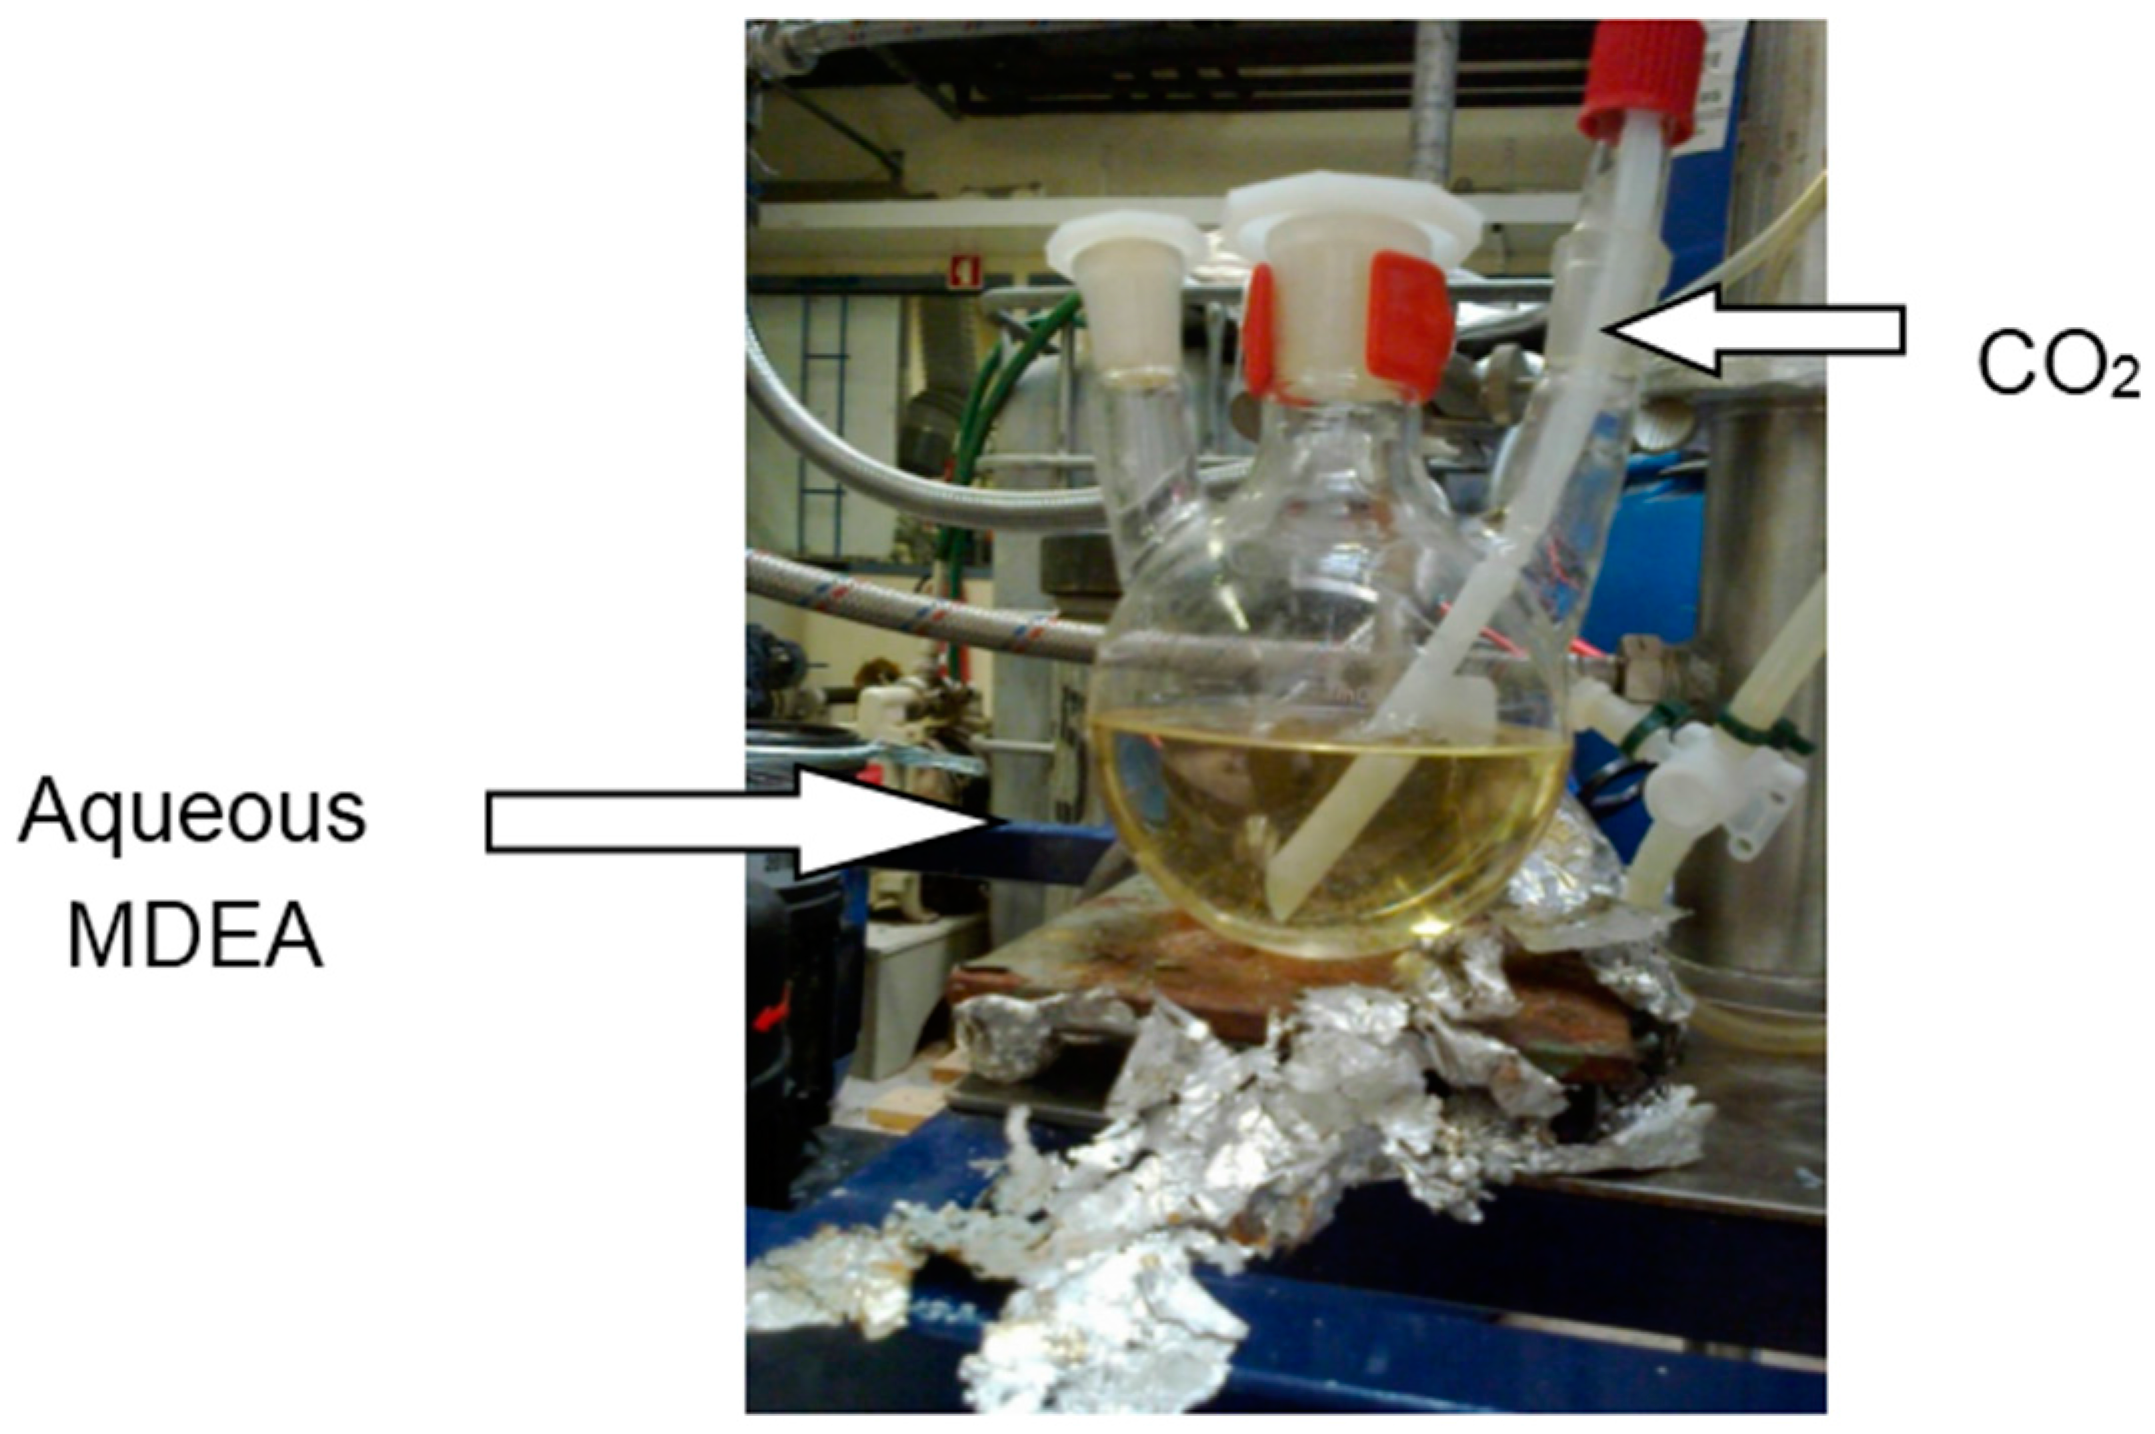
2.2. Laboratory Scale
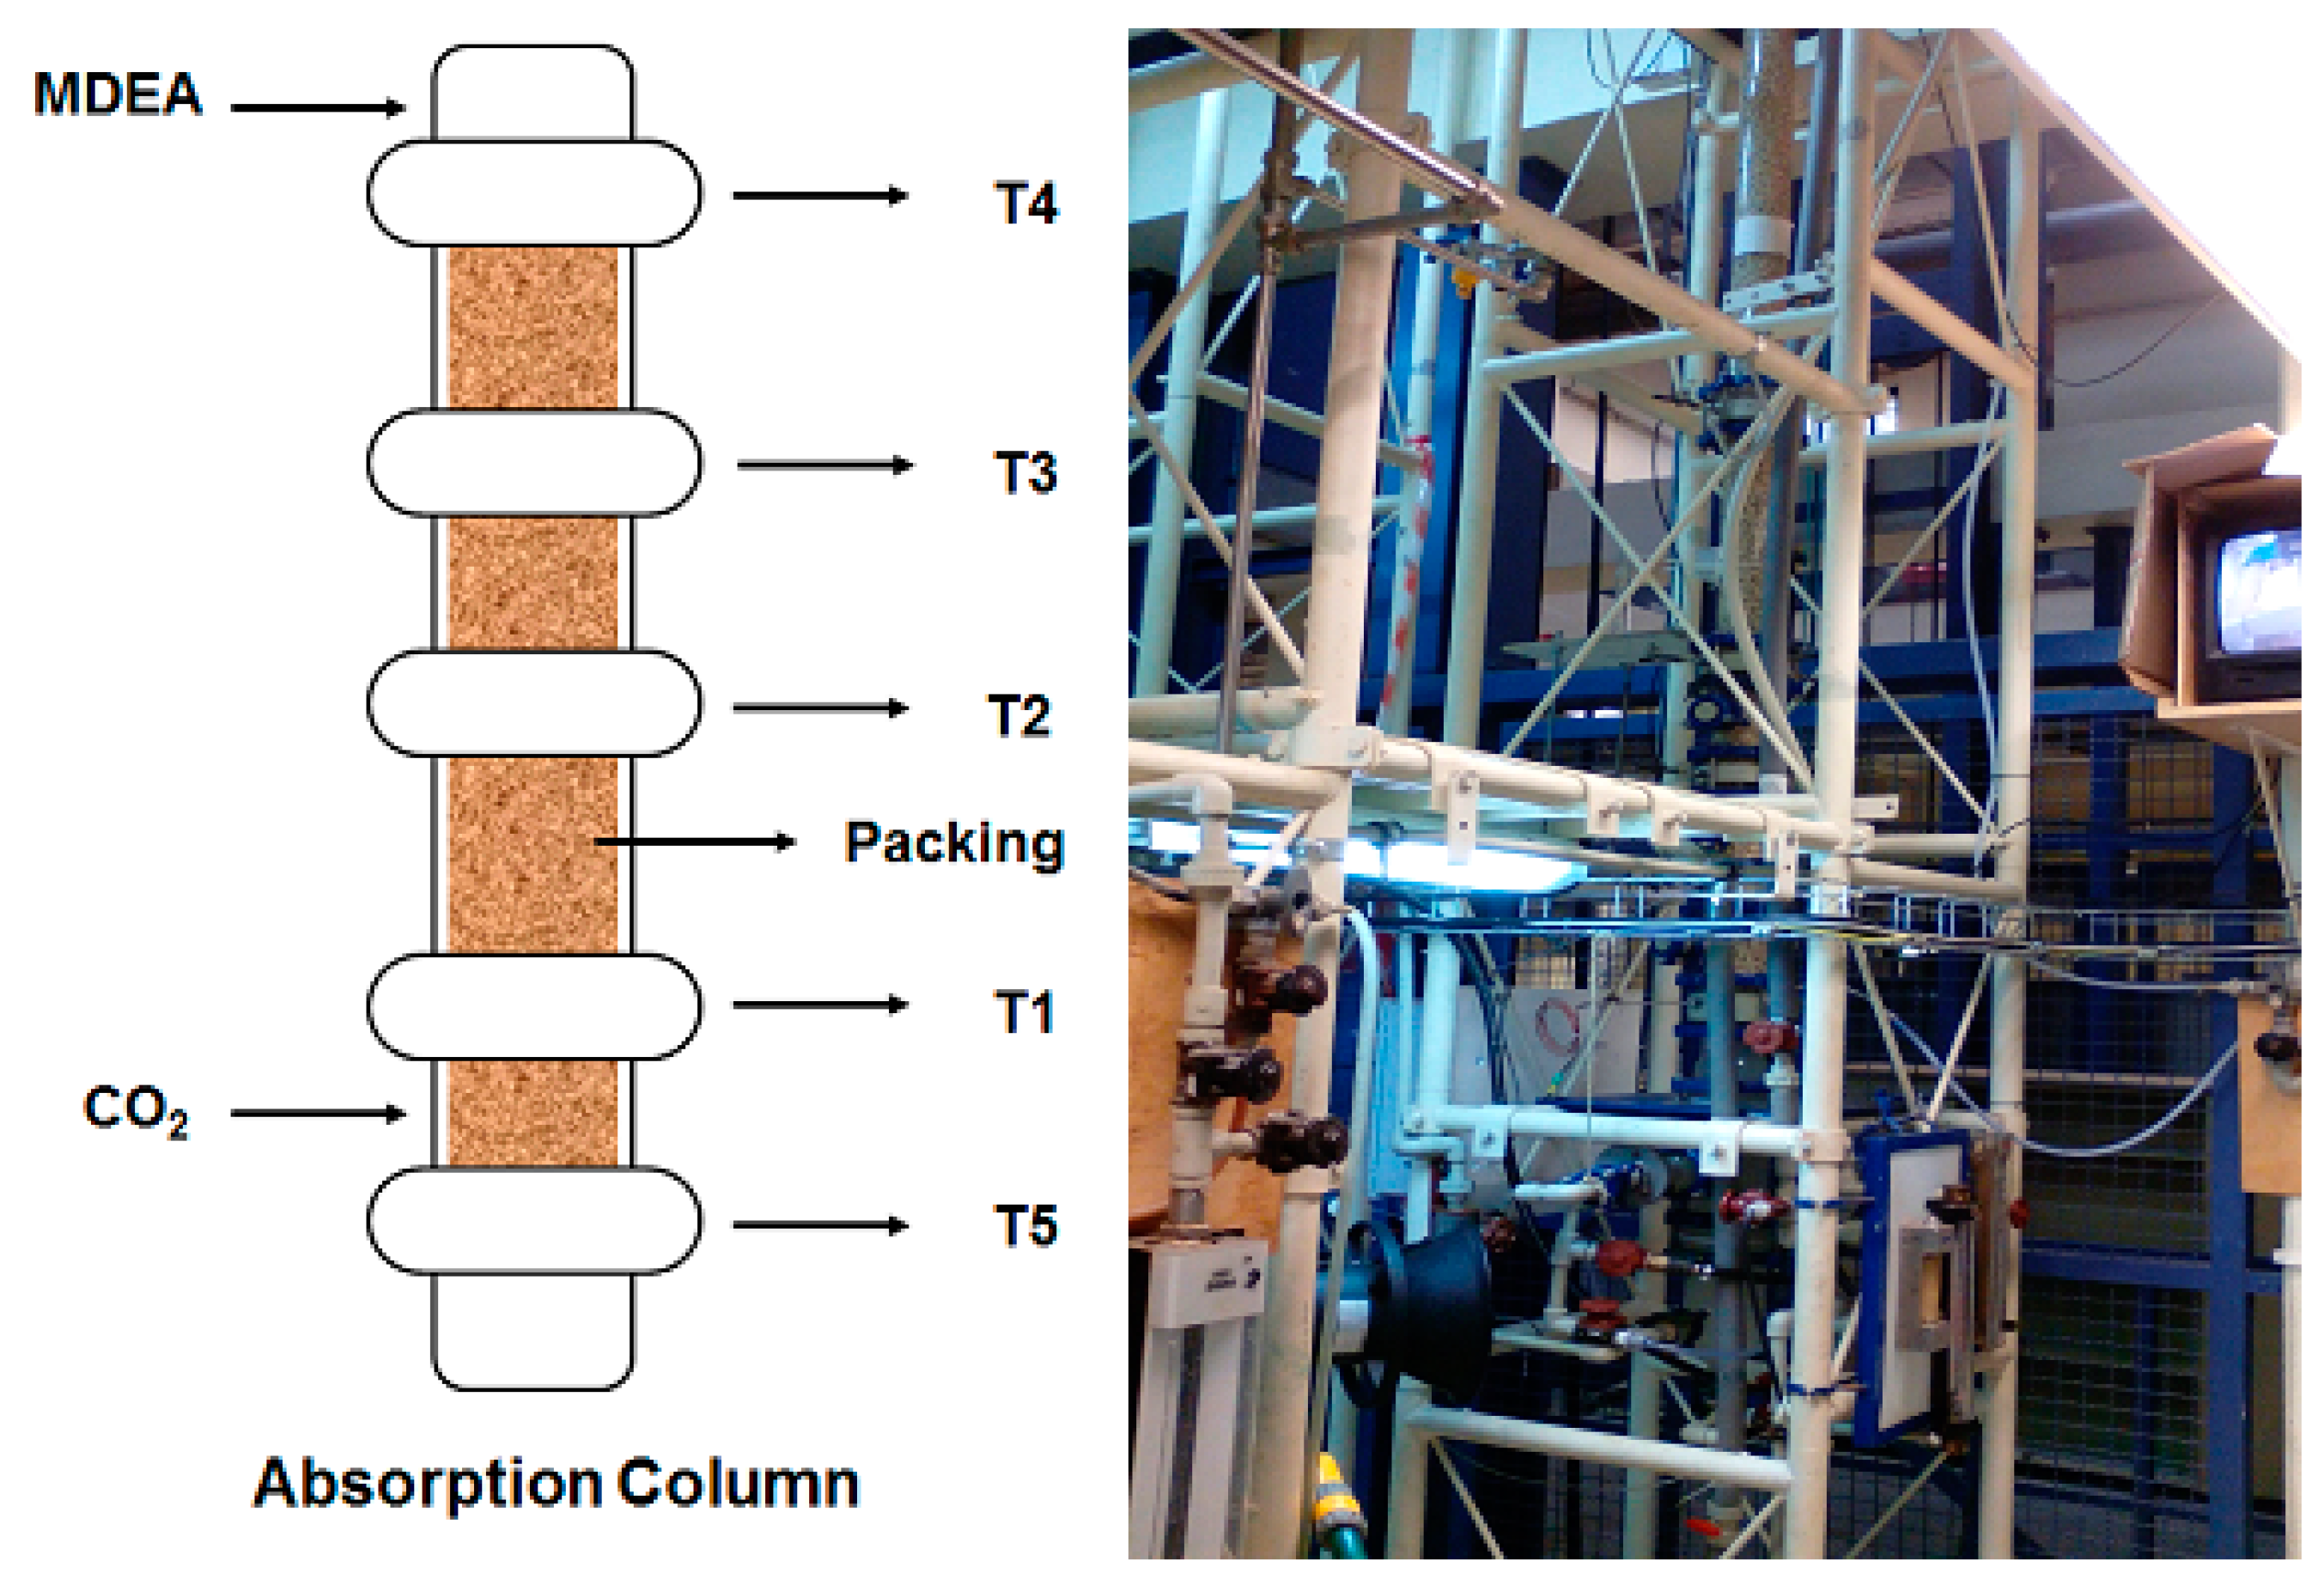
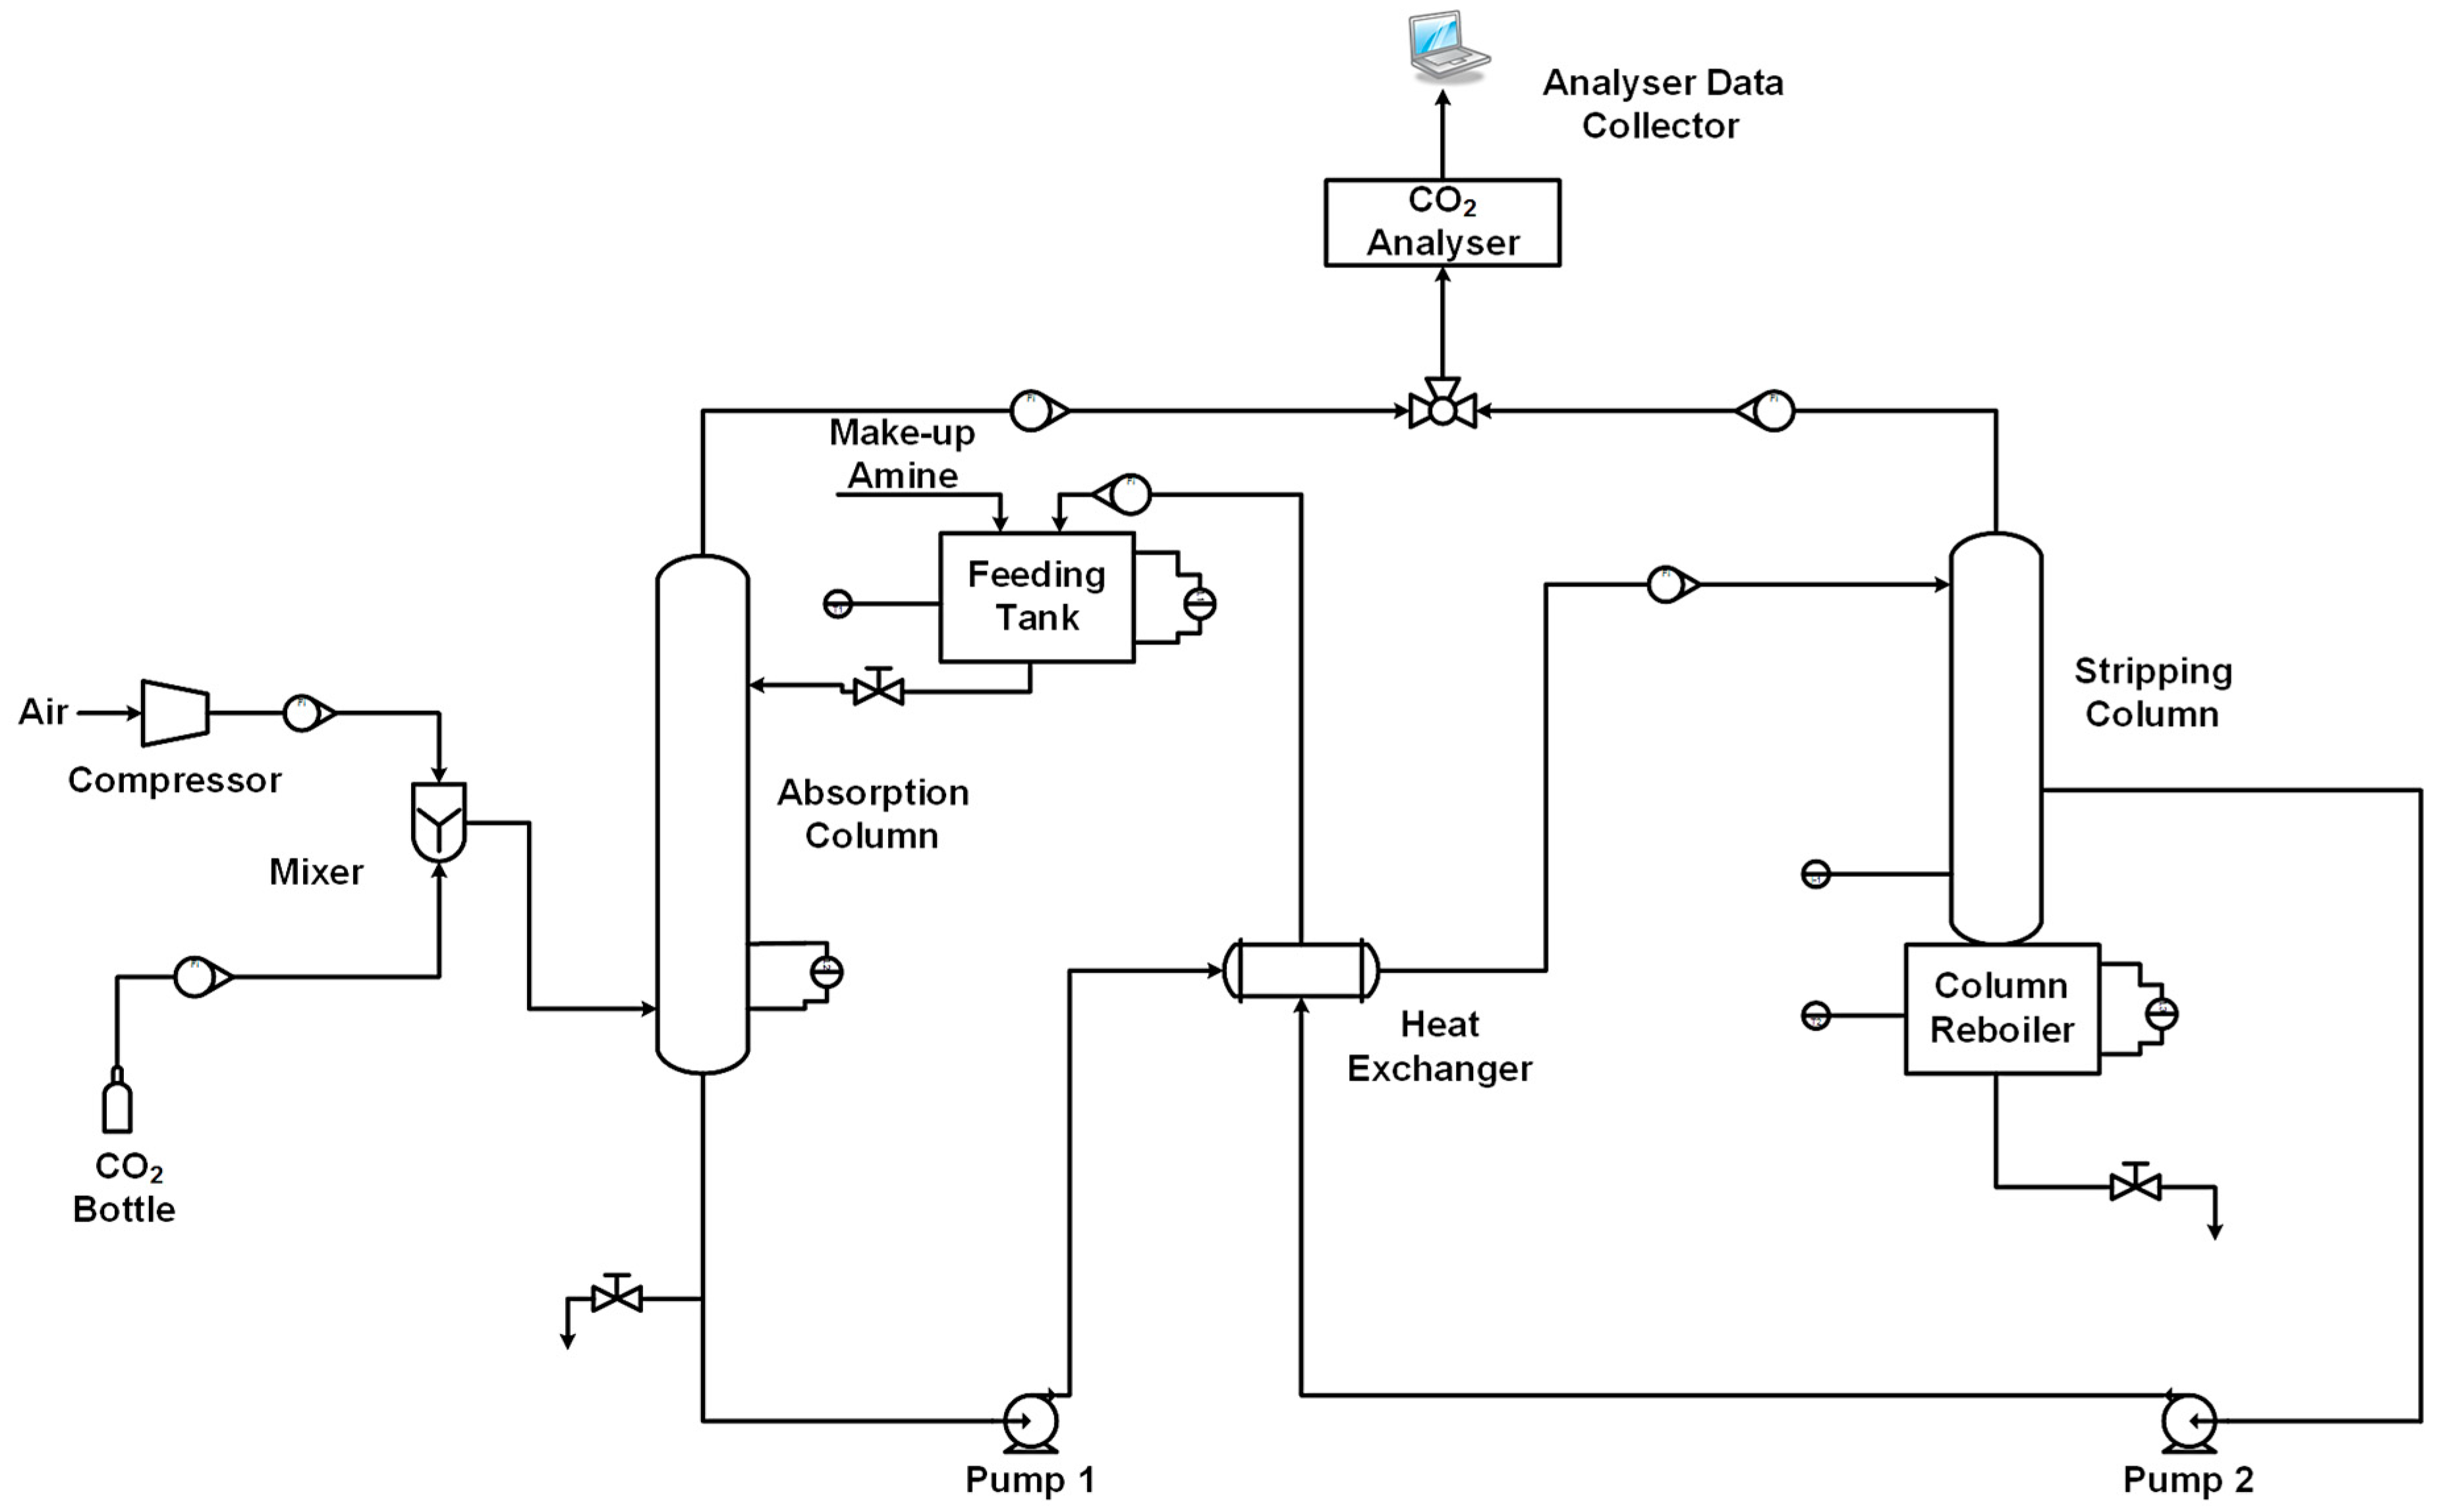
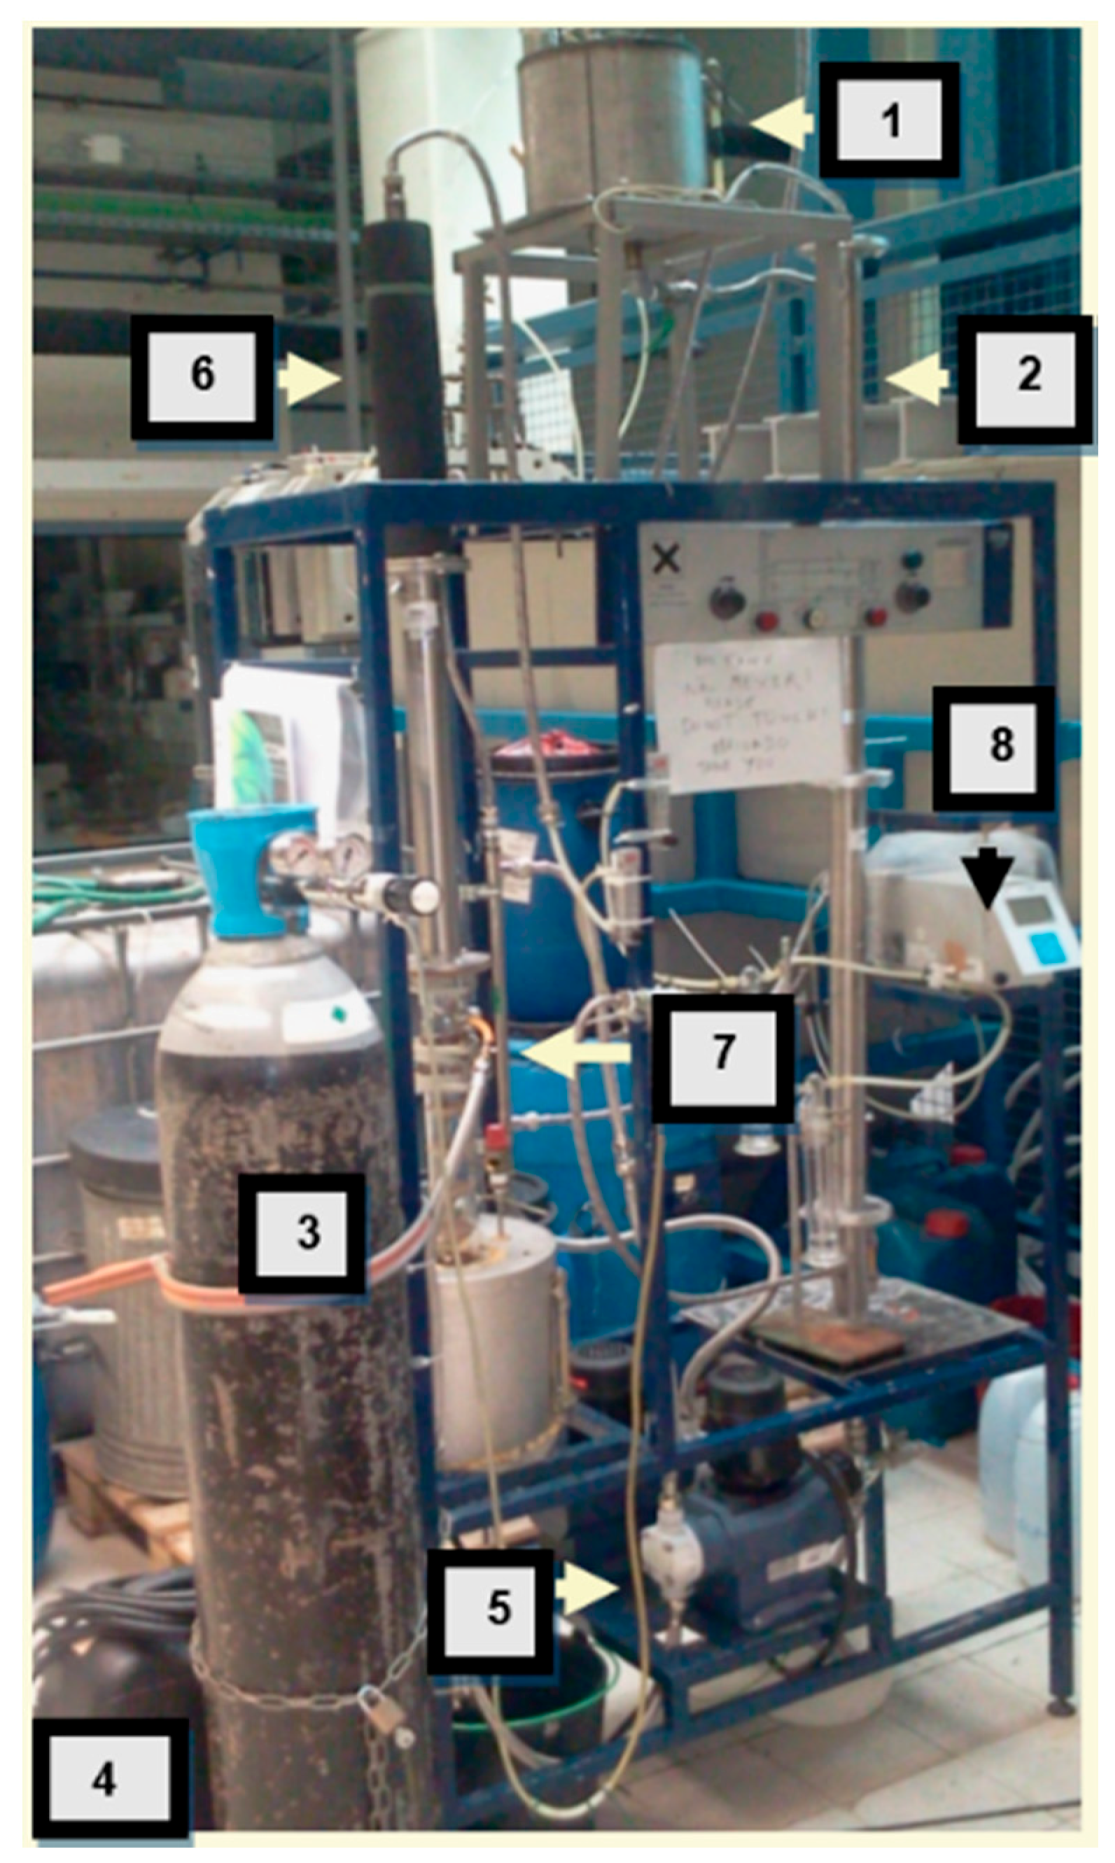
2.3. Pilot Unit Scale
3. Results
3.1. Results from Laboratory Scale
3.2. Results from Pilot Unit Scale
4. Discussion
4.1. Laboratory Scale
4.2. Pilot Unit Scale
Acknowledgments
Author Contributions
Conflicts of Interest
References
- Song, C. Global challenges and strategies for control, conversion and utilization of CO2 for sustainable development involving energy, catalysis, adsorption and chemical processing. Catal. Today 2006, 115, 2–32. [Google Scholar] [CrossRef]
- Yang, H.; Xu, Z.; Fan, M.; Gupta, R.; Slimane, R.; Bland, A.; Wright, I. Progress in carbon dioxide separation and capture: A review. J. Environ. Sci. 2008, 20, 14–27. [Google Scholar] [CrossRef]
- Yu, C.; Huang, C.; Tan, C. A review of CO2 capture by absorption and adsorption. Aerosol Air Qual. Res. 2012, 12, 745–769. [Google Scholar] [CrossRef]
- Rao, A.; Rubin, E. A technical, economic and environmental assessment of amine-based CO2 capture technology for power plant greenhouse gas control. Environ. Sci. Technol. 2002, 36, 4467–4475. [Google Scholar] [CrossRef] [PubMed]
- Figueroa, J.; Fout, T.; Plasynski, S.; McIlvried, H.; Srivastava, R. Advances in CO2 capture technology—The U.S. Department of Energy’s Carbon Sequestration Program. Int. J. Greenh. Gas Control 2008, 2, 9–20. [Google Scholar] [CrossRef]
- MacDowwell, N.; Florin, N.; Buchard, A.; Hallet, J.; Galindo, A.; Adjiman, C.; Williams, C.; Shah, N.; Fennell, P. An overview of CO2 capture technologies. Energy Environ. Sci. 2010, 3, 1645–1669. [Google Scholar] [CrossRef]
- Supap, T.; Idem, R.; Tontiwachwuthikul, P.; Saiwan, C. Kinetics of sulfur dioxide and oxygen-induced degradation of aqueous monoethanolamine solution during CO2 absorption from power plant flue gas streams. Int. J. Greenh. Gas Control 2009, 3, 133–142. [Google Scholar] [CrossRef]
- Gomes, J. Sequestração de CO2—Uma Visão Integrada das Tecnologias Químicas Disponíveis. Habilitation Thesis, Universidade Técnica de Lisboa, Lisboa, Portugal, 2010. [Google Scholar]
- Arias, B.; Diego, M.; Abanades, J.; Lorenzo, M.; Dias, L.; Martínez, D.; Alvarez, A.; Sánchez-Biezma, A. Demonstration of steady state CO2 capture in a 1.7 MWth calcium looping pilot. Int. J. Greenh. Gas Control 2013, 18, 237–245. [Google Scholar] [CrossRef]
- Gomes, J.; Santos, S.; Bordado, J. Choosing amine-based absorbents for CO2 capture. Environ. Technol. 2015, 36, 19–25. [Google Scholar] [CrossRef] [PubMed]
- Li, M.; Chang, B. Solubilities of carbon dioxide in Water + Monoethanolamine + 2-Amino-2-methyl-1-propanol. J. Chem. Eng. Data 1994, 39, 448–452. [Google Scholar] [CrossRef]
- Santos, A. Estudos de Absorção de CO2 em Soluções Aminadas. Master’s Thesis, Instituto Superior de Engenharia de Lisboa, Lisboa, Portugal, 2012. [Google Scholar]
- Santos, S.; Gomes, J.; Bordado, J. Comparative Study of Amine Solutions Used in Absorption/Desorption Cycles of CO2; LAP Lambert Academic Publishing: Saarbrucken, Germany, 2014. [Google Scholar]
- Budzianowski, W. Single solvents, solvent blends and advanced solvent systems in CO2 capture by absorption: A review. Int. J. Glob. Warm. 2015, 7, 184–225. [Google Scholar] [CrossRef]
- Zlokarnik, M. Scale up in Chemical Engineering, 2nd ed.; Wiley-VCH: Weinheim, Germany, 2006. [Google Scholar]
- Budzianowski, W. Low-carbon power generation cycles: The feasibility of CO2 capture and opportunities for integration. J. Power Technol. 2011, 91, 6–13. [Google Scholar]
- Panahi, M.; Skogestad, S. Economically efficient operation of CO2 capturing process part I: Self-optimizing procedure for selecting the best controlled variables. Chem. Eng. Process. 2011, 50, 247–253. [Google Scholar] [CrossRef]


| Scale | Column Height (dm) | Column Inner Diameter (dm) | Column Volume (L) | CO2 Flowrate (L/h) | Aqueous Amine Solution Flow (L/h) |
|---|---|---|---|---|---|
| Pilot-unit | 15 | 0.505 | 3 | 1.2 | 24 |
| Large pilot-unit | 110 | 0.750 | 62 | 1200 | 40 |
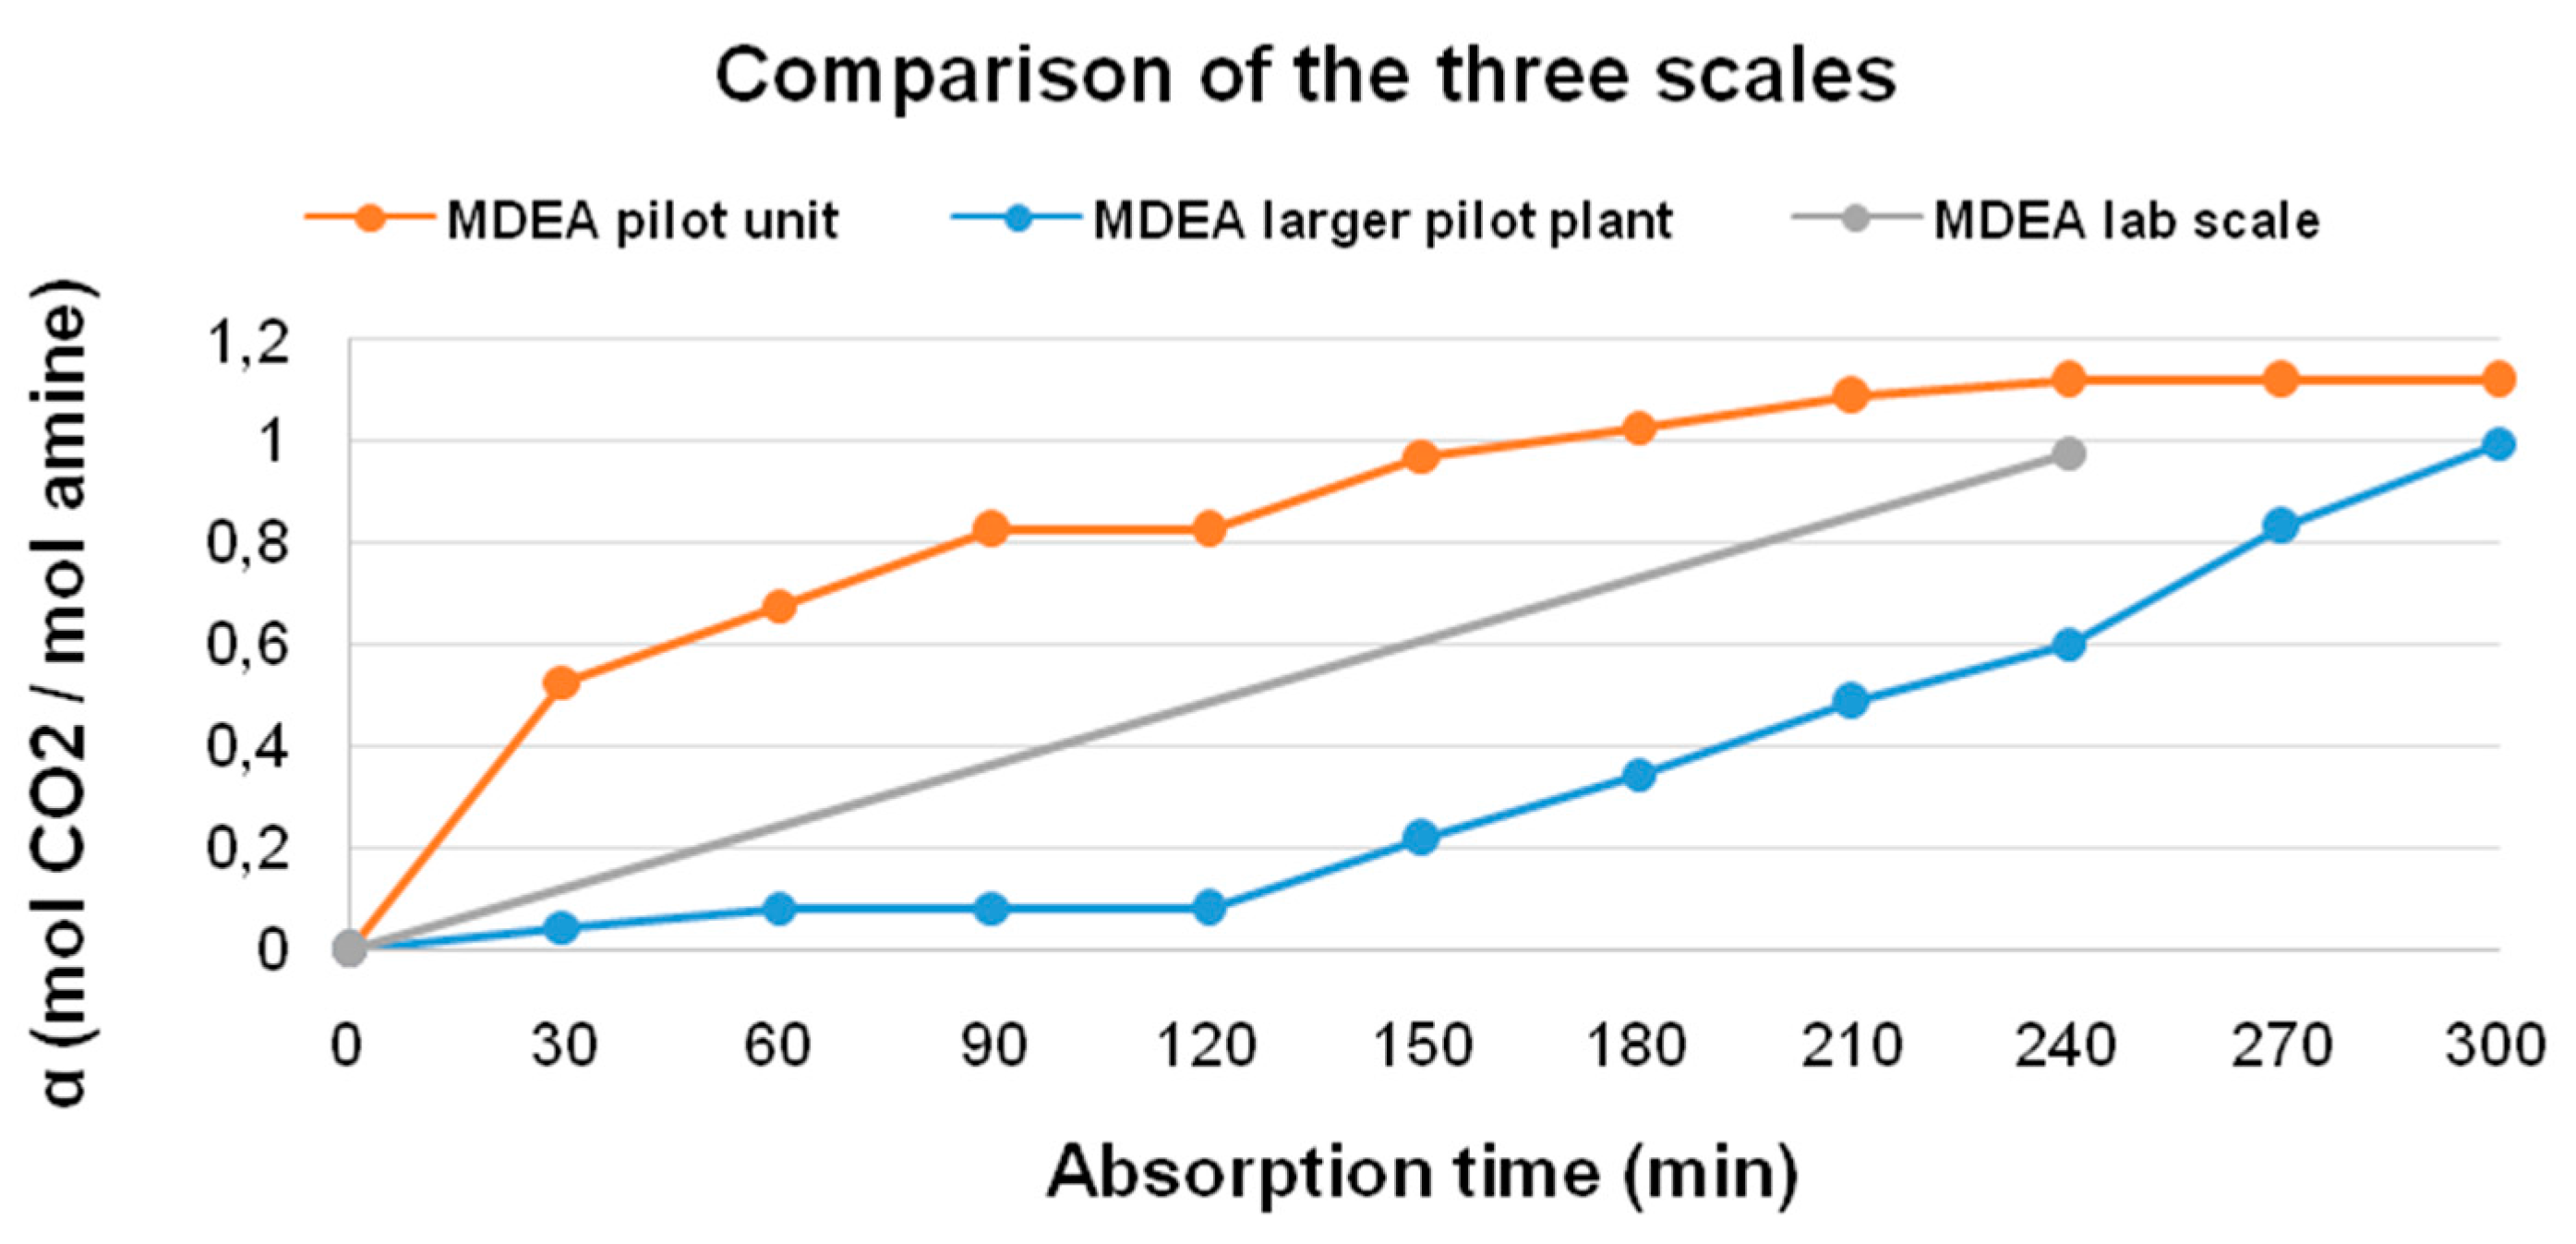
| Absorption Time (min) | Loading Capacity (α) (mol CO2/mol amine) |
|---|---|
| 30 | 0.529 |
| 60 | 0.676 |
| 90 | 0.824 |
| 120 | 0.824 |
| 150 | 0.971 |
| 180 | 1.029 |
| 210 | 1.089 |
| 240 | 1.118 |
| 270 | 1.118 |
| 300 | 1.118 |
| Absorption Time (min) | Loading Capacity (α) (mol CO2/mol amine) |
|---|---|
| 30 | 0.046 |
| 60 | 0.084 |
| 90 | 0.082 |
| 120 | 0.079 |
| 150 | 0.218 |
| 180 | 0.347 |
| 210 | 0.486 |
| 240 | 0.602 |
| 270 | 0.831 |
| 300 | 0.998 |
© 2016 by the authors; licensee MDPI, Basel, Switzerland. This article is an open access article distributed under the terms and conditions of the Creative Commons Attribution (CC-BY) license (http://creativecommons.org/licenses/by/4.0/).
Share and Cite
Santos, S.P.; Gomes, J.F.; Bordado, J.C. Scale-Up Effects of CO2 Capture by Methyldiethanolamine (MDEA) Solutions in Terms of Loading Capacity. Technologies 2016, 4, 19. https://doi.org/10.3390/technologies4030019
Santos SP, Gomes JF, Bordado JC. Scale-Up Effects of CO2 Capture by Methyldiethanolamine (MDEA) Solutions in Terms of Loading Capacity. Technologies. 2016; 4(3):19. https://doi.org/10.3390/technologies4030019
Chicago/Turabian StyleSantos, Samuel P., João F. Gomes, and João C. Bordado. 2016. "Scale-Up Effects of CO2 Capture by Methyldiethanolamine (MDEA) Solutions in Terms of Loading Capacity" Technologies 4, no. 3: 19. https://doi.org/10.3390/technologies4030019
APA StyleSantos, S. P., Gomes, J. F., & Bordado, J. C. (2016). Scale-Up Effects of CO2 Capture by Methyldiethanolamine (MDEA) Solutions in Terms of Loading Capacity. Technologies, 4(3), 19. https://doi.org/10.3390/technologies4030019