Abstract
In order to achieve fast and accurate life damage online monitoring of the steam turbine rotor, it was significant to propose an empirical-statistical model using a machine learning algorithm instead of finite element simulation to improve the effect of operation. The finite element method was used to calculate the maximum stress during the start-up schedule. The linear CDM (Continuum Damage Mechanics) and nonlinear CDM were applied to assess the creep-fatigue damage of the steam turbine rotor. A empirical-statistical model of a 600 MW steam turbine rotor was established by using temperature change rate and maximum stress according to the finite element result samples, which is proposed by compared R2 of SVR (Support Vector Regression), LSTM (Long Short-Term Memory) and RRM (Ridge Regression Method), which was also verified by finite element simulation under a random start-up parameters. The results showed that the creep-fatigue damage could be calculated by nonlinear CDM for more safety rather than linear CDM. The R2 of SVR (Support Vector Regression), LSTM (Long Short-Term Memory) and RRM were 0.9377, 0.9647 and 0.999, respectively. RRM was more suitable for the empirical-statistical model establishment of the steam turbine rotor. By comparing the empirical-statistical model result and finite element result under random parameters of the start-up schedule, the error is 0.51%.
1. Introduction
With the vigorous development of the new energy industry, the capacity of green power generation, such as wind power and photovoltaic power, has grown rapidly. Although wind power and photovoltaic power generation have relatively low costs, their power generation capacity fluctuates greatly, which leads to the inability of the power grid to output stably. Hence, thermal power plants become an important part of supplementing the power grid by peak modulation frequently [1]. The huge fluctuations in the temperature and thermal stress of the steam turbine rotor are caused by frequent peak modulation, which has a very serious impact on the low-cycle fatigue of the steam turbine rotor [2]. Investigation on the influence of peak load operation mode for the steam turbine rotor can obtain a reasonable strategy and ensure safe operation [3]. However, during the peak modulation process of the steam turbine rotor, the environmental changes are extremely complex, and many parameters cannot be measured, especially the temperature and stress of the rotor [4]. At present, a relatively effective method is to calculate the temperature and stress distribution and variation of the steam turbine rotor by numerical simulation, which is always utilized to evaluate the performance and optimization of the peak modulation [5,6,7].
The optimization of the power plant start-up scheme in an early work was proposed by an expert system [8,9], which functions of the start-up scheme and online operation. The fuzzy reasoning and neural work were introduced to optimize the start-up scheme for reducing the work burden of plant operators. In order to save the calculation time and obtain the optimal start-up scheme quickly, the GA and enforcement operation to search the optimal scheme along the edge instead of the entire space was used [10]. An intelligent start-up scheme optimization system to minimize the operation time, low economic cost, and stress damage of the steam turbine rotors consisted of a dynamic numerical simulation, a neural network, and an interactive multi-objective programming technique, which was based on genetic range genetic algorithm [11]. JModelica framework with the Optimistic extension was used to solve the optimal control problem of steam boiler start-up operation [12]. In order to achieve less fuel consumption and less emission, a comprehensive dynamic simulation model including the process component of boiler and water-steam cycle was developed, including the power plants control system along with start-up sequence control [13]. Meanwhile, an intelligent multi-objective model predictive control method was proposed to improve the economy of thermal power plants, which was verified by reducing the start-up time and rotor thermal stress of the steam turbine rotor [14]. With the continuous expansion and strengthening of computer computing power, heuristic algorithms were widely applied in the field of start-up scheme optimization, such as the Support Vector Machine (SVM) algorithm [15], continuum damage mechanics (CDM) model [16], artificial neural networks [17], and artificial neural network inverse (ANNi) [18]. Consequently, a steam turbine rotor was regarded as the main component of the unit, which is subjected to high temperature variations and complex alternating thermal stresses during frequent start-up, shutdown and peak modulation.
As the new energy generation is restricted by the natural weather variations, temporal constraints, and other factors, the power supply capability of new energy is instability. Peak modulation is gradually taken as the main strategy for thermal power and nuclear power to ensure the stability of the grid power supply. During the peak modulation, the steam turbine rotor served as a pivotal rotating component of the turbine, which was more susceptible to the dramatic variations in its temperature and rotational speed. The alternating stress of fatigue was sharply enhanced by temperature and rotational speed variations, which caused progressive damage to the steam turbine rotor, especially at high-stress concentration positions [19]. Additionally, the steam turbine rotor was subjected to alternating centrifugal and torsional stresses by rotational speed variations, as well as compressive stress from high steam pressure. Finally, the damage risk of the steam turbine rotor was directly heightened, which was a major hidden danger to the safety of power plants [20]. Therefore, controlling and optimizing the peak modulation was very significant to enhance both the safety and economic viability of the unit, which was based on rotor stress management to adapt to the flexible operation requirements of the steam turbine [21].
The start-up mode and load change on stress level were proposed by analysis of stress variations in components, such as the turbine rotor and cylinder, to provide guidance for the rapid start-up of the unit [22]. A three-dimensional finite element model of the turbine’s inner cylinder was used to propose a preheating method for reducing fatigue damage without changing the operation time [23]. Owing to the control temperature changing rate to reduce thermal stress, a thermodynamic process model was developed to monitor the tendency of temperature distribution online [24]. By using commercial finite element analysis software, typically ABAQUS 6.14, the fatigue damage of the turbine rotor would be obviously present in the computer, which was calculated by the theories of the Manson-Coffin equation and Palmgren-Miner rule. In this way, the optimization of elongating the start-up scheme and mitigating fatigue damage was achieved [25]. With the experimental measurement and finite element analysis, the stress of the turbine rotor would be calculated, which was beneficial for guiding the thermal stress management of the turbine rotor under different conditions by limiting speed and the rate of power change [26]. Next, the main factor affecting the turbine rotor was low-cycle fatigue. Alternating thermal stress was the main factor for the damage degree of low-cycle fatigue, which was only determined by the rate of temperature change [27,28,29,30,31]. Hence, accurately predicting the temperature change of the steam turbine rotor was very significant for the prerequisite conditions of optimizing the steam turbine rotor start-up scheme, which could be conducted by combining finite element analysis with machine learning algorithms. In this case, the life damage of the turbine rotor during the start-up and shutdown process can be predicted efficiently and in real time, solving the current problem that the life digital twin prediction of the turbine rotor cannot be carried out during peak shaving.
In this paper, a new statistical mathematical model was proposed, according to the operation regulations of the 600 MW supercritical condensing steam turbine in a power plant under the cold start-up scheme. The finite element method was used to analyze the temperature distribution and evolution of the steam turbine rotor. Based on the sample data of finite element method calculation, an integrated empirical-statistical modeling was initially proposed by algorithmic transformation, which was validated by numerical simulation results. Finally, the characteristics of the new empirical-statistical model were discussed in detail in comparison with the calculation results of the support vector machine algorithm.
2. Method
2.1. The Process Parameters of Start-Up
In the current study, the cold start-up process parameters of the steam turbine for the 600 MW sub-critical unit at a power plant were obtained from DCS (Distributed Control System), which is shown in Figure 1. For the cold start stage, the vacuum extraction of the steam turbine and the preheating of the steam-water separation system were not active, which was conducted with all auxiliary equipment for the steam turbine start. The steam temperature was increased from 103.74 °C to 535.26 °C within 25 h, which could be divided into 7 stages, as called S1, S2, S3, S4, S5, S6, and S7. The highest temperature change rate was in the S2 stage. The steam pressure was gradually increased from 1.55 MPa to 16.67 MPa after the ignition of the boiler. The turbine rotor started rolling after the ignition. Then the velocity of the turbine rotor sharply reached 863.5 r/min in 0.15 h. Finally, the velocity of the turbine rotor was 3000 r/min. The unit load was started after the turbine rotor reached 3000 r/min. Meanwhile, the temperature and pressure of steam were 375.51 °C and 6.58 MPa, respectively. At last, the unit load reached 600 MW with the temperature and pressure of steam increasing. During the cold start-up process, if the temperature rise rate was improved to shorten the start-up time, it would be beneficial for reducing fuel consumption and increasing the economy of the power plant. However, the temperature rise rate and pressure rise rate were positively related to thermal stress and low fatigue life of the turbine rotor, especially the high-pressure rotors, which was harmful for the service life of the unit [6]. Therefore, it was necessary to control the temperature rise rate and pressure rise rate during the start-up schedule optimization to improve the economic and safety of the unit.
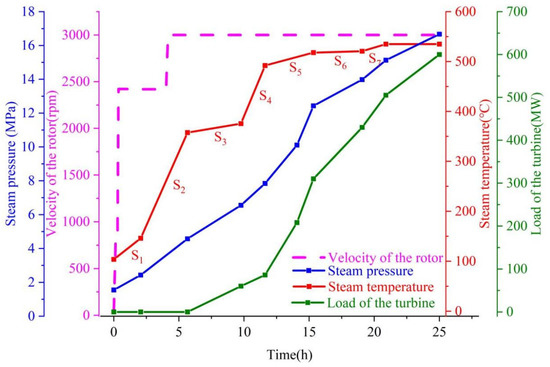
Figure 1.
The cold start-up curve of the turbine.
During the start-up scheduling of the steam turbine rotor, the maximum stress of some important part on the rotor was the objective of optimization, which was easily generated by stress concentration. During the start-up process, the position of the maximum stress on the steam turbine rotor may be changed with complex steam temperature and pressure variation. In the range of the allowable stress of rotor material, 5 candidate positions were selected as the monitoring points to guarantee coverage of the maximum stress [4]. The start-up schedule optimization could be formulated as a function with constraints by means of Equation (1) as follows [10]:
subject to and . Equation (1) presented the whole time of the start-up of a steam turbine rotor. Meanwhile, the maximum stress was less than the allowable stress of the steam turbine rotor, and the temperature of steam did not exceed the maximum allowable temperature rise rate . was stand for the temperature increment of steam in every start-up stage. was stand for the temperature rise rate of steam in every start-up stage. A and b were constants, which were subjected to A > 0 and b > 0.
2.2. Finite Element Analysis Configuration
2.2.1. Finite Element Model
During the cold start-up, a large temperature gradient and thermal stress were caused by the variation of main steam temperature and pressure over the rotor surface, which was mainly generated on the outer surface of the pressure steam turbine rotor [32,33]. As the structural characteristic of the steam turbine rotor was a rotating body structure, a 2-D axisymmetric model was built, as shown in Figure 2, which was beneficial for saving the cost of the calculation under the premise of meeting the calculation precision. The wheel grooves at all levels were simplified. The total number of elements and nodes was 64,306 and 66,310, respectively. The material of the steam turbine rotor was 30Cr1Mo1V steel, of which the material parameters were listed in Table 1 and Table 2 [34].

Figure 2.
The finite element model of the steam turbine rotor.

Table 1.
The physical parameters of 30Cr1Mo1V under different temperatures [34].

Table 2.
The mechanical parameters of 30Cr1Mo1V under different temperatures [34].
2.2.2. Boundary Condition
The low fatigue damage of the steam turbine rotor was caused by combining thermal stress and mechanical stress under the nonuniform temperature distribution, the centrifugal force and the main steam pressure. The configuration of the rotor’s realistic boundary condition was a key prerequisite for calculating the correct temperature and stress distribution. Therefore, the details of the boundary conditions were assumed. The first boundary condition of the steam turbine rotor’s outer surface was a given surface temperature. For example, the temperature at the front surface of the regulating stage was 103.74 °C. The bearing was 40 °C, and the sealing was 80 °C. Due to the smaller heat transfer coefficient between the left and right end faces of the steam turbine rotor and air, the boundary was set as heat insulation. The axis of the steam turbine rotor was defended by heat insulation conditions without an internal heat source. The outer surface of the steam turbine rotor was the steam temperature and heat transfer coefficient, which was regarded as the third kind of boundary conditions. The structure boundary conditions of the steam turbine rotor model were degree of freedom constraints and steam pressure, such as the center of the rotor restricting vertical movement, the left side of the rotor restricting lateral movement, and the outer surface of the steam turbine rotor loading steam pressure.
During the stage of impulse and initial load, the load of the steam turbine rotor was less than 80% of the rated load, which was hardly accurate when calculating the steam boundary condition by theory. Therefore, the small flow problem could be solved by the pressure and temperature coefficient. The heat transfer coefficient of the steam turbine rotor’s outer surface could be regarded as a function of time and space to define the temperature, pressure and flow of steam around [35]. The heat transfer coefficient of the steam turbine rotor was commonly calculated by the Westinghouse formula, Haqi-Nangong formula and ALSTHOM formula [36]. According to the thermal transfer characteristic of the steam turbine rotor, the heat transfer coefficient of the steam turbine rotor could be calculated as follows:
For both sides of the blade, is the Reynolds number. when , , Otherwise, . was the thermal conductivity coefficient of steam. , is the outer radius of the blade. is the steam kinematic viscosity. is the circumferential velocity in m/s at the outer radius of the blade. For the axis of the steam turbine rotor, , , is the axial radius of the rotor. is the circumferential velocity at the Shaft neck. For the steam seal, , , is the steam sealing clearance, m. was the average velocity of the steam through the steam sealing clearance, m/s. was the height of rotor surface to steam sealing ring, m. was the steam sealing distance, m.
3. Result
3.1. Temperature and Stress Analysis
The temperature and stress field of the steam turbine rotor are calculated during the cold start-up process under different stages. The final temperature distribution of the steam rotor is shown in Figure 3. Obviously, the temperature around the main steam inlet is the highest, while the temperature at the remote end gradually decreases. The maximum temperature of the steam turbine rotor is 534.64 °C. The maximum stress of the steam turbine rotor is detected at the regulating stage, which is located at the groove in front of the regulating stage and the first stage of the steam turbine rotor, as shown in Figure 4a. During the cold start-up process, the history-temperature and history-stress of the L1, L2, L3, L4, and L5, seen in Figure 4b, are shown in Figure 5 and Figure 6, respectively. Obviously, the maximum Von Mises stress of the whole cold start-up process is located in L2. The peak stress is 381.25 MPa, which is generated at 12.87 h. Meanwhile, the temperature is 490.4 °C. As the mechanical behavior of 30Cr1Mo1V is obviously cyclic softening under the strain-controlled load, the thermal stress of the steam turbine rotor is caused by the thermal expansion [34]. Therefore, the cyclic strain softening mechanism plays a necessary role rather than the monotonic constitutive relationship during the fatigue damage evaluation in the start-up process. In the current study, the cyclic softening stress-strain constitutive relationship of 30Cr1Mo1V can be expressed as follows:
where is regarded as the cyclic strength coefficient. is regarded as the cyclic strain softening exponent. The and values under different temperature is listed in Table 3. According to Equation (3) and Figure 6, the fatigue plastic strain value can be directly calculated by considering the cyclic stress softening constitutive relationship.
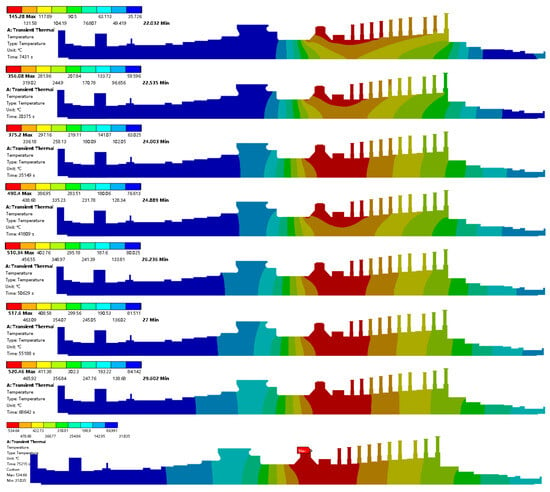
Figure 3.
The temperature distribution at different stages.
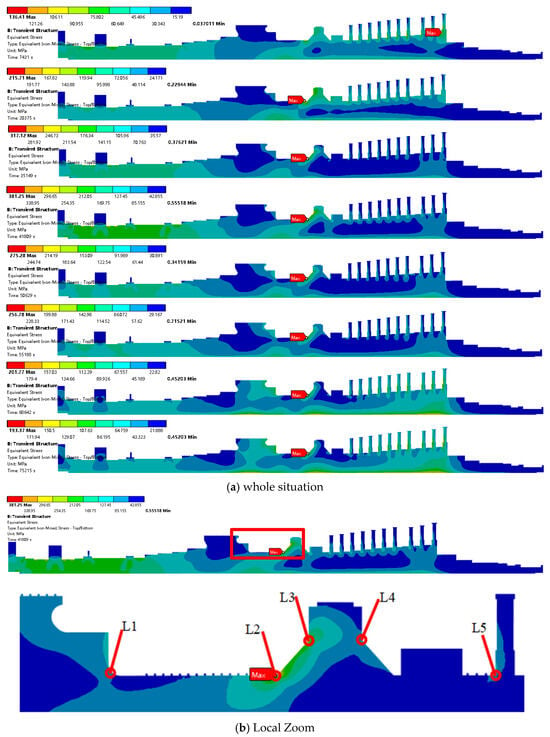
Figure 4.
The maximum stress distribution in different stages of the start stage.
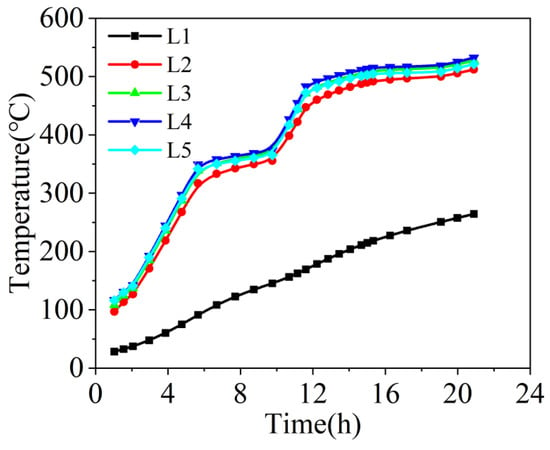
Figure 5.
Temperature evolution of different candidate points in different start stages.
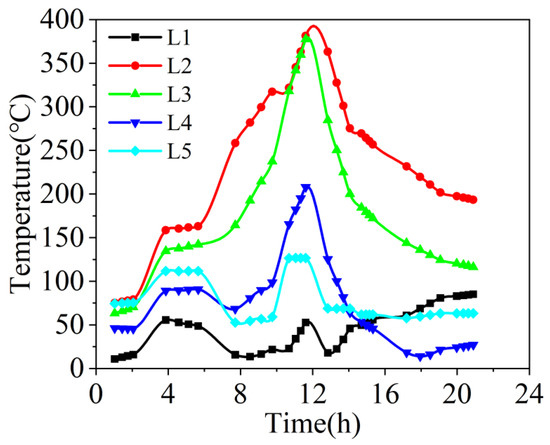
Figure 6.
Von Mises evolution of different candidate points in different start stages.

Table 3.
and values under different temperatures [4].
3.2. Low-Cycle Fatigue Calculation
During the cold start-up process, the low-cycle fatigue was an important factor describing the damage of the steam turbine rotor [37,38]. The peak stress corresponding to the temperature of the steam turbine rotor is 490.4 °C, which is smaller than 510 °C. Therefore, the cyclic stress-strain relation and the increment expression of damage under a multi-axial stress state of 30Cr1Mo1V is written as follows [34,37]:
Integrating Equation (5) can obtain Equation (6),
when the component fails, the damage amounts to 1, . Equation (5) can be modified as follows:
where is the plastic strain range. is the triaxial coefficient, which is calculated as follows:
where is the Poisson’s ratio. is the Von Mises stress. is the mean stress, and . According to the finite element method result of the steam turbine rotor and Equation (7), the low fatigue cycle value is 139.41, which is actually 139 for safety, as listed in Table 4. The relationship between fatigue damage and fatigue life of the steam turbine rotor is shown in Figure 7, which represents the number of starts and stops of the steam turbine rotor and the cumulative degree of damage each time.

Table 4.
Low fatigue cycle value and related parameters.
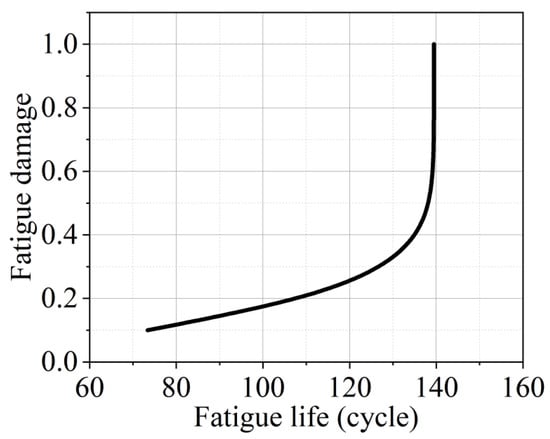
Figure 7.
The relationship between fatigue damage and fatigue life.
3.3. Creep Life Calculation
The creep damage model of 30Cr1Mo1V steel under 525 °C is expressed as follows [39]:
Integrating Equation (9) can obtain Equation (10),
where is the Von Mises stress. is the creep damage. is the time. is the triaxial coefficient, which is equal to Equation (5). When reaches the creep rupture time, the creep damage amounts to 1, . Equation (10) can be modified as follows:
According to the finite element method result of the steam turbine rotor and Equation (11), the low fatigue cycle value is , as listed in Table 5. The relationship between creep damage and creep life of the steam turbine rotor is shown in Figure 8.

Table 5.
Creep life and related parameters.
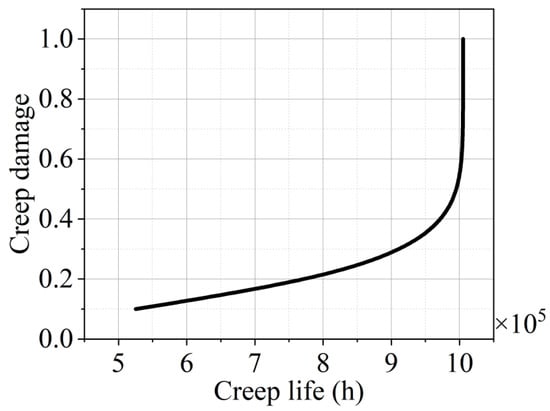
Figure 8.
The relationship between creep damage and creep life.
3.4. Creep-Fatigue Life Calculation
As the total damage of the steam turbine rotor is almost determined by not only low fatigue damage caused by start and stop schedule, but also creep damage caused by static load with high temperature under the stable operation stage. Continuum Damage Mechanics (CDM) is expressed by combining solid mechanics and applies damage theory to describe the evolution of microcracks and the formation of macrocracks in the failure parts, which is used to calculate the creep and fatigue of the steam turbine rotor according to the multi-axial stress and temperature simultaneously. Therefore, the linear CDM model is used to assess the creep-fatigue damage of the steam turbine rotor, of which 30Cr1Mo1V steel is expressed according to Equations (6) and (10), see Equation (12). The nonlinear CDM model of 30Cr1Mo1V steel under creep-fatigue interaction is expressed in Equation (13).
where , . Consequently, the final creep-fatigue life of the steam turbine rotor can be calculated by combining the cycle value of start-up and operation time. For example, the operation schedule of a power plant starts up 3 times per year and stably generates electricity for 150 days (a total of 3600 h) per year. The creep-fatigue damage and the fatigue life can be calculated by Equations (12) and (13), which are according to the cold start-up schedule and current operation procedure. The accumulated creep-fatigue damage is shown in Figure 9, which is calculated by the linear and nonlinear CDM model. The detailed result is listed in Table 6, which is calculated depending on the years. When the service year is 40 years, the result of the linear CDM model is 0.2724. However, the result of the nonlinear CDM model is 0.5408, which indicates that the nonlinear model is more conservative and takes into account the interaction between fatigue damage and creep damage [40].
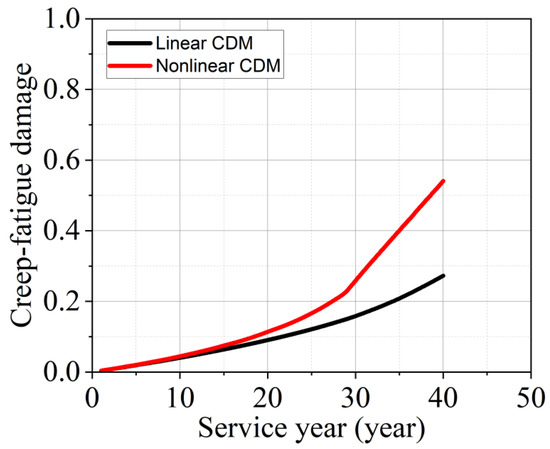
Figure 9.
The accumulated creep-fatigue damage by the CDM model.

Table 6.
The accumulated creep-fatigue damage after 30–160 service years under the current cold start-up schedule.
4. Distribution
4.1. Empirical-Statistical Model by Machine Learning Algorithm
In the thermal stress analysis of the steam turbine rotor during the start-up schedule, the rotor flow passage, inter-stage steam seal and the outer surface of the shaft seal are covered by the high-temperature steam. The thermal boundary is regarded as the third type of boundary conditions, which can be obtained proportionally under sliding pressure operation. The surface heat transfer convection coefficient is calculated by an empirical formula. The mechanical boundary conditions are based on the sensor data of the operating conditions and the constraints. The process of establishing the maximum stress reconstruction model is shown in Figure 10. According to Equation (1), the maximum stress is almost determined by the thermal change rate in different stages of the start-up process. The thermal change rate of stage 7 and the total time of stage-up are listed in Table 7, which is located in Figure 1. As there are multiple input feature variables, only one output feature variable. A machine learning algorithm is naturally resistant to over-fitting, which can automatically evaluate the importance of features and is insensitive to parameters. It is suitable for handling high-dimensional and nonlinear data (such as the relationship between steam turbine rotor temperature and thermal stress). In engineering, it can be used for thermal stress prediction, as well as for identifying key temperature measurement points or detecting abnormal operating conditions [2,41]. In order to provide more small sample databases for machine learning algorithms, the finite element calculation results under different start-up conditions are used as the database. The detailed conditions are listed in Table 8, which is generated randomly based on the historical start-up schedule. The random steam temperature of the start-up schedule is shown in Figure 11.
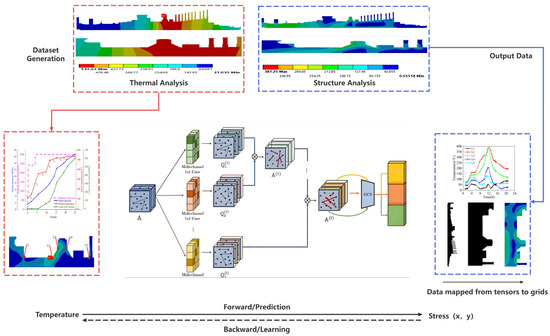
Figure 10.
Schematic design of the rotor maximum stress reconstruction model.

Table 7.
The thermal change rate parameters and corresponding maximum stress.

Table 8.
The thermal change rate parameters.
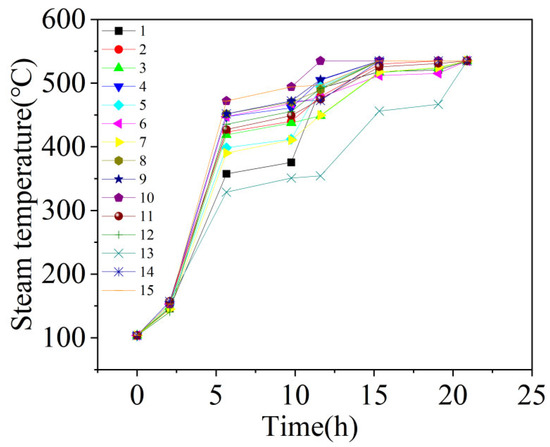
Figure 11.
The random steam temperature of the start-up schedule.
4.2. Training of the Empirical-Statistical Model
The maximum stress-based main steam temperature change rate for the steam turbine rotor is proposed and developed in the current research, as shown in Figure 12. During the empirical-statistical model training, the main steam temperature change rate is formed after obtaining the result under the previous state by a machine learning algorithm, which is regarded as ‘State’. The maximum stress is determined by the temperature change rate of the surface measurement point under the new state, which is regarded as ‘Action’. This temperature change rate is regarded as an input variable to the empirical-statistical model for calculating the maximum stress of the steam turbine rotor. The finite element computation results are validated against the machine learning outcomes, and upon confirmation of accuracy, which are designated as the ‘Reward’ for subsequent output. The service life of the steam turbine rotor is determined through cross-validation using both linear CMD and nonlinear CMD, with the maximum value obtained from these calculations serving as the definitive result (Figure 13).
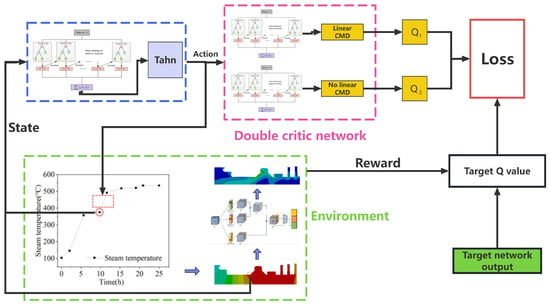
Figure 12.
Algorithmic framework for the empirical-statistical model.
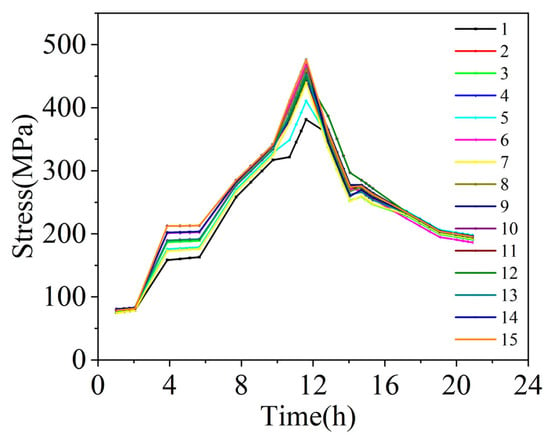
Figure 13.
History-stress of the steam turbine rotor measurement point.
4.2.1. Empirical-Statistical Model Based on SVR (Support Vector Regression)
SVR is a support vector machine for solving regression problems. Currently, SVR with a Gaussian Kernel is used to propose the empirical-statistical model between the steam temperature change rate and the maximum stress of the steam turbine rotor. As the penalty parameters, insensitive loss function and the width of the kernel parameters are regarded as important roles in learning accuracy and generalization ability for SVR, the parameter optimization is significant for the development of a high accuracy and stability of the regression model [42]. The training set and test set are selected from Table 8 and Table 9. The samples of the training set and test set are normalized to a range of [−1, 1], which is beneficial for avoiding the difference of magnitude between the index and improving the efficiency of the model. The SVR-linear and SVR-RBF prediction comparison and residuals are shown in Figure 14 and Figure 15, respectively. The R2 of the training set and test set are 0.9377 and 0.8081. Obviously, the predicted result of the regression model based on SVR is very close to the actual result, which illustrates that the proposed model is accurate.

Table 9.
The maximum stress (MS) under different start-up schedules.
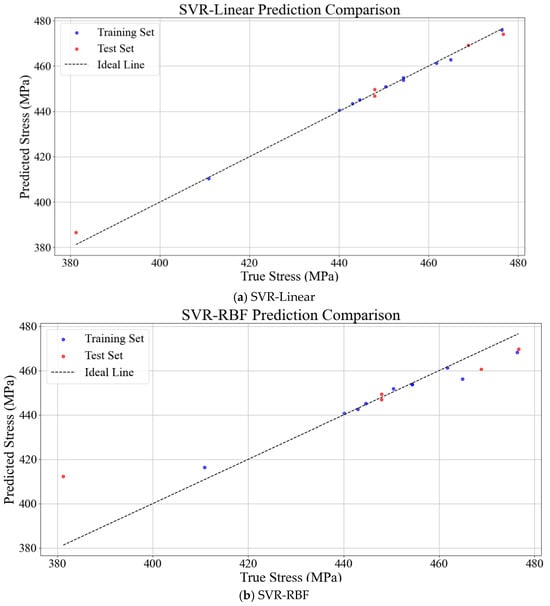
Figure 14.
SVR-linear and SVR-RBF prediction comparison.
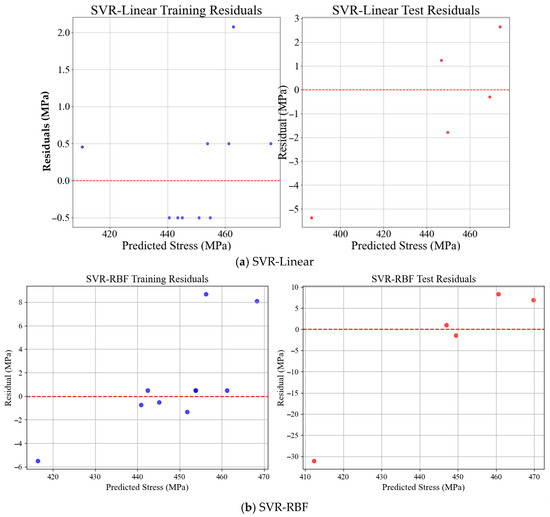
Figure 15.
SVR-linear and SVR-RBF residuals, blue dots is training residuals result, red dots is test residuals result, red line is the standard line.
4.2.2. Empirical-Statistical Model Based on LSTM (Long Short-Term Memory)
During the start-up process of the steam turbine rotor, the main steam temperature is continuously increased with time. LSTM is a type of recurrent neural network that can learn long-term dependencies, which is suitable for time series prediction. The thermal stress of the turbine rotor can be calculated using the temperature rise rate, and the LSTM method requires combining temperature dynamic change data and operating condition parameters to construct a time series prediction model [43]. Firstly, the temperature rise rate is obtained from Table 8, which is regarded as input of the LSTM network. The maximum stress is obtained from Table 9, which is regarded as the output layer regression of the LSTM network. During training, finite element simulation can be used as labels. The mean square error (MSE) loss function is selected. An early stopping mechanism is introduced to prevent overfitting. When deploying the model, the finite element simulation result should be received online, and the maximum stress is predicted using LSTM, combined with the warning threshold to achieve life management [44]. The maximum permissible damage value for the steam turbine rotor is indicated by a warning threshold. Therefore, the LSTM training loss and prediction comparison are shown in Figure 16 and Figure 17, respectively. The R2 of the training set and test set are 0.9647 and 0.8365. Obviously, the predicted result of the regression model based on LSTM is also very close to the actual result, which is better than that of SVR.
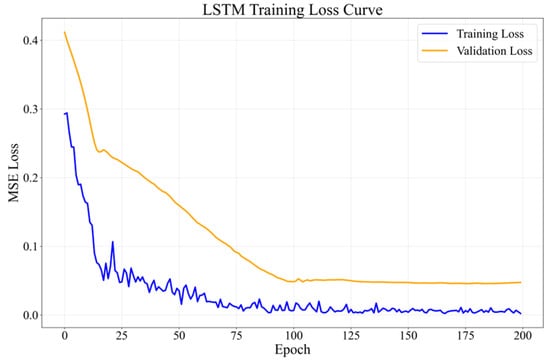
Figure 16.
LSTM training loss.
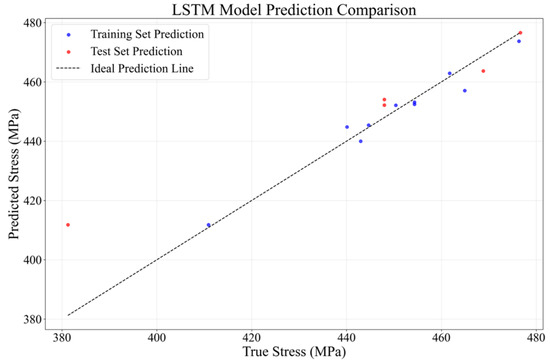
Figure 17.
LSTM prediction comparison.
4.2.3. Empirical-Statistical Model Based on RRM (Ridge Regression Method)
RRM is a linear regression with L2 regularization, which is beneficial for preventing overfitting and enhancing the generalization ability of the model [45]. To calculate the maximum stress of the turbine rotor using the temperature rise rate and employ the ridge regression method, the regression model needs to be constructed based on features such as the temperature rise rate. Firstly, the mapping relationship between maximum stress and temperature rise rate is established through finite element simulation, as listed in Table 8 and Table 9. The temperature rise rate is taken as the key input variable. A feature matrix is constructed by combining other influencing factors. The ridge regression (L2 regularization linear regression) is used to fit the maximum stress prediction model. Through cross-validation, the regularization parameter λ is optimized to balance the overfitting problem [46]. Finally, a rapid estimation of the rotor’s maximum stress based on real-time temperature change rate data is achieved, which is suitable for online monitoring and life assessment. The MSE of RRM training and prediction comparison is shown in Figure 18 and Figure 19, respectively. The R2 of the training set and test set are 0.999 and 0.996. Obviously, the predicted result of the regression model based on RRM is also very close to the actual result, which is the best machine learning algorithm rather than others. Therefore, the empirical-statistical model based on RRM is suitable for the current study.
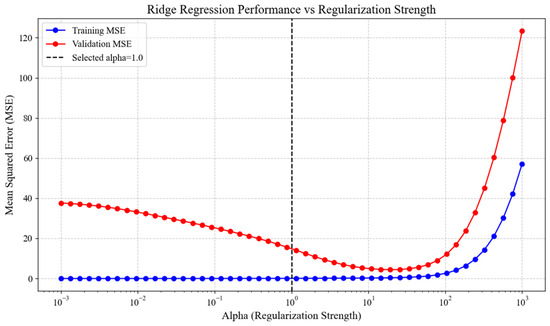
Figure 18.
MSE of RRM.
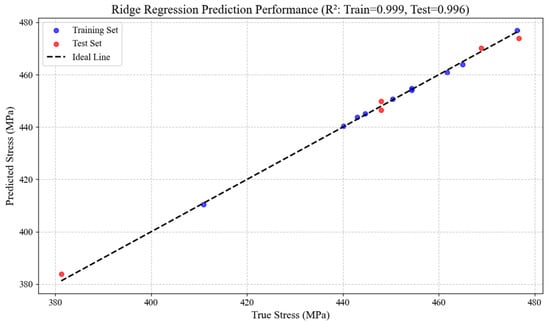
Figure 19.
RRM prediction comparison.
4.3. The Empirical-Statistical Model Establishment and Verification
According to the result of RRM, the empirical-statistical model can be expressed as follows:
where stands for the temperature rise rate of steam in every start-up stage. is the total time of the start-up schedule. In order to verify the accuracy and applicability of the proposed empirical-statistical model, a new finite element simulation is conducted according to random start-up parameters, as listed in Table 10. The results of the finite element simulation and empirical-statistical model are 381.03 MPa and 382.99 MPa, respectively, and the temperature change rate parameters are based on Table 10. The error between the finite element simulation and the empirical-statistical model is 0.51%. The stress of 4 Candidate points is shown in Figure 20, of which the location is shown in Figure 4b. Consequently, by combining Equations (4), (13) and (14), the creep-fatigue damage can be calculated, which directly predicts the life damage.

Table 10.
The random thermal change rate parameters.
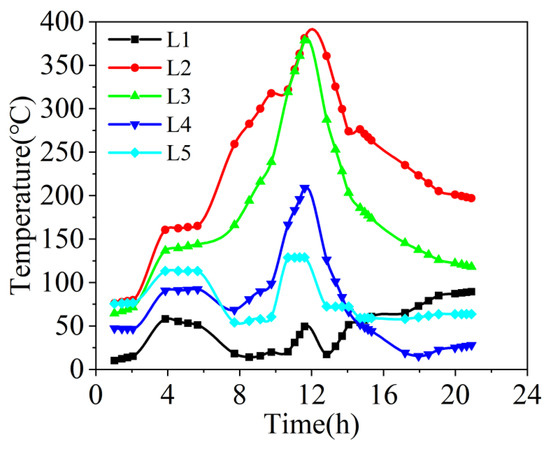
Figure 20.
Von Mises evolution of different candidate points under a random start-up schedule.
5. Conclusions
In order to improve the regulation capability of the steam turbine generator unit and the safety of the rotor during operation, an empirical-statistical model based on the thermal change rate and maximum stress of the steam turbine rotor is proposed in the current paper, which is trained by a machine learning algorithm and a finite element result database under different start-up schedules. The effect of the empirical-statistical model is verified by the finite element result. The empirical-statistical model based on SVR, LSTM and RRM, which is compared with each other by R2. The main conclusions are as follows:
- (1)
- The creep-fatigue damage of the steam turbine rotor is more recommended by using nonlinear CDM rather than linear CDM, which is safer for the unit operation.
- (2)
- The maximum stress of the steam turbine rotor can be calculated by the steam temperature change rate under different stages during the start-up schedule. The R2 of SVR, LSTM and RRM is 0.9377, 0.9647 and 0.999, respectively. RRM is suitable for the empirical-statistical model establishment of the steam turbine rotor.
- (3)
- By comparing the empirical-statistical model result and finite element result under random parameters of the start-up schedule, the error is 0.51%.
Based on the research in the current paper, the empirical-statistical model of the steam turbine rotor’s maximum stress plays a crucial role in the online life assessment system. By continuously monitoring the temperature rise rate, temperature gradient, and operating parameters, it establishes a rapid mapping relationship between thermal stress and operational variables. This model has the advantages of high computational efficiency and strong interpretability, which can replace complex finite element simulations to achieve stress prediction in seconds. The system uses the transient stress values output by the empirical-statistical model to dynamically assess the remaining life of the rotor.
Author Contributions
Conceptualization, W.L. and M.Y. (Mengmeng Yang); methodology, X.W.; software, Z.S.; validation, Y.L. and M.Y. (Mingze Yao); formal analysis, Z.X.; investigation, F.Z.; resources, F.Z. and B.L.; data curation, F.Z. and B.L.; writing—original draft preparation, W.L. and X.W.; writing—review and editing, M.Y. (Mengmeng Yang); visualization, Z.X. and M.Y. (Mingze Yao); supervision, W.L.; project administration, F.Z.; funding acquisition, F.Z. All authors have read and agreed to the published version of the manuscript.
Funding
This research was funded by [Postdoctoral General Project] grant number [2021M693862] and the APC was funded by [Feng Zhang].
Institutional Review Board Statement
Not applicable.
Informed Consent Statement
Informed consent was obtained from all subjects involved in the study.
Data Availability Statement
The data sets presented in this study are available within the article.
Conflicts of Interest
Author Baoguo L. was employed by the company PetroChina Jinxi Petrochemical Branch Company. The remaining authors declare that the research was conducted in the absence of any commercial or financial relationships that could be construed as a potential conflict of interest.
References
- Li, B.; Cao, Y.; He, T.; Si, F. Thermodynamic analysis and operation strategy optimization of coupled molten salt energy storage system for coal-fired power plant. Appl. Therm. Eng. 2024, 236, 121702. [Google Scholar] [CrossRef]
- Zhu, G.; Guo, D.; Li, J.; Xie, Y.; Zhang, D. Intelligent steam turbine start-up control based on deep reinforcement learning. Energy 2025, 320, 135335. [Google Scholar] [CrossRef]
- Rusin, A.; Nowak, G.; Łukowicz, H.; Kosman, W.; Chmielniak, T.; Kaczorowski, M. Selecting optimal conditions for the turbine warm and hot start-up. Energy 2021, 214, 118836. [Google Scholar] [CrossRef]
- Ji, D.-M.; Sun, J.-Q.; Sun, Q.; Guo, H.-C.; Ren, J.-X.; Zhu, Q.-J. Optimization of start-up scheduling and life assessment for a steam turbine. Energy 2018, 160, 19–32. [Google Scholar] [CrossRef]
- Badur, J.; Bryk, M. Accelerated start-up of the steam turbine by means of controlled cold team injection. Energy 2019, 173, 1242–1255. [Google Scholar] [CrossRef]
- Ji, D.-M.; Sun, J.-Q.; Dui, Y.; Ren, J.-X. The optimization of the start-up scheduling for a 320 MW steam turbine. Energy 2017, 125, 345–355. [Google Scholar] [CrossRef]
- Celik, Y.; Ma, L.; Ingham, D.; Pourkashanian, M. Aerodynamic investigation of the start-up process of H-type vertical axis wind turbines using CFD. J. Wind. Eng. Ind. Aerodyn. 2020, 204, 104252. [Google Scholar] [CrossRef]
- Matsumoto, H.; Eki, Y.; Nigawara, S. An operation support expert system based on on-line dynamics simulation and fuzzy reasoning for startup schedule optimization in fossil power plants. IEEET Energy Convers. 1993, 8, 674–680. [Google Scholar] [CrossRef]
- Matsumoto, H.; Ohsawa, Y. Startup optimization of a combined cycle power plant based on cooperative fuzzy reasoning. IEEET Energy Convers. 1997, 12, 51–59. [Google Scholar] [CrossRef]
- Kamiya, A.; Kawai, K.; Ono, I.; Kobayashi, S. Theoretical proof of edge search strategy applied power plant start-up scheduling. IEEE Trans. Syst. Man Cybern. Part B (Cybern.) 2002, 32, 316–331. [Google Scholar] [CrossRef] [PubMed]
- Shirakawa, M.; Kawai, K.; Arakawa, M.; Nakayama, H. Intelligent start-up schedule optimization system for a thermal power plant. IFAC Proc. Vol. 2006, 39, 189–194. [Google Scholar] [CrossRef]
- Belkhir, F.; Cabo, D.K.; Feigner, F.; Frey, G. Optimal startup control of a steam power plant using the JModelica platform. IFAC-Pap. 2015, 48, 204–209. [Google Scholar] [CrossRef]
- Hübel, M.; Meinke, S.; Andrén, M.T.; Wedding, C.; Nocke, J.; Gierow, C.; Hassel, E.; Funkquist, J. Modelling and simulation of a coal-fired power plant for start-up optimisation. Appl. Energy 2017, 208, 319–331. [Google Scholar] [CrossRef]
- Shirakawa, M.; Yun, Y.; Arakawa, M. Intelligent multi-objective model predictive control applied to steam turbine start-up. J. Adv. Mech. Des. Syst. 2018, 12, JAMDSM0007. [Google Scholar] [CrossRef]
- Zhao, B.; Liu, L.; Zhang, W. Optimization of cold end system of steam turbine. Front. Energy Power Eng. China 2008, 2, 348–353. [Google Scholar] [CrossRef]
- Abadi, S.N.R.; Ahmadpour, A.; Meyer, J. CFD-based shape optimization of steam turbine blade cascade in transonic two phase flows. Appl. Therm. Eng. 2017, 112, 1575–1589. [Google Scholar] [CrossRef]
- Nowak, G.; Rusin, A. Using the artificial neural network to control the steam turbine heating process. Appl. Therm. Eng. 2016, 108, 204–210. [Google Scholar] [CrossRef]
- Hamzaoui, Y.E.; Rodríguez, J.A.; Hernández, J.A.; Salazar, V. Optimization of operating conditions for steam turbine using an artificial neural network inverse. Appl. Therm. Eng. 2015, 75, 648–657. [Google Scholar] [CrossRef]
- Banaszkiewicz, M. The low-cycle fatigue life assessment method for online monitoring of steam turbine rotors. Int. J. Fatigue 2018, 113, 311–323. [Google Scholar] [CrossRef]
- Filippatos, A.; Langkamp, A.; Gude, M. Influence of gradual damage on the structural dynamic behaviour of composite rotors: Simulation assessment. Materials 2018, 11, 2453. [Google Scholar] [CrossRef]
- Nikolaeva, S.I.; Veselova, N.M.; Zelyakovsky, D.V.; Nekhoroshev, D.D.; Sekaev, V. The efficiency evaluation of the power plants turbines control to optimize the agro-industrial complex objects power supply. IOP Conf. Ser. Earth Environ. Sci. 2022, 1069, 012033. [Google Scholar] [CrossRef]
- Rzadkowski, R.; Lampart, P.; Kwapisz, L.; Szymaniak, M.; Drewczynski, M. Transient thermoelastic analysis of a steam turbine during its start-up from the cold state. Adv. Vib. Eng. 2011, 10, 35–39. [Google Scholar]
- Wang, W.; Zhang, H.; Liu, P.; Li, Z.; Ni, W.; Uechi, H.; Matsumura, T. A finite element method approach to the temperature distribution in the inner casing of a steam turbine in a combined cycle power plant. Appl. Therm. Eng. 2016, 105, 18–27. [Google Scholar] [CrossRef]
- Leyzerovich, A.S. Reduce stress with proper on-line rotor temperature monitoring. Power 2007, 25, 827. [Google Scholar] [CrossRef]
- Zhao, N.; Wang, W.; Zhang, J.; Liu, Y. Numerical investigation on life improvement of low-cycle fatigue for an ultra-supercritical steam turbine rotor. J. Mech. Sci. Technol. 2016, 30, 1747–1754. [Google Scholar] [CrossRef]
- Radin, Y.A.; Kontorovich, T.S.; Golov, P.V. Monitoring the thermal stress state in steam turbines. Power Technol. Eng. 2020, 53, 719–723. [Google Scholar] [CrossRef]
- Nayebi, A. Creep analysis of a thin tube and continuum damage mechanics application. Mech. Res. Commun. 2010, 37, 412–416. [Google Scholar] [CrossRef]
- Mayer, H. Fatigue damage of low amplitude cycles in low carbon steel. J. Mater. Sci. 2009, 44, 4919–4929. [Google Scholar] [CrossRef]
- Xu, X.; Ming, W.; Zhou, Y.; Wu, J. Unlock the flexibility of combined heat and power for frequency response by coordinative control with batteries. IEEE Trans. Ind. Inf. 2020, 17, 3209–3219. [Google Scholar] [CrossRef]
- Guo, D.; Liu, T.; Zhang, D.; Xie, Y. Fast reconstruction method of the stress field for the steam turbine rotor based on deep fully convolutional network. J. Eng. Gas. Turbines Power 2022, 144, 021023. [Google Scholar] [CrossRef]
- Zhang, F.; Sun, M.; Sun, B.; Zhang, F.; Bai, Y.; Liu, Z. Temperature Dependency on the Microscopic Mechanism in the Normal Direction of Wrought AZ31 Sheet under Dynamic Compressive Behavior. Materials 2021, 14, 7436. [Google Scholar] [CrossRef]
- Sehitoglu, H. Fatigue life prediction of notched members based on local strain and elastic-plastic fracture mechanics concepts. Eng. Fract. Mech. 1983, 18, 609–621. [Google Scholar] [CrossRef]
- Kosman, G.; Rusin, A. The influence of the start-ups and cyclic loads of steam turbines conducted according to European standards on the component’s life. Energy 2001, 26, 1083–1099. [Google Scholar] [CrossRef]
- Jing, J.; Meng, G.; Sun, Y. An effective continuum damage mechanics model for creep-fatigue life assessment of a steam turbine rotor. Int. J. Press. Vessel. Pip. 2003, 80, 389–396. [Google Scholar] [CrossRef]
- Adinarayana, N.; Sastri, V.M.K. Estimation of convective heat transfer coefficients in industrial steam turbines. J. Press. Vessel. Technol. 1996, 118, 247–250. [Google Scholar] [CrossRef]
- Yuan, L.J. Thermal Stress Calculation and Start-Up Optimize of Intermediate Pressure Cylinder Start of 300MW Steam Turbine. Doctoral Dissertation, Northeast Dianli University, Jilin, China, 2005. [Google Scholar]
- Li, Y.W.; Li, C.B.; Wang, M.Y.; Wang, Z.Q. Investigation on low-cycle performance of 30Cr1Mo1V rotor steel and damage evolution. Turbine Technol. 1998, 40, 184–187. [Google Scholar]
- He, J.; Chen, J.; Sun, Q. Effect of loading rate on low-cycle fatigue properties of turbine rotor steel. Procedia Mater. Sci. 2014, 3, 1773–1779. [Google Scholar] [CrossRef]
- Jing, J.; Guang, M.; Yi, S.; Xia, S.B. A continuum damage mechanics model on creep rupture life assessment of a steam turbine rotor. J. Eng. Gas. Turbines Power 2006, 128, 173–177. [Google Scholar] [CrossRef]
- Wang, W.; Buhl, P.; Klenk, A.; Liu, Y. Study of creep–fatigue behavior in a 1000 MW rotor using a unified viscoplastic constitutive model with damage. Int. J. Damage Mech. 2016, 25, 178–202. [Google Scholar] [CrossRef]
- Rusin, A.; Nowak, G.; Lipka, M. Practical algorithms for online thermal stress calculations and heating process control. J. Therm. Stress. 2014, 37, 1286–1301. [Google Scholar] [CrossRef]
- Min, J.H.; Lee, Y. Bankruptcy prediction using support vector machine with optimal choice of kernel function parameters. Expert. Syst. Appl. 2005, 28, 603–614. [Google Scholar] [CrossRef]
- Li, Z.; Shi, J.; Li, M.; Fan, S.; Yao, K.; Wan, J. Online monitoring and fault early warning prediction method for the operational status of steam turbine sliding pin systems. Meas. Sci. Technol. 2025, 36, 016220. [Google Scholar] [CrossRef]
- Martin, G.; Galih, B. Data Reduction and Reconstruction of Wind Turbine Wake Employing Data Driven Approaches. Energies 2022, 15, 3773. [Google Scholar] [CrossRef]
- Martin-Diaz, I.; Morinigo-Sotelo, D.; Duque-Perez, O.; Osornio-Rios, R.A.; Romero-Troncoso, R.J. Hybrid algorithmic approach oriented to incipient rotor fault diagnosis on induction motors. ISA Trans. 2018, 80, 427–438. [Google Scholar] [CrossRef] [PubMed]
- Lv, M.; Li, H. Nonlinear Chirp Component Decomposition: A method based on elastic network regression. IEEE Trans. Instrum. Meas. 2021, 99, 3515813. [Google Scholar] [CrossRef]
Disclaimer/Publisher’s Note: The statements, opinions and data contained in all publications are solely those of the individual author(s) and contributor(s) and not of MDPI and/or the editor(s). MDPI and/or the editor(s) disclaim responsibility for any injury to people or property resulting from any ideas, methods, instructions or products referred to in the content. |
© 2025 by the authors. Licensee MDPI, Basel, Switzerland. This article is an open access article distributed under the terms and conditions of the Creative Commons Attribution (CC BY) license (https://creativecommons.org/licenses/by/4.0/).
