1. Introduction
Automatic flower recognition plays an increasingly important role in modern agriculture, horticulture, and ecological monitoring. It enables large-scale surveys of plant biodiversity, facilitates accurate prediction of flowering periods for smart cultivation, and supports automated management systems, contributing significantly to precision agriculture and environmental conservation.
Luoyang peony flowers are renowned both domestically and internationally. In the cultural context, the blooming season of peonies each year attracts tourists from around the world to admire their beauty. However, recognizing and distinguishing the numerous peony varieties remain a challenge for both tourists and local residents. The traditional approach of placing informational signboards is rigid and inconvenient, and solely relying on staff explanations is insufficient to meet growing tourism demands.
From an agricultural perspective, products derived from different peony varieties have a broad economic market. Specifically, peony petals are widely utilized for extracting natural pigments and essential oils for use in foods, cosmetics, and fragrances; stamens and pistils serve as raw materials for health teas and functional nutraceuticals; flower buds are essential components in traditional medicinal preparations for promoting blood circulation and alleviating pain; and seeds are pressed into high-value peony seed oil rich in -linolenic acid, supporting applications in the functional food industry. These diverse uses make accurate classification of peony varieties not only culturally meaningful but also economically vital for guiding precise harvesting and ensuring product quality.
However, due to the diverse varieties of peony flowers in natural environments, their high similarity, and mutual occlusions, traditional object detection models often exhibit suboptimal performance on peony flower classification tasks. Moreover, conventional upsampling methods tend to cause loss of fine details, resulting in blurred boundaries and inaccurate structural reconstruction. Additionally, class imbalance leads to an excessive impact of low-quality samples on the model, while the contributions of high-quality samples are not fully leveraged.
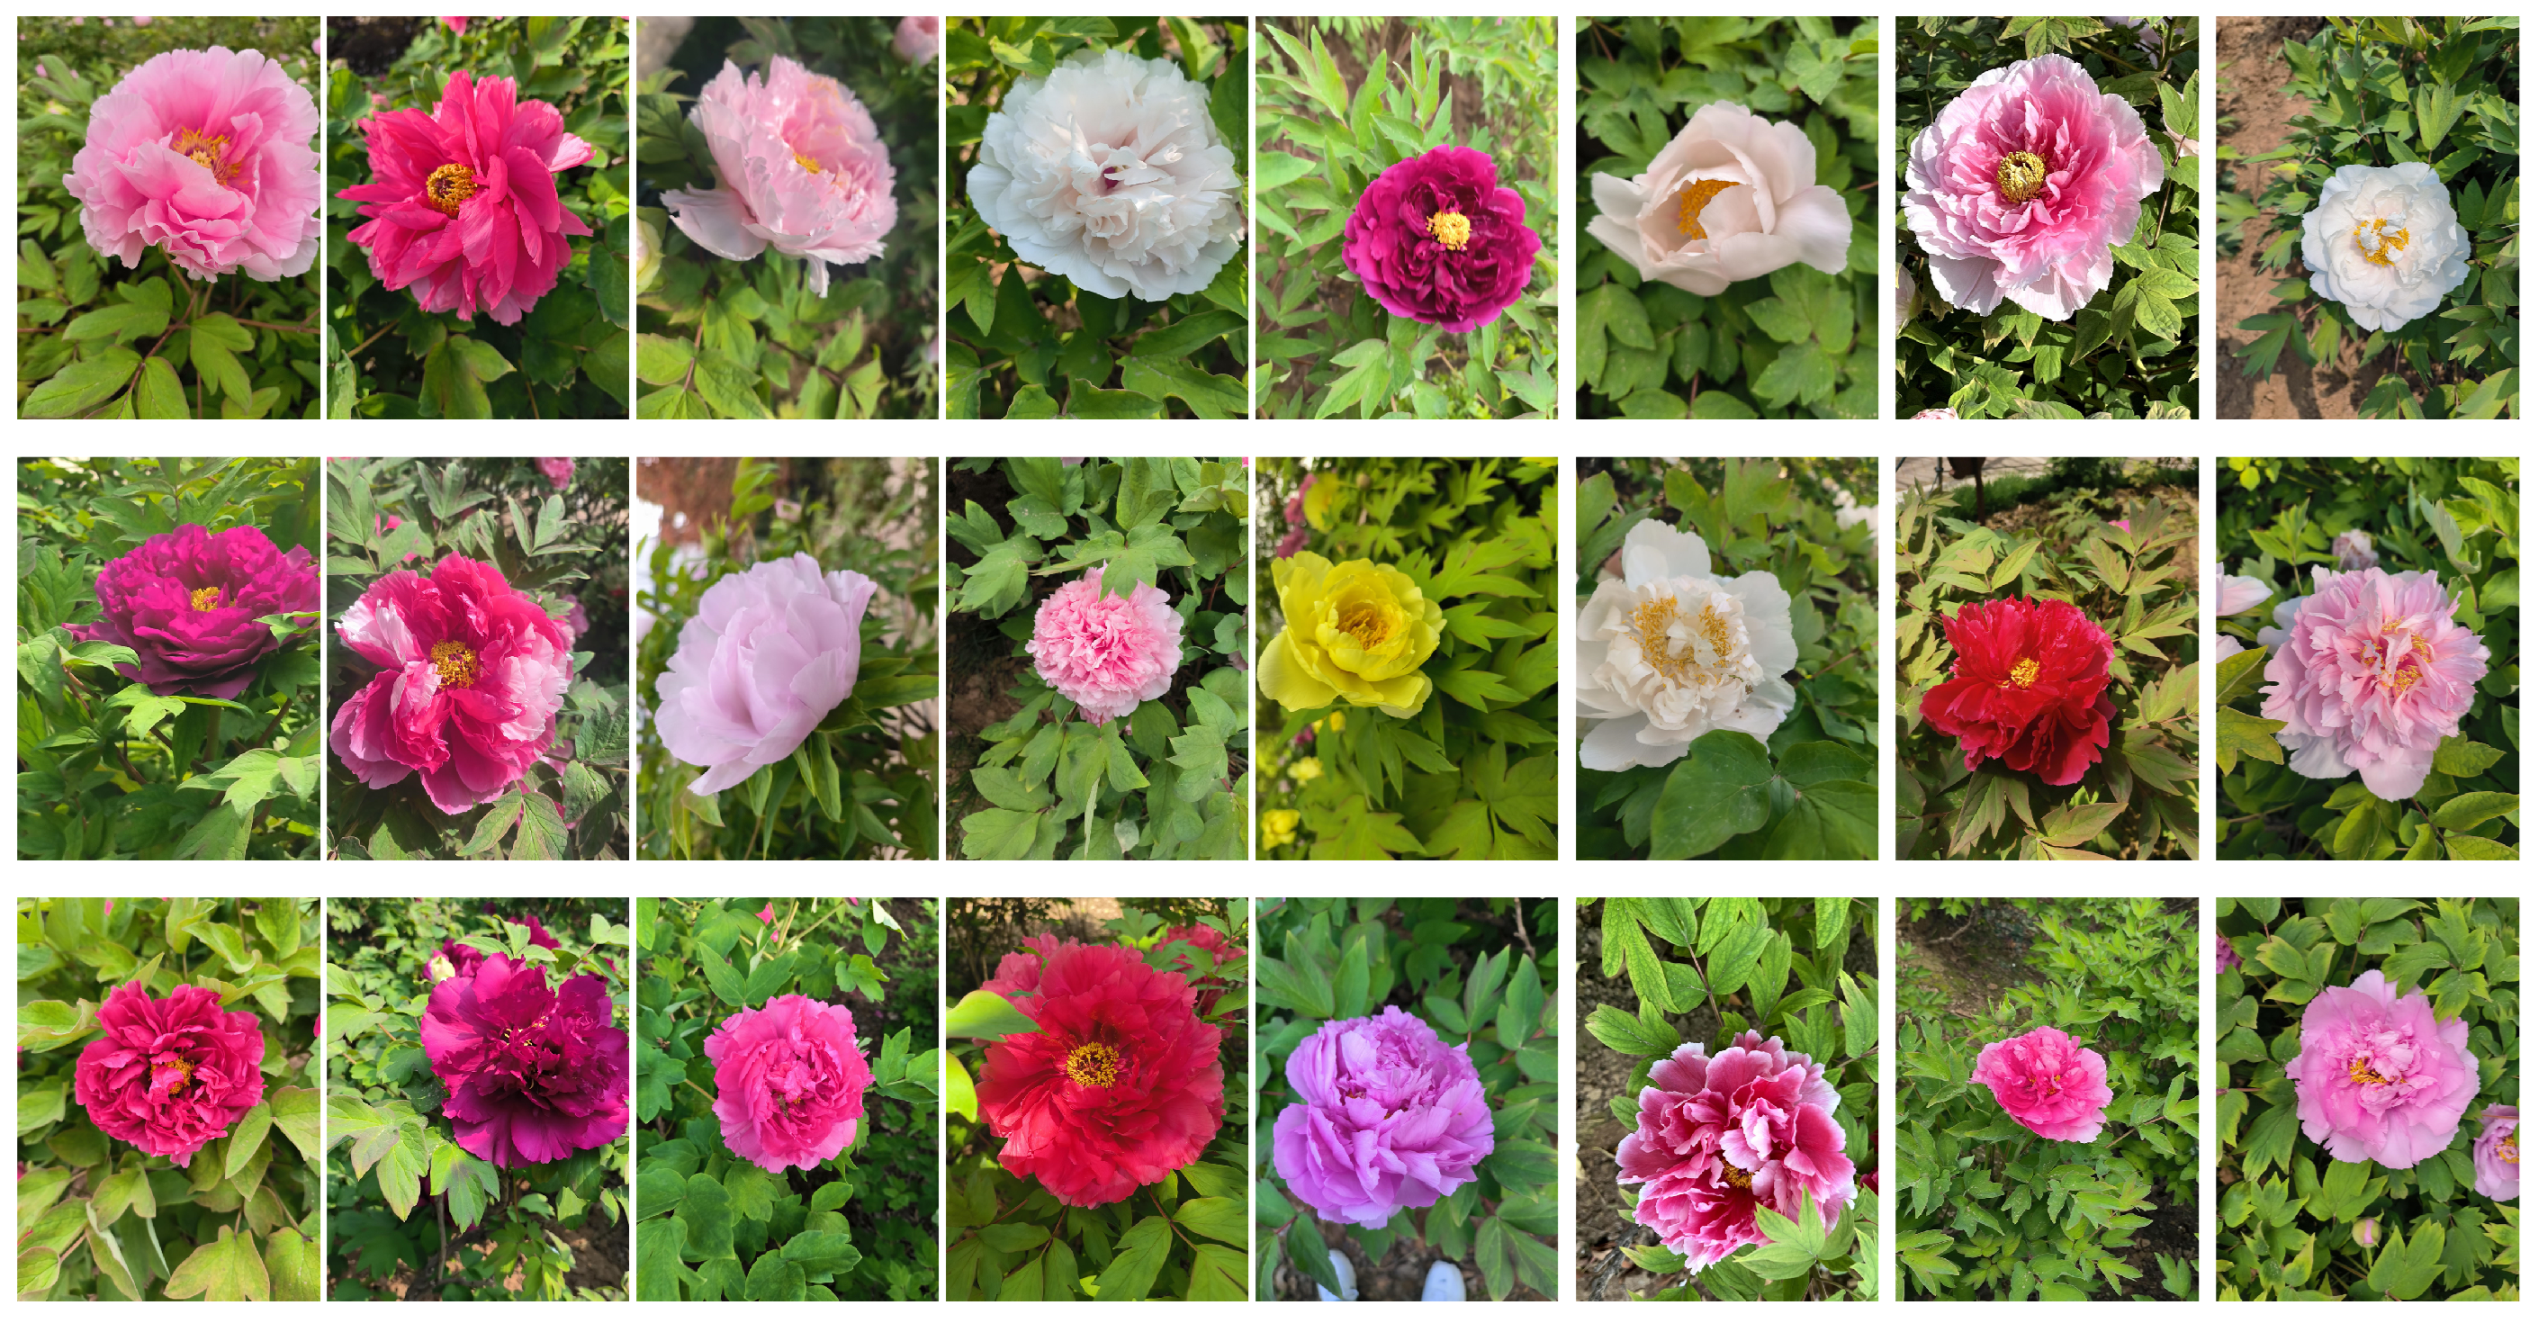
Examples of photographs depicting different peony flower varieties are shown in
Figure 1.
In recent years, with the maturation of computer vision object detection technology, numerous applications have emerged across different fields, significantly improving recognition performance compared to traditional methods. In agriculture, Kerkech et al. proposed a novel deep learning architecture called VddNet (Vitis Disease Detection Network) for detecting and identifying diseases and pests in grape cultivation [
1]. Afzaal et al. combined deep learning with machine vision for real-time identification of wilting diseases in early-stage potato growth [
2]. Yan Bin et al. applied You Only Look Once v5 (YOLOv5) to apple object recognition, enhancing accuracy and enabling lightweight deployment on apple-picking robots [
3]. Fromm et al. used neural networks to identify conifer seedlings from drone images [
4]. Zhao Jianqing et al. improved YOLOv5 for wheat spike detection in UAV images, particularly enhancing small target detection and reducing mislabeling [
5].
In the context of flower detection and classification, Li et al. developed a strawberry flower detection system using Faster R-CNN, achieving high detection rates even under occlusion and shadow, which is critical for yield estimation and automated harvesting [
6]. Li et al. proposed a YOLOv5l-based approach for multi-class detection of kiwifruit flowers, incorporating Euclidean distance to identify flower distributions within orchards, reaching a total mAP of 93.30% [
7]. Tian et al. introduced SSD deep learning techniques for flower detection and recognition in video streams, showing significant improvements in detection speed and accuracy over traditional methods [
8]. Similarly, Ming Tian and Zhihao Liao proposed a YOLOv5-based framework for fine-grained flower image classification, employing DIoU_NMS to enhance detection of overlapping and occluded flowers, achieving a mAP of 0.959 on their dataset [
9].
Although deep-learning-based flower detection has achieved remarkable progress across various agricultural scenarios, research specifically focusing on multi-variety peony flower detection under natural, cluttered field conditions remains scarce. Peony flower variety detection faces multiple challenges, including incomplete datasets, severe occlusion, loss of structural details during model training, and imbalanced distributions of high- and low-quality samples. To fill this gap and address these difficulties, this paper proposes an improved YOLOv5 model, named BCP-YOLOv5, which introduces several enhancements over the traditional YOLOv5 framework to significantly boost the recognition performance for peony flower detection. The main contributions of this study can be summarized as follows:
- (1)
We introduce target detection technology for peony flower recognition for the first time. Due to the vast variety of peony species and the lack of existing datasets, we constructed a dataset of 8626 images covering 36 common peony varieties, thus filling a research gap.
- (2)
To address occlusion between peony flowers and leaves in natural environments, we integrated a Visual Transformer with Dual-Path Attention (Biformer) [
10] into YOLOv5, enhancing attention to target regions and improving detection accuracy and mAP.
- (3)
To improve the model’s receptive field during upsampling, we replaced the original upsampling module with the Content-Aware Reassembly of Features (CARAFE) [
11]. This approach improves performance with minimal extra computation. Comparative experiments were conducted to optimize its parameters.
- (4)
Inspired by the Focal-EIoU concept, we propose a novel loss function, Focal-CIoU [
12], and compare it with Focal-DIoU and Focal-GIoU in extensive experiments.
2. Methodology
2.1. Dataset Collection
This study focuses on the identification of various peony flower species collected from the Luoyang Peony Garden and the Peony Garden at Henan University of Science and Technology. Images were captured under diverse environmental conditions, including cloudy and sunny weather, at different times of day such as morning, noon, and afternoon. The photographs were taken using a Redmi K50 Pro smartphone at distances ranging from 0.3 to 1 m and from multiple angles.
A total of 8628 original images were collected, covering 36 commonly cultivated peony flower varieties. These images include challenging scenarios such as partial occlusion by leaves, overlapping petals, and varying lighting angles. The images were stored in JPG format with a resolution of 4000 × 3000 pixels.
Annotation was performed using the LabelMe tool with a bounding-box-based labeling strategy. To ensure consistency and accuracy, domain experts were consulted to establish standardized annotation guidelines. Special attention was given to difficult labeling scenarios involving small targets, occlusion, and overlapping flowers, resulting in a high-quality annotated dataset.
2.2. Dataset Construction
Since the YOLOv5 model requires a large number of high-quality images for effective training, data augmentation was applied to enrich the dataset and improve model generalization. Specifically, we initially selected 1000 images covering all different peony flower varieties in our study. Each of these images was then subjected to 14 distinct augmentation techniques using Python and OpenCV, including rotations of 90° and 180°, horizontal and vertical mirror flips, brightness within
, and addition of salt-and-pepper noise and Gaussian noise with a maximum intensity of 0.02 (
Figure 2).
This procedure generated 14 new variations for each original image, resulting in an expanded subset of 15,000 images. By ensuring that all flower categories were uniformly represented in the initial 1000 images and applying identical augmentation methods to each, we maintained a balanced distribution of samples across different classes in the augmented dataset.
To prevent overfitting, we randomly selected 1372 samples from the augmented data and combined them with the original 8628 samples. The final dataset was then split into training, validation, and testing sets as shown in
Table 1.
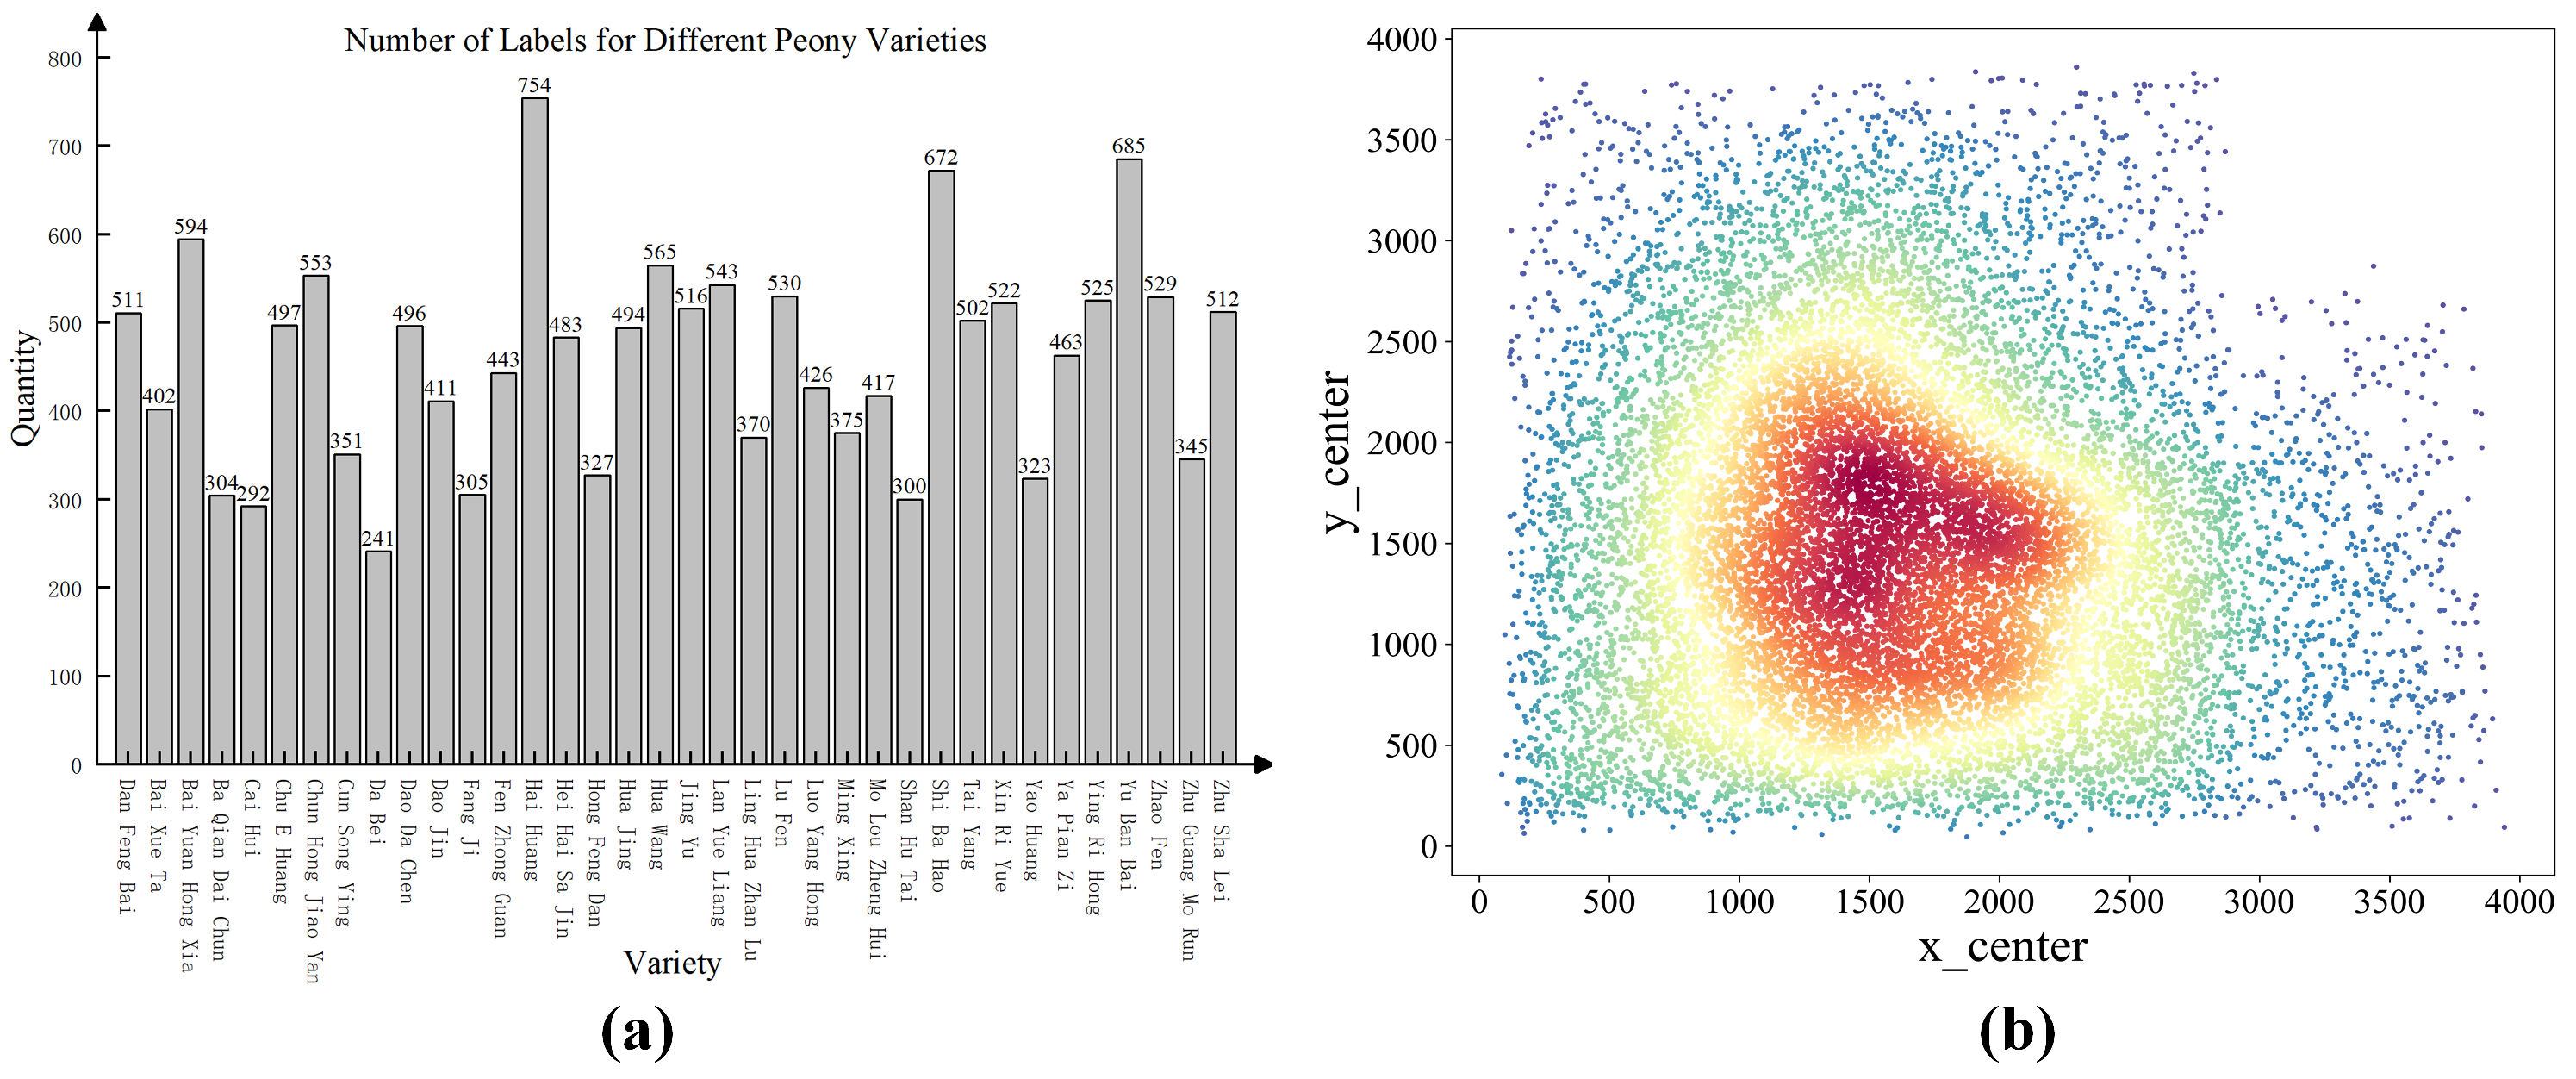
To better understand the distribution of annotation labels across peony flower categories, statistical visualization was performed.
Figure 3a shows that the label count for each flower type is relatively balanced, supporting stable model training.
Figure 3b indicates that most annotated objects are centered within the images.
2.3. YOLOv5 Network Architecture
In the field of object detection, two mainstream model families are Fast R-CNN [
13] and the YOLO series [
14,
15,
16,
17]. While Fast R-CNN offers slightly higher accuracy, it is computationally intensive and unsuitable for real-time tasks. YOLO, by contrast, is optimized for speed and suitable for real-time applications.
Traditional two-stage detectors perform region proposal and classification separately. In contrast, YOLO models unify object localization and classification into a single stage by dividing the image into grids and directly predicting bounding boxes and class probabilities. This design greatly enhances processing speed while maintaining competitive accuracy.
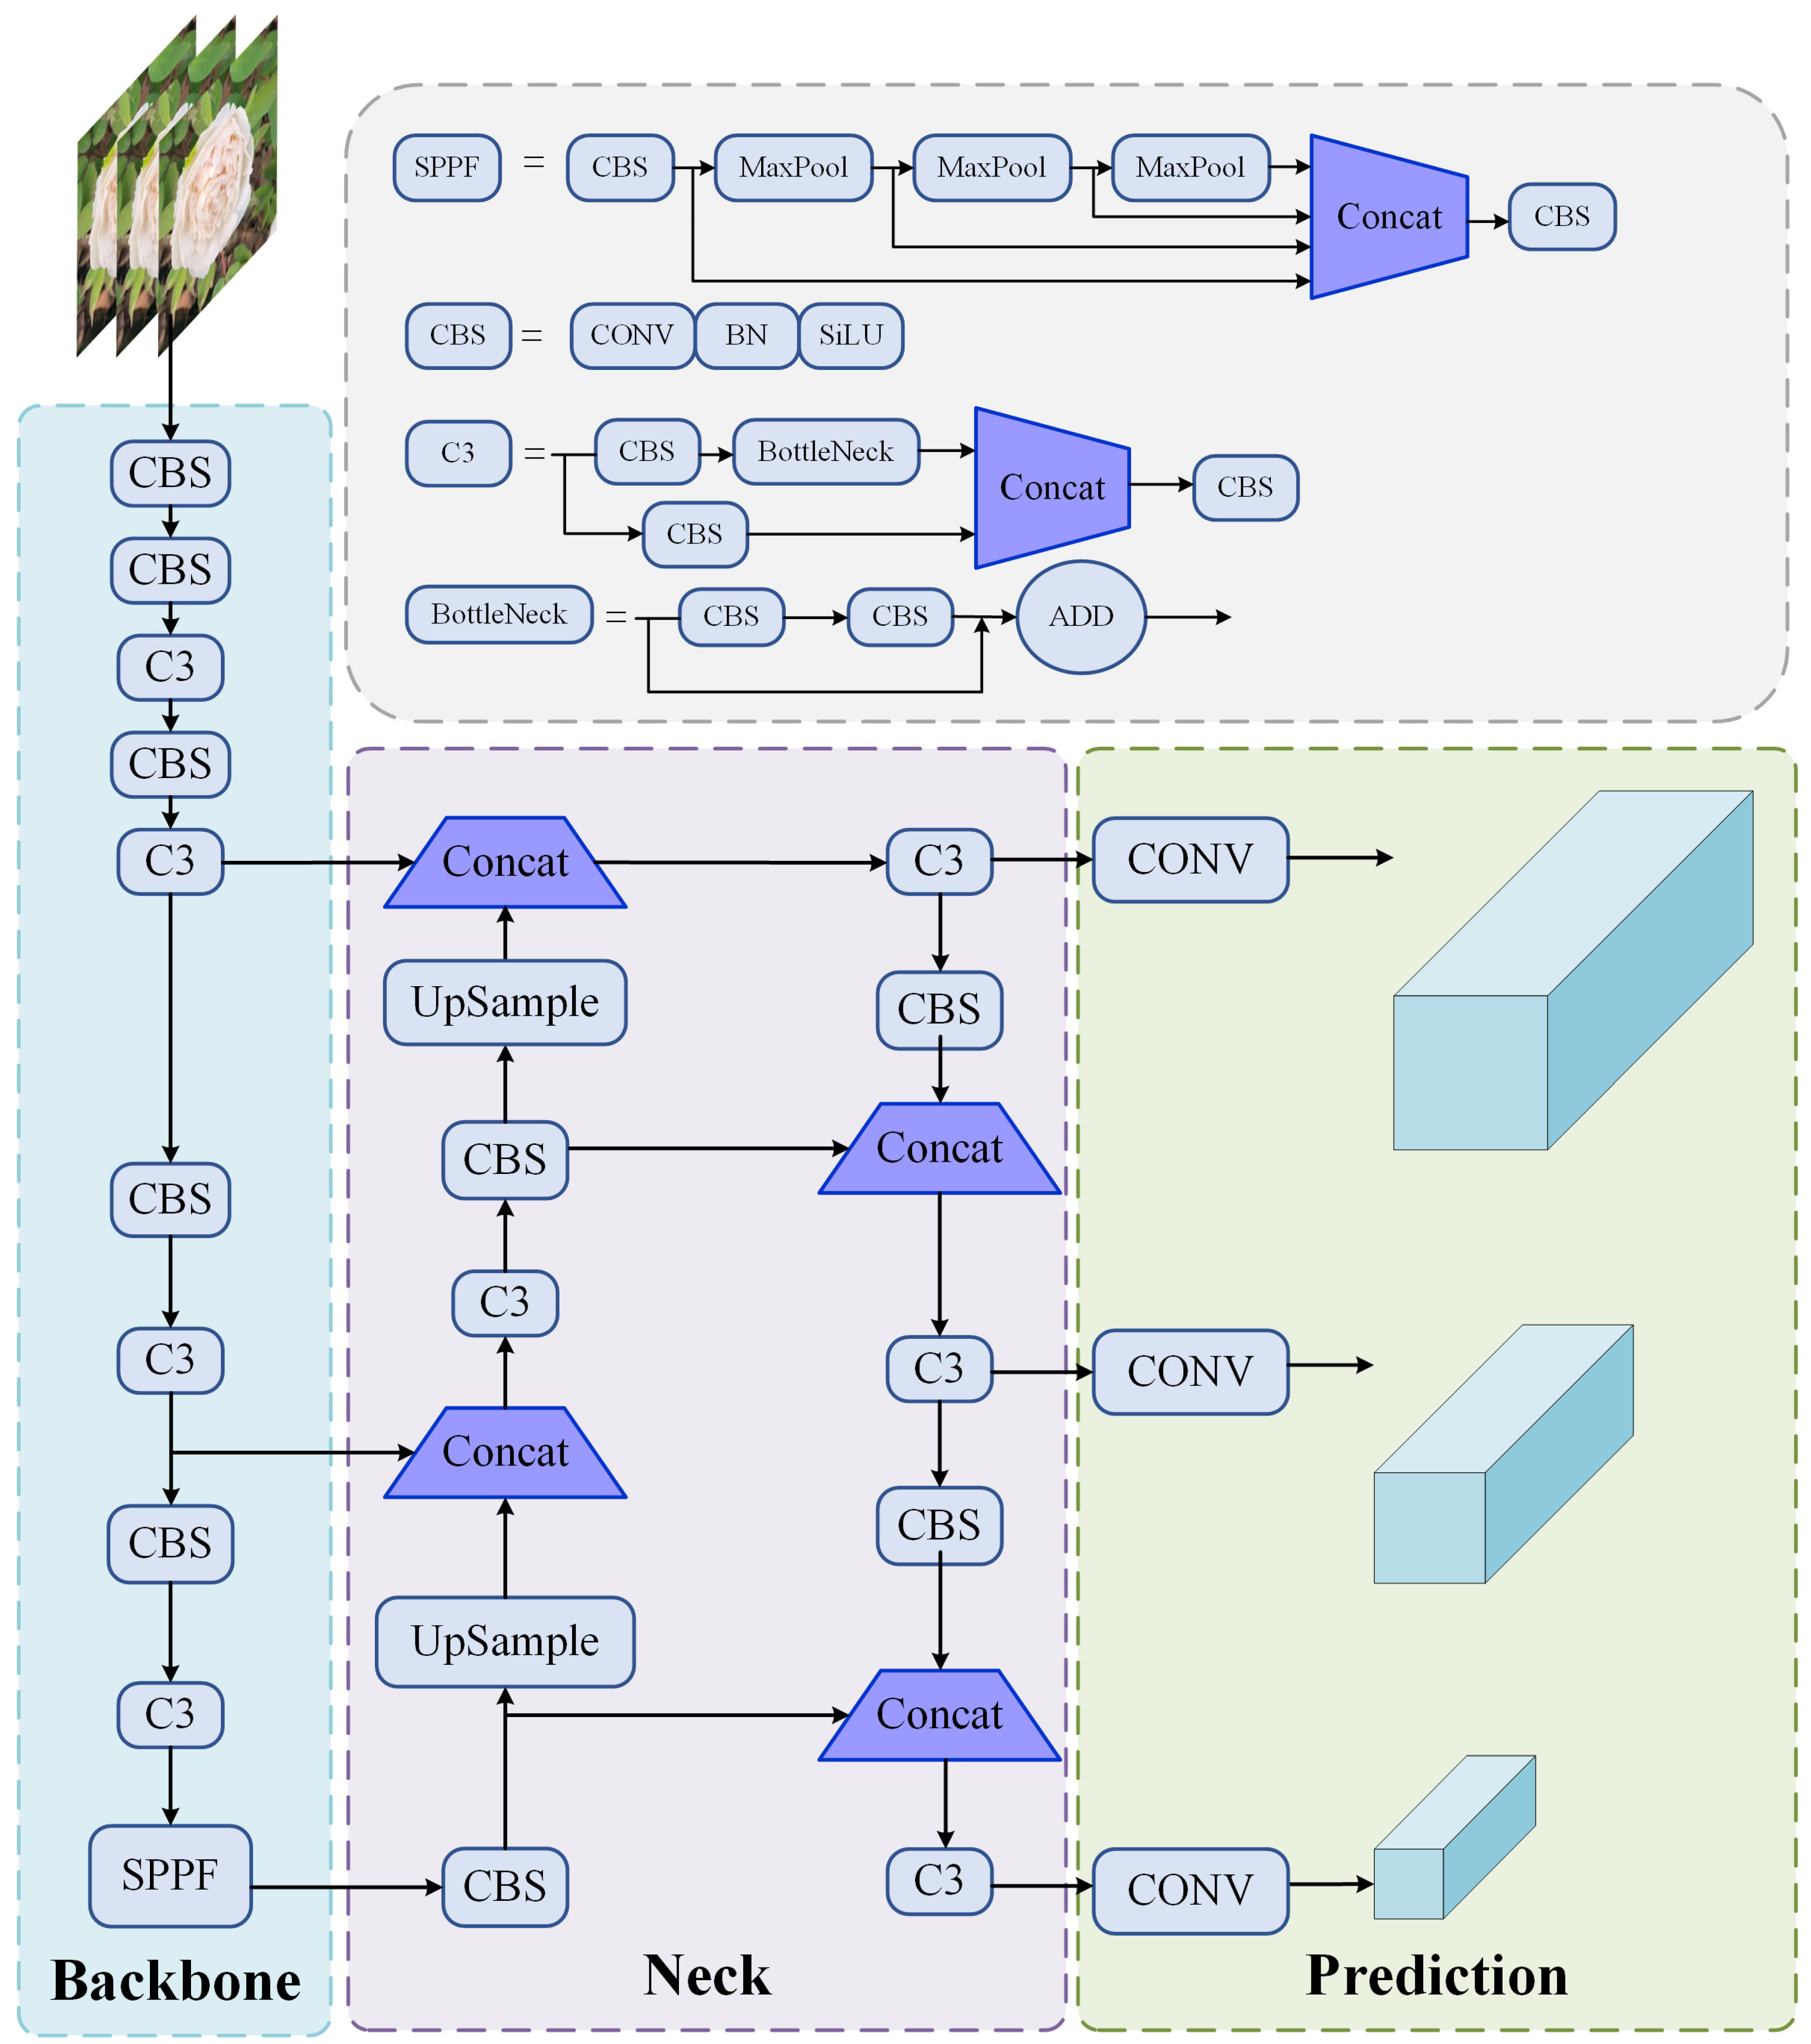
YOLOv5 adopts an end-to-end training strategy that improves system optimization, robustness, and detection performance. Its architecture, illustrated in
Figure 4, comprises several core components:
Backbone: Typically CSPDarknet53 [
18] or EfficientNet [
19], used for extracting semantic features from input images.
Neck: PANet [
20] is adopted to fuse features at multiple scales, enhancing detection of objects with varying sizes.
Head: The head module predicts bounding boxes and class labels using multi-scale convolutional layers and multilayer perceptrons (MLPs).
Anchor Boxes: Predefined anchor boxes with varied scales and aspect ratios are used to facilitate accurate localization.
Loss Function: YOLOv5 employs a composite loss function integrating classification, localization, and objectness confidence, enabling the model to learn accurate predictions effectively.
3. BCP-YOLOv5
The structure of BCP-YOLOv5, proposed by the researchers, is illustrated in
Figure 5. The original YOLOv5 architecture has been modified to enhance its recognition capability for peony flowers.
3.1. Introduction of Biformer
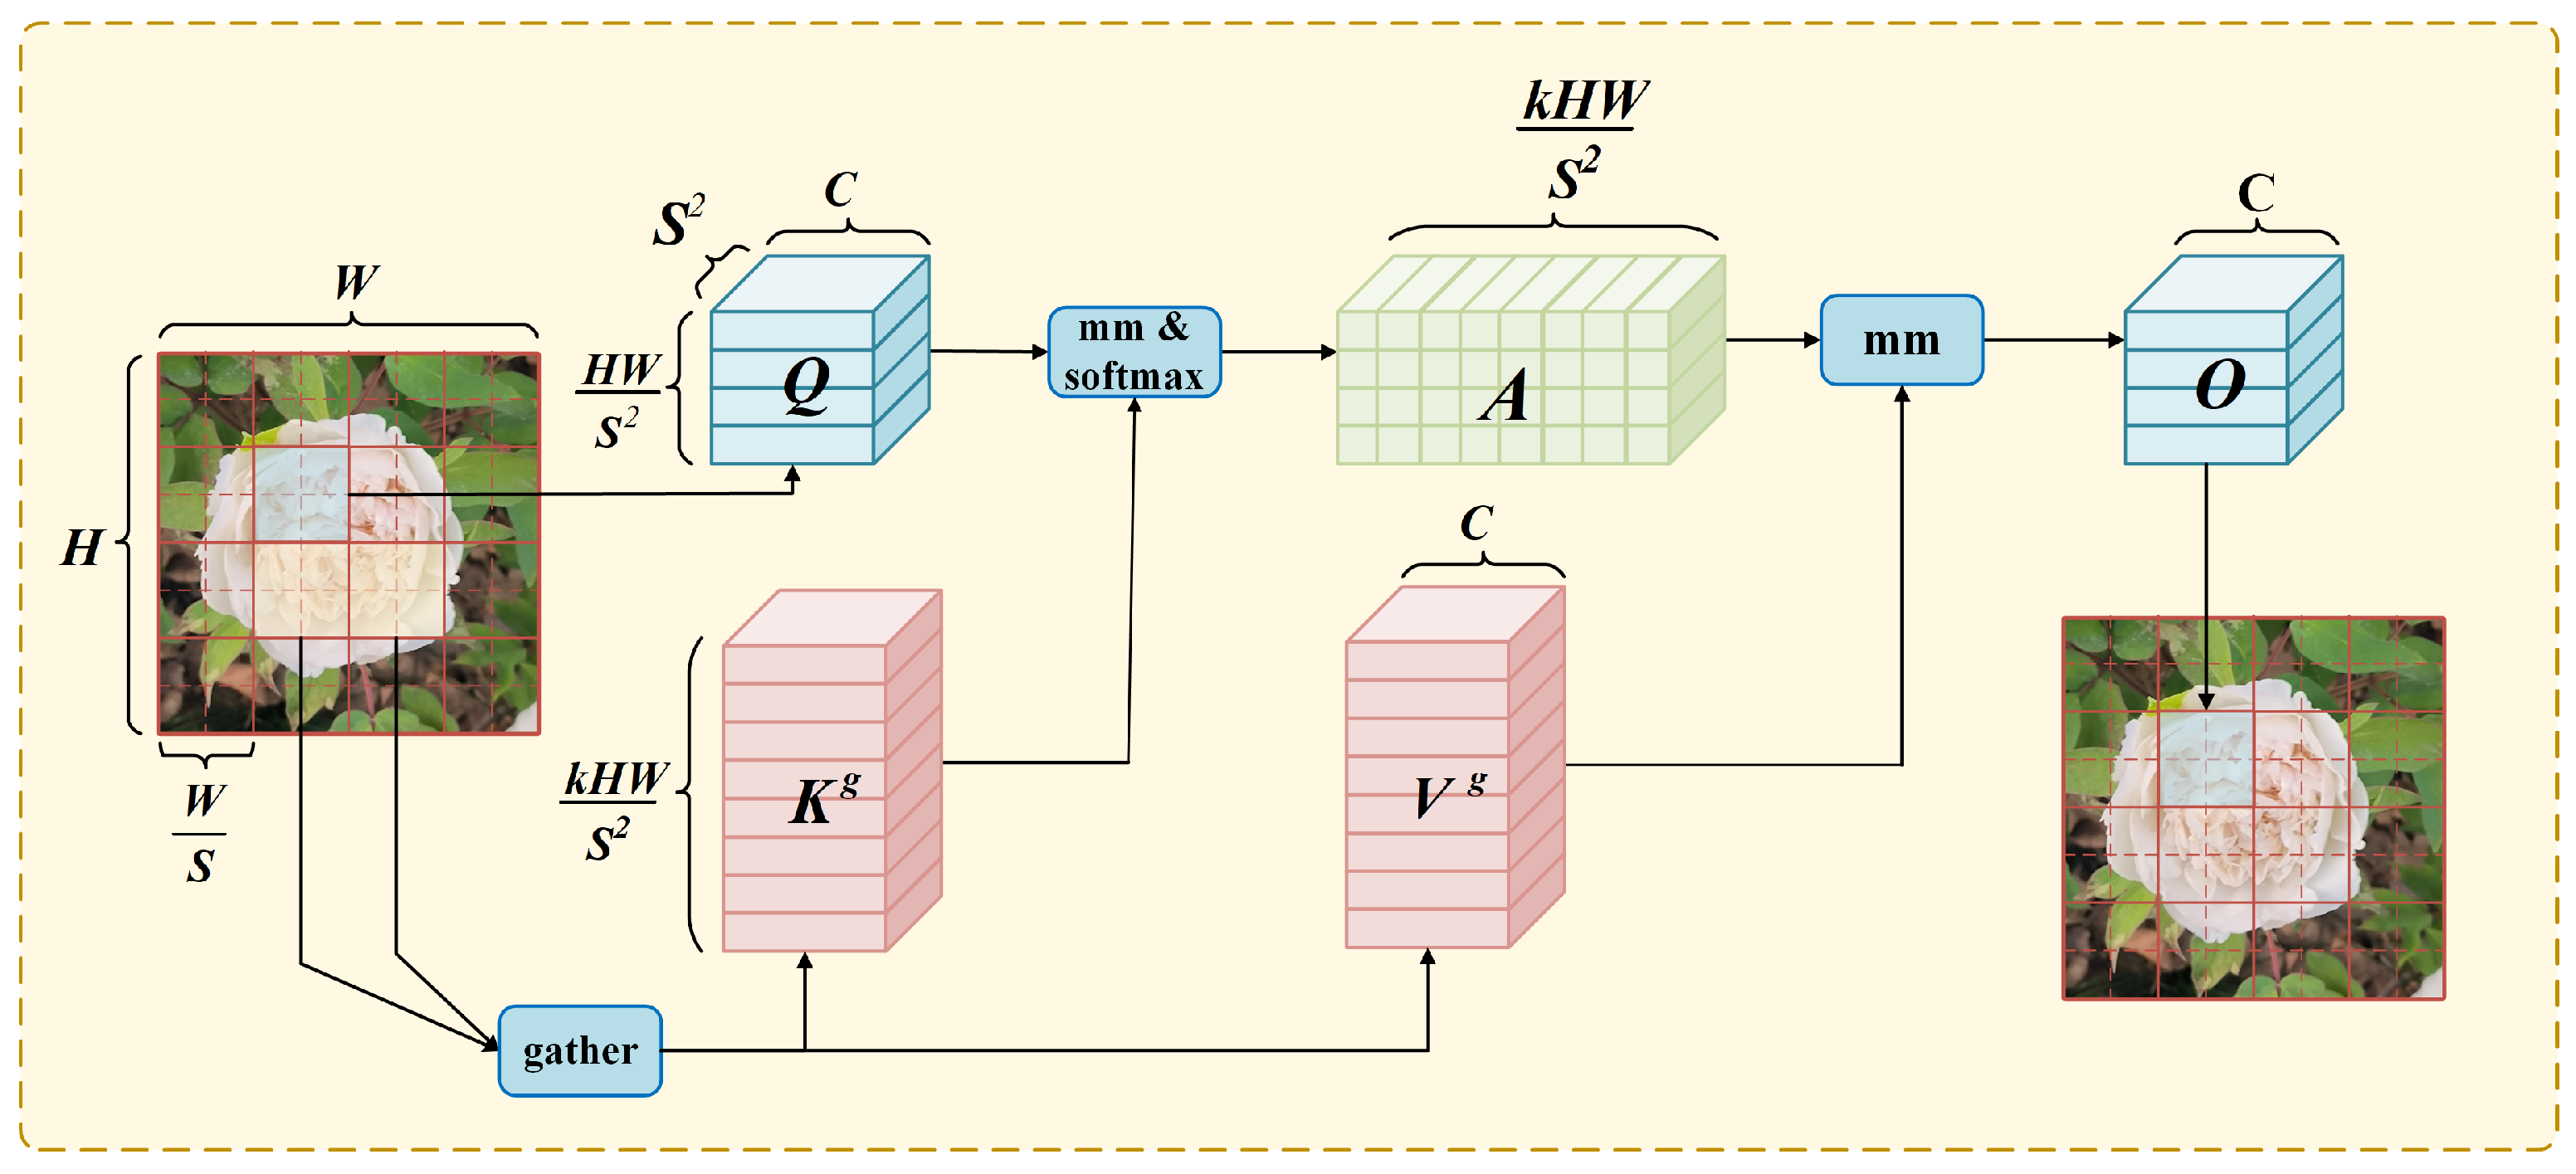
The advantage of the Transformer resides in its capacity to capture long-range contextual dependencies using a self-attention mechanism. However, in the original design of the Transformer architecture, this structure introduces some issues, namely, high memory consumption and computational cost. To improve the recognition performance of the YOLOv5 model for peony flowers while circumventing the computational burden and high memory consumption of global attention calculation, an optimization termed Biformer is introduced in this experiment. Biformer filters out a large portion of irrelevant key-value pairs in the rough region of the peony flower feature map, retaining solely a small fraction of important routing regions. It performs token-to-token attention only on the remaining candidate regions, which is the union of all routed regions. By introducing content-awareness and dynamic sparsity, the Biformer module achieves a more flexible allocation of computational resources. The core structure of the Biformer, referred to as BRA, is displayed in
Figure 6.
In the figure, for each subregion, k, the most relevant neighbors are selected for the attention calculation. The input feature map is sliced into subregions, resulting in an output shape of , where each subregion is represented as a vector, totaling subregions.
The input feature map with resolution is divided into .
Linear projections are employed on the vectors of each subregion to acquire the query, key, and value. The query and key vectors of each subregion are averaged independently, resulting in an
vector. This vector can be regarded as the “representation” of each subregion and is utilized to compute the correlation with other subregions. The adjacency matrix is computed to ascertain the correlation between subregions. The index matrix derived from this correlation is employed to retrieve the corresponding
k neighbors from the key and value vectors, resulting in
and
as depicted in
Figure 6.
The attention matrix A is computed between Q and , normalized using softmax, and subsequently multiplied by to obtain the output. Finally, the output is restored to the original resolution of the input feature map. This process corresponds to performing attention calculation for each subregion.
The Biformer, with BRA at its core, utilizes depth-wise separable convolutions in the local receptive field module to execute convolution operations on the input features, extracting local information as depicted in
Figure 7. The convolution results are then employed in attention calculation with the input features to obtain weighted local information. In the global receptive field module, multi-head attention is applied to the input features to extract global information. Average pooling is utilized to pool the attention results within each patch, obtaining global information. The local information and global information are subsequently fused to acquire the final features. This approach enhances the accuracy of peony flower detection without increasing computational cost.
The feature map processed by the Biformer module in this experiment does not alter the size of the feature map, making it convenient to integrate into the model employed in this experiment.
3.2. CARAFE Upsampling Improves Feature Fusion Performance
The upsampling method employed in YOLOv5s is nearest neighbor interpolation. This algorithm assigns the grayscale value of the nearest neighboring pixel to the pixel being interpolated among the four neighboring pixels. Although this algorithm is simple and computationally efficient, it may result in discontinuities in the grayscale values of the interpolated image. In areas with grayscale variations, noticeable aliasing artifacts, such as prominent jagged edges, can appear, which can have a certain impact on detection accuracy.
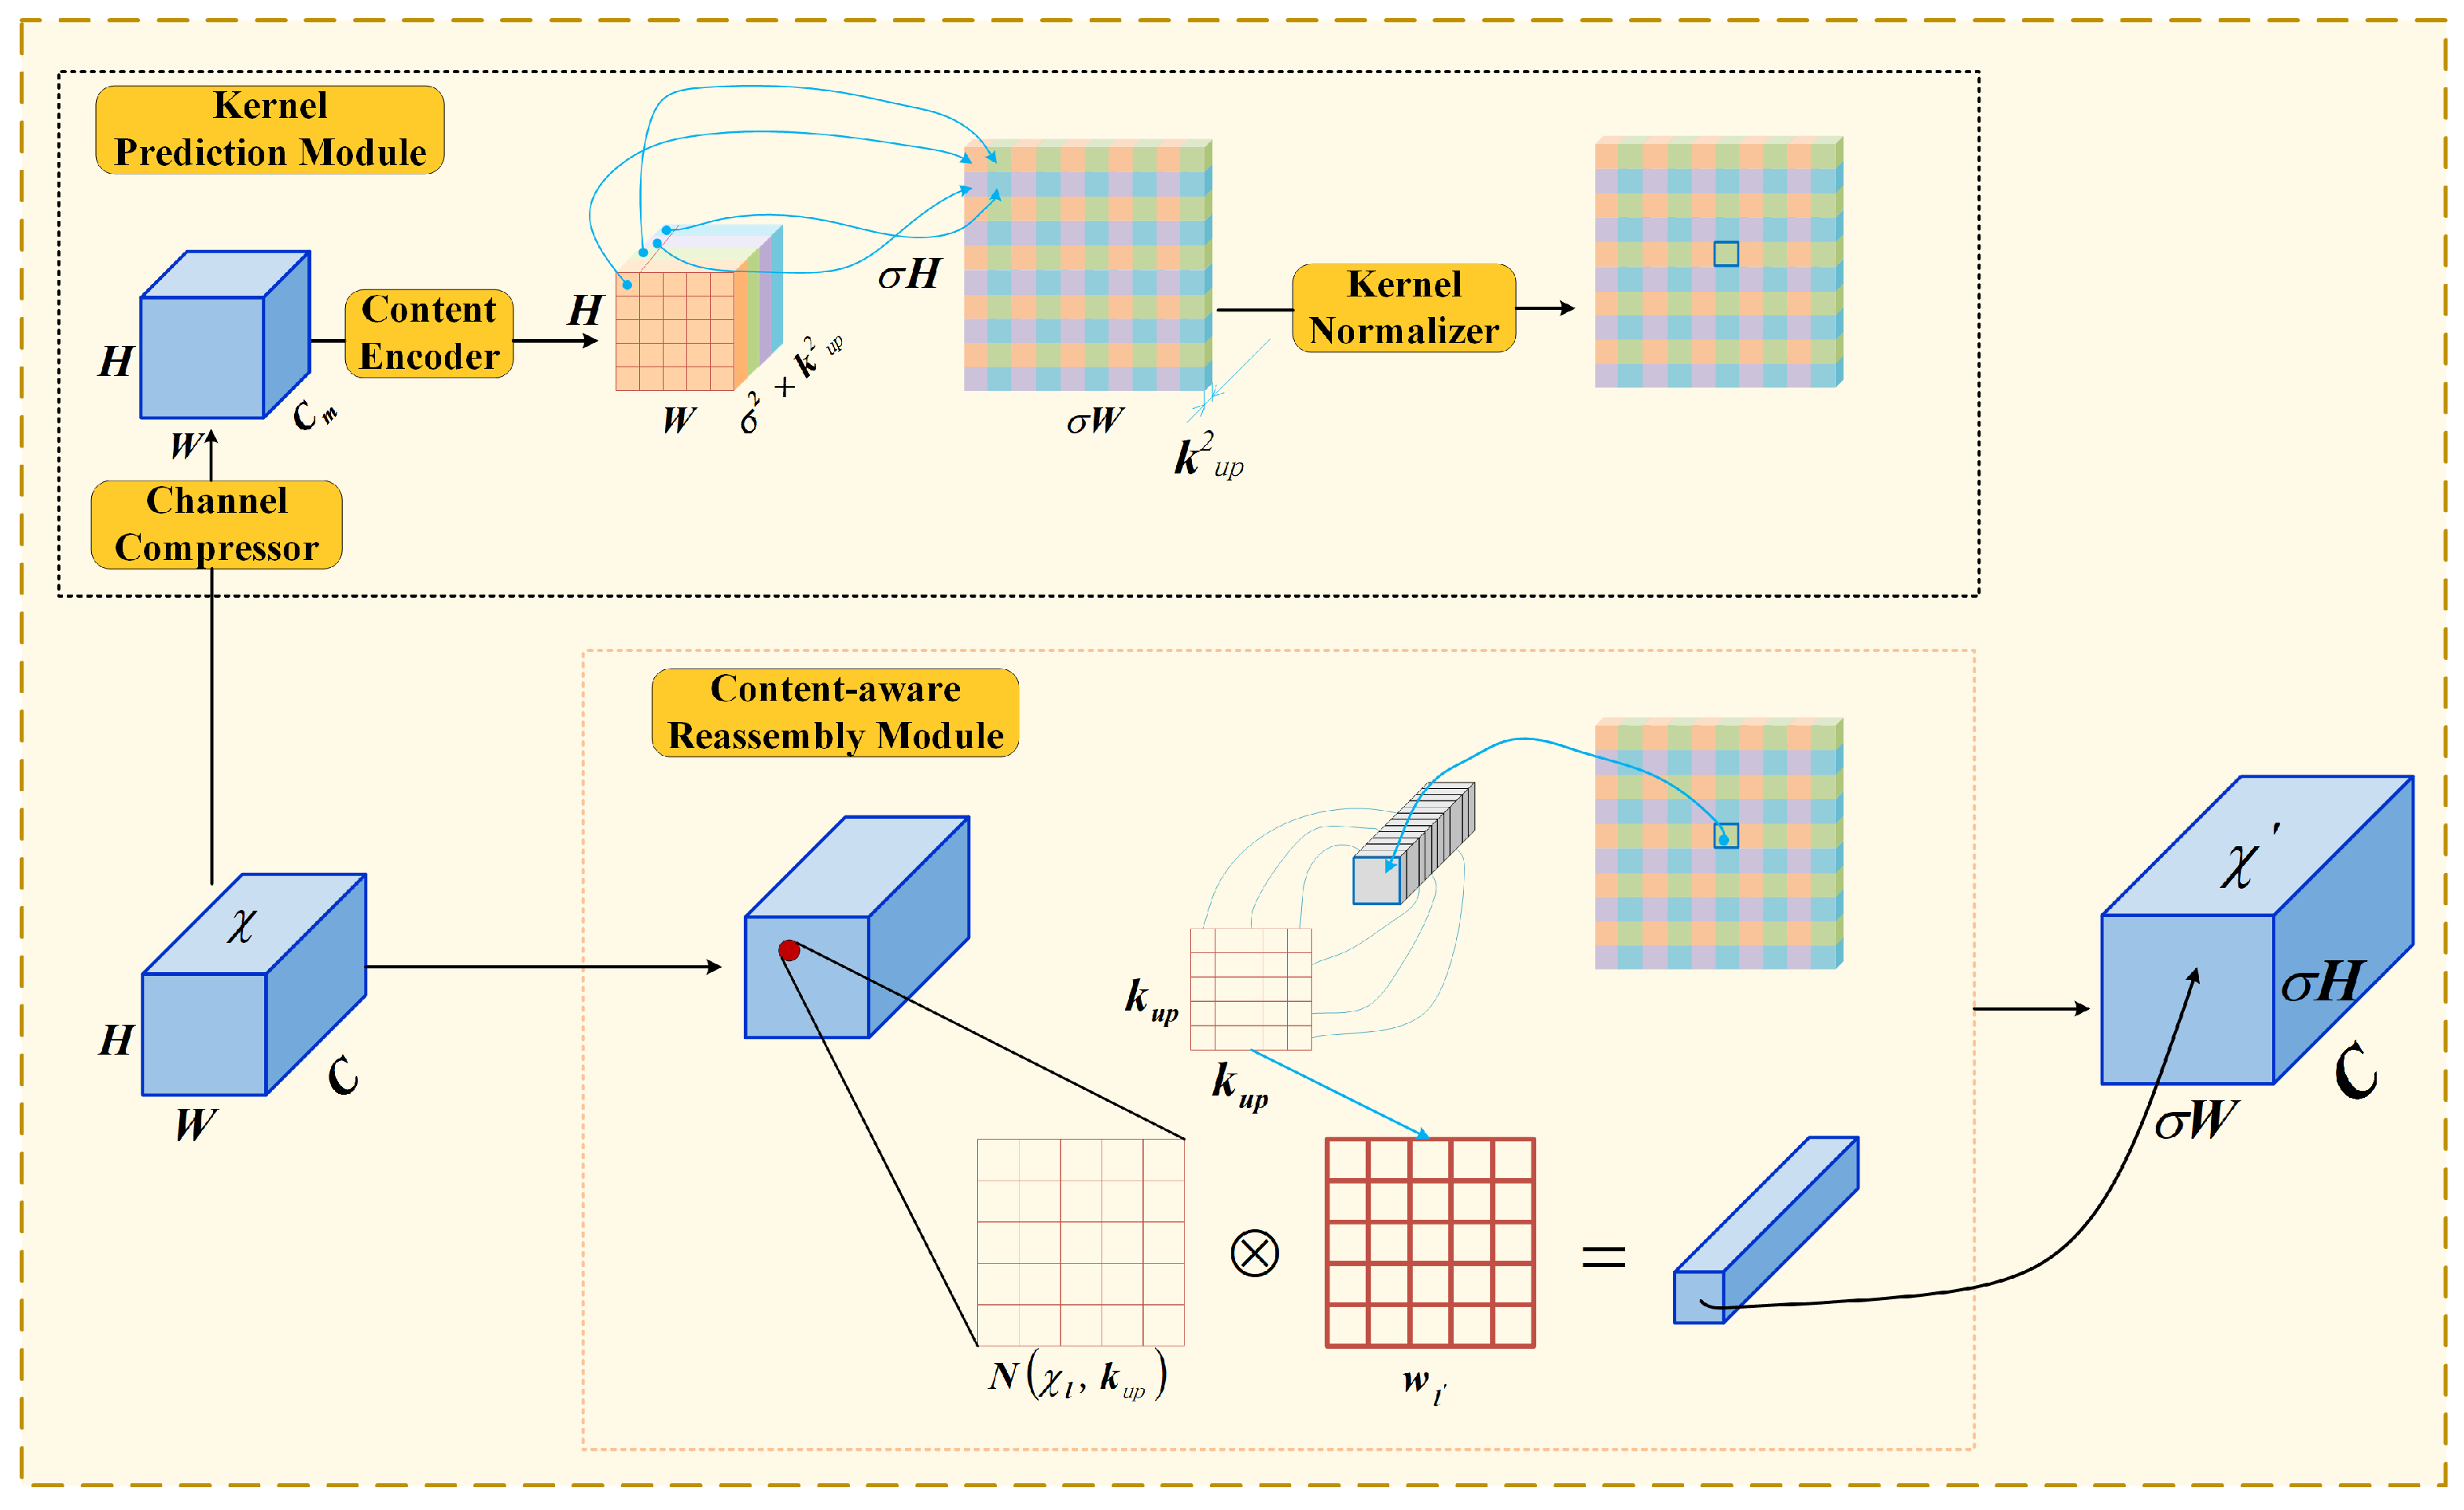
In this experiment, the CARAFE upsampling module is introduced, which addresses the limitations of nearest neighbor interpolation. The network structure of CARAFE is depicted in the figure below. CARAFE comprises two steps: predicting a recombination kernel for each target position based on the content and recombining the features using the predicted kernels. Given a feature map X with dimensions and an upsampling ratio (assuming is an integer), CARAFE generates a new feature map with dimensions .
The kernel prediction module, comprised of channel compression, content encoding and kernel regularization sub-modules, generates the recombination kernel in a content-aware manner. The channel compressor reduces the channels of the input feature map from C to using a convolution layer. Reducing the channels of the input feature map can decrease the parameters and computational cost of subsequent steps, improving the efficiency of CARAFE.
With the same budget, larger kernels can be employed for the content encoder. Subsequently, the content encoder takes the compressed feature map as input and encodes the content to generate the recombination kernel. The encoder uses a convolution layer with kernel size to generate the recombination kernel based on the content of the input feature. Intuitively, increasing can expand the receptive field of the encoder and utilize more contextual information in a larger area, which is important for predicting the recombination kernel. However, the computational complexity increases with the square of the kernel size, while the benefits of larger kernels do not. is a good trade-off between performance and efficiency, and the optimal combination of and will also be explored in this experiment.
As depicted in
Figure 8, the upsampling ratio is
, the upsampling size is
, the number of output channels obtained through convolution after the input channel
is
, and the channel dimension is expanded in the spatial dimension to obtain an upsampling kernel with a shape of
. Kernel regularization normalizes each
recombination kernel spatially using a softmax function.
In the kernel prediction module, the kernel prediction module
predicts the position-aware kernel
for each position
based on the neighborhood of
, as demonstrated in Equation (
1).
The formula for the recombination step is as follows, where is the content-aware recombination module, which utilizes the kernel to recombine the neighborhood of . In this context, is employed to denote the subregion of X with size centered at position l, the neighborhood of .
For each recombination kernel
in the content-aware recombination module, the local features within the neighborhood are recombined using the function
as illustrated in Equation (
2). However, in this instance, a simple form for
is adopted, which is merely a weighted sum operator. For a target location
and the corresponding square region
centered at
, the reassembly is demonstrated in Equation (
3), where
:
For each position in the output feature map, it is unfolded and mapped back to the input feature map. Subsequently, the corresponding region from the input feature map is extracted and multiplied element-wise with the predicted upsampling kernel at that point. This process results in a new feature map of shape .
3.3. Introduction of Focal-CIoU
Numerous loss functions overlook the issue of class imbalance between positive and negative samples, where a significant number of predicted boxes with small overlapping areas with the target boxes contribute substantially to the final bounding box optimization. Low-quality samples can result in fluctuating loss values during training. The uneven distribution of high and low-quality samples is a crucial factor affecting model convergence.
An exceptional loss function should exhibit the following advantages:
(1) When the regression error approaches zero, the gradient value should also approach zero.
(2) The gradient value should rapidly increase around small regression errors and gradually decrease around large regression errors.
(3) The gradient function needs to be within the range (0, 1] to balance high-quality and low-quality anchors.
(4) It should possess corresponding hyperparameters that allow flexible control over the degree of suppression for low-quality samples.
To address these needs, Yi-Fan Zhang et al. [
12] proposed the Focal L1 loss, defined in Equation (
4):
where
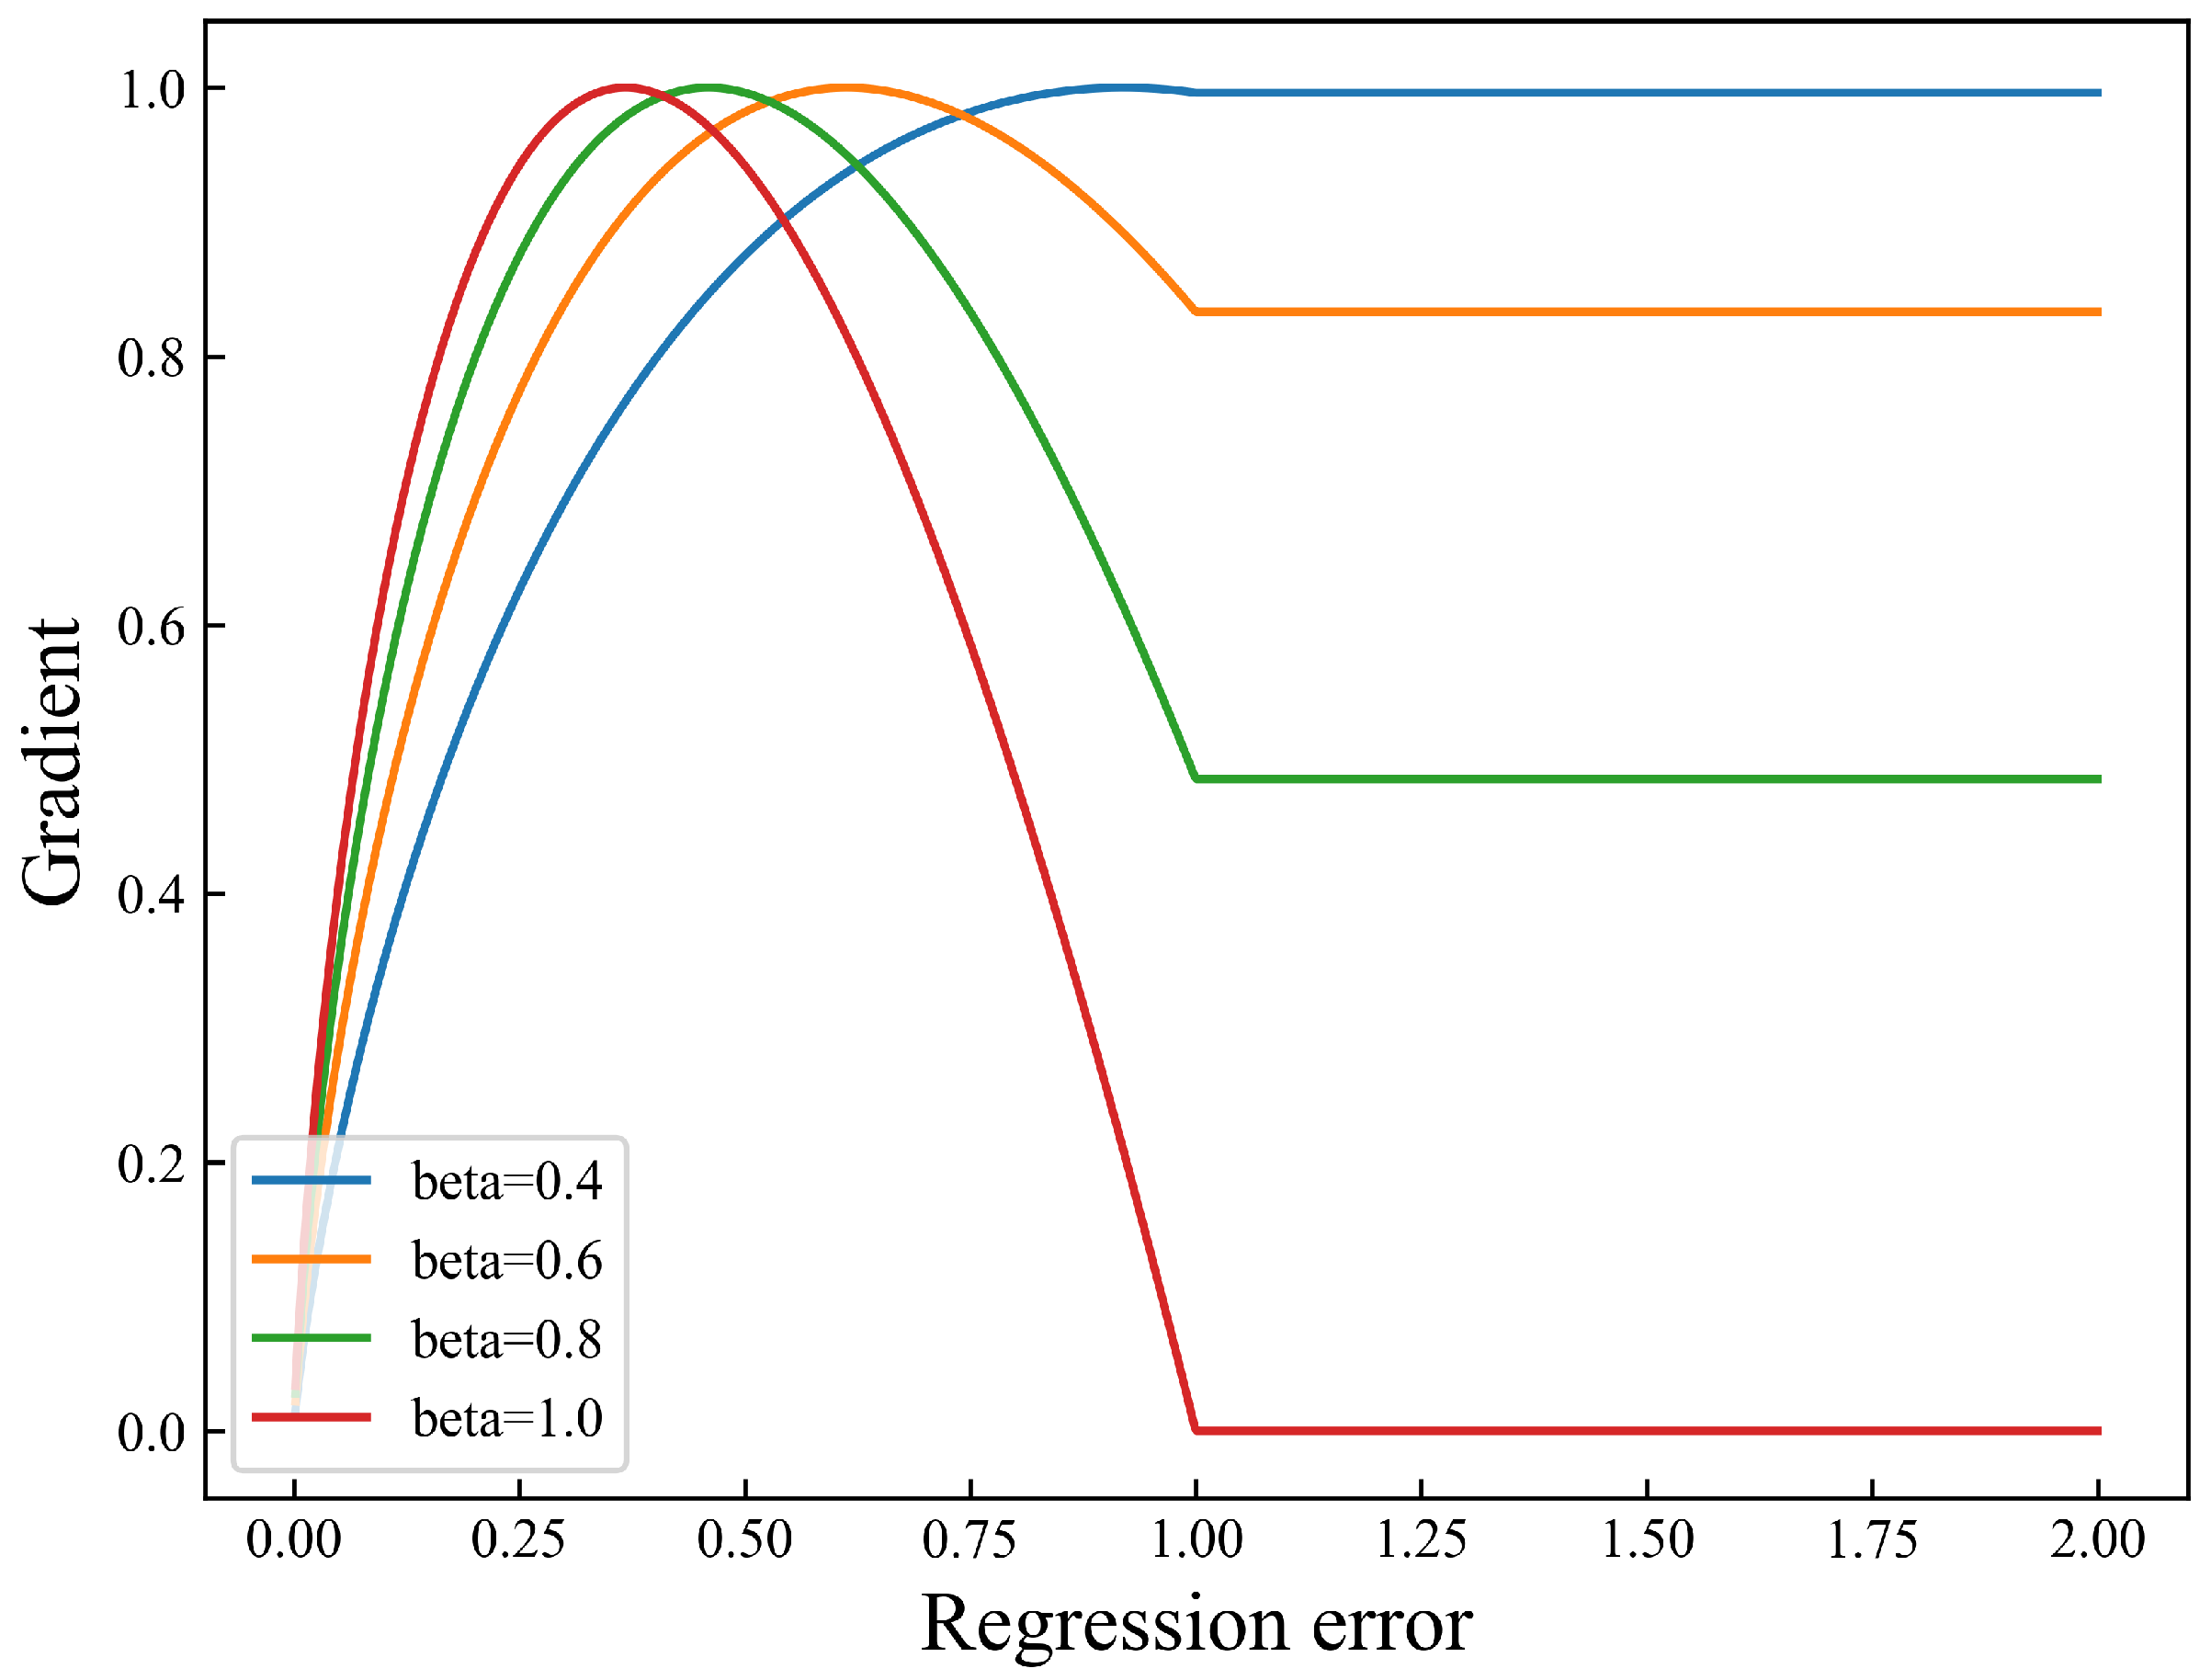
. The gradient curve is illustrated in
Figure 9. This loss uses
to adjust the gradient decay beyond
, ensuring reduced gradients for both very large and very small errors. As a result, it limits the influence of low-quality samples with high loss values.
However, directly replacing
x with EIoU in this formula led to unsatisfactory results. Instead, ref. [
21] reweighted EIoU loss using IoU, leading to the Focal-EIoU loss defined in Equation (
5):
The original YOLOv5 model employs CIoU loss, shown in Equation (
6):
Here, b and denote the centers of the predicted and ground truth boxes, is the Euclidean distance, c is the diagonal length of the smallest enclosing box, and v measures the aspect ratio difference.
Since Focal-EIoU did not improve performance, we instead applied the same reweighting approach to CIoU, yielding Focal-CIoU, as shown in Equation (
7).
We set
in our experiments. To illustrate its behavior, we adopted a simplified Focal-IoU loss function, as defined in Equation (
8).
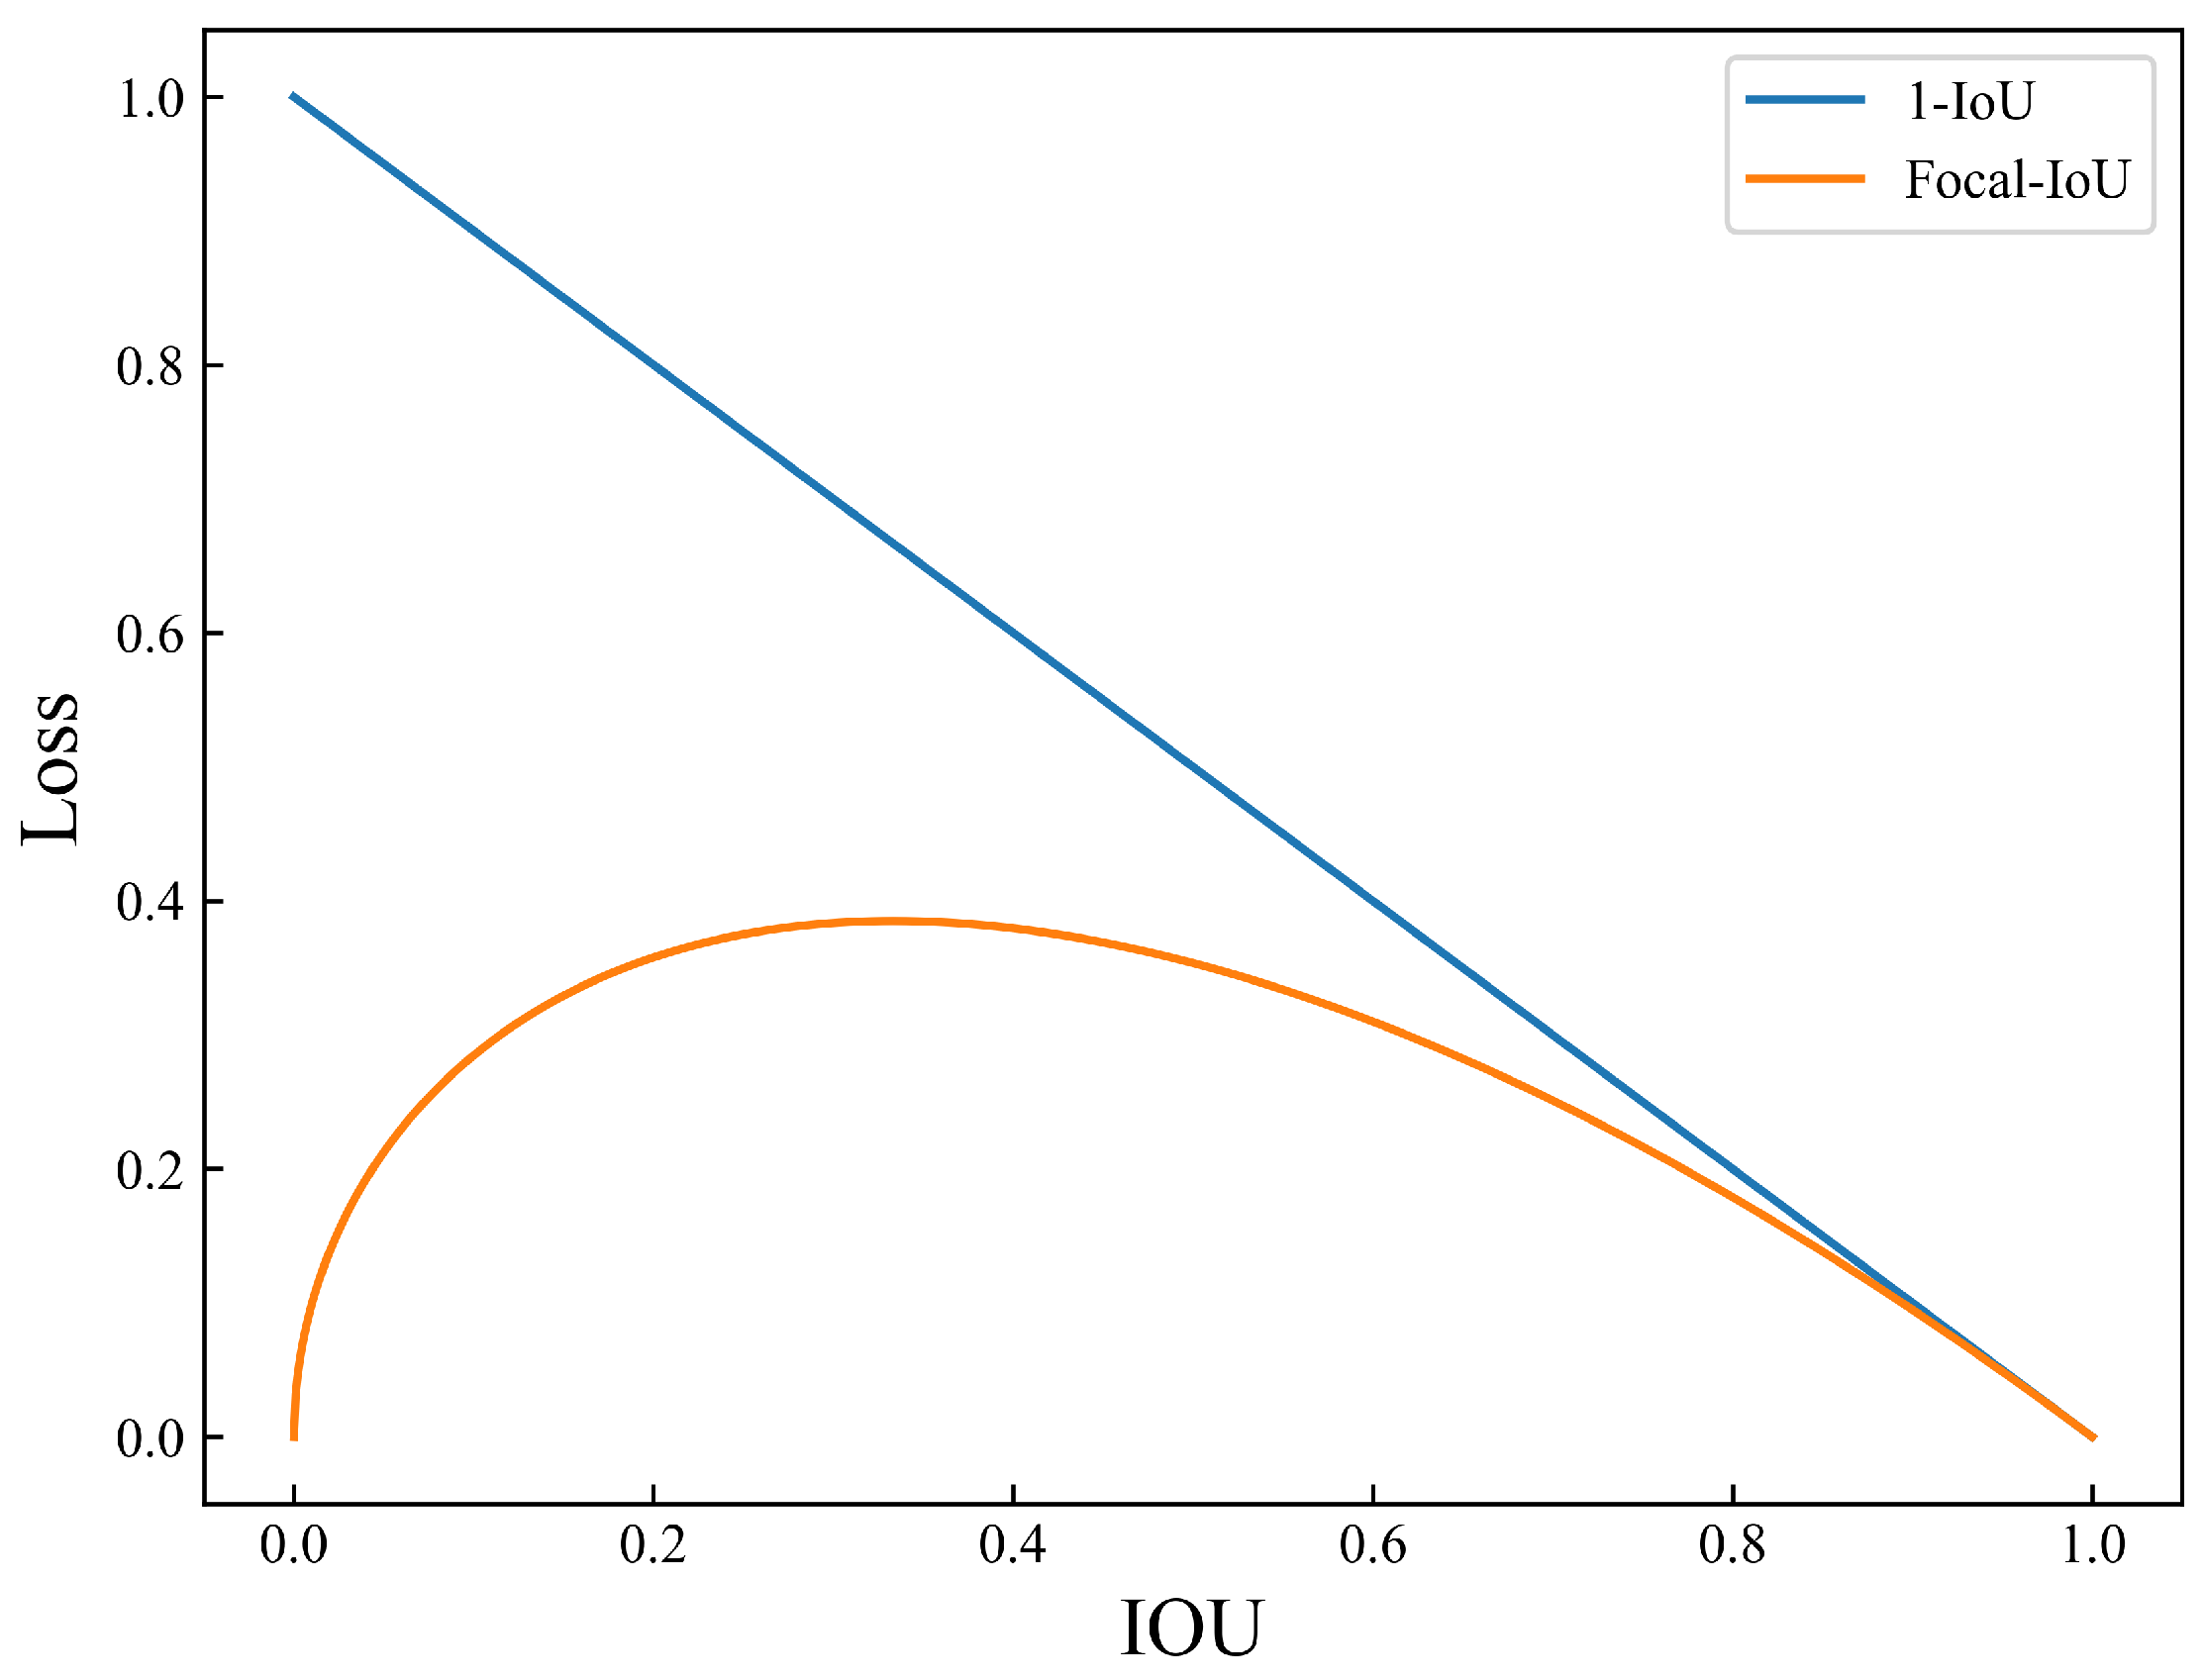
As shown in
Figure 10, the curve
increases the contribution of low-IoU samples, while its value remains relatively stable for high-IoU regions. This property helps the model focus on hard samples, accelerates convergence, and improves regression accuracy. Therefore, we adopt Focal-CIoU in our final model.
4. Experimental Results and Analysis
In this section, the software and hardware environment of the experiment, as well as various evaluation metrics, will be introduced. Then, ablation experiments will be used to assess the contributions of different parts of the improved model to its performance enhancement. The methods used in each module of the experiment will also be compared. Finally, the model will be compared with other models to demonstrate the superiority of our approach in terms of performance.
4.1. Experimental Environment and Evaluation Metrics
The experiments were conducted on a server equipped with four NVIDIA GeForce RTX 1080 Ti GPUs. Data augmentation was implemented using Python 3.8.5 and OpenCV 4.x. The detailed hardware and software environment is summarized in
Table 2. The model was initialized with a learning rate of 0.01, which decayed to 0.0001. The momentum was set to 0.9, and weight decay to 0.0005, with a total of 300 epochs. The batch size was set to 64 samples.
The experiments employed commonly used evaluation metrics in deep learning, namely, precision, recall, AP, and mAP. Specifically, precision and recall are defined in Equations (
9) and (
10), respectively, while AP and mAP are given by Equations (
11) and (
12).
where TP represents true-positive samples, FP represents false-positive samples, and FN represents false-negative samples.
p represents precision, and
r represents recall. The AP value can be obtained by calculating the area under the PR curve. N represents the number of detection categories, which is 36 in this experiment. Therefore, the mAP metric is equal to the AP metric, which can be obtained by calculating the area under the PR curve divided by 36.
4.2. Experiment
This study adopts Focal-CIoU to replace the original IoU to improve the model’s performance. In our experiments, we apply Equation (
5) to Distance Intersection over Union (DIoU) and Generalized Intersection over Union (GIoU), resulting in Focal-DIoU, Focal-EIoU, and Focal-GIoU, respectively. To compare the impact of Focal-CIoU with the aforementioned losses on model performance, we incorporate all these loss functions into a Biformer model with increased attention mechanism. The test results regarding the effects of different loss functions on model performance are presented in
Table 3.
According to the
Table 3, CIoU achieves the highest precision (0.937), indicating its effectiveness in improving localization accuracy. However, Focal-CIoU yields the best recall (0.898) and mAP@0.5 (0.946), demonstrating superior overall performance. The integration of the focal mechanism helps address class imbalance by reducing the influence of easily classified samples and focusing on harder examples.
Although Focal-CIoU has slightly lower precision than CIoU, it achieves a better trade-off among precision, recall, and mAP. This makes it more suitable for the peony recognition task, where complex intra-class variations and subtle differences between instances exist. Therefore, Focal-CIoU is recommended as the optimal loss function in our model.
In the previous text, it was mentioned that there exists an optimal parameter relationship of
for the CARAFE upsampling Equations (
1) and (
2). To determine the optimal parameter configuration for the CARAFE upsampling module, we experimented with different combinations of
and
, as shown in
Table 4 and visualized in
Figure 11.
The results show that the configuration and achieves the best overall performance, with a precision of 0.941, recall of 0.891, and mAP@0.5 of 0.947. Notably, the highest recall (0.898) occurs at and , suggesting that a smaller encoder kernel combined with a larger upsampling kernel may benefit sensitivity by preserving more local details and enhancing spatial adaptability. However, such combinations may also introduce instability or computational burden.
In general, accuracy remains consistently high across configurations, demonstrating CARAFE’s robustness. Yet, increasing kernel sizes significantly raises computational complexity and resource demand, with the practical upper bound identified as and . Considering both performance and efficiency, the combination of and is selected as the optimal setting for the peony flower recognition task, providing the best trade-off between detection precision, recall, and computational cost.
4.3. Ablation Experiment
To validate the effectiveness of the improved model for peony flower recognition and detection, as well as to assess the necessity and contribution of each improvement component, we designed specific ablation experiments. There are three modifications made to the base model in this experiment. Firstly, the Biformer attention mechanism module is added. Secondly, the loss function is replaced from the base model’s CIoU with Focal-CIoU, which is proposed based on Focal-EIoU. Lastly, the upsampling in the model is replaced with CARAFE upsampling, which improves performance. The effects of the improvement components on the model were quantitatively measured, and the specific ablation experiments are shown in
Table 5.
The experimental results presented in the pertinent table demonstrate the performance metrics of four different methods in the task of object detection, including precision, recall, mAP@0.5, and mAP@0.95. Three improvement methods, namely, Biformer, Focal-CIoU, and CARAFE, were gradually introduced based on the original YOLOv5s model, and their effects on performance were evaluated individually.
After integrating the Biformer attention mechanism, the model achieved improvements of 3.0% in precision, 2.3% in recall, and 2.6% in mAP@0.5 compared to the baseline YOLOv5s. This demonstrates Biformer’s effectiveness in enhancing feature representation by filtering out irrelevant key-value pairs at the coarse region level and concentrating on informative regions through dual-stage attention fusion. Such targeted focus significantly improves detection performance in complex floral scenes.
Introducing the Focal-CIoU loss led to a slight 0.4% drop in precision but resulted in the highest recall (an increase of 2.8%) and further improvements of 1.8% in mAP@0.5 and 1.0% in mAP@0.95. This loss function enhances the model’s robustness by down-weighting low-quality anchors and emphasizing high-quality ones, thereby improving classification accuracy. Compared to Focal-IoU and Focal-DIoU, Focal-CIoU shows more substantial gains in fine-grained recognition tasks like peony flower classification.
With the addition of the CARAFE upsampling module, the model achieved its best overall performance: 94.1% precision, 89.1% recall, and 94.7% mAP@0.5. CARAFE’s content-aware reassembly and use of deformable convolution enable better preservation of shape and texture during upsampling, which is critical for distinguishing between visually similar peony varieties. This enhancement notably boosts the model’s feature reconstruction capabilities and overall detection precision.
These experimental results indicate that by combining the Biformer, Focal-CIoU, and CARAFE methods, higher precision, recall, and mAP metrics can be achieved in peony flower recognition tasks. These improvement methods optimize different aspects of object detection and synergistically enhance the model’s accurate recognition capabilities for peony flowers.
According to
Figure 12, it can be observed that the model gradually converges after 20 rounds and reaches convergence after 40 rounds. Based on the trend of the curve, the model shows improvement in terms of model performance compared to YOLOv5. As shown in
Figure 13, YOLOv5s tends to have false positives and false negatives when dealing with similar flowers, and there is a certain probability of obtaining two different results for the same type of flower. On the other hand, the proposed BCP-YOLOv5 avoids these issues and achieves more accurate classification of peony flowers. This indicates that the improvements are effective for peony flower recognition.
4.4. Comparative Experiment
To validate the detection performance of BCP-YOLOv5 for peony flowers, a comparative analysis was conducted with mainstream models such as SSD, Faster R-CNN, YOLOv3, and YOLOv4. The recognition performance among the models was evaluated and analyzed using three metrics: precision, recall, and mAP@0.5. To ensure a fair comparison, all baseline models were re-trained on the same dataset used for training our proposed BCP-YOLOv5. The results of the comparative experiments are presented in
Table 6. From the table, it can be observed that our proposed BCP-YOLOv5 achieved an mAP@0.5 of 0.947, which is a 4.5% improvement compared to the original YOLOv5s. Additionally, BCP-YOLOv5 exhibited superior detection performance compared to other mainstream object detection models. Combining the results in the table with the comparisons to other mainstream models, BCP-YOLOv5 surpassed the current mainstream object detection models in terms of precision and mAP@0.5. The comparative experiments demonstrated that BCP-YOLOv5 has a certain advantage in peony flower detection.
5. Discussion
Compared with existing studies on flower detection, which predominantly focus on single flower types or are conducted under controlled environments (such as strawberry [
6] and kiwifruit [
7]), our work tackles a more challenging and practical scenario involving 36 different peony flower varieties captured in natural field conditions. These settings present significant occlusions, highly similar inter-variety appearances, and complex illumination variations.
Our experimental results indicate that BCP-YOLOv5 achieves an mAP@0.5 of 0.947 on the test set, surpassing mainstream detectors such as SSD (0.734), Faster R-CNN (0.782), and YOLOv4 (0.728) and offering a notable 4.5% improvement over the standard YOLOv5s (0.902). This highlights the enhanced capability of the model to maintain high detection precision and robustness under realistic field conditions. Furthermore, the ablation study clearly shows that each of the introduced components—Biformer attention, Focal-CIoU loss, and CARAFE upsampling—contributes individually to performance gains. For instance, incorporating the Biformer module alone improved mAP@0.5 from 0.902 to 0.928, while the full combination achieved the highest mAP@0.5 of 0.947 and mAP@0.95 of 0.812. This suggests that the architectural enhancements are particularly effective in dealing with occluded and densely packed floral structures.
To the best of our knowledge, this is the first study to systematically investigate multi-variety peony flower detection using deep learning. By addressing a unique yet practically important problem, this work fills a significant gap in the current literature and provides a benchmark for future research on intelligent monitoring and automated harvesting systems tailored to peony cultivation.
6. Conclusions
In this article, an improved object detection model called BCP-YOLOv5 was proposed based on YOLOv5 to specifically address the recognition difficulties caused by the similarity of Luoyang peony flowers. By introducing the Biformer attention mechanism, the model’s perception of the flower regions in peony flower images was enhanced. The upsampling module was replaced with CARAFE to improve performance while maintaining lightweight characteristics. Building upon the Focal-EIoU concept, the loss function was modified to Focal-CIoU, reducing the impact of low-quality anchors on the model while increasing the influence of high-quality anchors. The experimental results demonstrated that BCP-YOLOv5 has advantages in detecting and classifying peony flowers, contributing to filling the gap in peony flower object detection.
7. Limitations and Future Work
This study primarily focused on improving detection accuracy and robustness. However, it did not include quantitative analyses of inference latency, model size, training time, or computational complexity, which are critical for practical deployment. In future work, we plan to systematically investigate these engineering aspects, including benchmarking on embedded and edge devices to assess feasibility under resource-constrained conditions. We also aim to integrate lightweight network architectures and model compression techniques, such as pruning and quantization, to enable real-time applications. Through these efforts, we hope to advance towards practical, efficient, and scalable intelligent systems for automated peony flower monitoring and management.
Author Contributions
Conceptualization, B.J. and X.H.; methodology, X.H.; software, X.H.; validation, X.H., J.Z. and C.D.; formal analysis, X.H.; investigation, X.H.; resources, F.T. and G.Z.; data curation, X.H.; writing—original draft preparation, X.H. and B.J.; writing—review and editing, B.J., H.F. and J.Z.; visualization, X.H.; supervision, B.J. and H.F.; project administration, B.J. All authors have read and agreed to the published version of the manuscript.
Funding
This work was supported by the National Key Research and Development Program of China under Grant 2024YFB2907700; the National Natural Science Foundation of China under Grants 62271192 and 62172142; the Major Science and Technology Projects of Longmen Laboratory under Grants 231100220300 and 231100220400; the Key Research and Development Special Projects of Henan Province under Grant 241111210800; the Joint Fund Key Project of Science and Technology R&D Plan of Henan Province under Grants 225200810033, 225200810029, and 235200810040; the Central Plains Leading Talent in Scientific and Technological Innovation Program under Grants 244200510048 and 234200510018; the Strategic Research and Consulting Project of the Chinese Academy of Engineering under Grant 2023-DZ-05; the Key Laboratory of Industrial Internet of Things & Networked Control, Ministry of Education under Grant 2023FF01; the Program for Science & Technology Innovation Talents in Universities of Henan Province under Grant 22HASTIT020; the Scientific and Technological Key Project of Henan Province under Grant 232102210151; the Innovation and Entrepreneurship Team Project of Henan Academy of Sciences under Grant 20230201; the Henan Center for Outstanding Overseas Scientists under Grant GZS2022015; the Henan Province High-Level Foreign Experts Introduction Plan under Grant HNGD2023012; the Research Project on the Mid-to-Long-Term Strategy for Industrial Technology Innovation and Development of Henan under Grant 242400411260; the Science and Technology R&D Plan Joint Fund Project of Henan Province under Grant 232103810040; the Henan Provincial University Science and Technology Innovation Teams Program under Grant 25IRTSTHNO17; and the Beijing Engineering Research Center of Aerial Intelligent Remote Sensing Equipments Fund under Grant AIRSE202404.
Institutional Review Board Statement
Ethical review and approval were not required for this study as it did not involve humans or animals.
Informed Consent Statement
Informed consent was not required as the study did not involve human participants.
Data Availability Statement
The data presented in this study are available on request from the corresponding author. The data are not publicly available due to privacy restrictions.
Conflicts of Interest
The authors declare that the research was conducted in the absence of any commercial or financial relationships that could be construed as a potential conflict of interest.
References
- Kerkech, M.; Hafiane, A.; Canals, R. VddNet: Vine disease detection network based on multispectral images and depth map. Remote Sens. 2020, 12, 3305. [Google Scholar] [CrossRef]
- Afzaal, H.; Farooque, A.A.; Schumann, A.W.; Hussain, N.; McKenzie-Gopsill, A.; Esau, T.; Abbas, F.; Acharya, B. Detection of a potato disease (early blight) using artificial intelligence. Remote Sens. 2021, 13, 411. [Google Scholar] [CrossRef]
- Yan, B.; Fan, P.; Lei, X.; Liu, Z.; Yang, F. A real-time apple targets detection method for picking robot based on improved YOLOv5. Remote Sens. 2021, 13, 1619. [Google Scholar] [CrossRef]
- Fromm, M.; Schubert, M.; Castilla, G.; Linke, J.; McDermid, G. Automated detection of conifer seedlings in drone imagery using convolutional neural networks. Remote Sens. 2019, 11, 2585. [Google Scholar] [CrossRef]
- Zhao, J.; Zhang, X.; Yan, J.; Qiu, X.; Yao, X.; Tian, Y.; Zhu, Y.; Cao, W. A wheat spike detection method in UAV images based on improved YOLOv5. Remote Sens. 2021, 13, 3095. [Google Scholar] [CrossRef]
- Li, J.; Zhu, Z.; Liu, H.; Su, Y.; Deng, L. Strawberry R-CNN: Recognition and counting model of strawberry based on improved faster R-CNN. Ecol. Inform. 2023, 77, 102210. [Google Scholar] [CrossRef]
- Li, G.; Fu, L.; Gao, C.; Fang, W.; Zhao, G.; Shi, F.; Dhupia, J.; Zhao, K.; Li, R.; Cui, Y. Multi-class detection of kiwifruit flower and its distribution identification in orchard based on YOLOv5l and Euclidean distance. Comput. Electron. Agric. 2022, 201, 107342. [Google Scholar] [CrossRef]
- Tian, M.; Chen, H.; Wang, Q. Detection and recognition of flower image based on SSD network in video stream. J. Phys. Conf. Ser. 2019, 1237, 032045. [Google Scholar] [CrossRef]
- Tian, M.; Liao, Z. Research on flower image classification method based on YOLOv5. J. Phys. Conf. Ser. 2021, 2024, 012022. [Google Scholar] [CrossRef]
- Zhu, L.; Wang, X.; Ke, Z.; Zhang, W.; Lau, R.W. BiFormer: Vision Transformer with Bi-Level Routing Attention. In Proceedings of the IEEE/CVF Conference on Computer Vision and Pattern Recognition, Vancouver, BC, Canada, 17–24 June 2023; pp. 10323–10333. [Google Scholar]
- Wang, J.; Chen, K.; Xu, R.; Liu, Z.; Loy, C.C.; Lin, D. Carafe: Content-aware reassembly of features. In Proceedings of the IEEE/CVF International Conference on Computer Vision, Seoul, Republic of Korea, 27–28 October 2019; pp. 3007–3016. [Google Scholar]
- Zhang, Y.F.; Ren, W.; Zhang, Z.; Jia, Z.; Wang, L.; Tan, T. Focal and efficient IOU loss for accurate bounding box regression. Neurocomputing 2022, 506, 146–157. [Google Scholar] [CrossRef]
- Girshick, R. Fast r-cnn. In Proceedings of the IEEE International Conference on Computer Vision, Santiago, Chile, 7–13 December 2015; pp. 1440–1448. [Google Scholar]
- Redmon, J.; Divvala, S.; Girshick, R.; Farhadi, A. You only look once: Unified, real-time object detection. In Proceedings of the Conference on Computer Vision and Pattern Recognition, Las Vegas, NV, USA, 26 June–1 July 2016; pp. 779–788. [Google Scholar]
- Redmon, J.; Farhadi, A. YOLO9000: Better, faster, stronger. In Proceedings of the IEEE Conference on Computer Vision and Pattern Recognition, Honolulu, HI, USA, 21–26 July 2017; pp. 7263–7271. [Google Scholar]
- Redmon, J.; Farhadi, A. Yolov3: An incremental improvement. arXiv 2018, arXiv:1804.02767. [Google Scholar] [CrossRef]
- Bochkovskiy, A.; Wang, C.Y.; Liao, H.Y.M. Yolov4: Optimal speed and accuracy of object detection. arXiv 2020, arXiv:2004.10934. [Google Scholar] [CrossRef]
- Wang, C.Y.; Liao, H.Y.M.; Wu, Y.H.; Chen, P.Y.; Hsieh, J.W.; Yeh, I.H. CSPNet: A new backbone that can enhance learning capability of CNN. In Proceedings of the IEEE/CVF Conference on Computer Vision and Pattern Recognition Workshops, Seattle, WA, USA, 14–19 June 2020; pp. 390–391. [Google Scholar]
- Tan, M.; Le, Q. Efficientnet: Rethinking model scaling for convolutional neural networks. In Proceedings of the International Conference on Machine Learning, PMLR, Long Beach, CA, USA, 9–15 June 2019; pp. 6105–6114. [Google Scholar]
- Liu, S.; Qi, L.; Qin, H.; Shi, J.; Jia, J. Path aggregation network for instance segmentation. In Proceedings of the IEEE Conference on Computer Vision and Pattern Recognition, Salt Lake City, UT, USA, 8–22 June 2018; pp. 8759–8768. [Google Scholar]
- Zheng, Z.; Wang, P.; Liu, W.; Li, J.; Ye, R.; Ren, D. Distance-IoU loss: Faster and better learning for bounding box regression. Proc. Aaai Conf. Artif. Intell. 2020, 34, 12993–13000. [Google Scholar] [CrossRef]
- Rezatofighi, H.; Tsoi, N.; Gwak, J.; Sadeghian, A.; Reid, I.; Savarese, S. Generalized intersection over union: A metric and a loss for bounding box regression. In Proceedings of the IEEE/CVF Conference on Computer Vision and Pattern Recognition, Long Beach, CA, USA, 16–17 June 2019; pp. 658–666. [Google Scholar]
- Liu, W.; Anguelov, D.; Erhan, D.; Szegedy, C.; Reed, S.; Fu, C.Y.; Berg, A.C. Ssd: Single shot multibox detector. In Proceedings of the Computer Vision—ECCV 2016: 14th European Conference, Amsterdam, The Netherlands, 11–14 October 2016; Proceedings, Part I 14. Springer: Berlin/Heidelberg, Germany, 2016; pp. 21–37. [Google Scholar]
Figure 1.
Examples of some peony flower varieties.
Figure 1.
Examples of some peony flower varieties.
Figure 2.
The dataset enhancement transforms one original image into fifteen different images.
Figure 2.
The dataset enhancement transforms one original image into fifteen different images.
Figure 3.
(a) Number of annotation boxes per category; (b) distribution of annotation box centers, where color intensity reflects density (warmer colors = higher density).
Figure 3.
(a) Number of annotation boxes per category; (b) distribution of annotation box centers, where color intensity reflects density (warmer colors = higher density).
Figure 4.
The YOLOv5 architecture.
Figure 4.
The YOLOv5 architecture.
Figure 5.
The BCP-YOLOv5 model proposed by us after improvements to the traditional YOLOv5.
Figure 5.
The BCP-YOLOv5 model proposed by us after improvements to the traditional YOLOv5.
Figure 6.
Bi-Level Routing Attention skipping computation of unrelated regions using sparsity.
Figure 6.
Bi-Level Routing Attention skipping computation of unrelated regions using sparsity.
Figure 7.
Internal details of Biformer block.
Figure 7.
Internal details of Biformer block.
Figure 8.
CARAFE consists of two parts: the kernel prediction module and the content-aware reassembly module.
Figure 8.
CARAFE consists of two parts: the kernel prediction module and the content-aware reassembly module.
Figure 9.
Gradient of our Focal L1 loss for bounding box regression.
Figure 9.
Gradient of our Focal L1 loss for bounding box regression.
Figure 10.
Focal-IoU curve characteristics.
Figure 10.
Focal-IoU curve characteristics.
Figure 11.
Comparison of CARAFE upsampling under different parameters.
Figure 11.
Comparison of CARAFE upsampling under different parameters.
Figure 12.
(a) shows the training curves of the precision of each model in the ablation experiment, where the dashed line is BCP-YOLOv5; (b) shows the various models of the ablation experiment mAP@0.5. The training curve where the dashed line is BCP-YOLOv5.
Figure 12.
(a) shows the training curves of the precision of each model in the ablation experiment, where the dashed line is BCP-YOLOv5; (b) shows the various models of the ablation experiment mAP@0.5. The training curve where the dashed line is BCP-YOLOv5.
Figure 13.
(a) shows the recognition results of BCP-YOLOv5 on peony flower images. (b) depicts the recognition results of the original YOLOv5 model on peony flower images, where errors in identification and the phenomenon of classifying one type of flower as two can be observed.
Figure 13.
(a) shows the recognition results of BCP-YOLOv5 on peony flower images. (b) depicts the recognition results of the original YOLOv5 model on peony flower images, where errors in identification and the phenomenon of classifying one type of flower as two can be observed.
Table 1.
Distribution of the dataset.
Table 1.
Distribution of the dataset.
| Dataset | Training Set | Test Set | Validation Set |
|---|
| Quantity | 8000 | 1000 | 1000 |
Table 2.
Hardware configuration.
Table 2.
Hardware configuration.
| Hardware Configuration | Configuration Details |
|---|
| GPU | NVIDIA 1080 Ti |
| CPU | Intel Xeon E5-2650 |
| Memory capacity | 11 GB |
| Operating system | Windows 10 |
| Python version | 3.8 |
| Deep learning framework | PyTorch 1.7.0 |
| CUDA Version | 10.1 |
Table 3.
Comparison between different loss functions.
Table 3.
Comparison between different loss functions.
| Methods | Precision | Recall | mAP@0.5 |
|---|
| CIoU [21] | 0.937 | 0.87 | 0.928 |
| DIoU [21] | 0.912 | 0.886 | 0.923 |
| EIoU [12] | 0.917 | 0.885 | 0.920 |
| GIoU [22] | 0.928 | 0.880 | 0.927 |
| Focal-GIoU | 0.927 | 0.896 | 0.930 |
| Focal-EIoU [12] | 0.928 | 0.881 | 0.936 |
| Focal-DIoU | 0.927 | 0.874 | 0.922 |
| Focal-CIoU | 0.933 | 0.898 | 0.946 |
Table 4.
Effect of sampling different parameter values on CARAFE.
Table 4.
Effect of sampling different parameter values on CARAFE.
| | Precision | Recall | mAP@0.5 |
|---|
| 1 | 3 | 0.923 | 0.895 | 0.939 |
| 1 | 5 | 0.923 | 0.898 | 0.940 |
| 3 | 3 | 0.931 | 0.895 | 0.946 |
| 3 | 5 | 0.941 | 0.891 | 0.947 |
| 3 | 7 | 0.930 | 0.895 | 0.944 |
| 5 | 7 | 0.931 | 0.884 | 0.942 |
Table 5.
Ablation experiment results.
Table 5.
Ablation experiment results.
| Group | YOLOv5s | Biformer | Focal-CIoU | CARAFE | Precision | Recall | mAP@0.5 | mAP@0.95 |
|---|
| 1 | ✓ | | | | 0.907 | 0.847 | 0.902 | 0.786 |
| 2 | ✓ | ✓ | | | 0.937 | 0.870 | 0.928 | 0.799 |
| 3 | ✓ | ✓ | ✓ | | 0.933 | 0.898 | 0.946 | 0.809 |
| 4 | ✓ | ✓ | ✓ | ✓ | 0.941 | 0.891 | 0.947 | 0.812 |
Table 6.
Comparison of different object detection methods on the test set.
Table 6.
Comparison of different object detection methods on the test set.
| Method | Precision | Recall | mAP@0.5 |
|---|
| SSD [23] | 0.847 | 0.562 | 0.734 |
| Faster R-CNN [17] | 0.642 | 0.706 | 0.782 |
| YOLOv4 [16] | 0.723 | 0.571 | 0.728 |
| YOLOv5s (baseline) | 0.907 | 0.847 | 0.902 |
| BCP-YOLOv5 (Ours)
| 0.941 | 0.891 | 0.947 |
| Disclaimer/Publisher’s Note: The statements, opinions and data contained in all publications are solely those of the individual author(s) and contributor(s) and not of MDPI and/or the editor(s). MDPI and/or the editor(s) disclaim responsibility for any injury to people or property resulting from any ideas, methods, instructions or products referred to in the content. |
© 2025 by the authors. Licensee MDPI, Basel, Switzerland. This article is an open access article distributed under the terms and conditions of the Creative Commons Attribution (CC BY) license (https://creativecommons.org/licenses/by/4.0/).
