Article

An Innovative Digital Teaching Platform for Triaxial Tests on Saturated Clays: Integrating Constitutive Model Theory with Experimental Understanding

1
College of Civil Engineering, Anhui Jianzhu University, Hefei 230601, China
2
Anhui Provincial Key Laboratory of Intelligent Geotechnics and Disaster Prevention, Anhui Jianzhu University, Hefei 230601, China
*
Author to whom correspondence should be addressed.
Technologies 2025, 13(9), 381; https://doi.org/10.3390/technologies13090381
Submission received: 13 July 2025 / Revised: 8 August 2025 / Accepted: 22 August 2025 / Published: 27 August 2025
(This article belongs to the Section Construction Technologies)

Abstract

This study addresses several challenges in traditional triaxial test teaching including high costs, poor environmental sustainability, and the lag of soil constitutive model education behind theoretical advancements. A digital platform for triaxial test teaching was established within the MATLAB environment. This platform integrates the Anisotropic Structured Clay Model (ASCM) and the Anisotropic Creep Model (ANICREEP), supporting four key testing conditions. It accommodates various teaching scenarios and experimental designs, clearly illustrating the stress–strain relationships of soil and the evolution of key state variables under different testing conditions. The platform helps students gain a deeper understanding of soil mechanical behavior while alleviating the burden of complex mathematical derivations, thereby establishing a new technology suitable for engineering education. The platform is highly aligned with the teaching needs of triaxial tests in the undergraduate course “Soil Mechanics” and can effectively support the in-depth exploration of constitutive model theory in the graduate course “Numerical Computation in Geotechnical Engineering”, providing robust support for cultivating students’ theoretical understanding and practical analytical skills. This technology not only promotes the deep integration of educational digitalization and modernization within geotechnical engineering teaching but also establishes an economical, sustainable, and innovative teaching paradigm. Furthermore, through its openness and extensibility, the platform injects new momentum into the implementation of educational digitalization strategies and serves as a model for building an open and shared curriculum resource system.

1. Introduction

As a core experimental technology in soil mechanics courses, the triaxial test offers the critical capability to precisely measure pore water pressure changes during soil shearing under strictly controlled drainage conditions [1,2,3,4]. This test is instrumental not only in elucidating the stress state of soil samples but also in providing essential data for determining stress–strain relationships and strength parameters, as well as validating constitutive models [5,6]. Therefore, a comprehensive understanding of triaxial test principles and results is fundamental for civil engineering students and those in related disciplines to establish a robust theoretical foundation in soil mechanics and develop practical applications.
However, traditional triaxial testing teaching models face numerous challenges. Firstly, the high costs of equipment procurement, operation, and maintenance, as well as the heavy reliance on specialized experimental personnel and laboratory space, directly limit the quantity and frequency of tests that can be conducted during teaching. Secondly, obtaining undisturbed soil samples for testing involves complex drilling, transportation, and preparation processes, increasing the complexity and cost of experiments. Furthermore, facilities, such as equipment, air conditioning, and lighting, consume considerable energy during the test. The waste soil samples and disposable consumables generated after the test, if not handled properly, also pose challenges to the economic and environmental sustainability of the experiments. Therefore, exploring more economical, environmentally friendly, and sustainable alternative or supplementary technologies for triaxial testing and improving existing experimental teaching modes have become urgent and important issues in current soil mechanics education.
Meanwhile, soil constitutive models, which describe the stress–strain relationships and strength characteristics of soils, represent a core theoretical component in the training of professionals across various engineering fields including civil engineering, geology, mining, hydraulic engineering, and transportation infrastructure [6]. For instance, the Modified Cam Clay (MCC) model, a classical elastoplastic model established within the frameworks of the critical state theory [7], is also one of the most widely used clay constitutive models. The MCC model constitutes a fundamental knowledge component in the “Numerical Computation in Geotechnical Engineering” course. However, the MCC model falls short in capturing certain complex characteristics of natural clays, such as anisotropy, destructuration, and time-dependent behavior, thereby limiting its predictive accuracy for these materials. Currently, numerous researchers have developed elastoplastic models that account for soil anisotropy and destructuration. For example, Wheeler et al. [8] developed the S-CLAY1 model, which simulates the anisotropy of natural clays through an inclined yield surface and models the evolution of anisotropy during plastic deformation using a rotational hardening parameter. Liu and Carter [9] introduced three parameters into the MCC model to describe the effects of soil structure. Similarly, Huang et al. [10] established a bounding surface model to characterize the yielding and stress–strain behavior of Shanghai soft clay, employing a variable that allows for the degradation of the bounding surface to simulate soil destructuration, and utilizing a rotational yield surface to capture soil anisotropy and its evolution. The Anisotropic Structured Clay Model (ASCM), developed within the frameworks of critical state theory and bounding surface plasticity, is an elastoplastic constitutive model capable of incorporating the effects of preconsolidation, anisotropy, adhesive stress, and bonding of clay through hardening parameters [6,11,12,13]. When soil destructuration is not considered, the ASCM model degenerates into the S-CLAY1 model. Furthermore, when both destructuration and anisotropy are disregarded, the ASCM model simplifies to the MCC model [6,11,12,13]. To account for the time-dependent characteristics of clay, many researchers have developed elastic viscoplastic constitutive models that consider only the viscosity of the soil [14,15,16,17,18]. Zhou et al. [19] and Yin et al. [20] then introduced parameters for describing soil anisotropy within the framework of elastic viscoplastic models. The Anisotropic Creep Model (ANICREEP) was extended from the overstress theory of Perzyna and is capable of simulating not only the effects of preconsolidation, anisotropy, adhesive stress and bonding of soils but also their viscosity and creep behavior, thereby accounting for the time-dependent nature of soils [21]. Therefore, through learning the ASCM model and the ANICREEP model, students can gain an understanding of elastoplasticity and elastic viscoplastic theories, comprehend critical state soil mechanics, master the classical MCC model, and acquire skills for modeling soil anisotropy, destructuration, and time-dependent behavior.
Despite their undeniable importance, the teaching content and technologies related to soil constitutive models have long lagged behind the theoretical advancements in this field. This gap is mainly attributed to the increasing complexity of constitutive models. In particular, recent models aimed at refined simulations involve highly intricate mathematical derivations [6,7,8,9,10,11,12,13,14,15,16,17,18,19,20,21,22], and their parameters have to be identified through optimization algorithms [23,24,25,26,27,28,29,30,31], posing significant challenges for both teaching and the practical application of constitutive theories. Traditional teaching technologies, which primarily focus on formula derivations, often fail to visually demonstrate the dynamic evolution of stress paths, deviatoric stress, volumetric strain, and the void ratio of soils under various testing conditions. Furthermore, differences in students’ prior knowledge of foundational courses, such as soil mechanics, advanced mathematics, elasticity, and plasticity, result in considerable difficulties in understanding and applying constitutive theories. This severely affects the goal of cultivating interdisciplinary and application-oriented professionals.
With the rapid development of computer technology in recent years, various computer-aided tools have been used in teaching in engineering fields. For example, Chen et al. [32] intuitively demonstrated the distribution patterns of secondary stress in surrounding rock for underground engineering through FLAC numerical simulations, and explained the principles of initial support in the New Austrian Tunneling Method, thereby aiding students in deepening their theoretical comprehension. Meng et al. [33] integrated rock triaxial stress–strain curves and internal crack propagation patterns obtained from PFC simulations into rock mechanics laboratory teaching. This approach significantly enhanced student interest in rock mechanics experiments and addressed the limitations of traditional experimental teaching methods. Xiao et al. [34] introduced PFC2D into the teaching of rock mechanics compression experiments, enabling students to understand the differential characteristics of rock mechanics from the perspective of microstructural features. ExCalibre [35,36] and PLAXIS [37] provide powerful capabilities for calibrating and visualizing the mechanical behavior of soils under a wide range of loading conditions, enabling students to analyze the stress–strain relationships of soils under different constitutive models and parameters. The aforementioned numerical simulation methods offer an effective avenue and technological approach for transforming traditional teaching practices, which are often characterized by undiversified teaching paradigms and limited pedagogical outcomes. However, their application in triaxial experiment teaching necessitates users possessing a foundational understanding of numerical modeling and operational skills. Furthermore, when the PLAXIS SoilTest is used for teaching constitutive models, it is impossible to gain an insight into the program’s execution flow within a computational cycle or access state variable values at specific points.
The MATLAB App Designer enables graphical user interface (GUI) design and layout through drag-and-drop visual components and facilitates rapid programming using its integrated editor [38]. This paper establishes a digital teaching platform for triaxial tests in the MATLAB environment. The platform integrates two constitutive models, namely, the Anisotropic Structured Clay Model (ASCM) and Anisotropic Creep Model (ANICREEP), alongside four testing conditions: undrained test, drained test, constant-p’ test, and creep tests. This digital teaching platform offers flexible adjustment capabilities, enabling support for various scenarios in teaching and experimental design based on demand. Consequently, it is applicable to triaxial test teaching in the undergraduate course “Soil Mechanics” and the theoretical teaching of constitutive models in the postgraduate course “Numerical Computation in Geotechnical Engineering”. This flexibility ensures the platform’s sustained utility in training both undergraduates and postgraduates, fostering a deeper understanding of theoretical knowledge and enhancing practical skills, thereby forming an economical, environmentally friendly, and sustainable teaching technology.

2. Fundamental Principles of Saturated Clay Constitutive Models

The digital teaching platform in this paper integrates two saturated clay constitutive models, namely, the Anisotropic Structured Clay Model (ASCM) and the Anisotropic Creep model (ANICREEP).

2.1. Anisotropic Structured Clay Model (ASCM)

The ASCM model is an elastoplastic model established within the frameworks of the critical state theory and the bounding surface plasticity; it is capable of incorporating the effects of preconsolidation, anisotropy, adhesive stress, and bonding of clay through hardening parameters [6,11,12,13]. The schematic diagram of the ASCM model principle is shown in Figure 1, and the bounding surface considering the structure of soil can be expressed as follows:
F ¯ = q ¯ p ¯ + p b α 2 M 2 α 2 + p ¯ + p b p ¯ 1 + χ p c i
where p ¯ and q ¯ are the mean effective and deviatoric stress tensors, respectively, and the bar indicates that these variables are related to the bounding surface; M is the slope of the critical state line; pci, α, pb, and χ are hardening-related parameters. The hardening and flow rules of the constitutive model are shown in Table 1, and the model parameters are shown in Table 2.

2.2. Anisotropic Creep Model (ANICREEP)

The ANICREEP model is an elastic viscoplastic model developed from Perzyna’s overstress theory. In addition to accounting for the effects of preconsolidation, anisotropy, adhesive stress, and bonding, the model also considers the creep characteristics of clay. The schematic diagram of the ANICREEP model principle is shown in Figure 2 [21]. The viscoplastic strain rate ε ˙ i j v p is calculated as follows:
ε ˙ i j v p = μ p m d p m r β 0 f d σ i j
where pmr is the size of the reference yield surface; pmd is the size of the dynamic loading surface; μ is the fluidity parameter, β0 is the strain-rate coefficient, and both are functions of the secondary compression coefficient Cαe.
The basic equations of the ANICREEP model are shown in Table 3, and the model parameters are shown in Table 4. The plastic strains can be calculated as
Δ ε v p = Δ t 1 θ ε ˙ v p , n + θ ε ˙ v p , n + 1
where θ is the integration parameter in the range of 0 ≤ θ ≤ 1. In this study, θ is set to 0.5.
A comparison between Table 2 and Table 4 shows that the ASCM and ANICREEP models employ both a set of shared parameters and several model-specific parameters. Specifically, the parameters shared by the two models include λ, κ, M, e0, υ, χ0, ξ, ξd, pb0, and ξb. The model-specific parameters of the ASCM model are pc0 and kp; the model-specific parameters of the ANICREEP model are pmr0 and Cαe.
The digital teaching platform integrates the undrained triaxial test, drained triaxial test, and constant-p’ test based on the ASCM model, as well as the undrained triaxial test, drained triaxial test, and creep test based on the ANICREEP model. Details about these two models and the incremental step pseudocode for each type of test can be found in reference [6].

3. Development of the Digital Teaching Platform

In MATLAB, creating a new App or directly typing “appdesigner” into the command window will launch the MATLAB App Designer homepage. This tool offers a range of utilities for designing user interfaces, thereby significantly streamlining the process of simulator design and development. As shown in Figure 3, the MATLAB App Designer interface consists of several key components including the “Component Library”, “Design View/Code View” switcher, “Component Browser”, and “Inspector”.
The design modules of the triaxial test digital teaching platform encompass constitutive model, test type, soil parameters, calculation settings, initial conditions, execution and display, and result clearing.

3.1. Data Input and Result Output Modules

Within the “Design View”, three panels are instantiated by dragging and dropping. Subsequently, by double-clicking on their respective titles, they are labeled as “Soil Parameters”, “Calculation settings”, and “Initial conditions”. These panels are designed for data input functions related to soil parameters, calculation control, and initial stress conditions.
In the “Soil Parameters” panel, drag an “Edit Field (Text)” component into the workspace. The parameter symbol is entered by double-clicking the text area (e.g., renaming parameter “pc0” to “p_c0”). Subsequently, the default parameter value is input by double-clicking the numerical area (e.g., “150”). The parameter name and value are then selected, replicated within the panel based on the required number of parameters, and their respective names and default values are modified. Canvas alignment features are utilized to align the parameter boxes, and the spacing function adjusts the inter-box distance. Then, in the “Component Browser”, rename each parameter to “xxxEditField” (e.g., the parameter “pc0” can be renamed to “p_c0EditField”) to facilitate the transfer of parameter values during the programming of the calculation procedures.
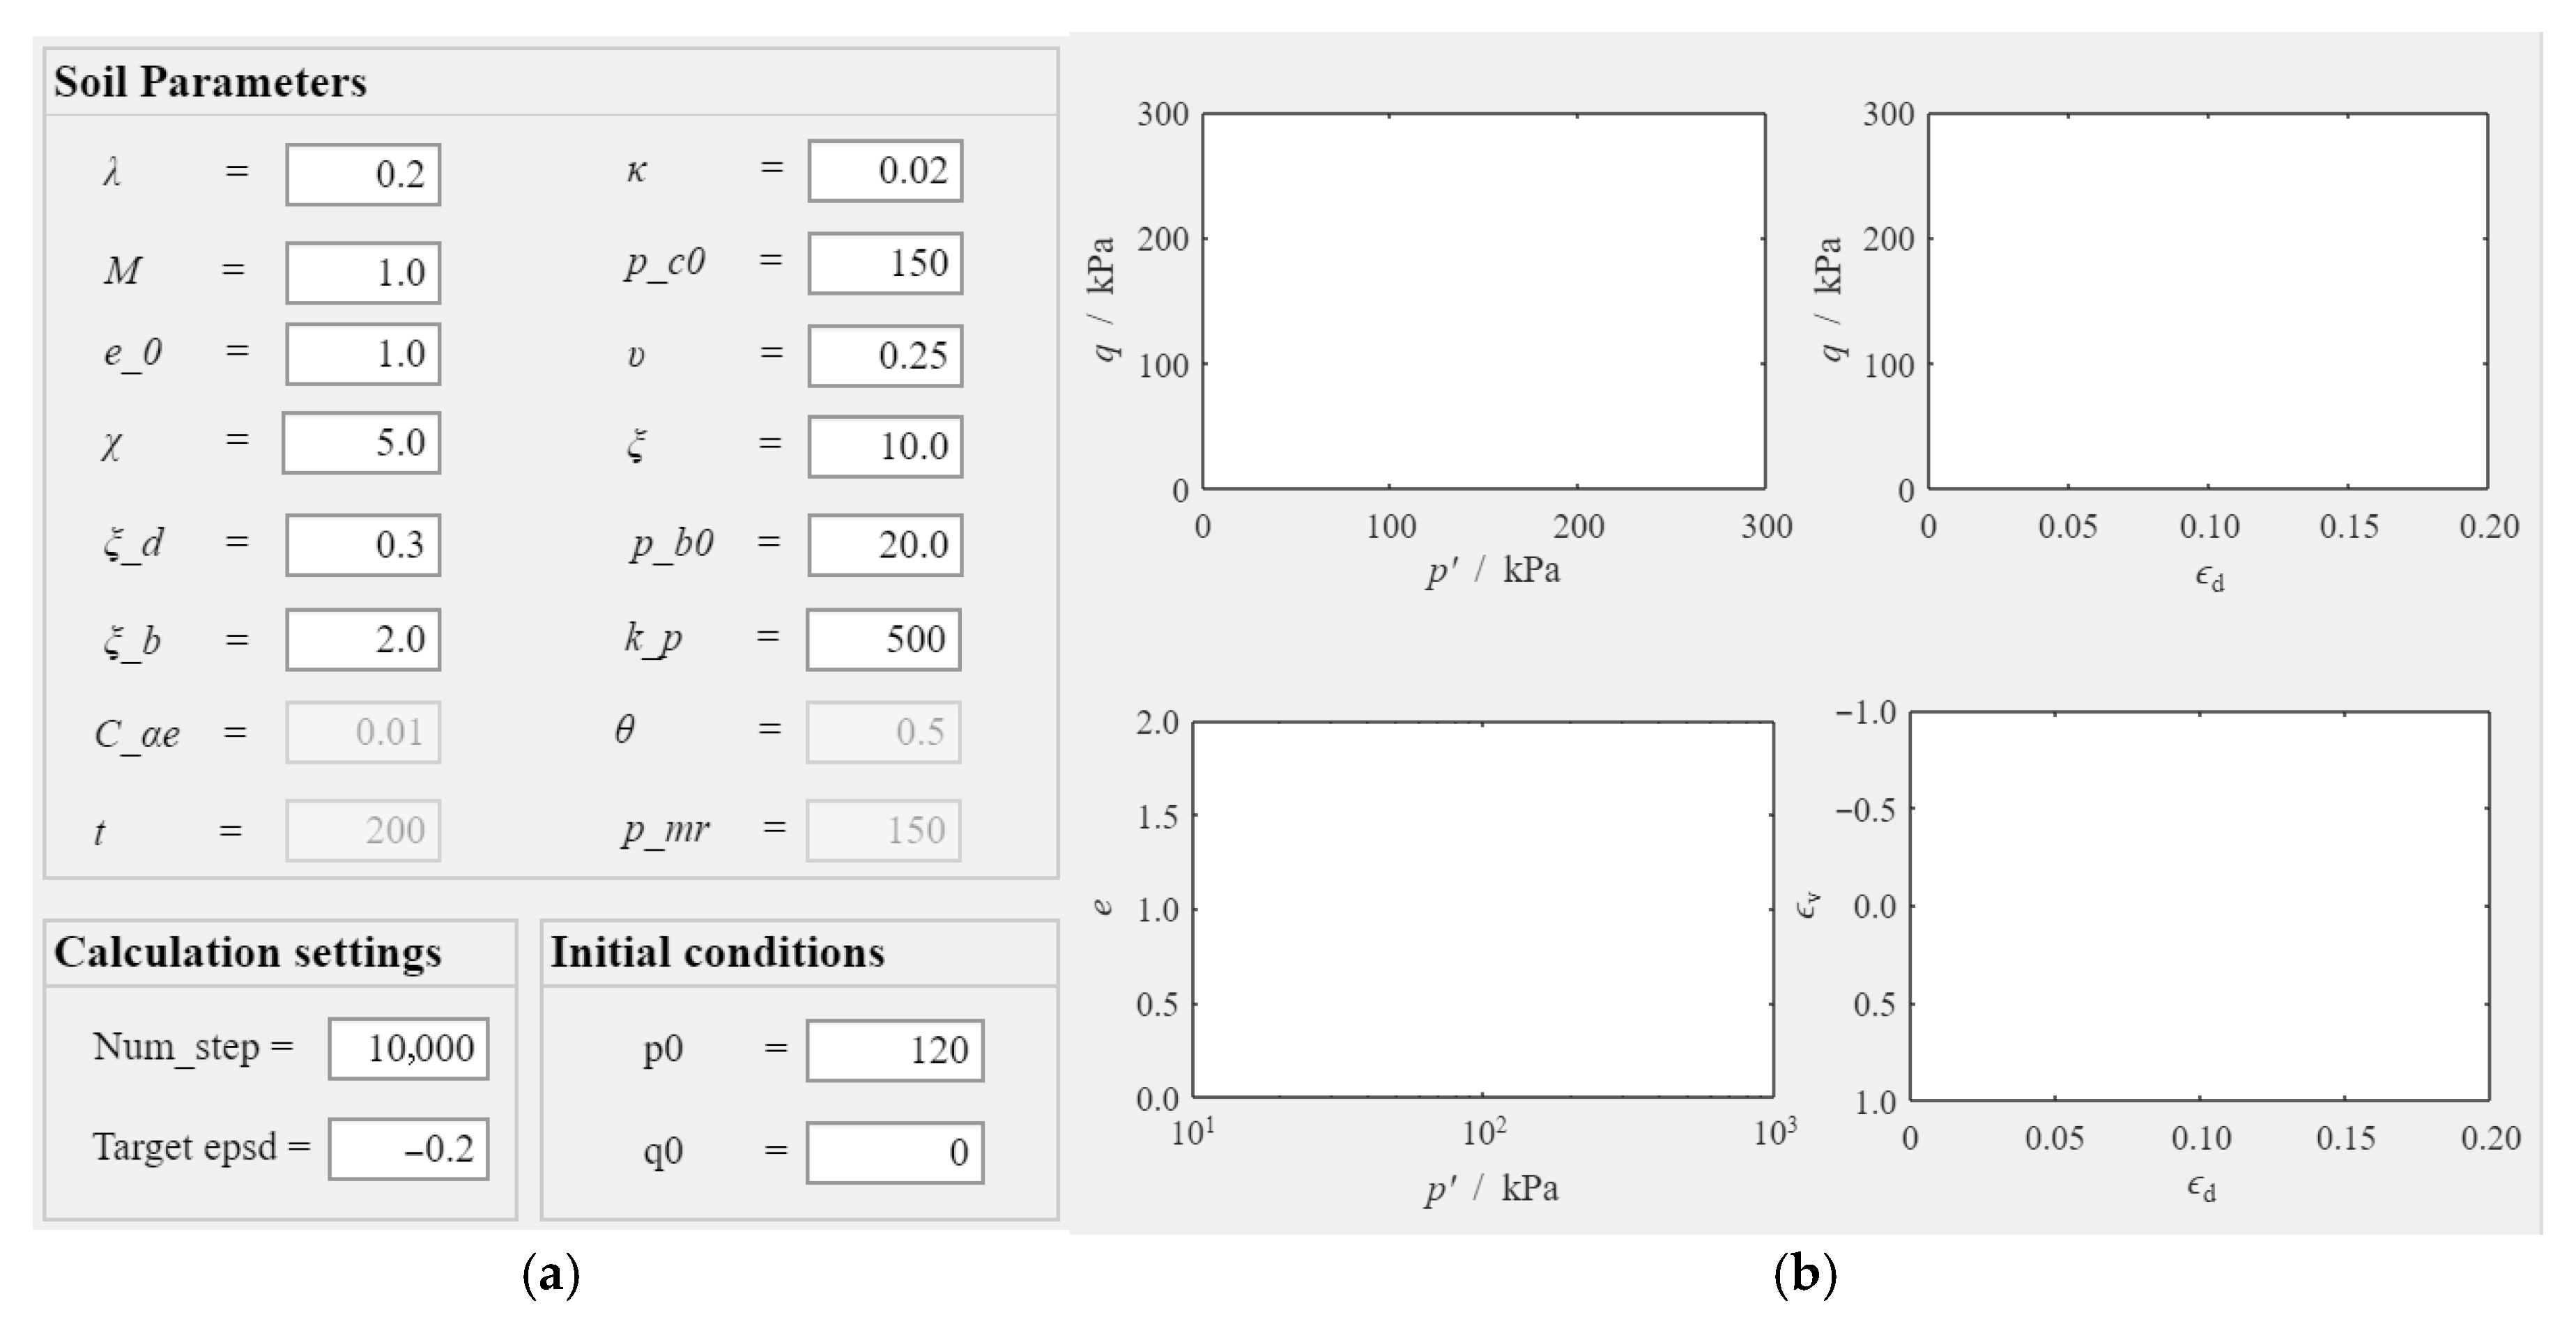
Finally, adjust the font style, font size, background, and border formats for both the text and values. Following this methodology, the design of the “Calculation settings” and “Initial conditions” panels is completed. Figure 4a presents the data input module interface for soil parameters, calculation settings, and initial conditions.
In this technology, the digital teaching platform integrates the ASCM model and the ANICREEP model. To this end, the parameter input panel is designed to encompass all parameters required for both models, as well as the integration parameter θ and loading time t needed for the ANICREEP model. To enhance user convenience, the platform defaults to enabling input for the parameters of the ASCM model. In this configuration, the input fields for the specific parameters of the ANICREEP model have their “Enable” attribute set to “Off”, rendering these input fields gray and non-editable, as shown in Figure 4a. This effectively guides users and prevents data input errors.
Introduce six axes’ components by dragging them into the “Design View”. Adjust their dimensions accordingly. Modify the labels for both the horizontal and vertical axes. Within the “Components Browser”, rename each axis object to “UIAxes_x” (e.g., “UIAxes_1” through “UIAxes_6”).
Axes “UIAxes_1” to “UIAxes_4” are employed to display simulation results from triaxial undrained tests, triaxial drained tests, and constant-p’ tests, including stress–strain curves such as q-p’, q-εd, e-p’, εv-εd. For creep tests, axes “UIAxes_5” and “UIAxes_6” are utilized to replace “UIAxes_3” and “UIAxes_4”, thereby enabling the visualization of creep test simulation results, specifically p’-t and εd-t curves. By default, the platform displays axes “UIAxes_1” through “UIAxes_4”, while the “Visible” property of axes “UIAxes_5” and “UIAxes_6” is set to “Off”, making these two axes invisible by default, as illustrated in Figure 4b.

3.2. Constitutive Model and Test Type Module

Two radio button groups are introduced into the “Design View”. Label these groups “Constitutive model” and “Test type”. These components are implemented to enable users of the digital teaching platform to select and switch between different constitutive models and test types.
Under the “Constitutive Model” radio button group, two buttons are configured and renamed to “ASCM Model” and “ANICREEP Model”. Within the “Component Browser”, the internal names are further renamed to “ASCMModelButton” and “ANICREEPModelButton”, facilitating the implementation of calculations for different constitutive models based on user selection in the computational program. Similarly, under the “Test type” radio button group, four buttons are established. Their displayed names are adjusted to “Conventional undrained”, “Conventional drained”, “Constant p”, and “Creep”. These correspond to triaxial undrained tests, triaxial drained tests, constant-p’ tests, and creep tests, respectively. In the “Components Browser”, the internal names are modified to “ConventionalundrainedButton”, “ConventionaldrainedButton”, “ConstantpButton”, and “CreepButton”. This organization enables the computational program to execute calculations for different types of tests based on user selection.
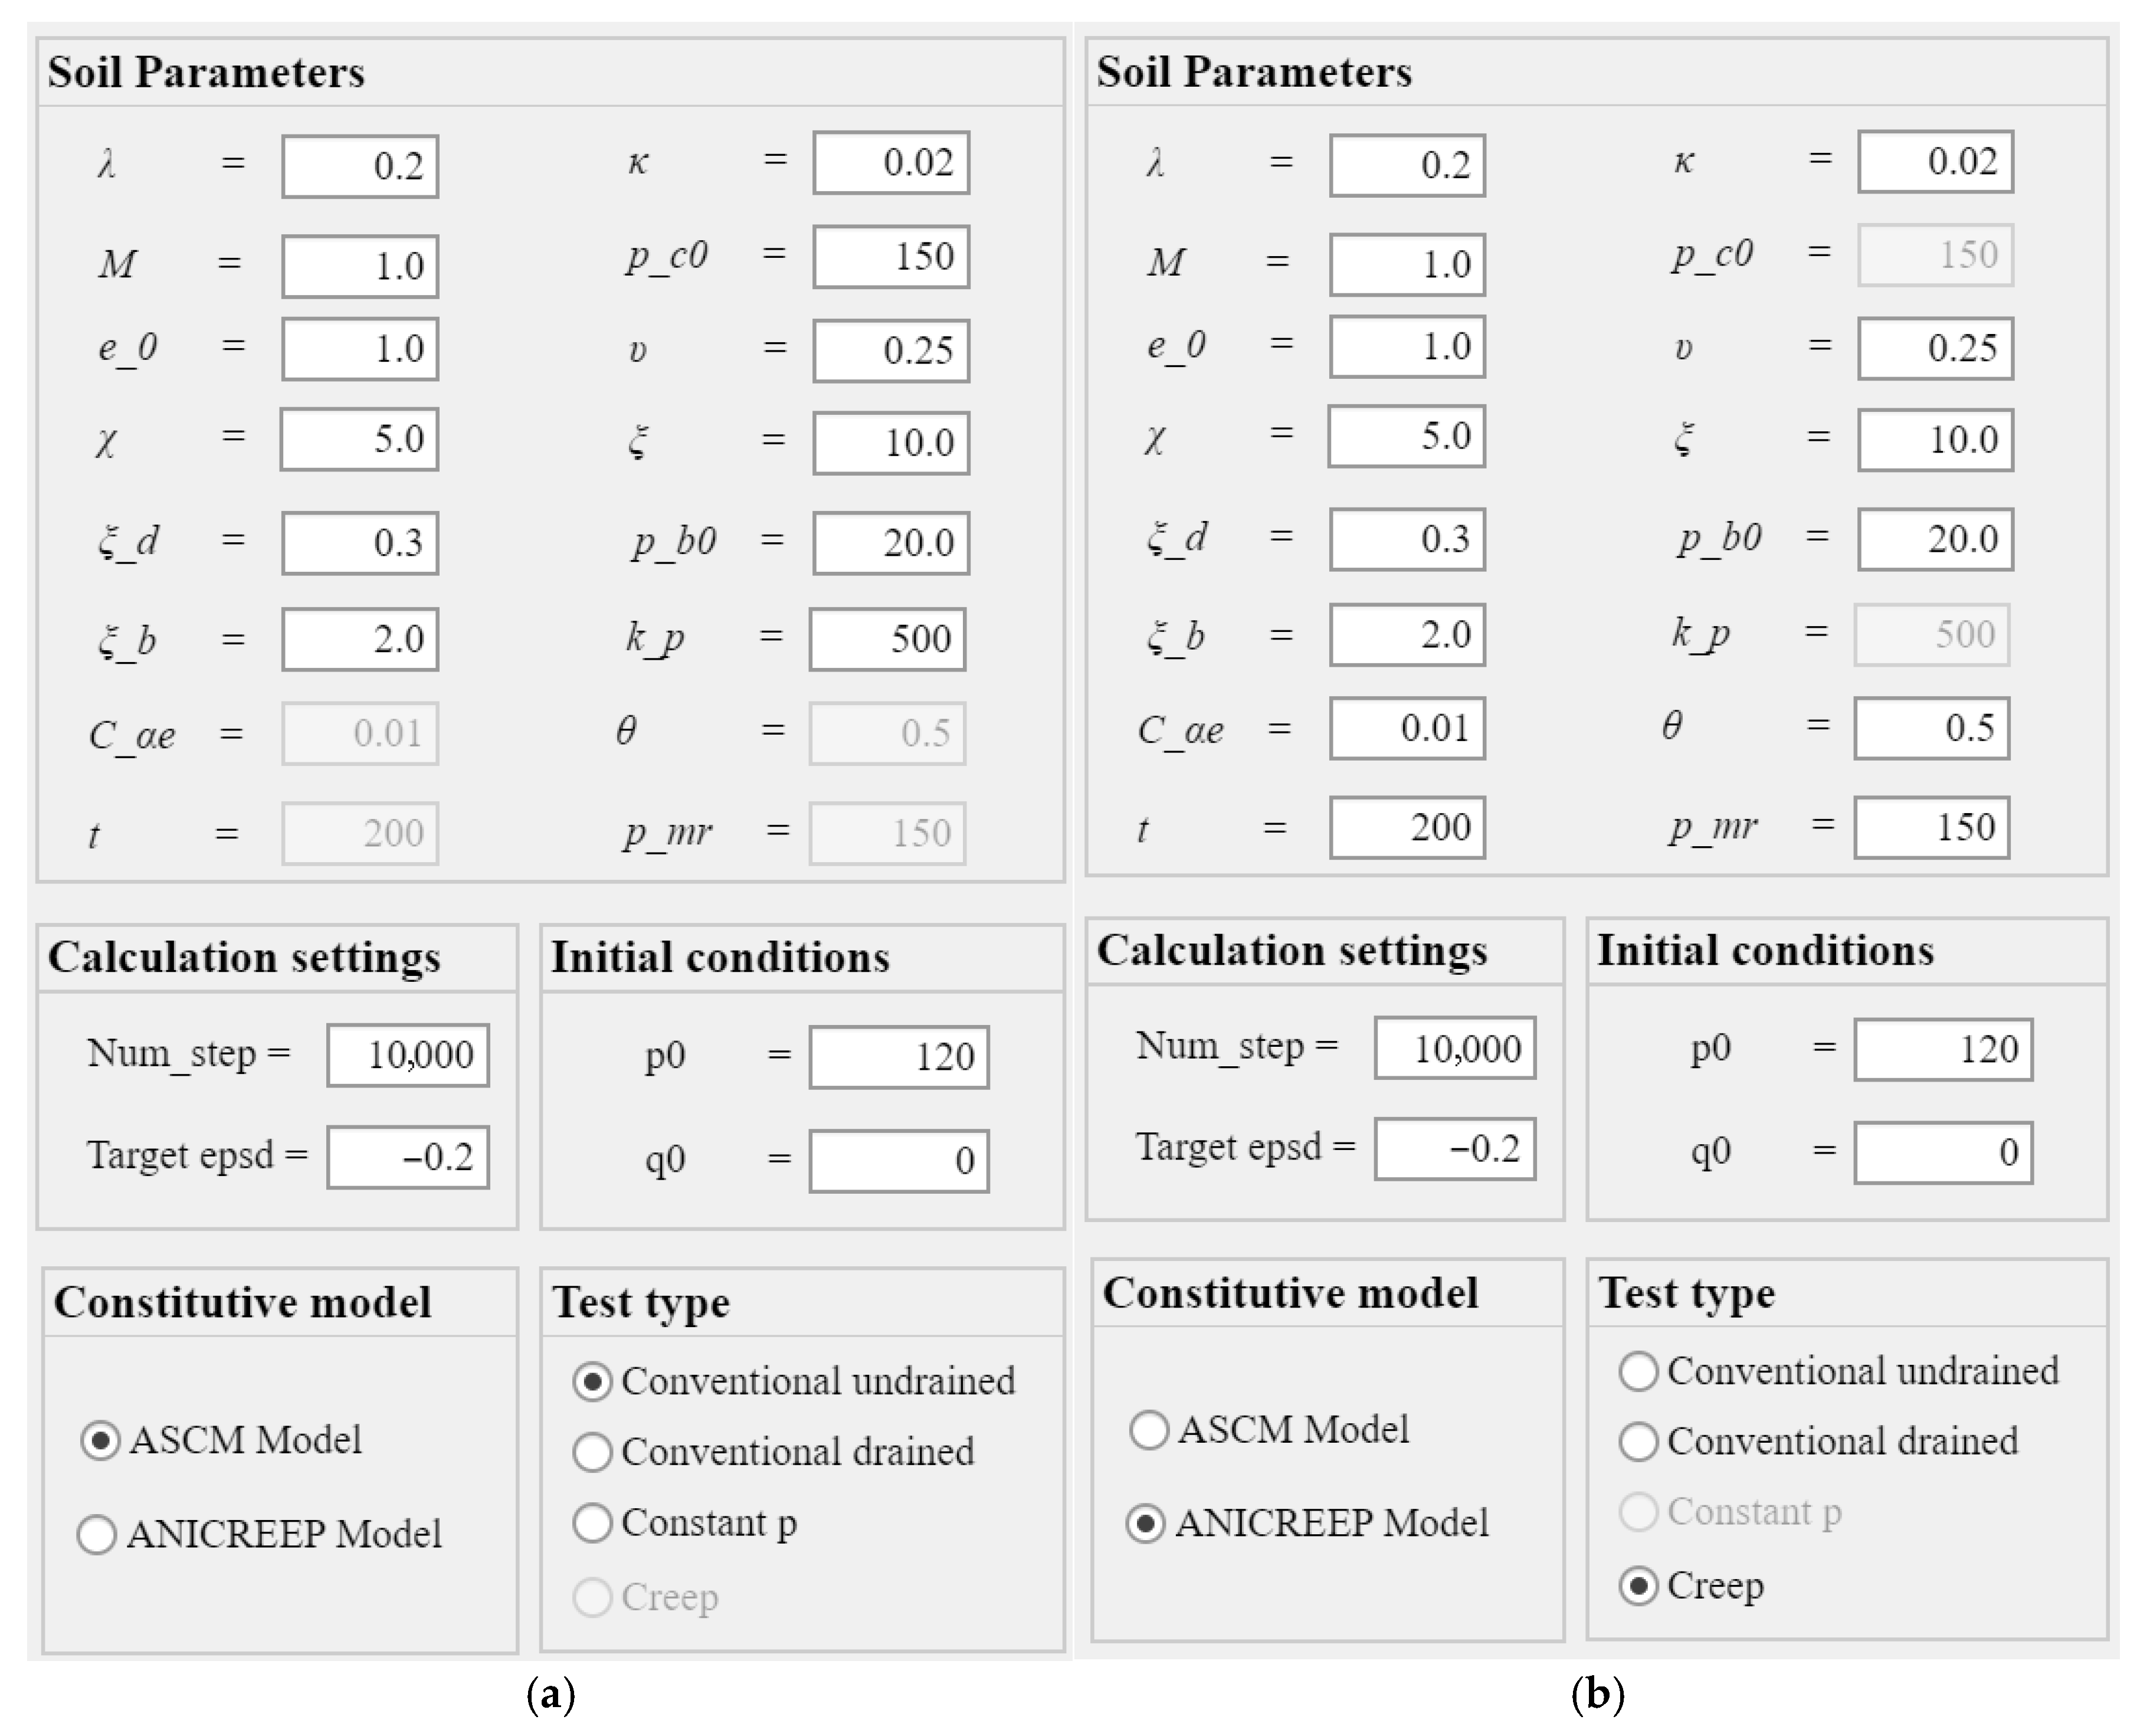
As previously mentioned, the parameter input module encompasses all parameters for the two constitutive models. Notably, the ASCM model is incapable of simulating creep tests, while the ANICREEP model does not accommodate the constant-p’ test simulation. Therefore, upon switching constitutive models, the digital teaching platform should implement the following functionality: after the switch, the specific parameters of the current model should be set to an input-enabled state, while the associated test types should also transition to a selectable state. Conversely, the specific parameters of the other model should be set to an input-disabled state, and its associated test types should correspondingly become unselectable.
To implement the aforementioned functionality, select the “Constitutive model” panel. Right-click on it, or, in the “Components Browser” select “ConstitutivemodelButtonGroup” and right-click. Subsequently, navigate through “Callbacks” and choose “Add SelectionChangedFcn callback” to establish the button callback function “ConstitutivemodelButtonGroupSelectionChanged (app, event)”. Then, in the “Code View”, programmatically manage the switching of model parameter editability and associated test type selectability.
(1) Obtain the string representation of the currently selected model name using “app.ConstitutivemodelButtonGroup.SelectedObject”;
(2) Utilize “switch” and “case” statements to determine the string of the current constitutive model, and then toggle the input states of the model-specific parameters and the selectable states of the associated test types:
① When the user selects the ANICREEP model (case ‘ANICREEP Model’), set the “Enable” property of the input fields for variables such as Cαe, pmr, θ, and t to “On” (e.g., app.p_mrEditField.Enable = ‘on’), while setting the “Enable” property of the input fields for the ASCM model-specific parameters pc0 and kp to “Off” (e.g., app.p_c0EditField.Enable = ‘off’). Subsequently, set the selectable state of the “Constant p” test to “Off” (app.ConstantpButton.Enable = ‘off’) and the selectable state of the “Creep” test to “On” (app.CreepButton.Enable = ‘on’);
② When the user selects the ASCM model (case ‘ASCM Model’), set the “Enable” property of the input fields for variables such as pc0 and kp to “On”, while setting the “Enable” property of the input fields for the ANICREEP model-specific variables Cαe, pmr, θ, and t to “Off”. Set the selectable state of the “Constant p” test to “On” and the selectable state of the “Creep” test to “Off”.
Figure 5 illustrates the parameter input availability and test type selectability across different constitutive models. Specifically, when the ASCM model is selected, the specific variables Cαe, pmr, θ, and t of the ANICREEP model are in a non-input state, and the “Creep” test is also unselectable. Conversely, when the ANICREEP model is selected, Cαe, pmr, θ, and t become input-enabled, while the specific parameters pc0 and kp of the ASCM model are unavailable, rendering the “Constant p” test unselectable.
Furthermore, when the ANICREEP model is selected, the platform should also support dynamic adjustment of the plotting area’s visibility when switching between creep tests and other test types. To achieve this, a callback function named “TesttypeButtonGroupSelectionChanged (app, event)” is established for the “Test type” panel. Subsequently, the dynamic adjustment of the plotting area’s visibility is implemented programmatically within the “Code View”:
(1) Retrieve the string representing the selected test type by using “app.TesttypeButtonGroup.SelectedObject”;
(2) Use “switch” and “case” statements to determine the string of the current constitutive model, and then toggle the visibility and invisibility of the axes:
① When the “Creep” test is selected (i.e., case ‘Creep’), the visible property of “UIAxes_3” and “UIAxes_4” is set to “Off” (e.g., app.UIAxes_3.Visible = ‘off’), and, subsequently, the visible property of “UIAxes_5” and “UIAxes_6” is set to “On”;
② When other test types are selected, the visible property of “UIAxes_3” and “UIAxes_4” is set to “On”, and then the visible property of “UIAxes_5” and “UIAxes_6” is set to “Off”.

3.3. Loading Control Module

A button component is introduced into the “Design View”. Its displayed text is then modified to “RUN”, and its name is changed to “RUNButton” in the “Component Browser”. Subsequently, the “RUN” button is selected, and a callback function named “RUNButtonPushed (app, event)” is established.
The implementation of the “RUNButtonPushed” callback function within the “Code View” is critical for platform development. This function encompasses reading user-inputted soil parameters, calculating control parameters, and initial stress condition parameters. It also involves writing the main program for triaxial tests based on two constitutive models, determining the user-selected test type, and executing the corresponding loading calculations and state variable logging. User-inputted parameters are passed to the “RUNButtonPushed” callback function via their parameter names in the “Component Browser”. For instance, the code “dlambda = app.lamdaEditField.Value” assigns the value of the interface parameter “λ” to the local variable “dlambda” within the callback function. Following this methodology, all soil parameters, calculation control parameters, and initial stress condition parameters can be successfully transferred to the “RUNButtonPushed” callback function.
Upon the user’s selection of a constitutive model, the corresponding model type button is set to true. For instance, when the user selects the “ANICREEP Model”, the value of “app.ANICREEPModelButton.Value” becomes true. In the main program, different constitutive models can be invoked by checking the values of the two model buttons. Similarly, when a test type is chosen, its respective button is set to true. For example, when the “Conventional Undrained” test is selected, the value of “app.ConventionalundrainedButton.Value” becomes true. The main program can subsequently execute different types of triaxial tests by assessing the values of the four test type selection buttons.

3.4. Result Display and Clear Module

Within the “RUNButtonPushed” callback function, the “plot” command can be utilized to visualize the state variables recorded during the simulation. By employing the “hold on” command, previously simulated curves in the axes are preserved, allowing new simulation curves to be added to the same axes. This capability facilitates an intuitive comparison of simulation results obtained with different parameters.
In the “Design View”, a button was added, and its text label was modified to “CLEAR”. In the “Component Browser”, this button’s name was changed to “CLEARButton”. Subsequently, a callback function named “CLEARButtonPushed (app, event)” was established for the “CLEAR” button. Within the “Code View”, the “cla(app.UIAxes_x)” command is employed to clear the plotted results from each axis.

4. Digital Teaching Platform Application

The default interface of the digital teaching platform for triaxial tests based on the saturated clay constitutive models, namely, the Saturated Clay Constitutive Modelling Platform, is illustrated in Figure 6. Users can select different constitutive models and corresponding test conditions, input various soil parameters, and initiate simulations by clicking the “RUN” button. Upon execution, the platform displays the soil’s stress path, stress–strain relationships, void ratio evolution, and dilatancy or contraction characteristics. During operation, this interactive platform facilitates a comprehensive understanding for students regarding the influence of different factors on soil shear strength and deformation, thereby enhancing teaching efficiency and effectiveness. Furthermore, by incorporating breakpoints within the “Code View”, students can explore the program’s execution flow and the state variables at specific points, enabling them to correlate mathematical formulations with their programmatic implementations. This capability significantly boosts teaching efficiency and fosters independent learning among students.
Two sets of triaxial testing teaching case studies were generated by simulating the mechanical behavior of saturated clay under various experimental conditions and parameters using the ASCM and ANICREEP models, respectively.

4.1. Case 1: Triaxial Test Simulations Using ASCM Model

This case study demonstrates the mechanical properties of structured clay under various testing conditions, namely, triaxial undrained tests, triaxial drained tests, and constant-p’ tests, as well as under different structural parameters.

4.1.1. Effect of Different Test Conditions

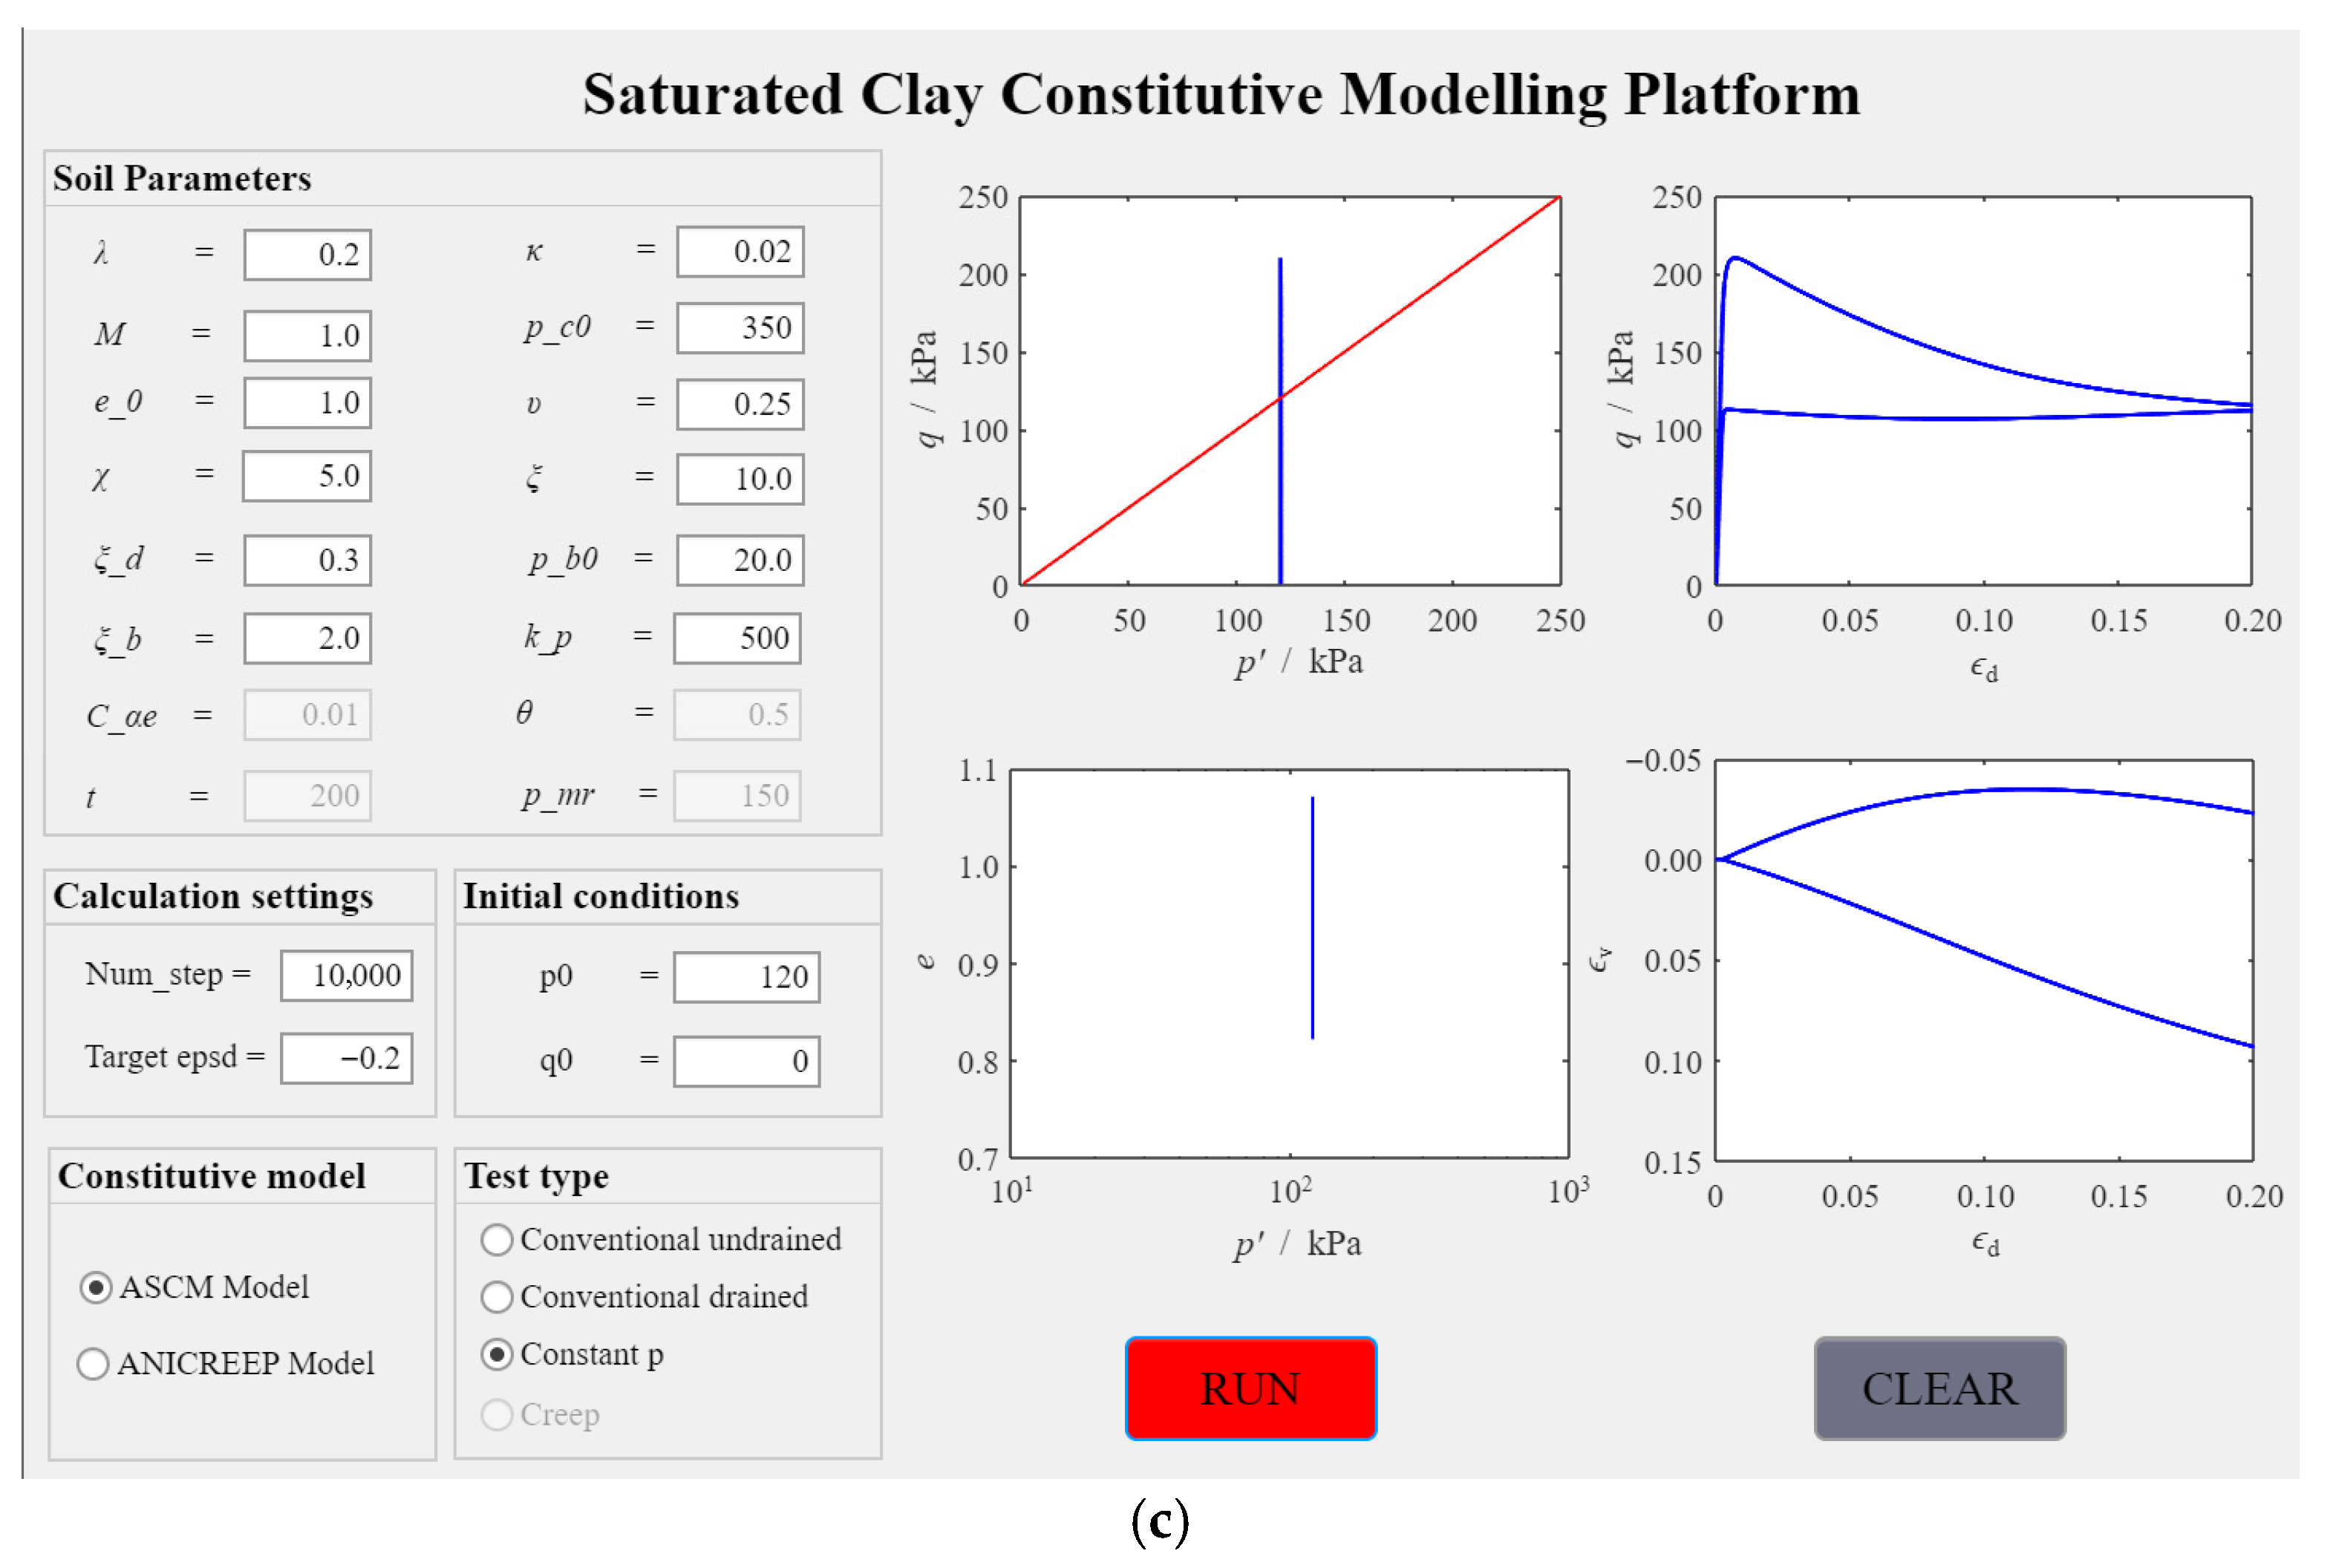
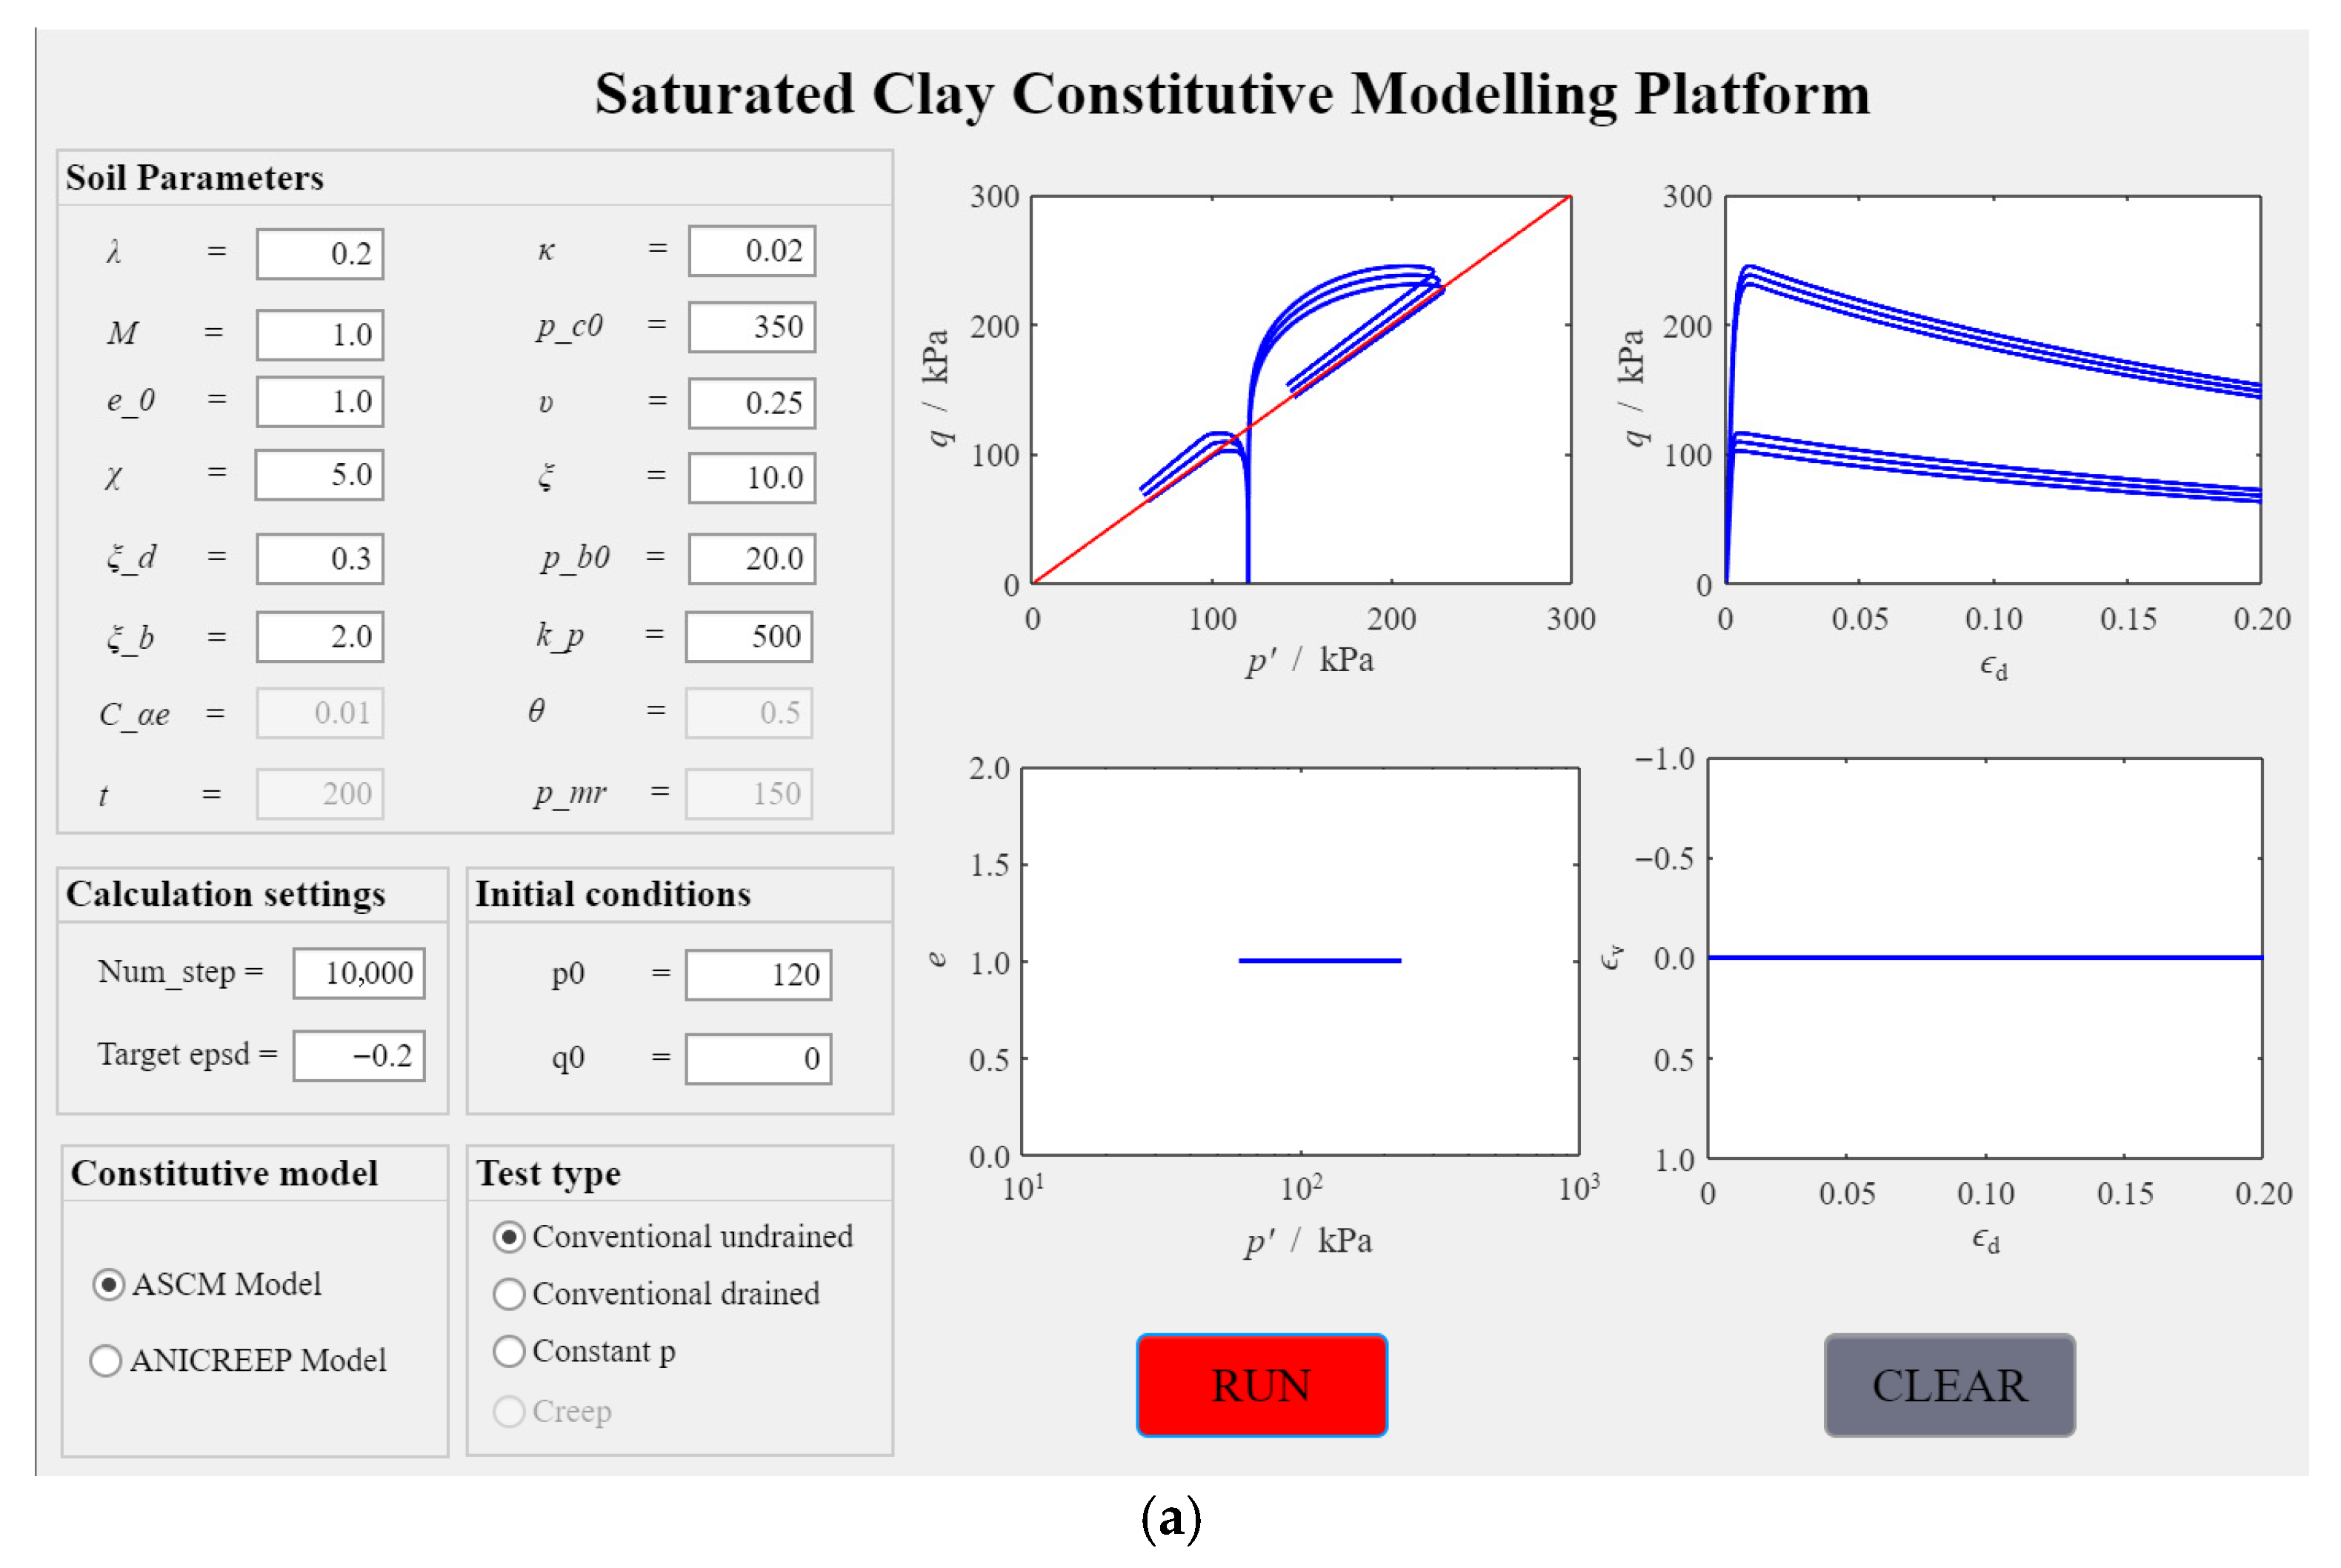
Figure 7 presents the computational results under different testing conditions and provides a comparative analysis of the effects of two initial bounding surface sizes (pc0 = 150 kPa and 350 kPa) on soil properties. The red line represents the critical state line with a slope of M. For the three different test conditions, the peak deviatoric stress q for pc0 = 350 kPa is significantly higher than that for pc0 = 150 kPa. In the undrained tests, the soil’s void ratio e and volume strain εv remain constant during loading, while the deviatoric stress q decreases after reaching its peak due to the structural disturbance of bonding and adhesive stress of clay. For drained and constant-p’ tests, the structured clay exhibits dilatancy and softening when pc0 = 350 kPa, whereas contraction and hardening are observed when pc0 = 150 kPa. Furthermore, the q-p’ relationship in the drained test is a straight line with a slope of 3, while for constant-p’ tests it is represented by a vertical line.

4.1.2. Influence of Soil Parameters

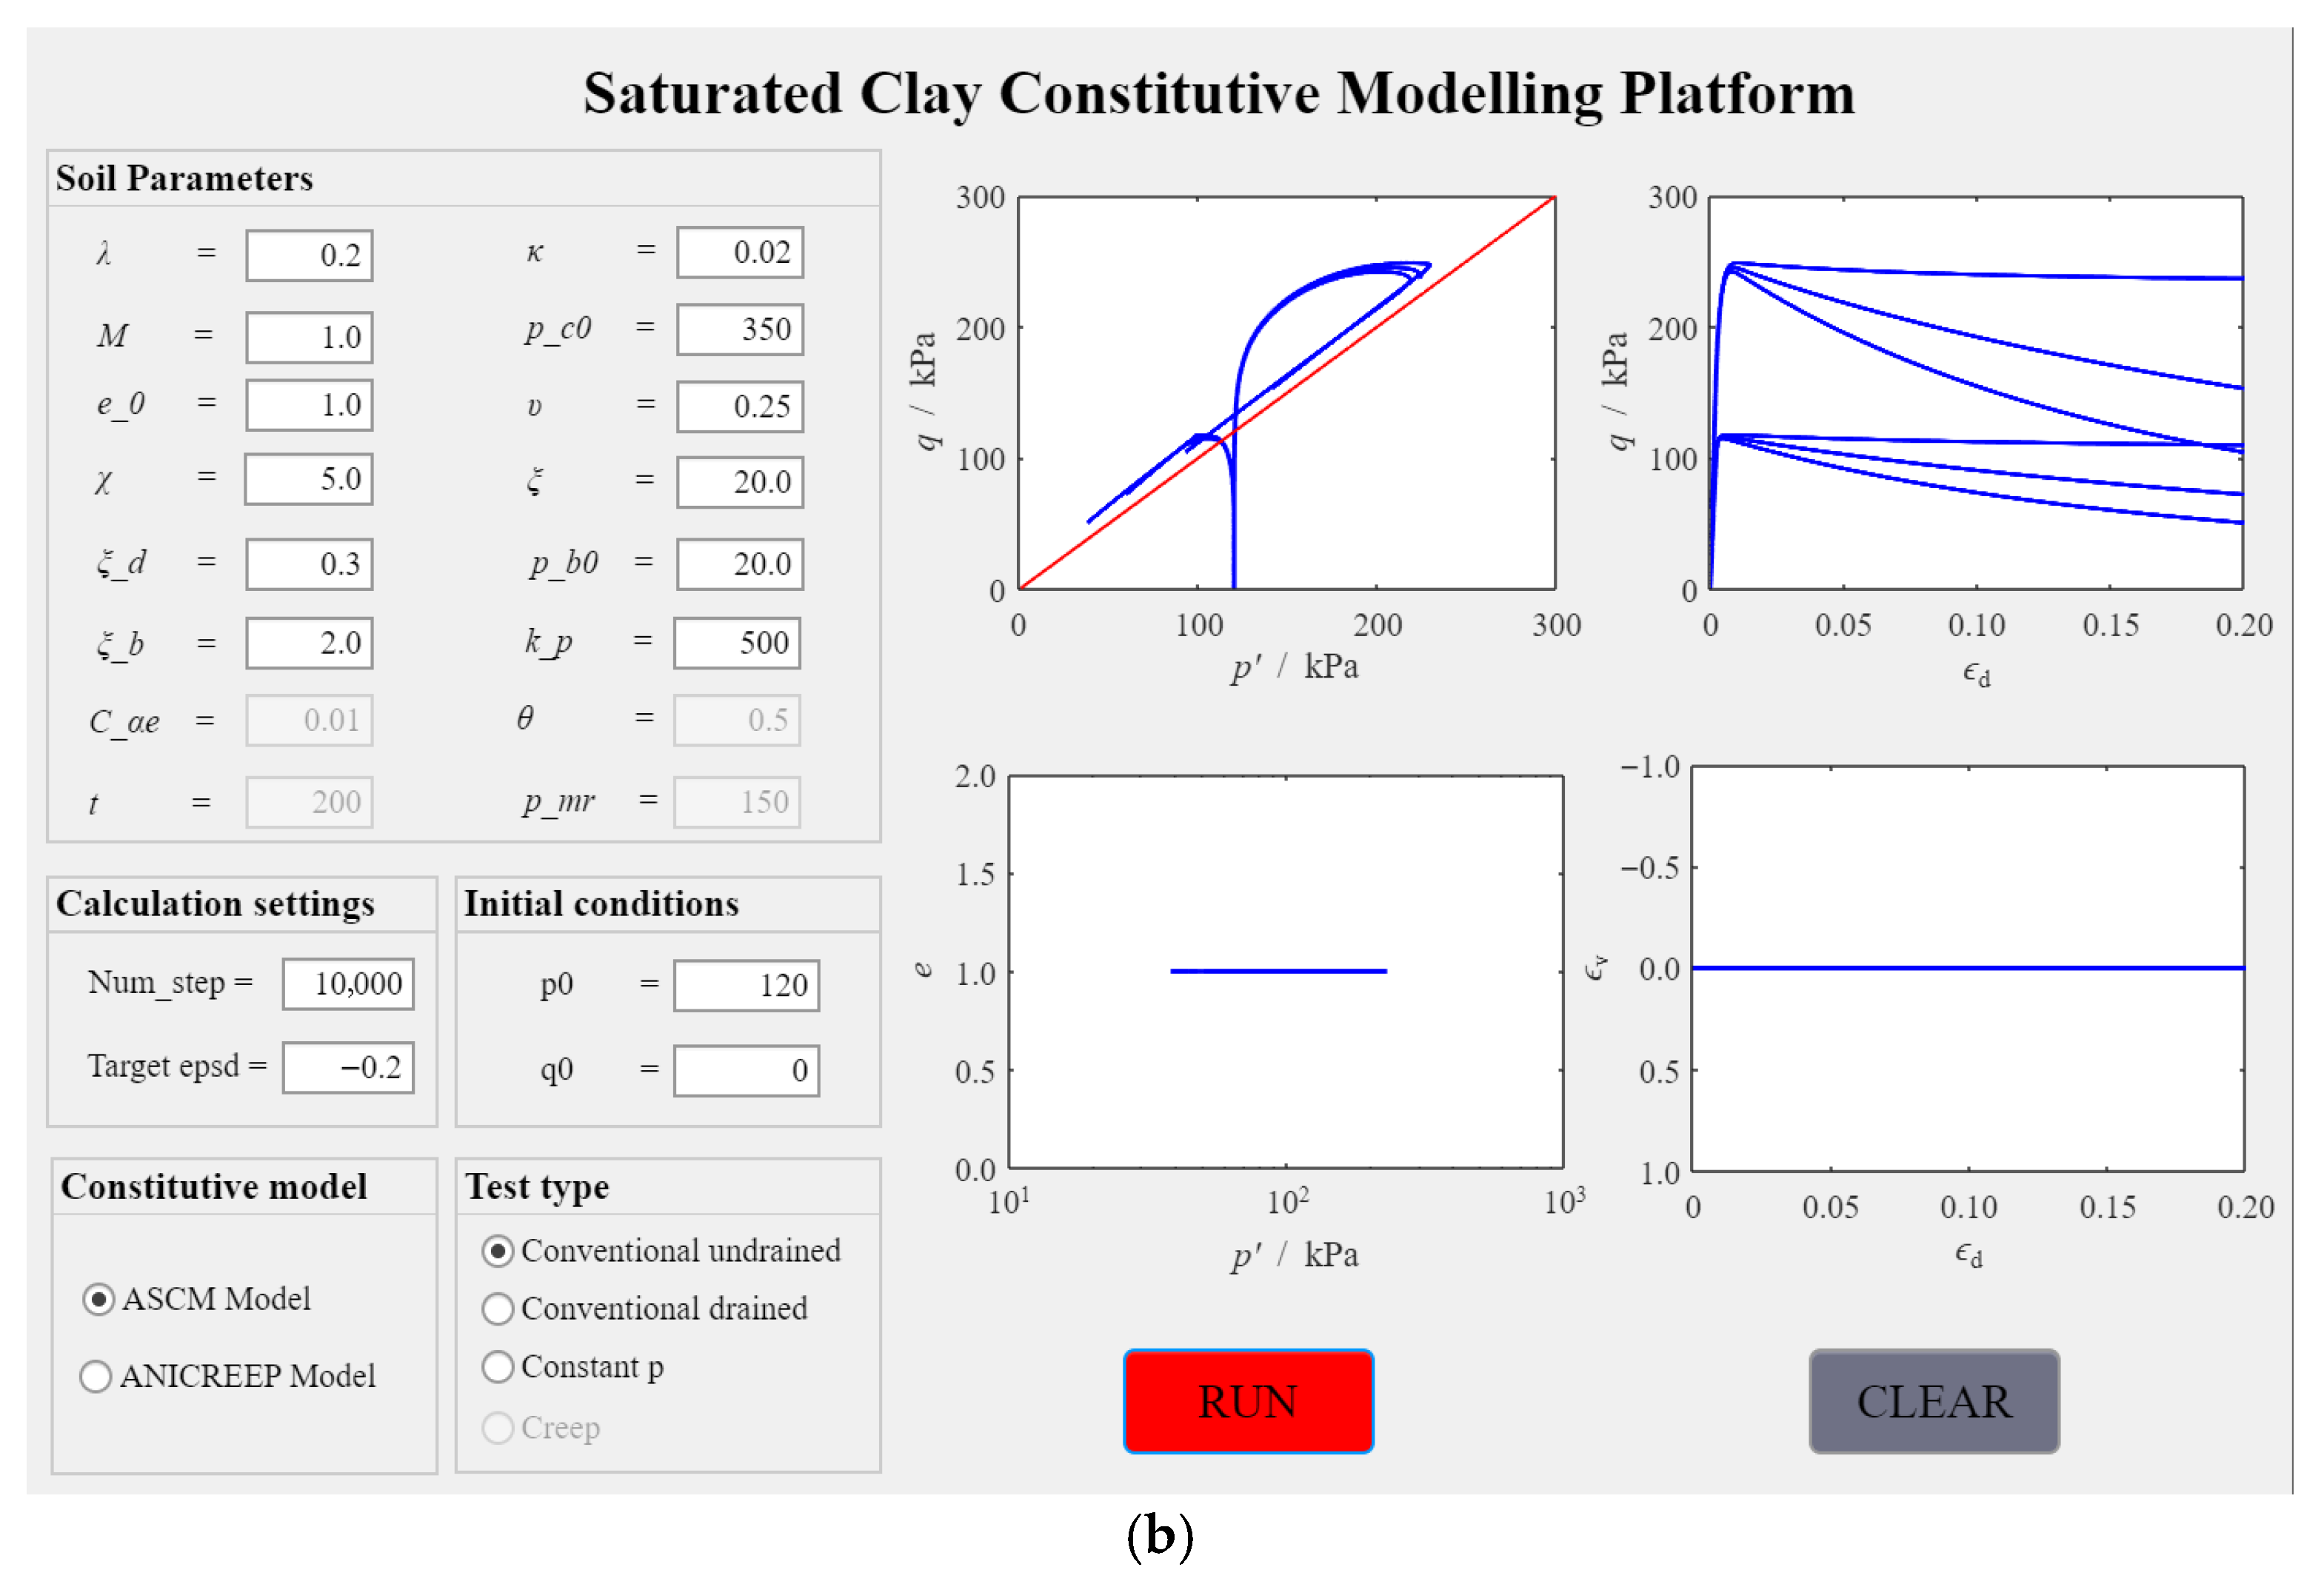
Figure 8a investigates the influence of adhesive stress on soil properties under undrained conditions and compares three initial adhesive stress conditions (pb0 = 0 kPa, 10 kPa, and 20 kPa). It can be observed that for the two initial bounding surface sizes (pc0 = 150 kPa and 350 kPa), an increase in the initial adhesive stress leads to an increase in the peak deviatoric stress q of the soil. Figure 8b compares the effects of three different values of the adhesive stress degradation rate control parameter (ξb = 0, 2, and 10) on soil properties when pb0 = 20 kPa. It can be seen that as ξb increases the deviatoric stress q decreases more rapidly with the shear strain εd.
Figure 9a investigates the influence of bonding ratio on soil properties under undrained test conditions and compares three initial bonding ratio conditions (χ0 = 0, 5, and 10). It can be observed that for the two initial bounding surface sizes (pc0 = 150 kPa and 350 kPa), increasing the bonding ratio of the soil makes the soil show an initial high stiffness. However, the deviatoric stress q decreases significantly with the shear strain εd after reaching the peak value. Figure 9b compares the effect of the three conditions of bonding ratio degradation rate control parameter (ξ = 0, 10, and 20) on soil properties when χ0 = 5. It can be seen that as ξ increases, the deviatoric stress q decreases more rapidly with the shear strain εd.

4.2. Case 2: Triaxial Test Simulations Using ANICREEP Model

4.2.1. Effect of Different Test Conditions

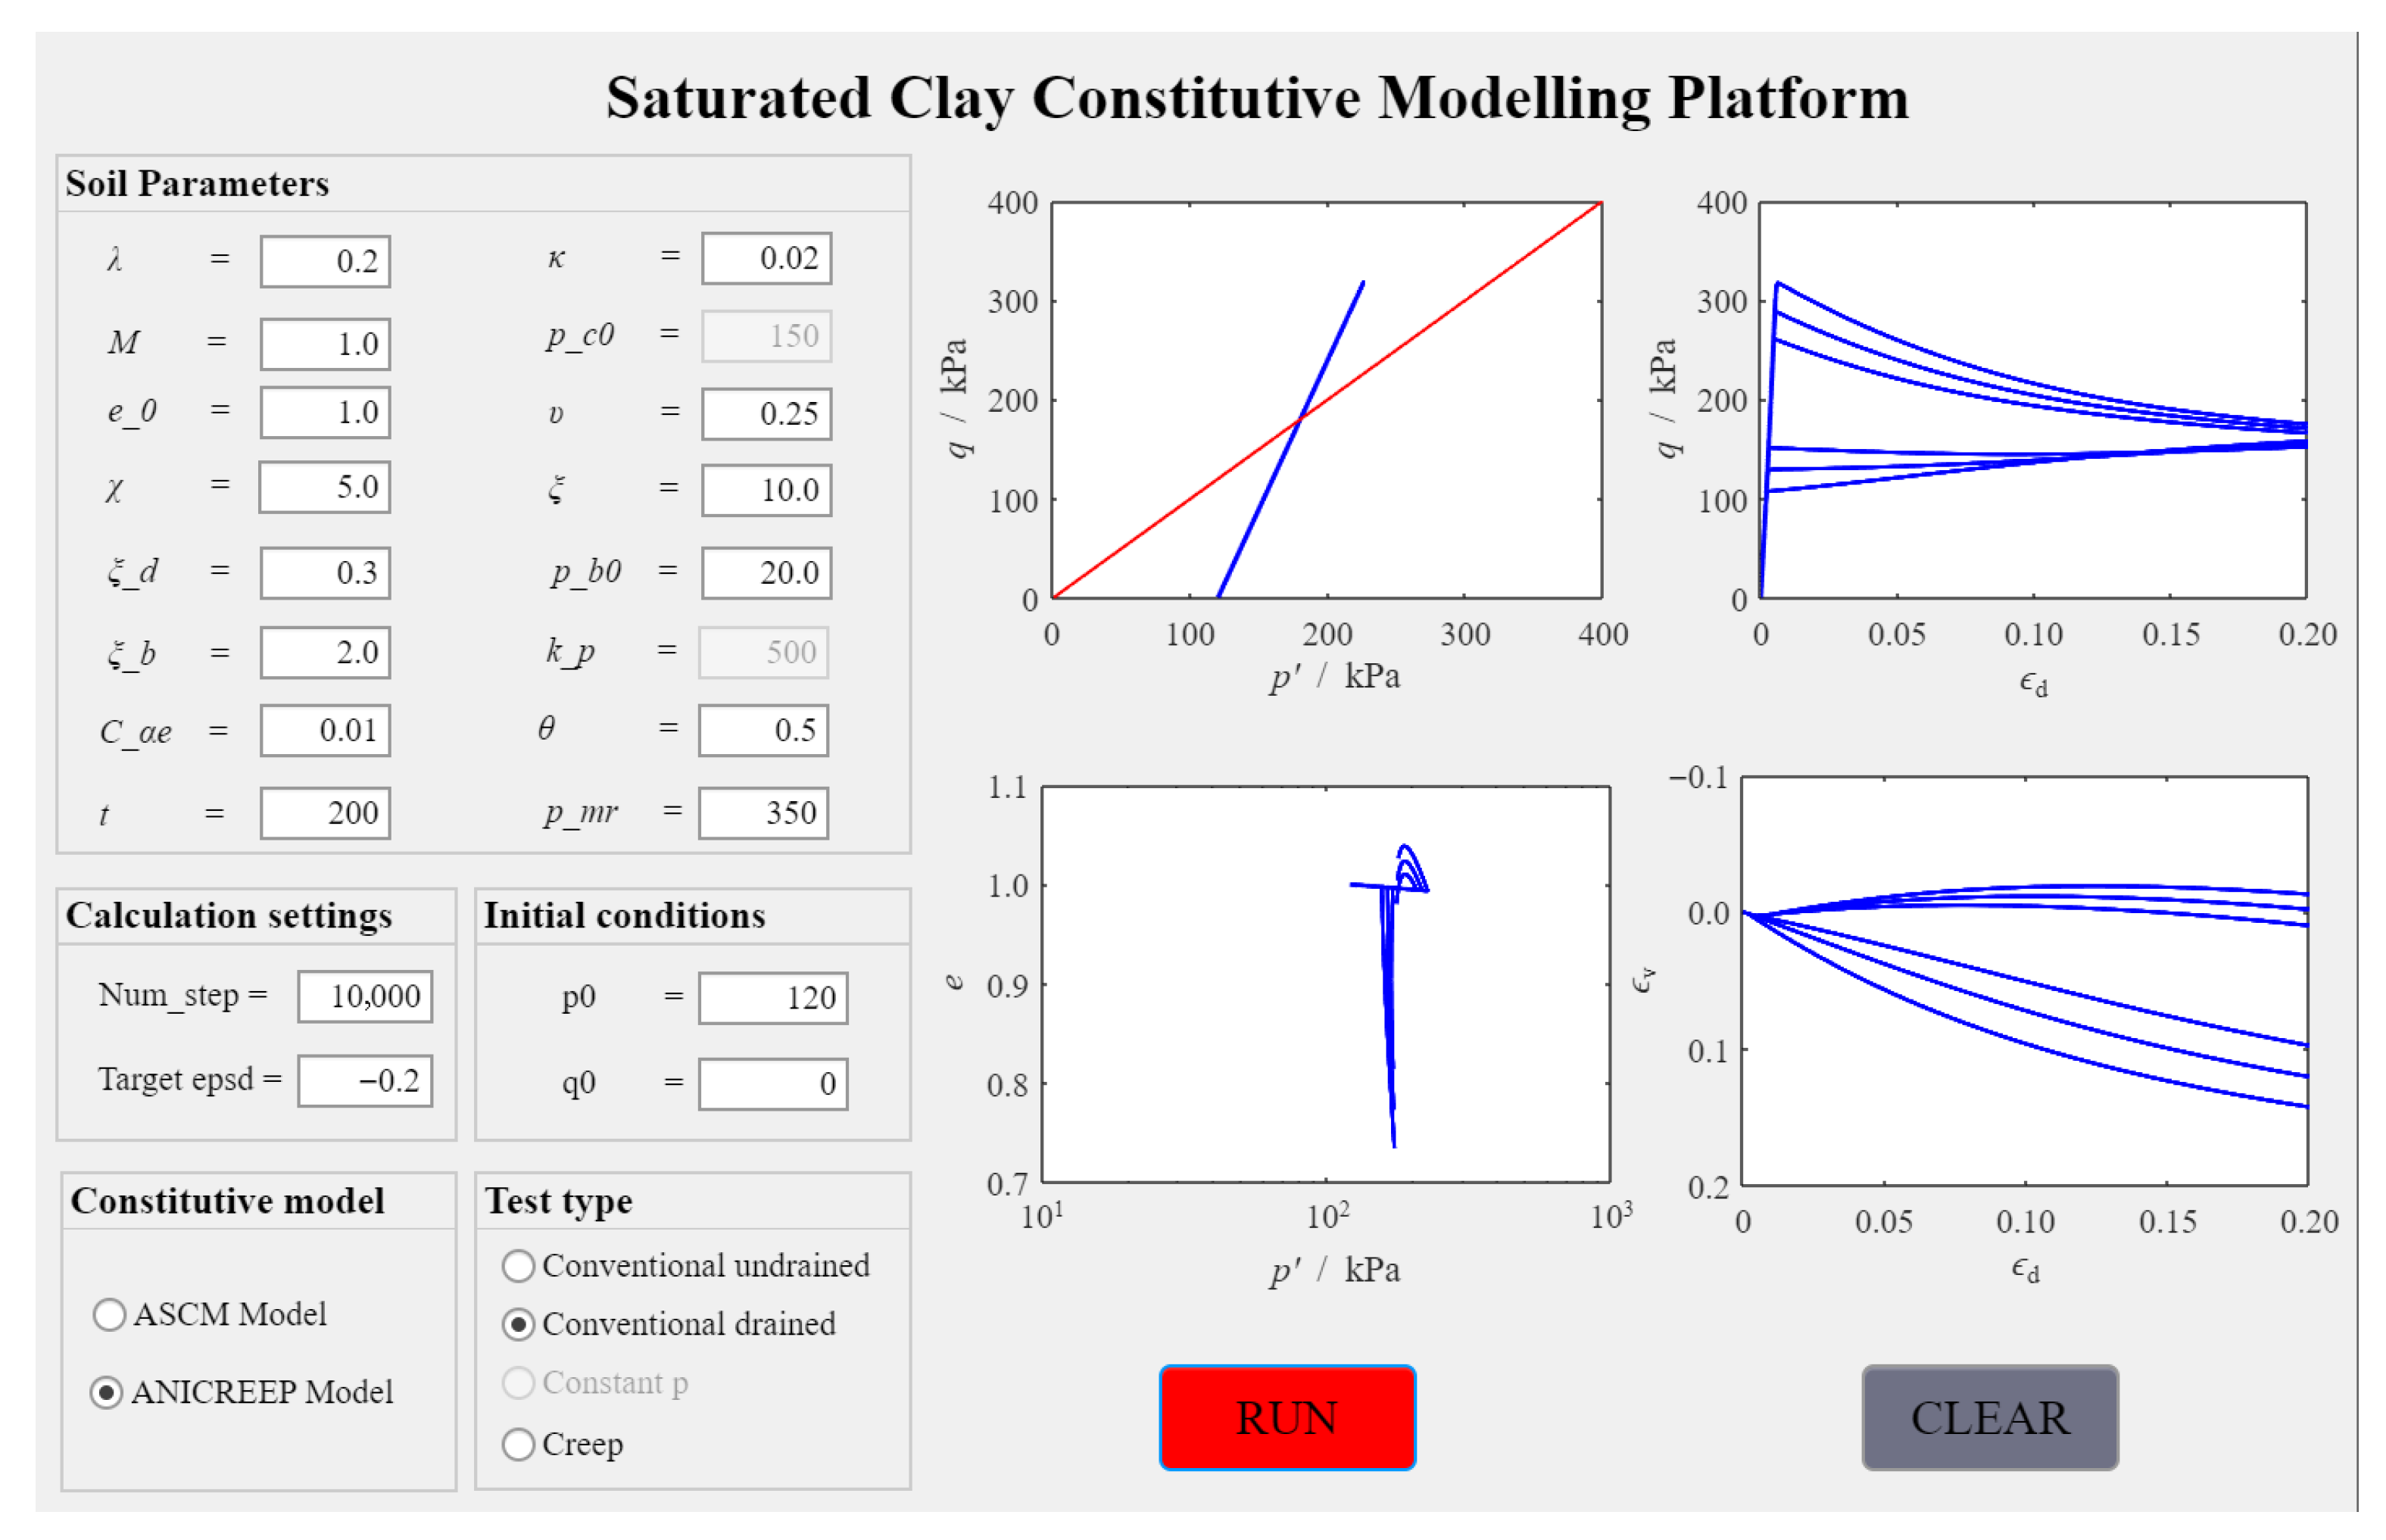
Figure 10 and Figure 11 present the simulated results of triaxial undrained and drained tests, comparing the influence of three loading durations (t = 2 h, 20 h, and 200 h) and two initial reference yield surface sizes (pmr0 = 150 kPa and 350 kPa) on soil properties. The ANICREEP model effectively captures the strain rate dependency of clay, showing higher deviatoric stresses at higher loading rates. This provides valuable empirical support and illustrative examples for students to gain a deeper understanding of the impact of loading rate on soil mechanical behavior.
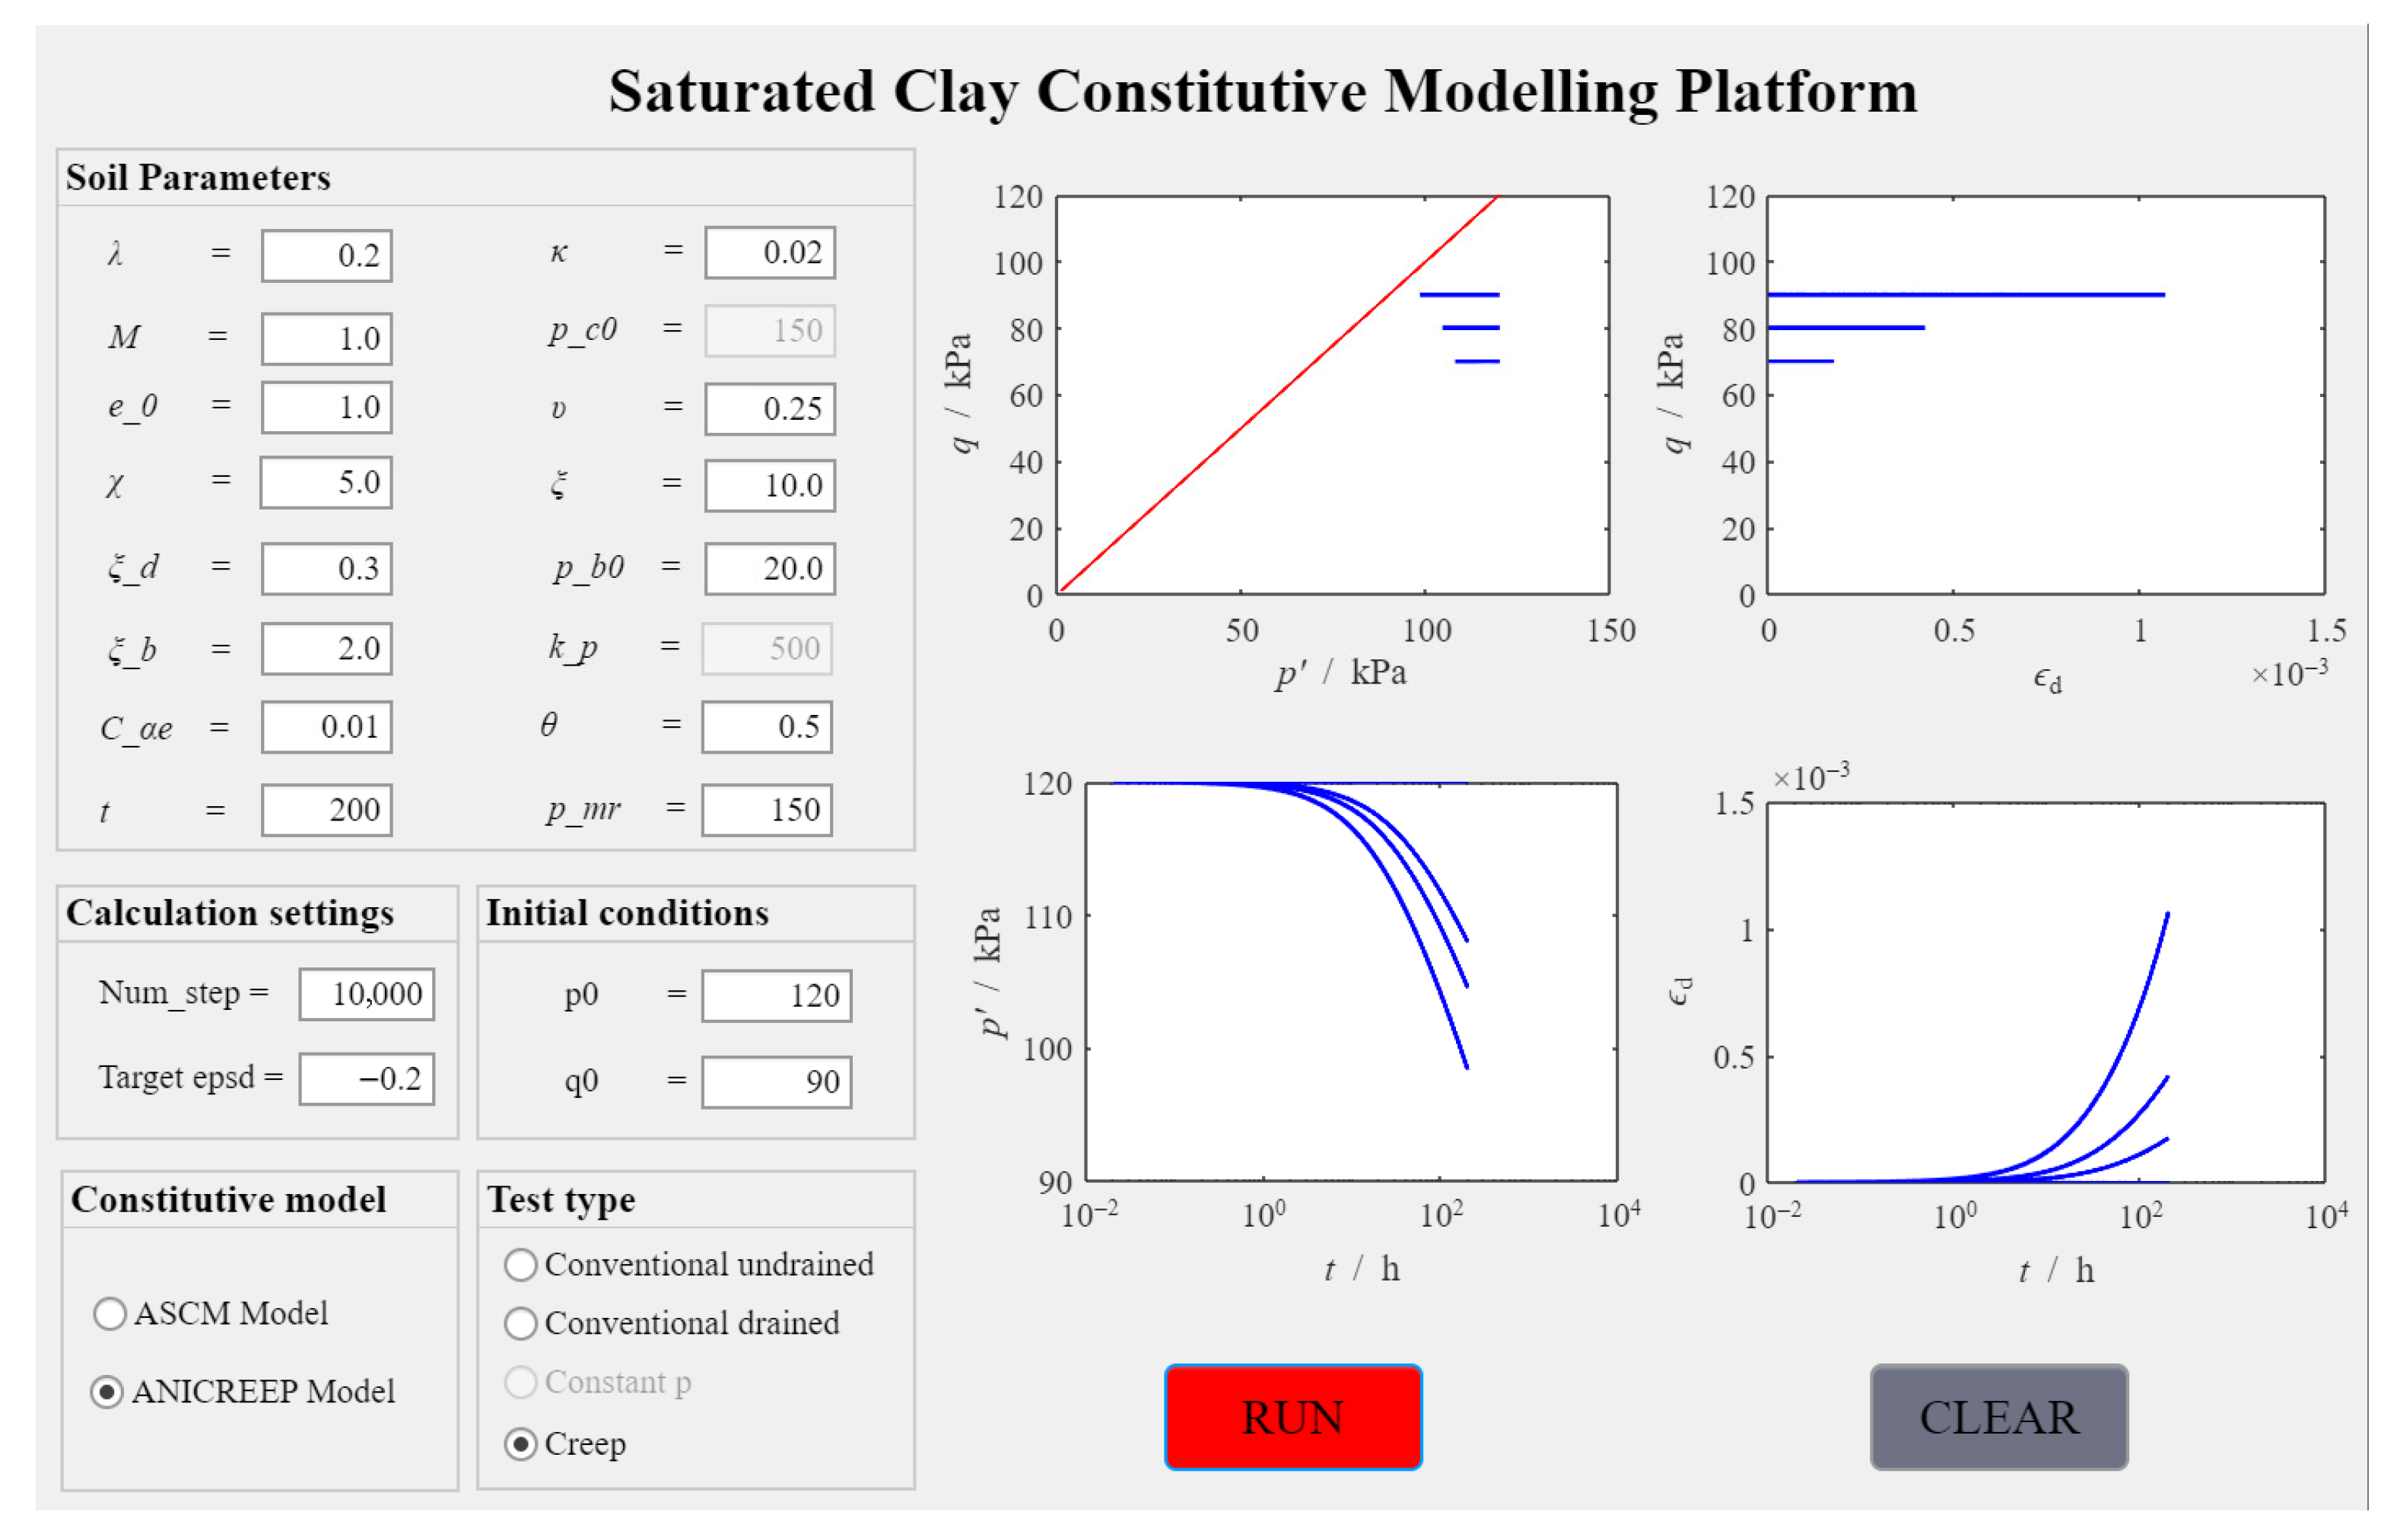
Figure 12 illustrates the creep behavior of the clay under three distinct initial deviatoric stress levels (q0 = 70 kPa, 80 kPa, and 90 kPa) and two initial reference yield surface sizes (pmr0 = 150 kPa and 350 kPa). It can be observed that when the user selects the creep test, axes “UIAxes_3” and “UIAxes_4” automatically become invisible, while axes “UIAxes_5” and “UIAxes_6” automatically become visible, displaying the p’-t and εd-t curves of the creep test. Furthermore, in the creep simulation, when pmr0 = 150 kPa, the mean stress of the soil gradually decreases with time, and a larger deviatoric stress leads to more pronounced soil creep. In contrast, at pmr0 = 350 kPa, the soil exhibits negligible creep with elapsed time due to its heavily overconsolidated state.

4.2.2. Influence of Soil Parameters

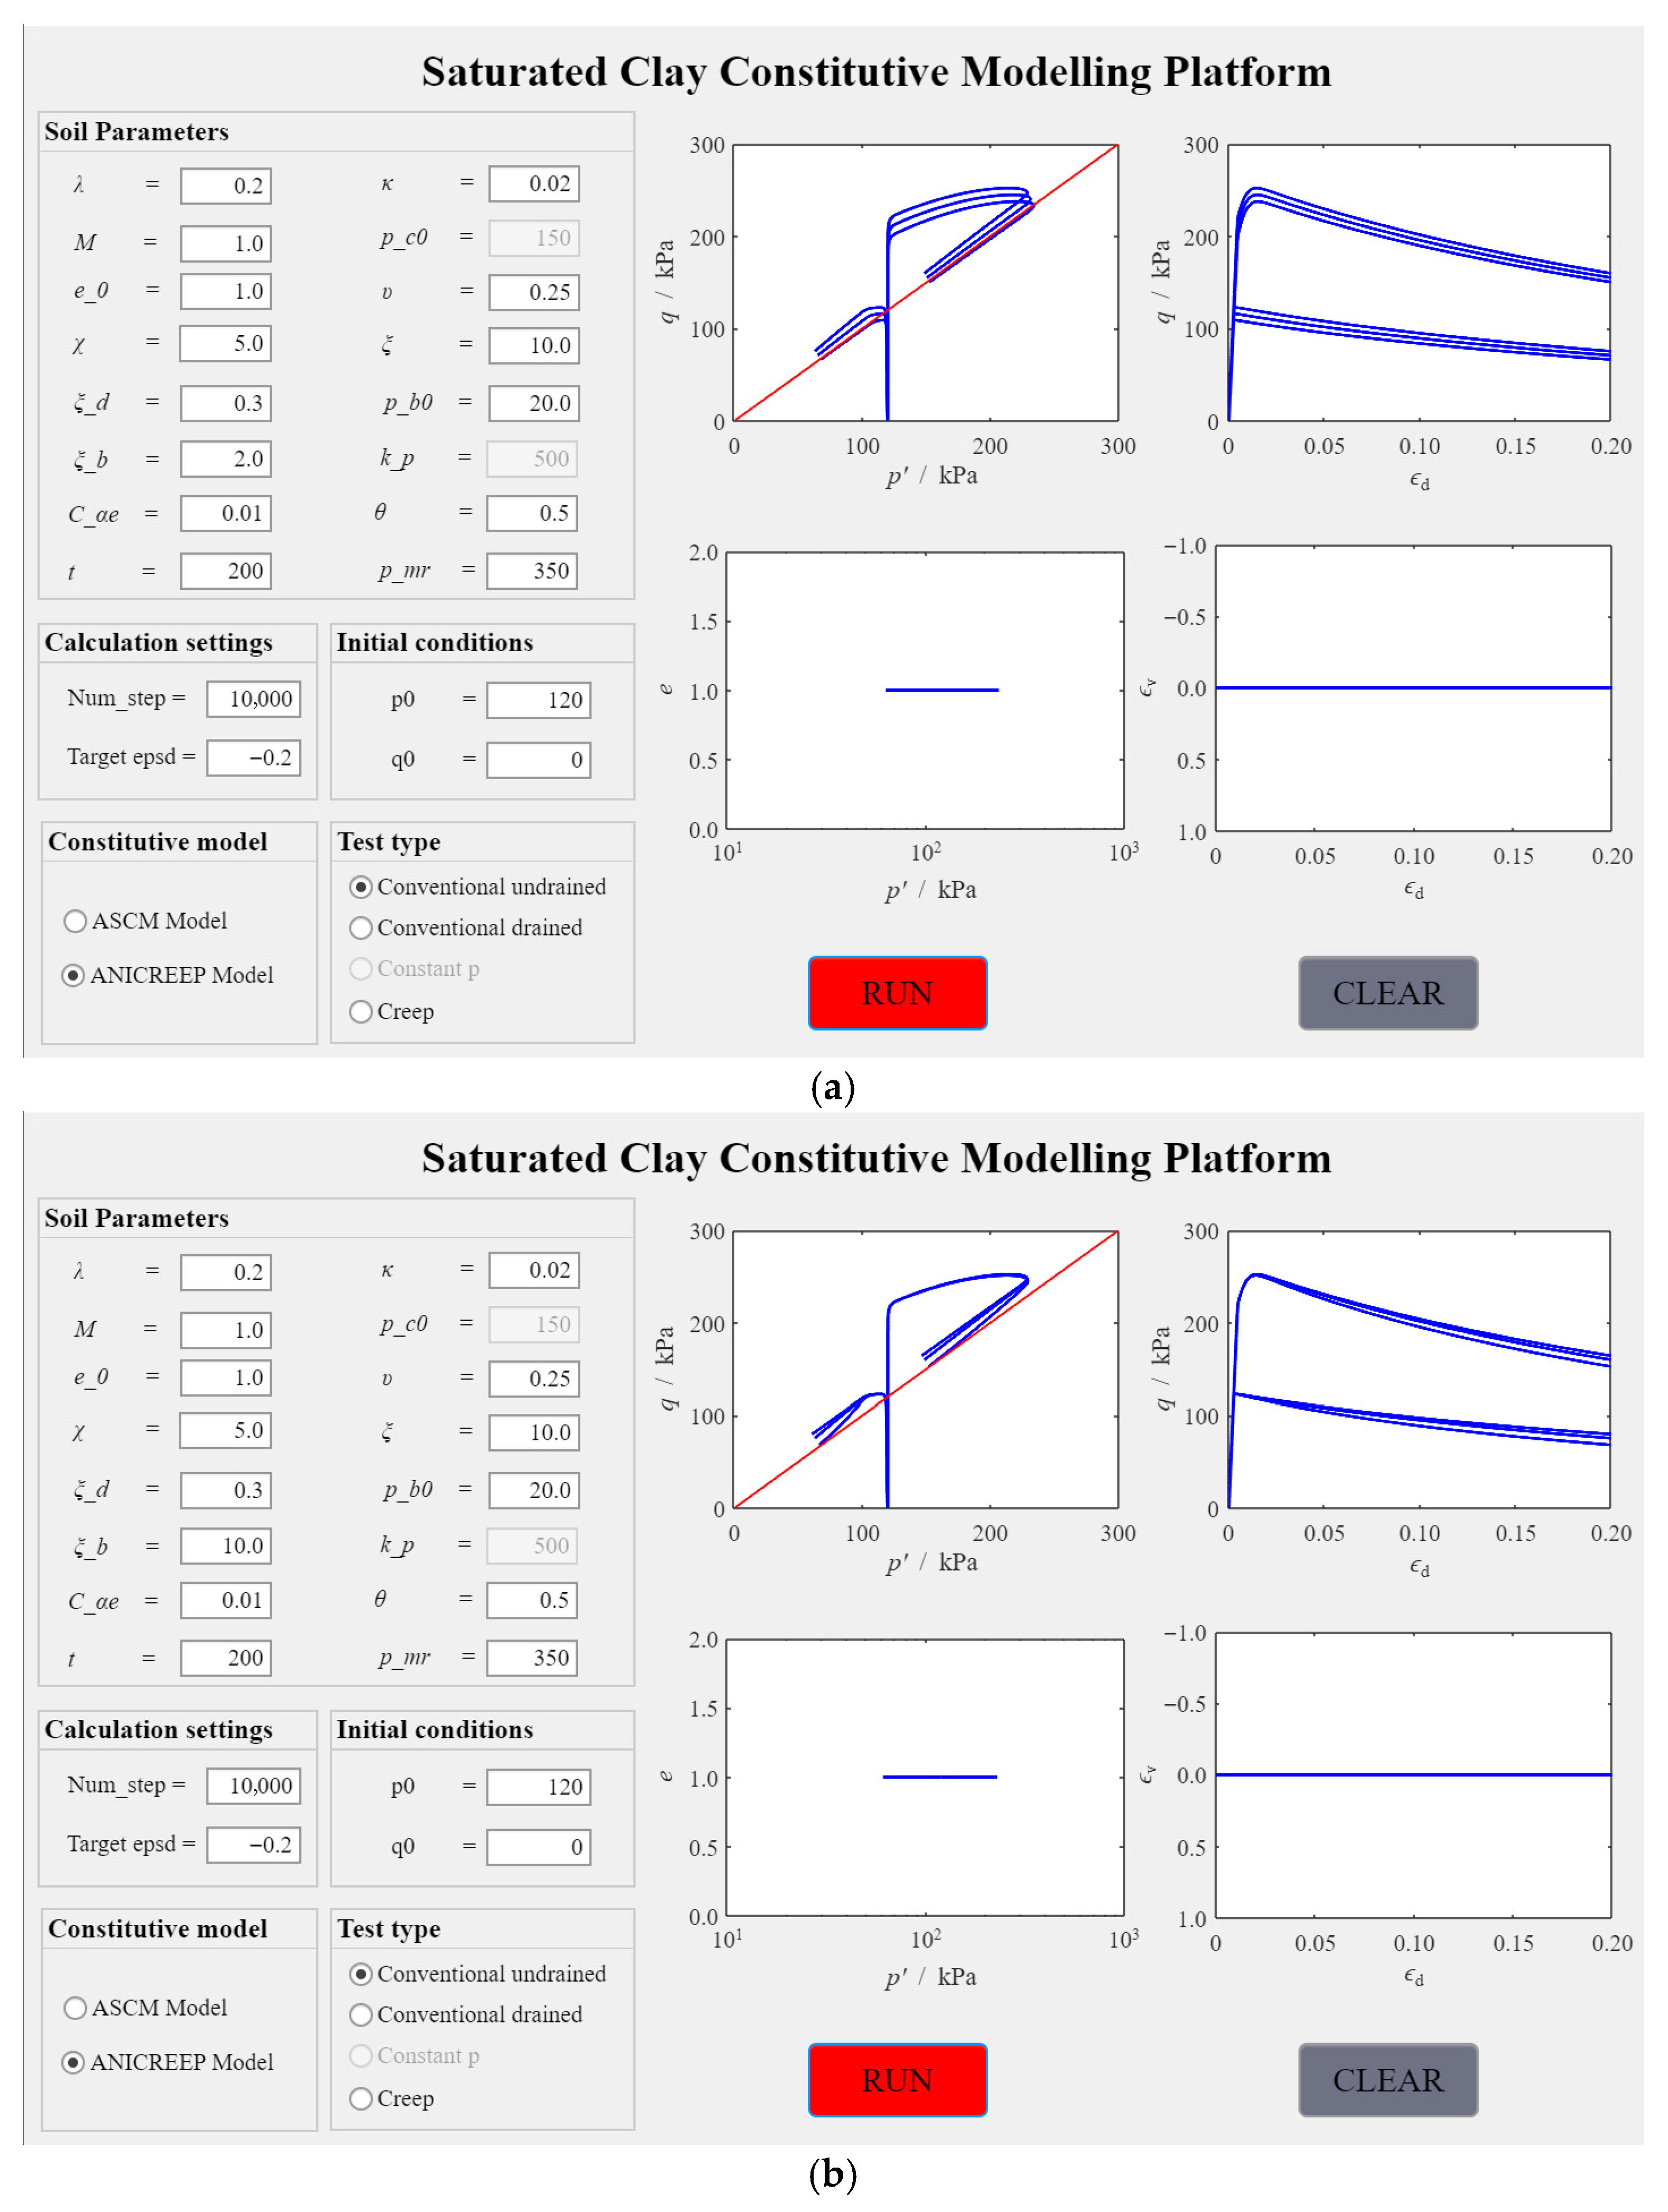
Similar to Case 1, this section analyzes the influence of soil parameters within the ANICREEP model. Figure 13a presents the influence of adhesive stress on soil behavior under undrained conditions and compares three initial adhesive stress conditions (pb0 = 0 kPa, 10 kPa, and 20 kPa). It can be observed that for the two initial reference yield surface sizes (pmr0 = 150 kPa and 350 kPa), an increase in the initial adhesive stress leads to a higher peak deviatoric stress q. Figure 13b compares the effect of three different values of the adhesive stress degradation rate control parameter (ξb = 0, 2, and 10) on soil properties when pb0 = 20 kPa. It can be seen that as ξb increases, the deviatoric stress q decreases more rapidly with the shear strain εd.
Figure 14a investigates the influence of bonding ratio on soil behavior under undrained conditions and compares three initial bonding ratio conditions (χ0 = 0, 5, and 10). It can be observed that for the two initial reference yield surface sizes (pmr0 = 150 kPa and 350 kPa), increasing the bonding ratio of the soil makes the soil show an initial high stiffness. However, the deviatoric stress q decreases significantly with the shear strain εd after reaching the peak value. Figure 14b compares the effect of the three conditions of bonding ratio degradation rate control parameter (ξ = 0, 10, and 20) on soil properties when χ0 = 5. It can be seen that as ξ increases, the deviatoric stress q decreases more rapidly with the shear strain εd.

5. Conclusions

This study addresses the challenges of traditional triaxial test teaching, specifically their high costs, poor environmental sustainability, and the lag in teaching constitutive models behind theoretical advancements. To overcome these limitations, a digital platform for triaxial testing instruction developed within the MATLAB environment was established. The platform not only integrates the ASCM model and the ANICREEP model but also encompasses four important testing conditions: undrained triaxial test, drained triaxial test, constant-p’ test, and creep test, thereby establishing a new technology suitable for engineering education.
The core advantages of this digital teaching platform lie in its high flexibility and intuitiveness, enabling it to support various teaching scenarios and experimental designs based on specific needs. It clearly demonstrates the stress–strain relationships and the evolution of key state variables for soils under different testing conditions. In this manner, the platform not only aids students in deeply understanding soil mechanical behavior but also presents the intrinsic principles of constitutive models in a more intuitive way, thereby alleviating the burden of complex mathematical derivations for students. Therefore, the platform is highly aligned with the teaching needs of triaxial tests in the undergraduate course “Soil Mechanics” and can effectively support the in-depth exploration of constitutive model theory in the graduate course “Numerical Computation in Geotechnical Engineering”. This cross-level teaching technology provides strong support for cultivating students’ theoretical comprehension and practical analytical skills. It truly realizes the deep integration of educational informatization and modernization in geotechnical engineering teaching, and pioneers an economical, sustainable, and innovative teaching paradigm.
Furthermore, the openness and extensibility of this digital teaching platform will further promote its application in broader fields. By incorporating more experimental conditions or constitutive models, the platform is expected to serve as a model for interdisciplinary teaching and inject new momentum into the in-depth implementation of the educational digitalization strategy. This technology has been successfully applied in relevant courses at Anhui Jianzhu University, receiving positive student feedback. The digital teaching platform was widely recognized by students for its intuitive operation and practical utility. It is considered to have effectively fostered the synergistic integration of self-directed and collaborative learning, thereby igniting students’ learning enthusiasm and academic exploratory potential. Integrating the platform into online course resources or faculty homepages can serve as a model for building an open and shared course resource system, advancing the implementation of the educational digitalization strategy, and facilitating the deep integration of information technology with education and teaching.

Author Contributions

Software, supervision, methodology, conceptualization and writing—original draft, J.L.; writing—original draft, and writing—review and editing, J.Z.; writing—review and editing, and validation, K.L. All authors have read and agreed to the published version of the manuscript.

Funding

This study was supported by the Anhui Provincial Higher Education Quality Engineering Project (Nos. 2023jyxm0411 and 2024aijy178), the Anhui Provincial Graduate Education Quality Engineering Project (No. 2024zyxwjxalk129), the University Natural Science Research Project of Anhui Province (No. 2022AH030035), and the Outstanding Talents Cultivation Project of Universities in Anhui (No. gxyq2022029).

Institutional Review Board Statement

Not applicable.

Data Availability Statement

The teaching platform and the data that support the findings of this study are available from the corresponding author upon reasonable request.

Conflicts of Interest

The authors declare no conflicts of interest.

References

  1. Ishibashi, I.; Hazarika, H. Soil Mechanics Fundamentals and Applications, 2nd ed.; CRC Press: Boca Raton, FL, USA, 2015. [Google Scholar]
  2. Terzaghi, K.; Peck, R.B.; Mesri, G. Soil Mechanics in Engineering Practice, 3rd ed.; John Wiley & Sons: Hoboken, NJ, USA, 1996. [Google Scholar]
  3. Lade, P.V. Triaxial Testing of Soils; John Wiley & Sons: Hoboken, NJ, USA, 2016. [Google Scholar]
  4. Das, B.M. Advanced Soil Mechanics, 5th ed.; CRC Press: Boca Raton, FL, USA, 2019. [Google Scholar]
  5. Wood, D.M. Soil Behaviour and Critical State Soil Mechanics; Cambridge University Press: Cambridge, UK, 1990. [Google Scholar]
  6. Yin, Z.Y.; Hicher, P.Y.; Jin, Y.F. Practice of Constitutive Modelling for Saturated Soils; Springer Nature: Berlin/Heidelberg, Germany, 2020. [Google Scholar]
  7. Roscoe, K.H.; Burland, J.B. On the generalized stress–strain behavior of wet clay. In Engineering Plasticity; Herman, J., Leckie, F.A., Eds.; Cambridge University Press: Cambridge, UK, 1968; pp. 535–609. [Google Scholar]
  8. Wheeler, S.J.; Näätänen, A.; Karstunen, M.; Lojander, M. An anisotropic elastoplastic model for soft clays. Can. Geotech. J. 2003, 40, 403–418. [Google Scholar] [CrossRef]
  9. Liu, M.D.; Carter, J.P. A structured Cam Clay model. Can. Geotech. J. 2002, 39, 1313–1332. [Google Scholar] [CrossRef]
  10. Huang, M.; Liu, Y.; Sheng, D. Simulation of yielding and stress–stain behavior of shanghai soft clay. Comput. Geotech. 2011, 38, 341–353. [Google Scholar] [CrossRef]
  11. Yang, J.; Yin, Z.Y.; Liu, X.F.; Gao, F.P. Numerical analysis for the role of soil properties to the load transfer in clay foundation due to the traffic load of the metro tunnel. Transp. Geotech. 2020, 23, 100336. [Google Scholar] [CrossRef]
  12. Liu, J.X.; Yang, J.; Liu, Y.J.; Zhu, S.; Laouafa, F. Numerical investigation of tunnelling effects on existing piles in structured clay. Eur. J. Environ. Civ. Eng. 2022, 26, 8502–8525. [Google Scholar] [CrossRef]
  13. Liu, J.X.; Yin, Z.Y.; Yang, J.; Zhu, S. Implementation of a bounding surface model of structured clays in FLAC3D and numerical simulation of tunnel construction. Chin. J. Rock Mech. Eng. 2020, 39, 1277–1286. [Google Scholar]
  14. Yin, J.H.; Zhu, J.G.; Graham, J. A new elastic viscoplastic model for time-dependent behaviour of normally and overconsolidated clays: Theory and verification. Can. Geotech. J. 2002, 39, 157–173. [Google Scholar] [CrossRef]
  15. Singh, A.; Mitchell, J.K. General stress-strain-time function for soils. J. Soil Mech. Found. Div. 1968, 94, 21–46. [Google Scholar] [CrossRef]
  16. Adachi, T.; Oka, F. Constitutive equations for normally consolidated clay based on elasto-viscoplasticity. Soils Found. 1982, 22, 57–70. [Google Scholar] [CrossRef] [PubMed]
  17. Desai, C.S.; Zhang, D. Viscoplastic model for geologic materials with generalized flow rule. Int. J. Numer. Anal. Methods Geomech. 1987, 11, 603–620. [Google Scholar] [CrossRef]
  18. Fodil, A.; Aloulou, W.; Hicher, P.Y. Viscoplastic behaviour of soft clay. Géotechnique 1997, 47, 581–591. [Google Scholar] [CrossRef]
  19. Zhou, C.; Yin, J.H.; Zhu, J.G.; Cheng, C.M. Elastic anisotropic viscoplastic modeling of the strain-rate-dependent stress–strain behavior of K0-consolidated natural marine clays in triaxial shear tests. Int. J. Geomech. 2005, 5, 218–232. [Google Scholar] [CrossRef]
  20. Yin, Z.Y.; Chang, C.S.; Karstunen, M.; Hicher, P.Y. An anisotropic elastic–viscoplastic model for soft clays. Int. J. Solids Struct. 2010, 47, 665–677. [Google Scholar] [CrossRef]
  21. Yin, Z.Y.; Karstunen, M.; Chang, C.S.; Koskinen, M.; Lojander, M. Modeling time-dependent behavior of soft sensitive clay. J. Geotech. Geoenviron. Eng. 2011, 137, 1103–1113. [Google Scholar] [CrossRef]
  22. Yin, Z.Y.; Wu, Z.X.; Hicher, P.Y. Modeling monotonic and cyclic behavior of granular materials by exponential constitutive function. J. Eng. Mech. 2018, 144, 04018014. [Google Scholar] [CrossRef]
  23. Papon, A.; Riou, Y.; Dano, C.; Hicher, P.Y. Single-and multi-objective genetic algorithm optimization for identifying soil parameters. Int. J. Numer. Anal. Methods Geomech. 2012, 36, 597–618. [Google Scholar] [CrossRef]
  24. Knabe, T.; Datcheva, M.; Lahmer, T.; Cotecchia, F.; Schanz, T. Identification of constitutive parameters of soil using an optimization strategy and statistical analysis. Comput. Geotech. 2013, 49, 143–157. [Google Scholar] [CrossRef]
  25. Yin, Z.Y.; Jin, Y.F.; Shen, S.L.; Huang, H.W. An efficient optimization method for identifying parameters of soft structured clay by an enhanced genetic algorithm and elastic–viscoplastic model. Acta Geotech. 2017, 12, 849–867. [Google Scholar] [CrossRef]
  26. Jin, Y.F.; Yin, Z.Y.; Shen, S.L.; Hicher, P.Y. Selection of sand models and identification of parameters using an enhanced genetic algorithm. Int. J. Numer. Anal. Methods Geomech. 2016, 40, 1219–1240. [Google Scholar] [CrossRef]
  27. Jin, Y.F.; Wu, Z.X.; Yin, Z.Y.; Shen, J.S. Estimation of critical state-related formula in advanced constitutive modeling of granular material. Acta Geotech. 2017, 12, 1329–1351. [Google Scholar] [CrossRef]
  28. Jin, Y.F.; Yin, Z.Y.; Shen, S.L.; Zhang, D.M. A new hybrid real-coded genetic algorithm and its application to parameters identification of soils. Inverse Probl. Sci. Eng. 2017, 25, 1343–1366. [Google Scholar] [CrossRef]
  29. Yin, Z.Y.; Jin, Y.F.; Shen, J.S.; Hicher, P.Y. Optimization techniques for identifying soil parameters in geotechnical engineering: Comparative study and enhancement. Int. J. Numer. Anal. Methods Geomech. 2018, 42, 70–94. [Google Scholar] [CrossRef]
  30. Jin, Y.F.; Yin, Z.Y.; Zhou, W.H.; Horpibulsuk, S. Identifying parameters of advanced soil models using an enhanced transitional Markov chain Monte Carlo method. Acta Geotech. 2019, 14, 1925–1947. [Google Scholar] [CrossRef]
  31. Yang, J.; Jin, Y.F.; Yin, Z.Y.; Laouafa, F.; Hicher, P.Y. Identifying the parameters of a hydro-mechanical model for internal erosion occurring in granular soils by using an enhanced backtracking search algorithm. Eur. J. Environ. Civ. Eng. 2023, 27, 2325–2344. [Google Scholar] [CrossRef]
  32. Chen, J.F.; Chen, B.C.; Shi, Z.M.; Shen, M.R. Digital teaching platform for rock underground engineering. J. Archit. Educ. Inst. High. Learn. 2014, 23, 142–146. [Google Scholar]
  33. Meng, L.B.; Chen, H.Q.; Li, T.B.; Yin, H.Y. Application of PFC numerical simulation method in experimental teaching of rock mechanics. Exp. Technol. Manag. 2018, 35, 178–180+220. [Google Scholar]
  34. Xiao, Z.Q.; Chang, Y.B.; Lyu, Z.T.; Wang, H.; Wang, F.Q.; Deng, M.H.; Li, P.Y.; Zheng, Y.P. Application of particle flow numerical analysis software in experimental teaching of rock mechanics. Exp. Technol. Manag. 2023, 40, 199–205. [Google Scholar]
  35. Kadlíček, T.; Janda, T.; Šejnoha, M.; Mašín, D.; Najser, J.; Beneš, Š. Automated calibration of advanced soil constitutive models. Part I: Hypoplastic sand. Acta Geotech. 2022, 17, 3421–3438. [Google Scholar] [CrossRef]
  36. Kadlíček, T.; Janda, T.; Šejnoha, M.; Mašín, D.; Najser, J.; Beneš, Š. Automated calibration of advanced soil constitutive models. Part II: Hypoplastic clay and modified Cam-Clay. Acta Geotech. 2022, 17, 3439–3462. [Google Scholar] [CrossRef]
  37. Brinkgreve, R.B.J.; Kumarswamy, S.; Swolfs, W.M.; Foria, F. Material Model Manual; Plaxis BV: Delft, The Netherlands, 2018. [Google Scholar]
  38. Yin, Z.Y.; Teng, J.C.; Wang, H.L.; Jin, Y.F. A MATLAB-based educational platform for analysis of slope stability. Comput. Appl. Eng. Educ. 2022, 30, 575–588. [Google Scholar] [CrossRef]
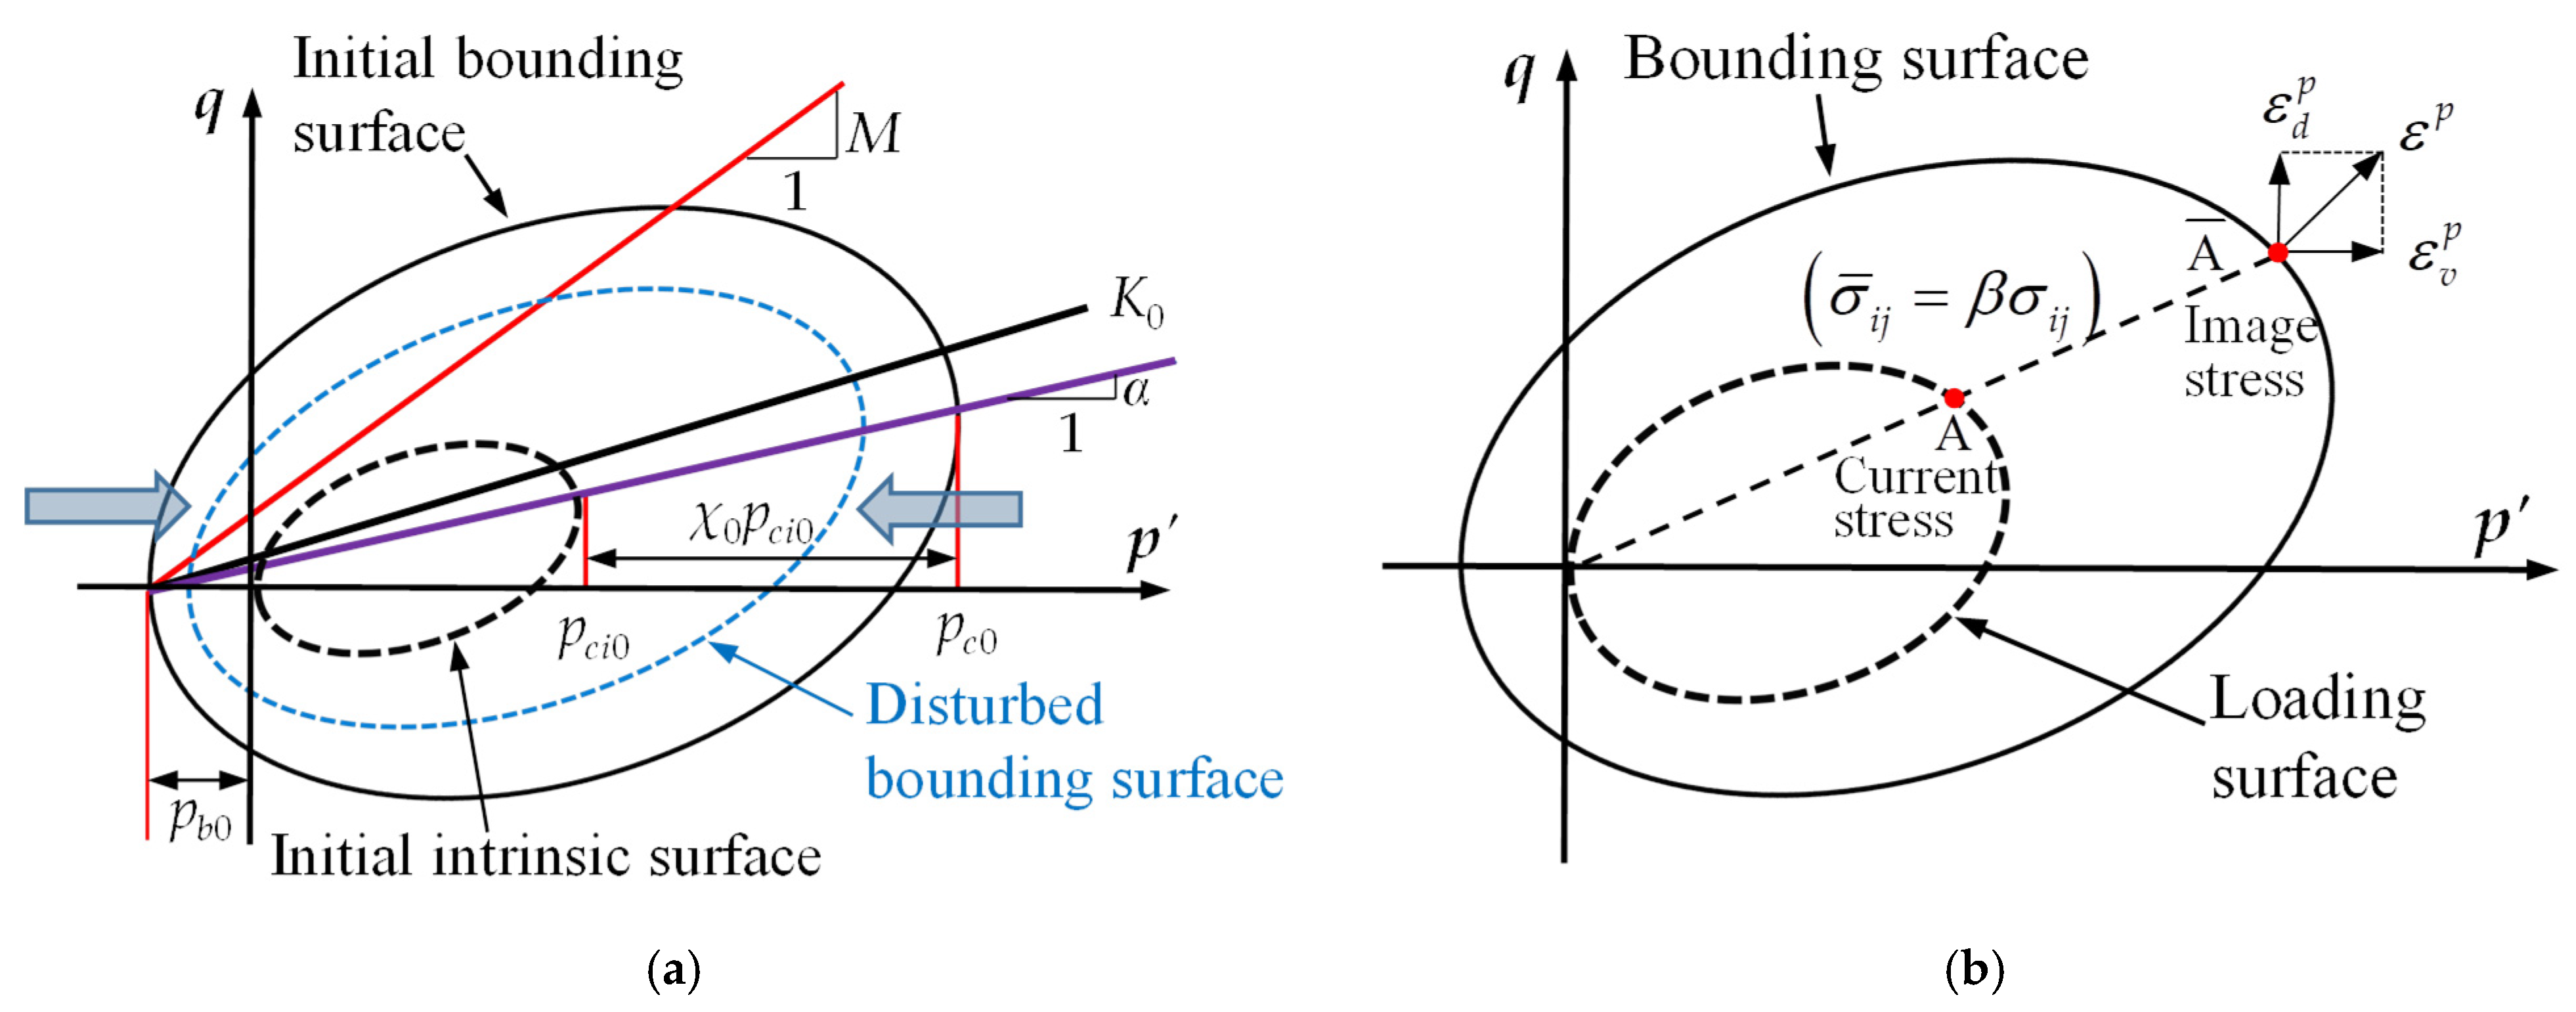
Figure 1. Schematic plot for the principle of the ASCM model: (a) Different surfaces: p′: mean effective stress; q: deviatoric stress; pc0: initial size of the bounding surface; pb0: initial adhesive stress; χ0: initial bonding ratio; pci0: initial size of the intrinsic surface; M: slope of the critical state line; K0: coefficient of earth pressure at rest; α: inclination of the yield surface. (b) Mapping rule of bounding surface concept: β: mapping coefficient that relates the current stress σij to the stress at bounding surface σ ¯ i j ε v p ,     ε d p : plastic volumetric strain and deviatoric strain, respectively.
Technologies 13 00381 g001
Figure 2. Schematic plot for the principle of the ANICREEP model: p: mean effective stress; q: deviatoric stress; pmi: size of the intrinsic surface; pmr: size of the reference surface; pmd: size of the dynamic loading surface; pb: adhesive stress; χ: bonding ratio; M: slope of the critical state line; α: inclination of the yield surface.
Technologies 13 00381 g002
Figure 3. MATLAB App designer interface.
Technologies 13 00381 g003
Figure 4. The default interface for data input and results output. (a) Data input module; (b) axes output interface.
Technologies 13 00381 g004
Figure 5. Parameter input and test types under different constitutive models. (a) ASCM model; (b) ANICREEP model.
Technologies 13 00381 g005
Figure 6. The default interface of the digital teaching platform.
Technologies 13 00381 g006
Figure 7. Simulation results under different test conditions. (a) Undrained test simulations (pc0 = 150 kPa and 350 kPa); (b) drained test simulations (pc0 = 150 kPa and 350 kPa); (c) constant-p’ test simulations (pc0 = 150 kPa and 350 kPa).
Technologies 13 00381 g007aTechnologies 13 00381 g007b
Figure 8. Influence of adhesive stress on soil properties under undrained conditions using the ASCM model. (a) Influence of adhesive stress (pb0 = 0 kPa, 10 kPa, and 20 kPa); (b) influence of the adhesive stress degradation rate control parameter (pb0 = 20 kPa, ξb = 0, 2, and 10).
Technologies 13 00381 g008aTechnologies 13 00381 g008b
Figure 9. Influence of bonding ratio on soil properties under undrained conditions using the ASCM model. (a) Influence of bonding ratio (χ0 = 0, 5, and 10); (b) influence of bonding ratio degradation rate control parameter (χ0 = 5, ξ = 0, 10, and 20).
Technologies 13 00381 g009aTechnologies 13 00381 g009b
Figure 10. Undrained triaxial test (t = 2 h, 20 h, and 200 h).
Technologies 13 00381 g010
Figure 11. Drained triaxial test (t = 2 h, 20 h, and 200 h).
Technologies 13 00381 g011
Figure 12. Creep test (q0 = 70 kPa, 80 kPa, and 90 kPa).
Technologies 13 00381 g012
Figure 13. Influence of adhesive stress on soil properties under undrained conditions using the ANICREEP model. (a) Influence of adhesive stress (pb0 = 0 kPa, 10 kPa, and 20 kPa); (b) influence of the adhesive stress degradation rate control parameter (pb0 = 20 kPa, ξb = 0, 2, and 10).
Technologies 13 00381 g013
Figure 14. Influence of bonding ratio on soil properties under undrained conditions using the ANICREEP model. (a) Influence of bonding ratio (χ0 = 0, 5, and 10); (b) influence of bonding ratio degradation rate control parameter (χ0 = 5, ξ = 0, 10, and 20).
Technologies 13 00381 g014
Table 1. Hardening and flow rule of the ASCM model [6,11,12,13].
Components.Constitutive Equations
Hardening Rule δ p c i = p c i 1 + e 0 λ κ δ ε v p
δ α = ω 3 q 4 ( p + p b ) α δ ε v p + ω d q 3 ( p + p b ) α δ ε d p
δ χ = χ ξ | δ ε v p | + ξ d δ ε d p
δ p b = p b ξ b δ ε d p
Flow Rule δ ε i j p = δ λ G σ i j
Table 2. Parameters of the ASCM model [6,11,12,13].
ParametersDefinitions
λIntrinsic compression index (of remolded soil)
κIntrinsic swelling index (of remolded soil)
MSlope of the critical state line in the p′-q plane
pc0Initial size of the bounding surface
e0Initial void ratio
υPoisson’s ratio
χ0Initial bonding ratio
ξDegradation rate of the bonding ratio related to the plastic strain
ξdDegradation rate of the bonding ratio related to the plastic deviatoric strain
pb0Initial adhesive stress
ξbDegradation rate of the adhesive stress
kpPlastic modulus-related parameter in the bounding surface
Table 3. Basic equations of the ANICREEP model [21].
ComponentsConstitutive Equations
Dynamic loading surface f d = q p + p b α 2 M 2 α 2 p + p b + p p m d with   p m d = q p + p b α 2 M 2 α 2 p + p b + p
Reference surface f r = q r p r + p b α 2 M 2 α 2 p r + p b + p r p m r with   p m r = 1 + χ p m i
Hardening rule δ p m i = p m i 1 + e 0 λ κ δ ε v v p
δ α = ω 3 q 4 ( p + p b ) α δ ε v v p + ω d q 3 ( p + p b ) α δ ε d v p
δ χ = χ ξ δ ε v v p + ξ d δ ε d v p
δ p b = p b ξ b δ ε d v p
Table 4. Parameters of the ANICREEP model [21].
ParametersDefinitions
λIntrinsic compression index (of remolded soil)
κIntrinsic swelling index (of remolded soil)
MSlope of the critical state line in the p′-q plane
pmr0Initial size of the reference yield surface
e0Initial void ratio
υPoisson’s ratio
χ0Initial bonding ratio
ξDegradation rate of the bonding ratio related to the plastic strain
ξdDegradation rate of the bonding ratio related to the plastic deviatoric strain
pb0Initial adhesive stress
ξbDegradation rate of the adhesive stress
CαeSecondary compression coefficient
Disclaimer/Publisher’s Note: The statements, opinions and data contained in all publications are solely those of the individual author(s) and contributor(s) and not of MDPI and/or the editor(s). MDPI and/or the editor(s) disclaim responsibility for any injury to people or property resulting from any ideas, methods, instructions or products referred to in the content.